1. Introduction
Following the adoption of the Paris Agreement in 2015, Europe committed to reducing greenhouse gas emissions, prompting several countries to initiate plans for a gradual phase-out of coal mining. This trend is expected to accelerate in the coming years, making it essential to anticipate and manage the residual risks associated with the closure of thousands of mines (in countries such as Germany, Belgium, Croatia, Denmark, France, Italy, Luxembourg, the Netherlands, Slovenia, Czechia, and others) [
1]. Poland, for instance, has set a target of closing its coal mines by 2050, while Germany aims for 2030.
National regulations already exist in most European countries to oversee the closure of mining operations and to mitigate the resulting risks and nuisances affecting populations and the environment. These regulations address issues such as land stability (mining subsidence or localized collapses), groundwater rise and quality, gas emissions, and the rehabilitation of sites once mining activities have ceased [
2,
3,
4,
5].
While it has been recognized since the late 19th century that active mining can induce earthquakes [
6], the phenomenon of post-mining seismicity remains insufficiently investigated. At present, the assessment and management of seismic hazards after mine closure are poorly integrated, if at all, into public policy frameworks [
1].
Nonetheless, it is well established that mining activities create voids underground, disturbing the natural hydromechanical equilibrium of the rock mass. During the closure phase, the cessation of dewatering leads to the gradual flooding of underground workings, increasing hydraulic pressure and, over time, pore pressure within the rock. Even once the voids are fully flooded—a process that can take years—groundwater levels may continue to fluctuate seasonally or due to changes in artificial pumping. These ongoing variations cause shifts in the stress field of the rock mass, which under certain conditions can reactivate faults, potentially resulting in earthquakes that are felt at the surface and capable of causing damage to buildings and infrastructure [
6].
There are limited examples of post-mining seismic activity documented in the literature (e.g., [
7,
8]), despite the occurrence of fluid-induced seismicity being observed in other industrial sectors [
6]. One notable case of post-mining seismicity is found in Stilfontein, South African Republic. On 9 March 2005, a seismic event with a magnitude of 5.3 occurred, which was attributed to the reactivation of a pre-existing major fault [
9]. This reactivation was likely triggered by the flooding of nearby abandoned mine workings, allowing water migration towards the fault plane, ultimately resulting in the earthquake. The incident caused significant damage to the surface, leading to the partial destruction of numerous buildings, injuries to dozens of individuals, and the unfortunate loss of two miners in the active mine located nearby.
In France, regulations for managing post-mining risks have primarily focused on anticipating surface ground movements caused by the collapse of underground galleries and pillars following mine closures and subsequent flooding [
3,
10]. This regulatory focus emerged after several collapses, sometimes sudden, occurred in the Lorraine region during the 1990s. To address this risk, microseismic monitoring systems were implemented. Their main purpose is to detect early signs of underground instabilities that could indicate the imminence of a mine collapse before any surface impact occurs and poses a threat to the exposed populations [
11,
12].
However, over time, these monitoring systems have revealed an unexpected and more persistent phenomenon: post-mining seismicity linked to fluctuations in groundwater levels. This phenomenon has been particularly observed in the former Gardanne coal basin [
13,
14,
15,
16] where nearly 4000 microseismic events have been recorded since 2008, ranging in magnitude from −3 to 3, despite the absence of any surface ground collapse. This post-mining seismicity is driven by changes in interstitial pressure within the rock mass, which influence the mechanical stability of pre-existing faults. These processes can trigger diffuse, repetitive, and occasionally intense seismic activity, sometimes felt by local populations.
Post-mining seismicity resulting from fault reactivation is a complex phenomenon that remains poorly understood and under-researched. As a result, it is clearly overlooked in public policy, despite its significant implications for land use planning in the concerned areas. The absence of an action framework to address post-mining seismicity clearly also has consequences for the safety of exposed populations. Thus, the central question explored in this study aims to understand how mine flooding influences seismic activity over time and across the Gardanne basin. The objective is to shed new light on the data collected since 2008 and to identify additional works needed to better manage and mitigate the risk of post-mining seismicity.
This paper presents a retrospective analysis of post-mining seismicity management efforts since 2008, highlighting key lessons learned. The relationship between mine flooding and post-mining seismicity is investigated by analyzing the historical data from microseismic monitoring conducted in the former Gardanne coalfield. We aim to provide insights into the emergence of post-mining seismic events, with a specific focus on the poorly understood role of flooding. The article also outlines the main technical and scientific challenges associated with monitoring and managing these seismic phenomena.
This paper begins by outlining the post-mining context in France, followed by a focus on the case study of the disused coal basin of Gardanne. We then present the initial strategy adopted for deploying the microseismic monitoring network, along with the methods used for data processing and analysis, as well as the alarm procedure in case of abnormal seismic activity. After presenting and discussing the results, we explore the possible origins of the unexpected seismicity observed in the area, considering its potential link to variations in groundwater levels. Emphasis is placed on the idea that the seismicity is not solely caused by potential underground mine failures but also by the reactivation of faults by the flooding. This work was conducted in collaboration with the BRGM as part of the European RFCS PostMinQuake project [
17].
2. Post-Mining Context in France
In France, the initial mining laws of 1791 established the principle that the underground resources belong to the nation. The exploitation of these resources is governed by a Mining Code, which has undergone few changes since 1810, except for updates related to the opening, operation, and closure of mine works driven by a growing awareness of safety and environmental concerns. These updates have imposed additional obligations on mining companies.
With the decline of the mining industry in France in the early 1990s, mine closure operations commenced. Various issues quickly emerged, including dangerous gas emissions, alterations in water flow, and ground surface instability resulting from mine flooding. The Lorraine iron ore basin experienced large-scale disturbances such as subsidence and sinkholes, causing significant consequences for individuals, activities, and property. These occurrences prompted French authorities to strengthen the legal procedures for mine closure with the objective of securing mining sites and minimizing their long-term impact on the environment [
10]. The law enacted in 1999 also incorporates the concept of land rehabilitation and management, particularly in situations where the mining operator ceases to exist or fails. In such circumstances, the state assumes responsibility for addressing potential issues arising from abandoned mine workings.
Following this important incident, two groups were created in 1999: the GEODERIS (public interest group for the management of risks linked to mining) and GISOS (scientific interest group on underground works). GEODERIS is a public interest group (GIP) whose main mission is to assess and manage post-mining risks, i.e., risks following the closure of mining operations. It operates throughout France. This group is composed of members of the BRGM and Ineris, French institutions. This group is still active today.
GISOS is a scientific interest group that brings together laboratories, manufacturers and academic institutions. Unlike GEODERIS, which is mainly focused on post-mining risk management, GISOS focuses on scientific research around underground structures, including those related to former mining activities. This group no longer exists today.
In 2006, a specific department was created within the BRGM (French Geological Survey) to manage, on behalf of the State, post-mining risks as identified by GEODERIS. This department, now a specific direction, is still active today.
At the beginning of the 2000s, specific scientific tools were developed to address hazards and risks associated with mine closure and abandonment [
18]. A risk assessment methodology has been established to evaluate various hazards, determine their levels (low, medium, or high), and implement risk management strategies. The primary residual mining hazards include ground movement, gas emissions, water issues, and environmental concerns. Mitigation measures, including monitoring of critical zones, have been implemented. Microseismic monitoring plays a crucial role in the strategy for mitigating post-mining ground movement risks in France: in addition to the Gardanne basin, numerous networks have been deployed to monitor abandoned mine workings situated beneath inhabited areas in the iron ore basin of Lorraine, east of France [
11,
12].
3. Review of the Influence of the Water in Earthquake Triggering
The flooding of the mine workings and thus the presence of water is the key factor that distinguishes the state of the mine during its operation from its state after closure. Indeed, water plays a major role in triggering natural and man-made earthquakes. This mechanism is relatively well known in industrial fields where fluids are involved in subsurface exploitation, such as deep geothermal energy; conventional and unconventional hydrocarbon exploitation and gas storage; CO
2 sequestration; saline extraction; wastewater sequestration; dam filling; and more [
6].
In the post-mining context, when the mine is closed, groundwater typically floods the mine by stopping the pumping of mine water. The water then fills the mine voids from the deepest underground levels to a level often maintained by pumping to control the rise in the water table. This is the case in Gardanne and other European basins [
1]. This rise in water level leads to changes in effective stresses, already modified by mining, both by (1) the gravity load due to the water column load and (2) an increase by diffusion of the pore pressure in the rock mass.
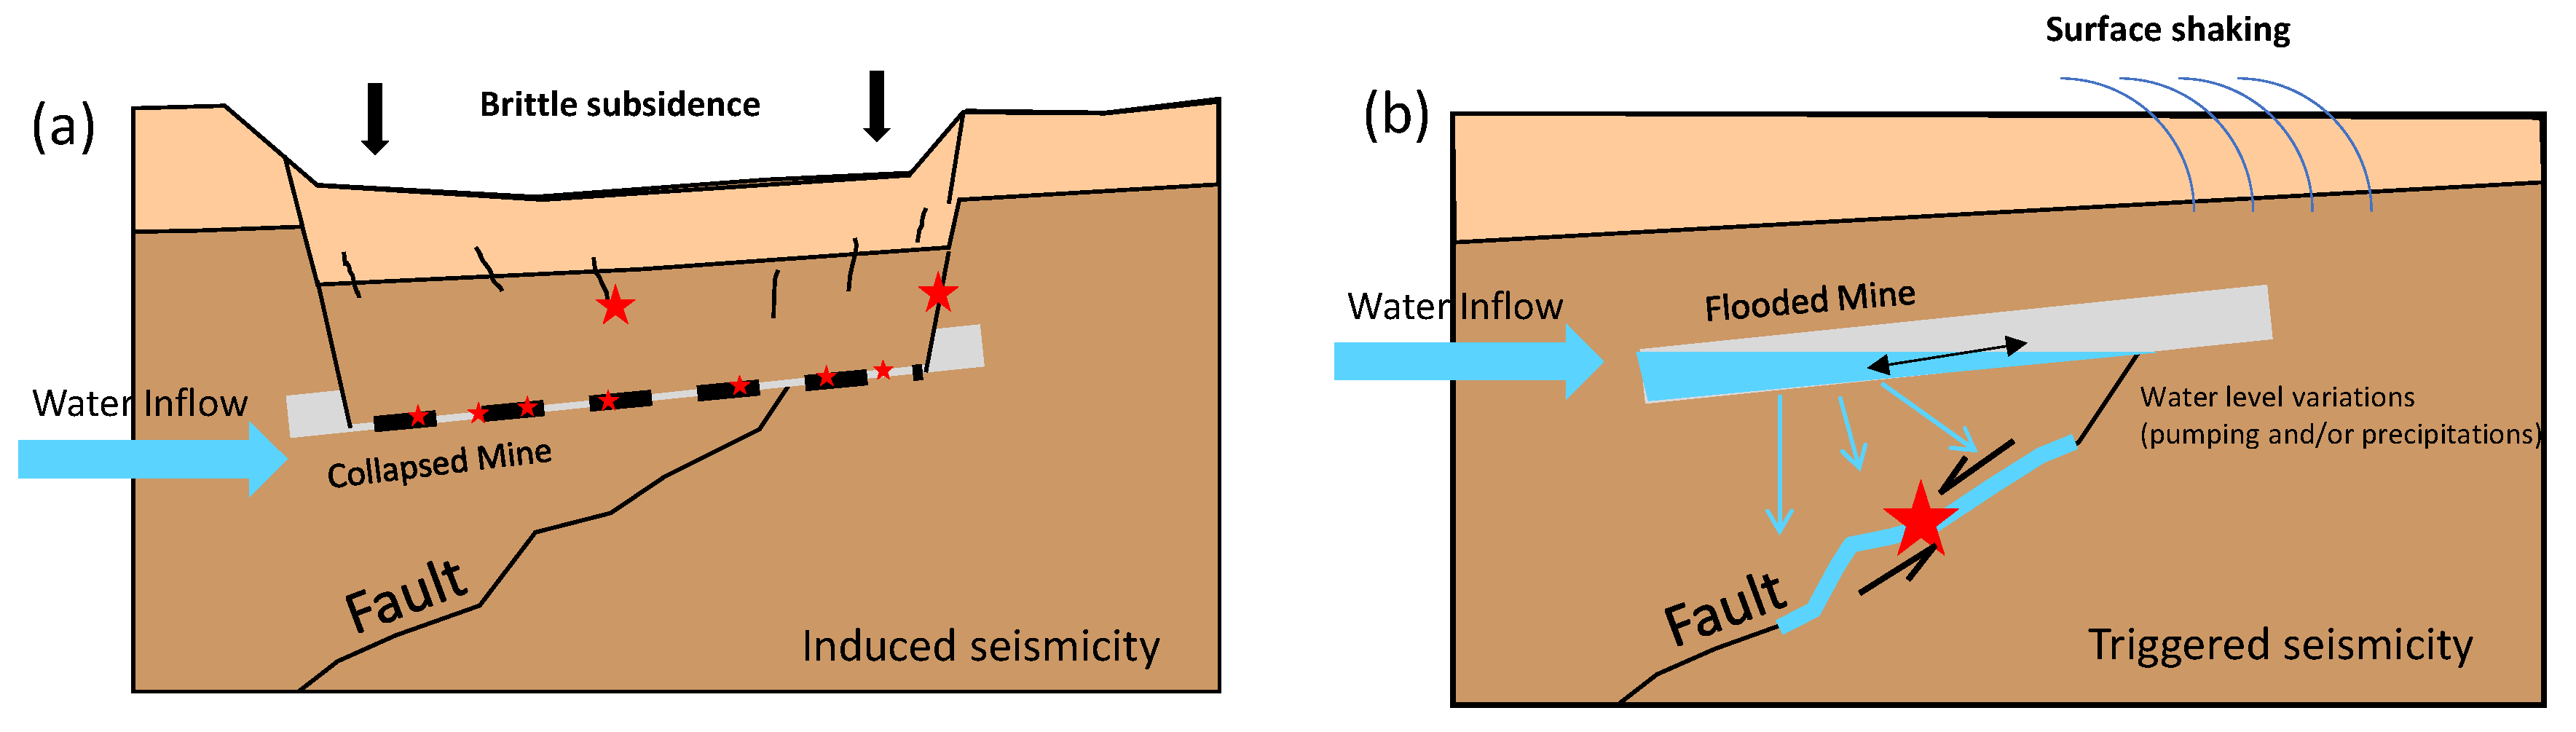
In this context, the following two types of seismicity might be observed [
14]:
The first, called “induced”, can be associated with the readjustments of the mining structures (
Figure 1—hypothesis a) or with their mechanical degradation. This seismicity is generally of low magnitude and appears after flooding;
The second (
Figure 1—hypothesis b), called “triggered”, is associated with the remobilization of a fault or several pre-existing faults and can be of greater magnitude, particularly in the presence of fluids.
Note that the first—induced seismicity—is limited in time (i.e., once the mining structures are crushed/collapsed, they have reached geomechanical equilibrium), while the second—triggered seismicity—can last longer, as long as pressure changes affect the faults.
Triggered seismicity is created by an increase in fluid pressure on a fault plane (
Figure 1—hypothesis b). This phenomenon is responsible for the decrease in shear strength, thus promoting slip on the fault plane. This process is possible when a fault is in a state of near-critical stability, favorably oriented with respect to the regional or induced stress field, and is impacted by the increase in fluid pressure. This seismicity can appear several months or years after flooding [
14,
19]. It can also appear repeatedly depending on variations in the water table level [
13,
14,
16].
4. Geological Mining and Hydrogeological Context in the Gardanne Basin
4.1. Geological and Mining Context
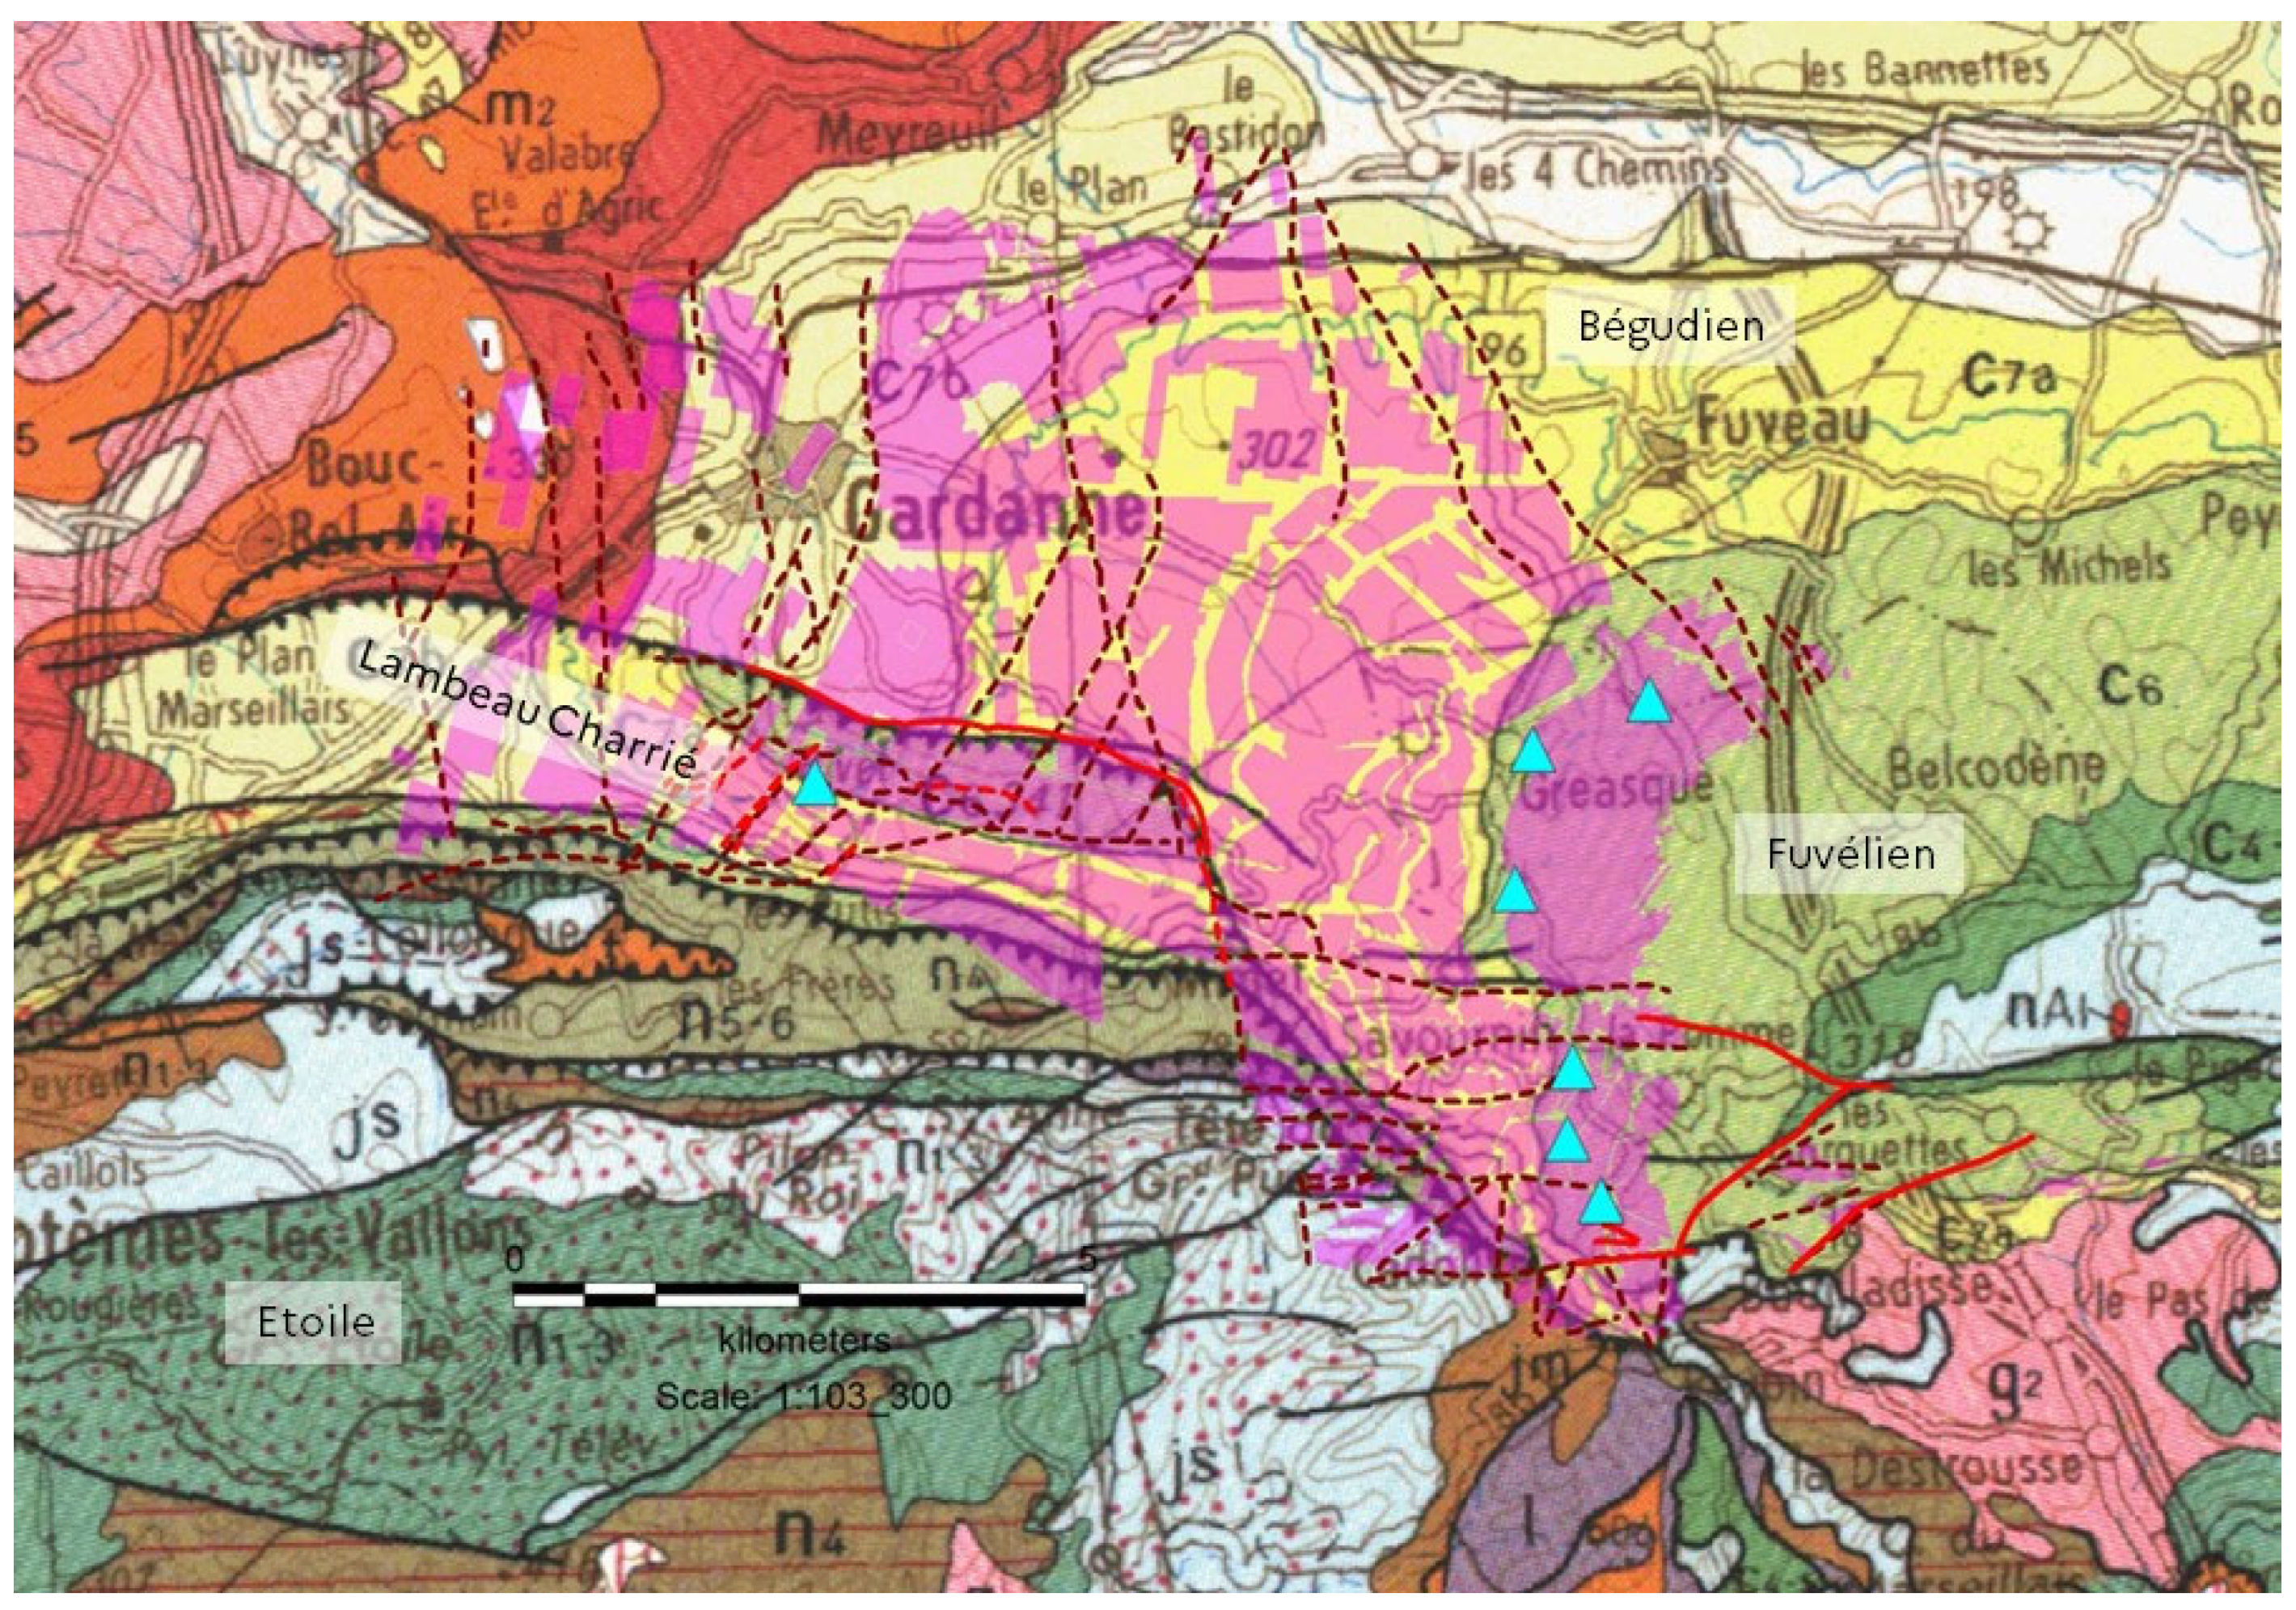
The Gardanne basin, located in Provence, was one of the three largest coalfields in France that were extensively exploited. Situated near the city of Marseille, it spans over 70 km from east to west and over 15 km from north to south (
Figure 2). Coal mining operations took place in this basin from the 15th century until the early 2000s, reaching depths of up to 1400 m.
This coal basin is an asymmetrical syncline that has undergone slight deformation, despite the presence of transverse faults. Its boundaries consist of structures where limestone formations from the Jurassic and Cretaceous periods are exposed due to two overlapping geological events: the formation of the Sainte-Victoire mountain in the northeast and the Etoile massif (known as “lambeau charrié”) in the south (
Figure 2). Between these two geological structures, the Arc basin series contains the autochthonous deposit.
The mine was operated by the Houillères du Bassin du Centre et du Midi (HBCM) until 2003. The mining operations spanned over an area of more than 60 square kilometers. The coal layers that were extracted are interbedded within the Fuvelian limestones of the Upper Cretaceous period. Four layers of lignite, present throughout the basin, were excavated and are named from bottom to top as follows: “Grande Mine” (with a thickness ranging from 2.5 to 4 m), “Mauvaise Mine” (with a thickness ranging from 0.7 to 1.7 m), “4 Pans” (with a thickness ranging from 1.2 to 2 m), and “Gros Rocher” (with a thickness ranging from 1 to 1.2 m) (
Figure 2). Among these layers, the “Grande Mine” (GM) layer, which is more continuous and thicker, was the most extensively exploited (
Figure 2). Since the 15th century and the closure of the mine, the total production has amounted to approximately 150 million tons. With over 500 km of tunnels and levels exploited to over 1350 m depth, the Gardanne mine is the first mining area in southeastern France.
Like all mining regions with a long history, the mining methods employed in the Provence basin have evolved over time. This basin stands out for its rich variety of extraction techniques, including room and pillar methods, as well as longwall extraction. Throughout its industrial period of operation, the Provence coal mine experienced significant microseismic activity, as well as numerous rockbursts, rock failures, and seismic events, some of which were locally felt by nearby residents [
20,
21]. To monitor such activities, a microseismic network was established and operated between 1994 and 2002, recording the mining-related seismic events. This network was dismantled after the cessation of mining activities.
The Provence basin is affected by many faults. There are three principal faults passing nearby the exploited zone (
Figure 2). The Diote fault, located at the south of the mining zone, is the only one that influenced the coal seam continuity. Otherwise, the faults Etoile and Safre have an effect only on the upper formations (i.e., Fuvelian).
This region is marked out by the passage of the destructive earthquakes in the cities of Avignon (1769), Carpentras (1738), Beaumont de Pertuis (1812), Manosque (1708), Chasteuil (1855, 1951) and Lambesc (1227, 1909) [
22]. On 19 February 1984, the western Provence (France) was struck by a magnitude 4.5 seismic event [
22]. Largely felt from Nice to Montpellier, it was the biggest earthquake that occurred in this area since the destructive one of Lambesc in 1909. This earthquake is supposed to have been triggered by the mining exploitation [
23]. Provence is thus considered to be one of the areas most exposed to seismic hazard in mainland France.
4.2. Hydrogeological Overview
The studies conducted by Chalumeau (2000) and Gaviglio (1987) [
24,
25] show that water inflows in the mining basin are controlled by fracturing and the tectonic regime, which influence water entry. Chalumeau identifies a geomorphological anomaly called “Gouste Soulet”, which separates two areas: an aquifer zone in the east, sensitive to water inflows, and a dry zone in the west. The water mainly comes from natural aquifers (Fuvelian and Jurassic), enhanced by karstic phenomena. During mining operations, water inflows accounted for about two-thirds of the water pumped, preventing the expansion of the mine towards the east.
Mining operations have led to the creation of aquifer reservoirs formed by mining voids. These reservoirs are partially filled by precipitation on the Fuvelian outcrops, infiltrations from the Etoile massif, and water circulation through karstic limestone. During mining operations, water inflows represented approximately 2/3 of the water pumped and prevented the expansion of the mine towards the east.
To address the recurrent issue of flooding in the mine workings during operation, a 14.6 km-long tunnel called the “Galerie de la Mer” was excavated between the Gérard shaft and the port of Marseille. Today, this tunnel serves as a drainage route for the main mining reservoir, which is now partially flooded due to the cessation of mine water pumping after closure.
Flooding of the mine began in 2003 and initially concerned the deepest longwall operations located to the west of the area. Then, the groundwater level gradually rose to reach a level of −190 m below sea level in 2008, the date on which the first seismic networks were put into operational service. In 2010, a level of −14 m bsl was reached, which is located in the center of the basin (
Section 5). So, mine flooding progressed from west to east to bring the underground water level from −1100 m in 2003 to −14 m in 2010, below sea level. The water management strategy implemented at the Gardanne mine involved allowing the water to rise naturally in the mine until it reached a level of −14 m below sea level. Once this level was reached, pumping was initiated from the Gérard shaft (1000 m
3/h since 2011). But pumping proved to be insufficient to stabilize the water level, requiring higher flows but limited by the capacity of the pumps. Water level fluctuations are also influenced by effective rainfall, causing significant variations. So, since 2016, the pumping capacities have increased to reach 1200 m
3/h.
Today, the purpose of pumping from the Gérard shaft is to lower the water level in the reservoir and discharge it through a pipeline, releasing it into the sea at a depth of 30 m offshore from the Old Port of Marseille. This injection method helps to avoid visual pollution effects in the port of Marseille caused by elevated iron oxide content temporarily present in the discharged water. Once the water quality is deemed compatible with direct discharge into the port, pumping will be reduced and eventually stopped until gravitational overflow occurs at a level of +18 m above sea level [
26].
5. Microseismic Network Design and Data Acquisition
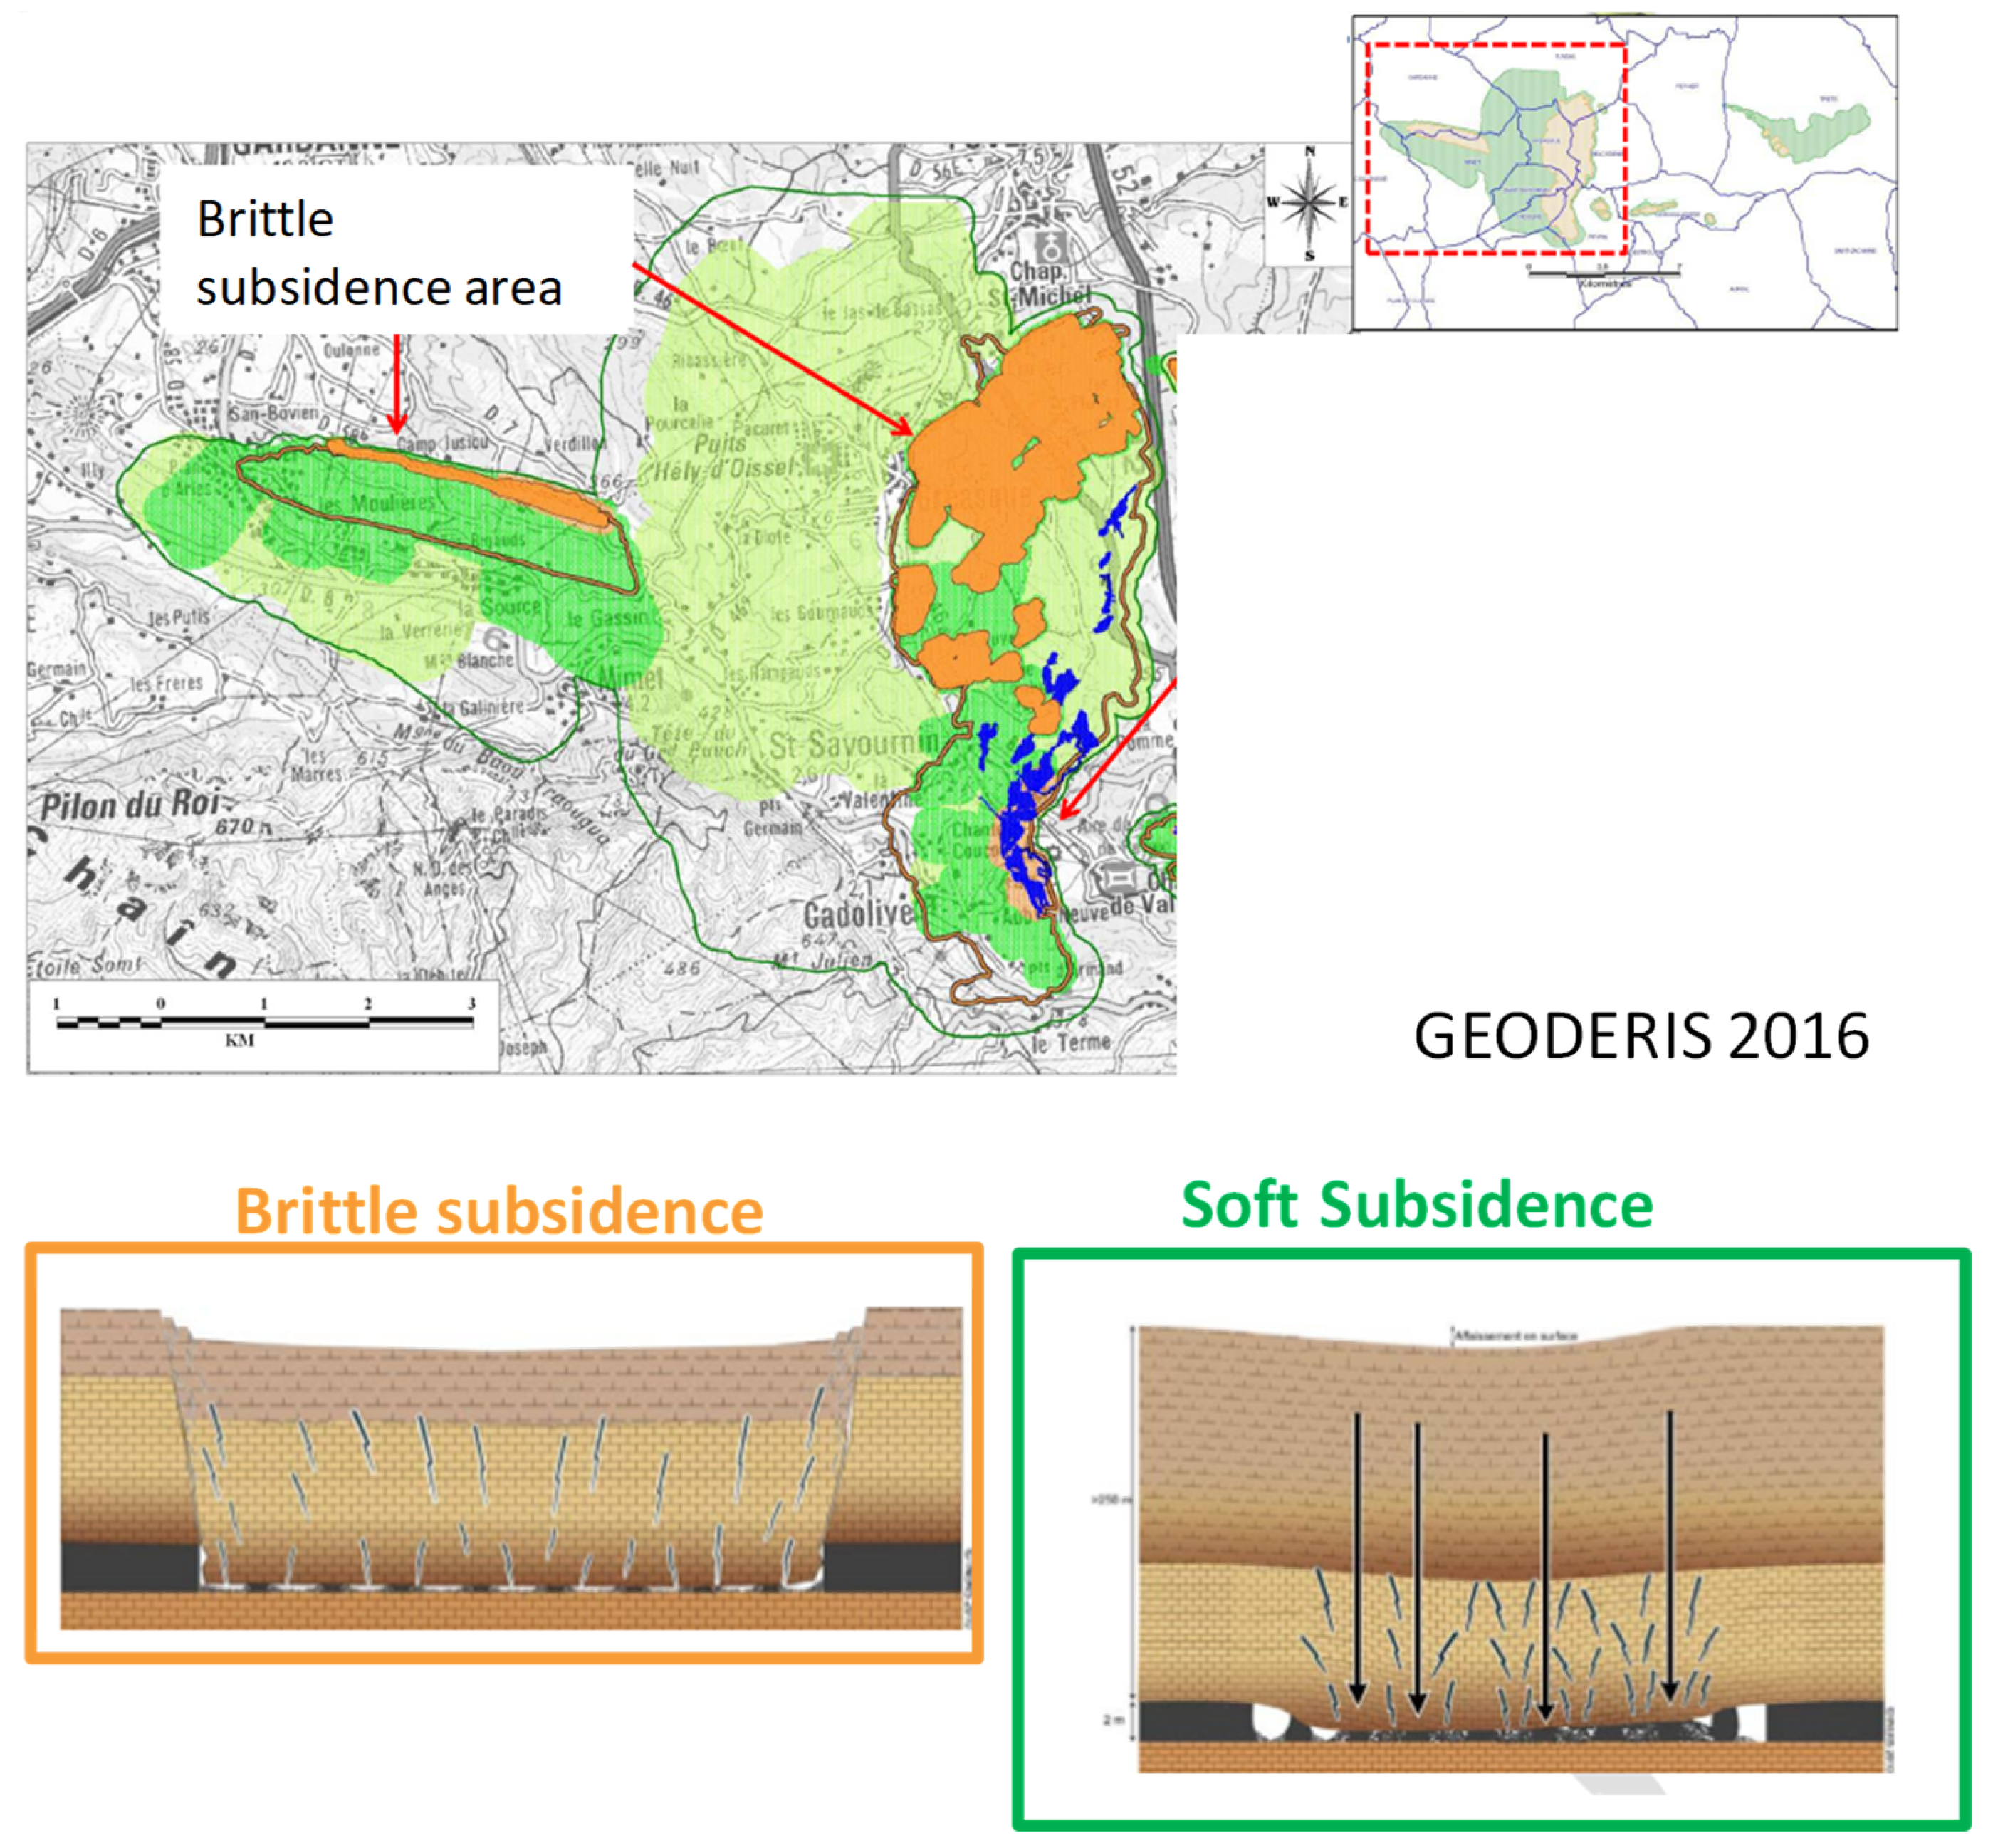
In the former coal basin of Gardanne, post-mining ground movement hazards were classified into two categories (
Figure 3) by GEODERIS in 2016 [
27]:
“Brittle” subsidence: this is a brutal or sudden subsidence of the overburden that may occur in districts exploited by rooms and pillars methods and located at shallow depths, between 50 and 250 m below the surface. In the event of pillar failure, significant and rapid surface movements could occur, given the shallow depth of the pillars. This kind of phenomenon already occurred in Provence, in the field of exploitation called “Rocher Bleu” in 1879 [
28];
“Soft” subsidence: this phenomenon is associated with mine workings located beyond 250 m depth, where the pillars are considered to be already crushed. Given that the pillars are located at greater depths, their potential failure would be compensated by ground swelling, thereby limiting surface effects. This subsidence is supposed to be of low amplitude and slow velocity, even if the consequences on the building may be significant.
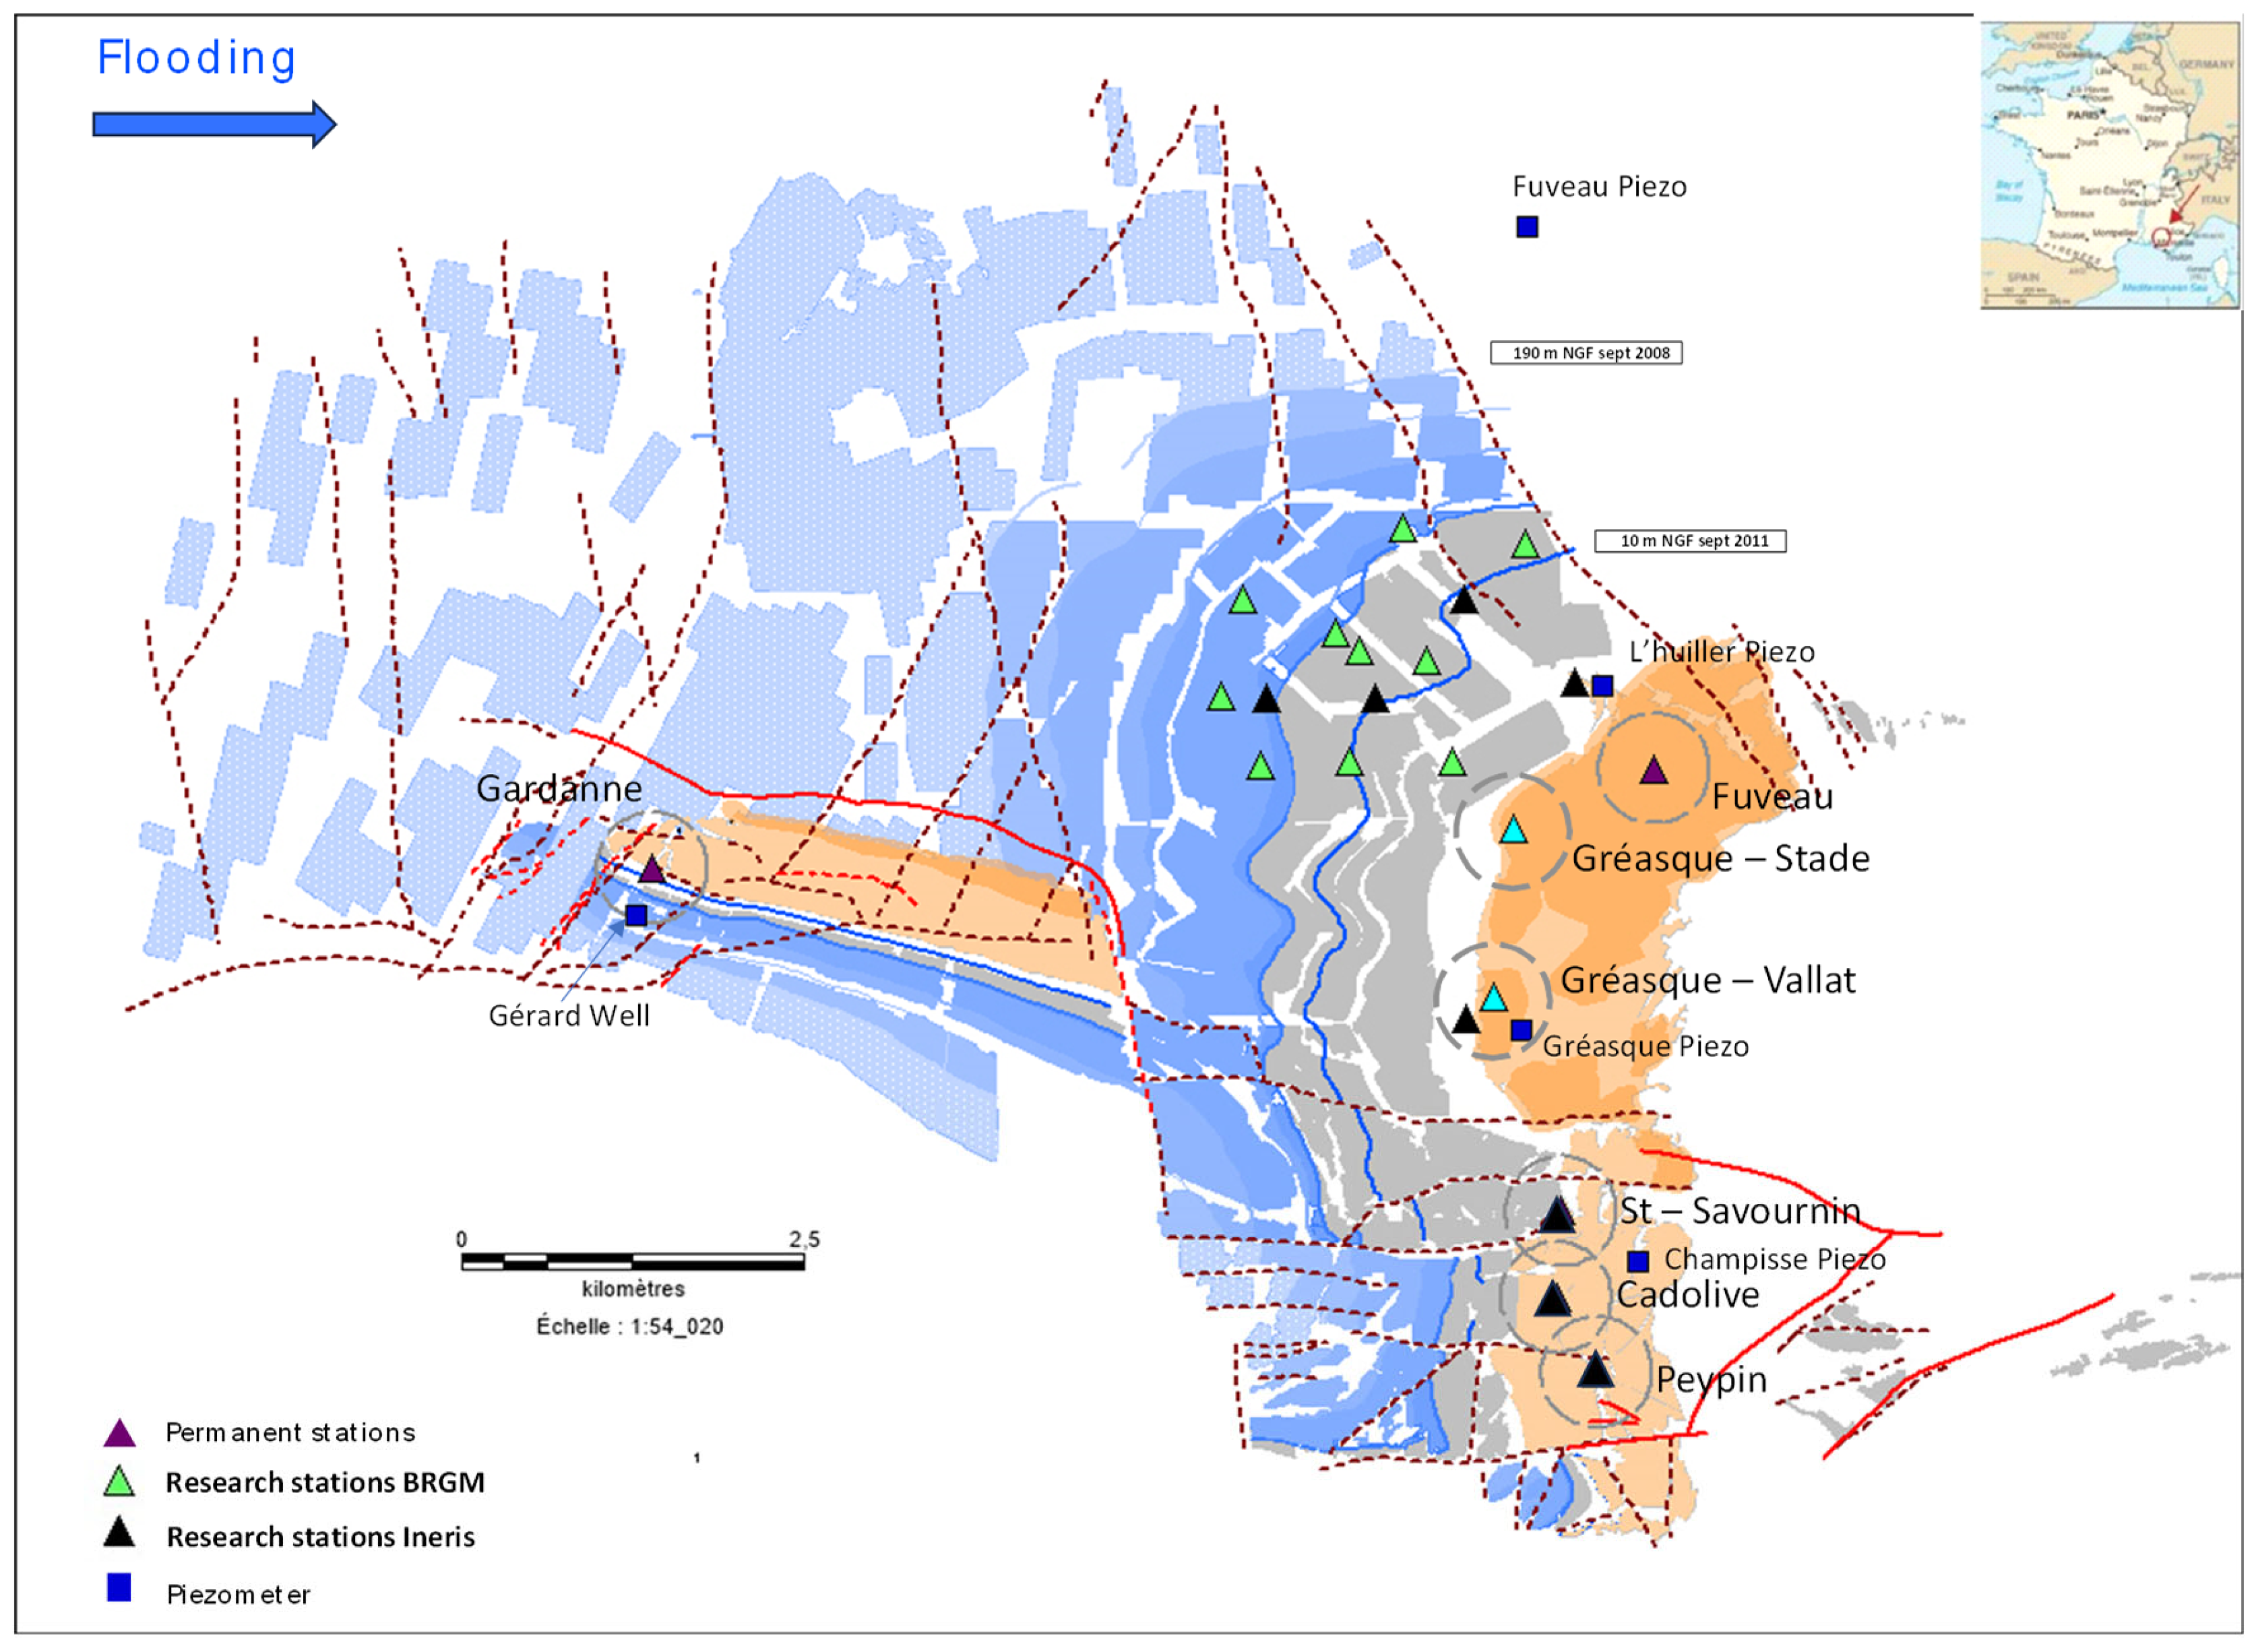
A permanent seismic network was then designed to monitor areas where “brittle subsidence” hazards have been identified and where there is significant urbanization at the surface. It was installed in 2008 to detect early signs of underground instability or failure in the mine workings before it reaches the surface in order, if necessary, to evacuate people located above or nearby. The depth of the mining works, the geomorphological context, as well as the so-called “Rocher Bleu” microseismic calibration blast experiment, carried out by Ineris, guided the design of the microseismic monitoring system. It also resulted from a balance between economic and technical constraints of installation, the latter being quite limiting because of the high population density in the areas concerned. At this point it is important to keep in mind that the network was designed to monitor microseismic activity specifically in the defined risk zones.
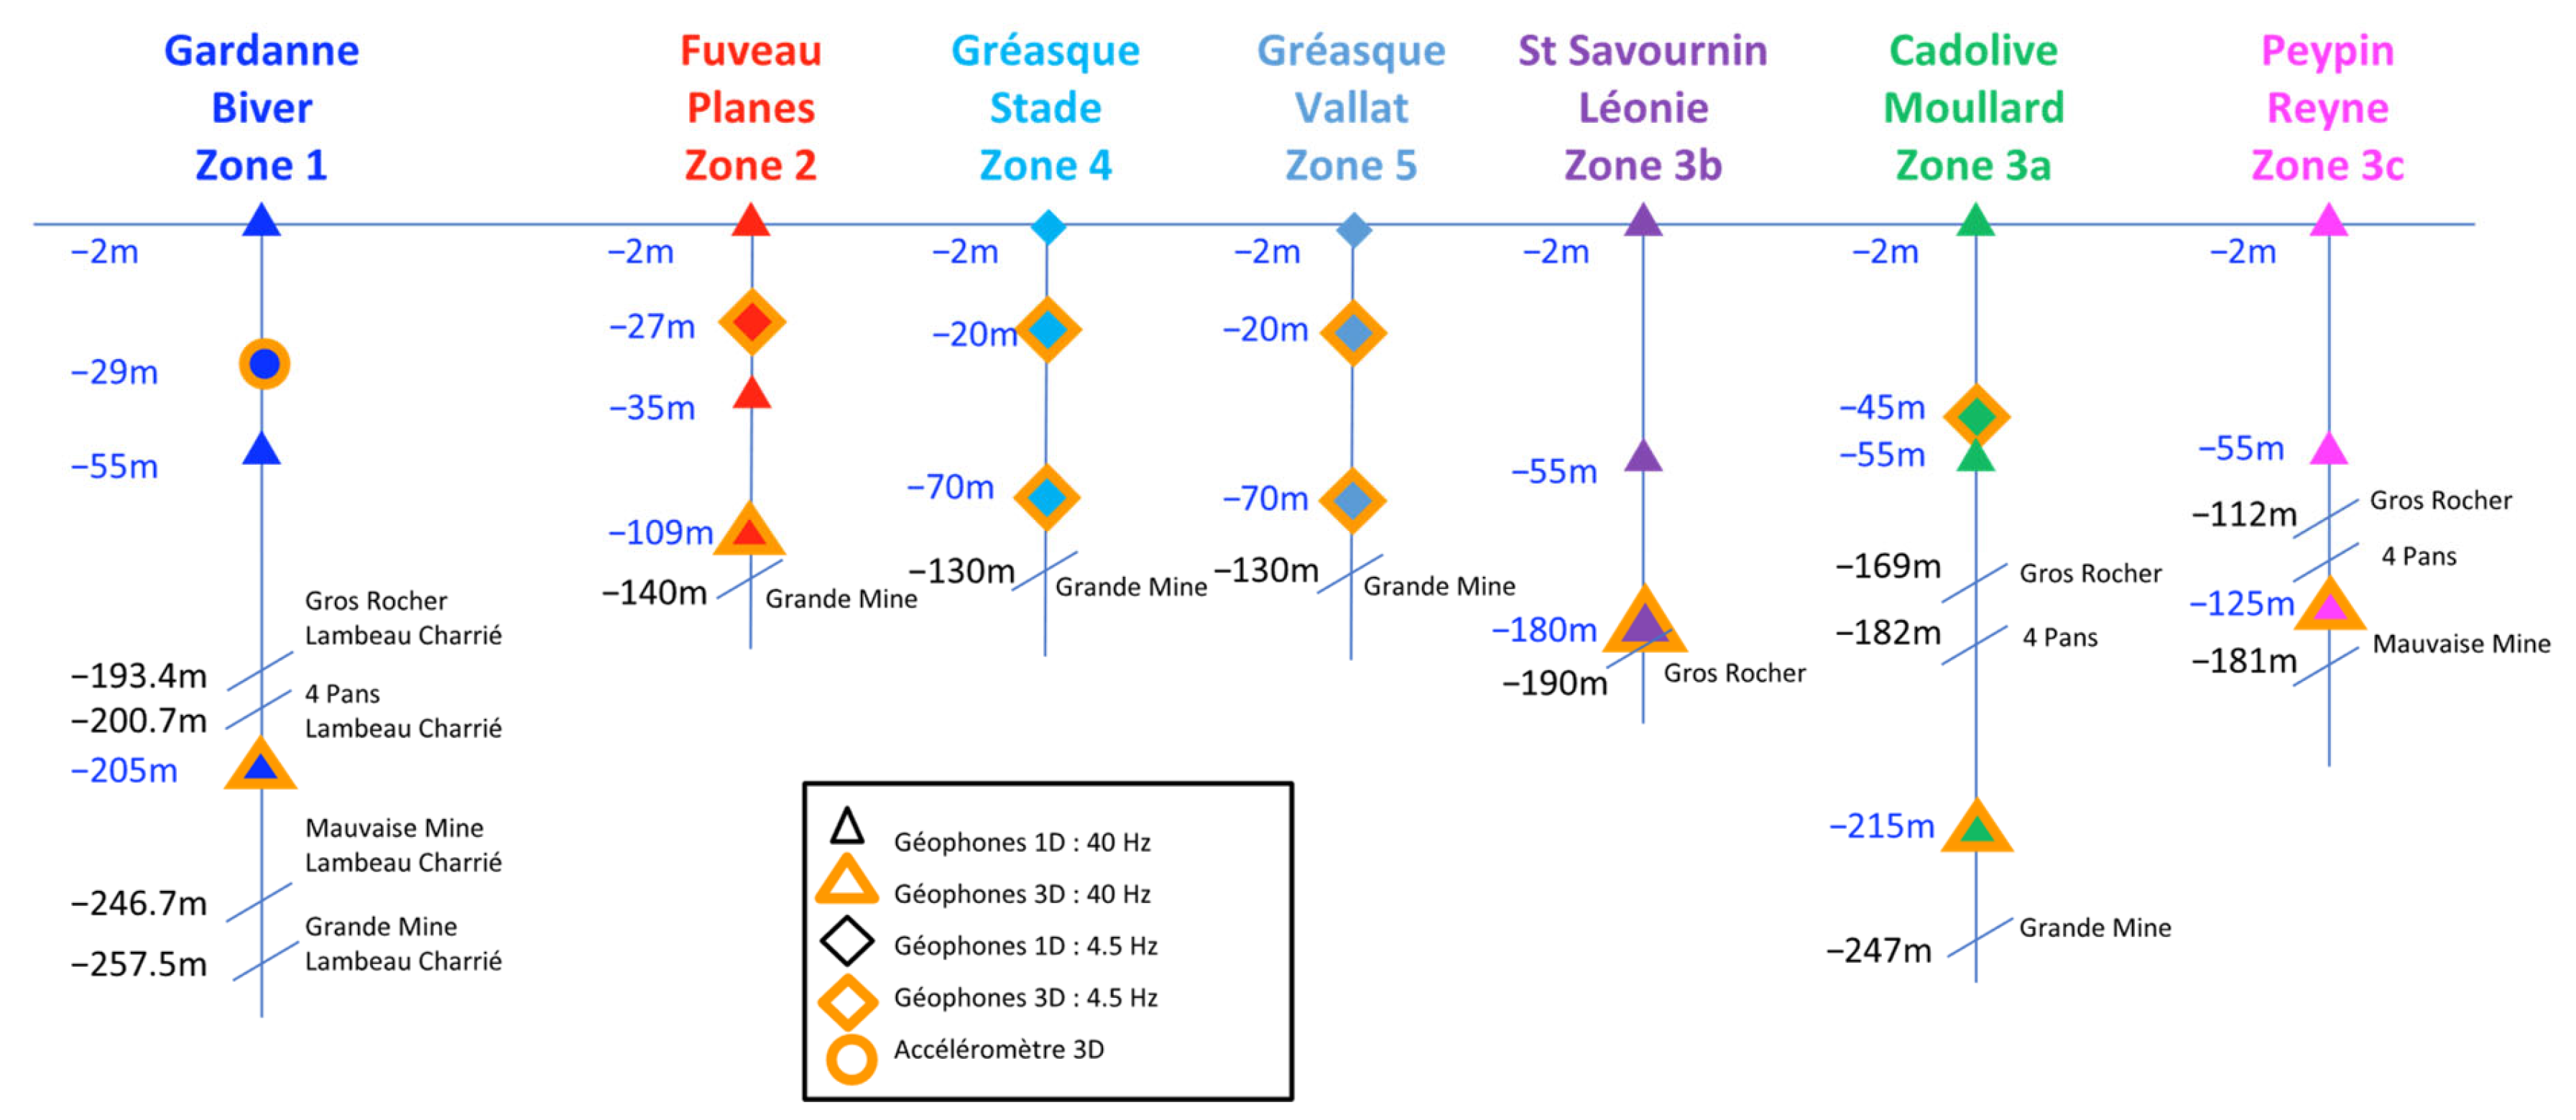
The five permanent microseismic stations operated since 2008 by Ineris are located in Gardanne (zone 1), Fuveau (zone 2), Saint-Savournin, Cadolive and Peypin (zone 3) (
Figure 4). Following the revision of the hazard maps related to “brittle subsidence” in 2016, two additional stations were installed and put into operational service in 2023: Gréasque—Stade (zone 4) and Gréasque-Vallat (zone 5).
At the moment, the operational network therefore includes 4 permanent monitoring stations in zones 1, 2, 4 and 5 (
Figure 4). The 3 stations in zone 3 (Saint-Savournin, Cadolive and Peypin) are considered as scientific observation stations in 2024. Their future beyond 2024 is under discussion.
Each site was equipped with a vertical station (with 3 or 4 sensors) located in a borehole reaching 200 m depth for the deepest and connected to a junction box and a datalogger (
Figure 5). Each station communicates with a VPN (Virtual Private Network) connection to the receiving Ineris Centre based in Nancy (
Figure 5) through a dedicated monitoring infrastructure (see
https://cenaris.ineris.fr accessed on 28 May 2025). All the data are centralized in a database that is interfaced with a secured web-monitoring portal that enables all relevant monitoring information to be shared with all stakeholders.
The stations of zones 1, 2 and 3 are constituted by the following:
One-component geophones, main frequency of 40 Hz, located at the surface and one located at ~50 m depth;
A total of 40 Hz frequency geophones with three main components (
Figure 5), located at depths between ~110 and ~215 m depth;
“Low frequency” sensors with three components located at Gardanne (accelerometers, at 29 m depth) and Cadolive (velocimeters 4.5 Hz, at 45 m depth).
The stations of zones 4 and 5 are constituted by three 4.5 Hz sensors located in boreholes reaching 70 m depth. The one located at the surface is a one-component sensor, and two others located deeper are three-component sensors (
Figure 5).
For all the stations, microseismic event acquisition is based on a triggered acquisition mode. Recording is triggered when signal amplitude on at least 2 channels of the 3D sensor station exceeds an amplitude threshold defined according to the level of seismic background noise related to urban environment and electronic artifacts.
Alarms can be triggered in the event of abnormal seismic activity in the monitored risk areas represented by a 400 m sphere around each station (gray dotted circle in
Figure 5). The aim is to detect the initiation of a collapse before the appearance of surface effects. Based on these alarms, the administration can then take protective and safety measures towards the population, such as the evacuation of homes.
Note that the data from the piezometers of Fuveau and Gérard are updated on the e.cenaris platform. The data from the piezometer of Fuveau come from the ADES database, which can be consulted online, and reflect the water supply by rainfall. The data from the Gérard well are communicated regularly by the BRGM-DPSM and reflect the water level maintained by pumping in the area.
6. Microseismicity Pattern: View from the Permanent Network
We present here the analysis of the seismic data recorded by the permanent monitoring network as it gives an overview of the activity at the scale of the whole basin. This analysis will be correlated with the underground water level.
Please note that we do not present here the activity recorded by the new Gréasque-Vallat (zone 4) and Gréasque-Stade (zone 5) stations because they have only been operational since 1 January 2023: the number of microseismic events in these zones is at the moment not sufficient to conduct this analysis.
6.1. Seismic Data Processing
The detail of the seismic data processing is presented in
Appendix A of this article. We present here the main steps.
The event location was performed using the SYTMISauto software (v. 6.90) developed by Ineris. The hypocenter location is based on the combination of the microseismic wave arrival times as well as the polarization angles. Indeed, the integration of polarization angles enables locating an event with few probes, i.e., one 3D probe and one 1D probe if only P waves are detected or a single 3D probe if P and S waves are recorded [
11,
29].
At the first step of the data processing, the location is performed automatically, and in a second step, the different pickings are checked by an operator to improve the location if needed. The local and moment magnitudes are automatically calculated.
A seismic post-processing step is later performed; it concerns multiplet analysis. Its objective is to verify the existence and persistence of multiplets over time, which could indicate reactivated faults and contribute to the seismicity observed near areas at risk of brittle subsidence. The method used is based on the cross-correlation of signals with a method developed by Namjesnik et al. 2022 [
30] (see
Appendix A of the article for more details).
6.2. Overview of the Microseismic Activity at the Scale of the All Basin
Between 1 January 2008 and 31 December 2023, the total number of events outside of the risk zones (as defined before) detected by the permanent network is 2636.
In 2010, the water level reached a mining sector located in the northeast of the basin, approximately 2 km west of the Fuveau monitoring station (
Figure 4). Since then, repetitive seismic activity has appeared at this location [
14]. This seismic swarm has been called the “Fuveau seismic swarm”. We also observe, further south, in the center of the basin, an activity that is weaker in magnitude but constant over time. Six main seismic episodes were observed in the center of the basin, outside the areas considered to be at risk of brittle subsidence, which present the following characteristics:
In 2010, seismic activity began at Mimet in the south of the basin (from January to April) and continued at the Fuveau swarm site, further north, in May and June, where a significant number of events were recorded. It appears that this activity occurred in response to the significant increase in the water table level (
Figure 6 and
Figure 7), which varied from –120 m to –14 m in almost a year;
In November 2012, after 4 months of rising groundwater, a seismic crisis occurred at the location of the Fuveau seismic swarm (
Figure 6 and
Figure 7). This seismic crisis was also felt by the local population. The strongest event had a local magnitude close to 3.2;
In early 2014 (January to March), another seismic episode was observed (
Figure 6 and
Figure 7) with events also located further south than the Fuveau seismic swarm with a maximum magnitude reaching M
L 2.3;
In late 2014, a third seismic crisis was triggered after exceptionally heavy rainfall. As the pumping capacities were reached in the area, it was not possible to lower the water table (
Figure 6 and
Figure 7). This phenomenon is believed to be the cause of the second seismic crisis in December 2014;
In late 2016 and early 2017, another crisis occurred in the same location. This crisis is probably linked to the significant drop in the water level, which went from +10 m to –30 m below sea level, correlated with a period of heavy rainfall (
Figure 6 and
Figure 7). This decrease was caused by the increase in pumping capacities.
In August 2017, an atypical seismic episode was observed because this crisis was correlated with a period of drought, unlike other seismic episodes (
Figure 6 and
Figure 7).
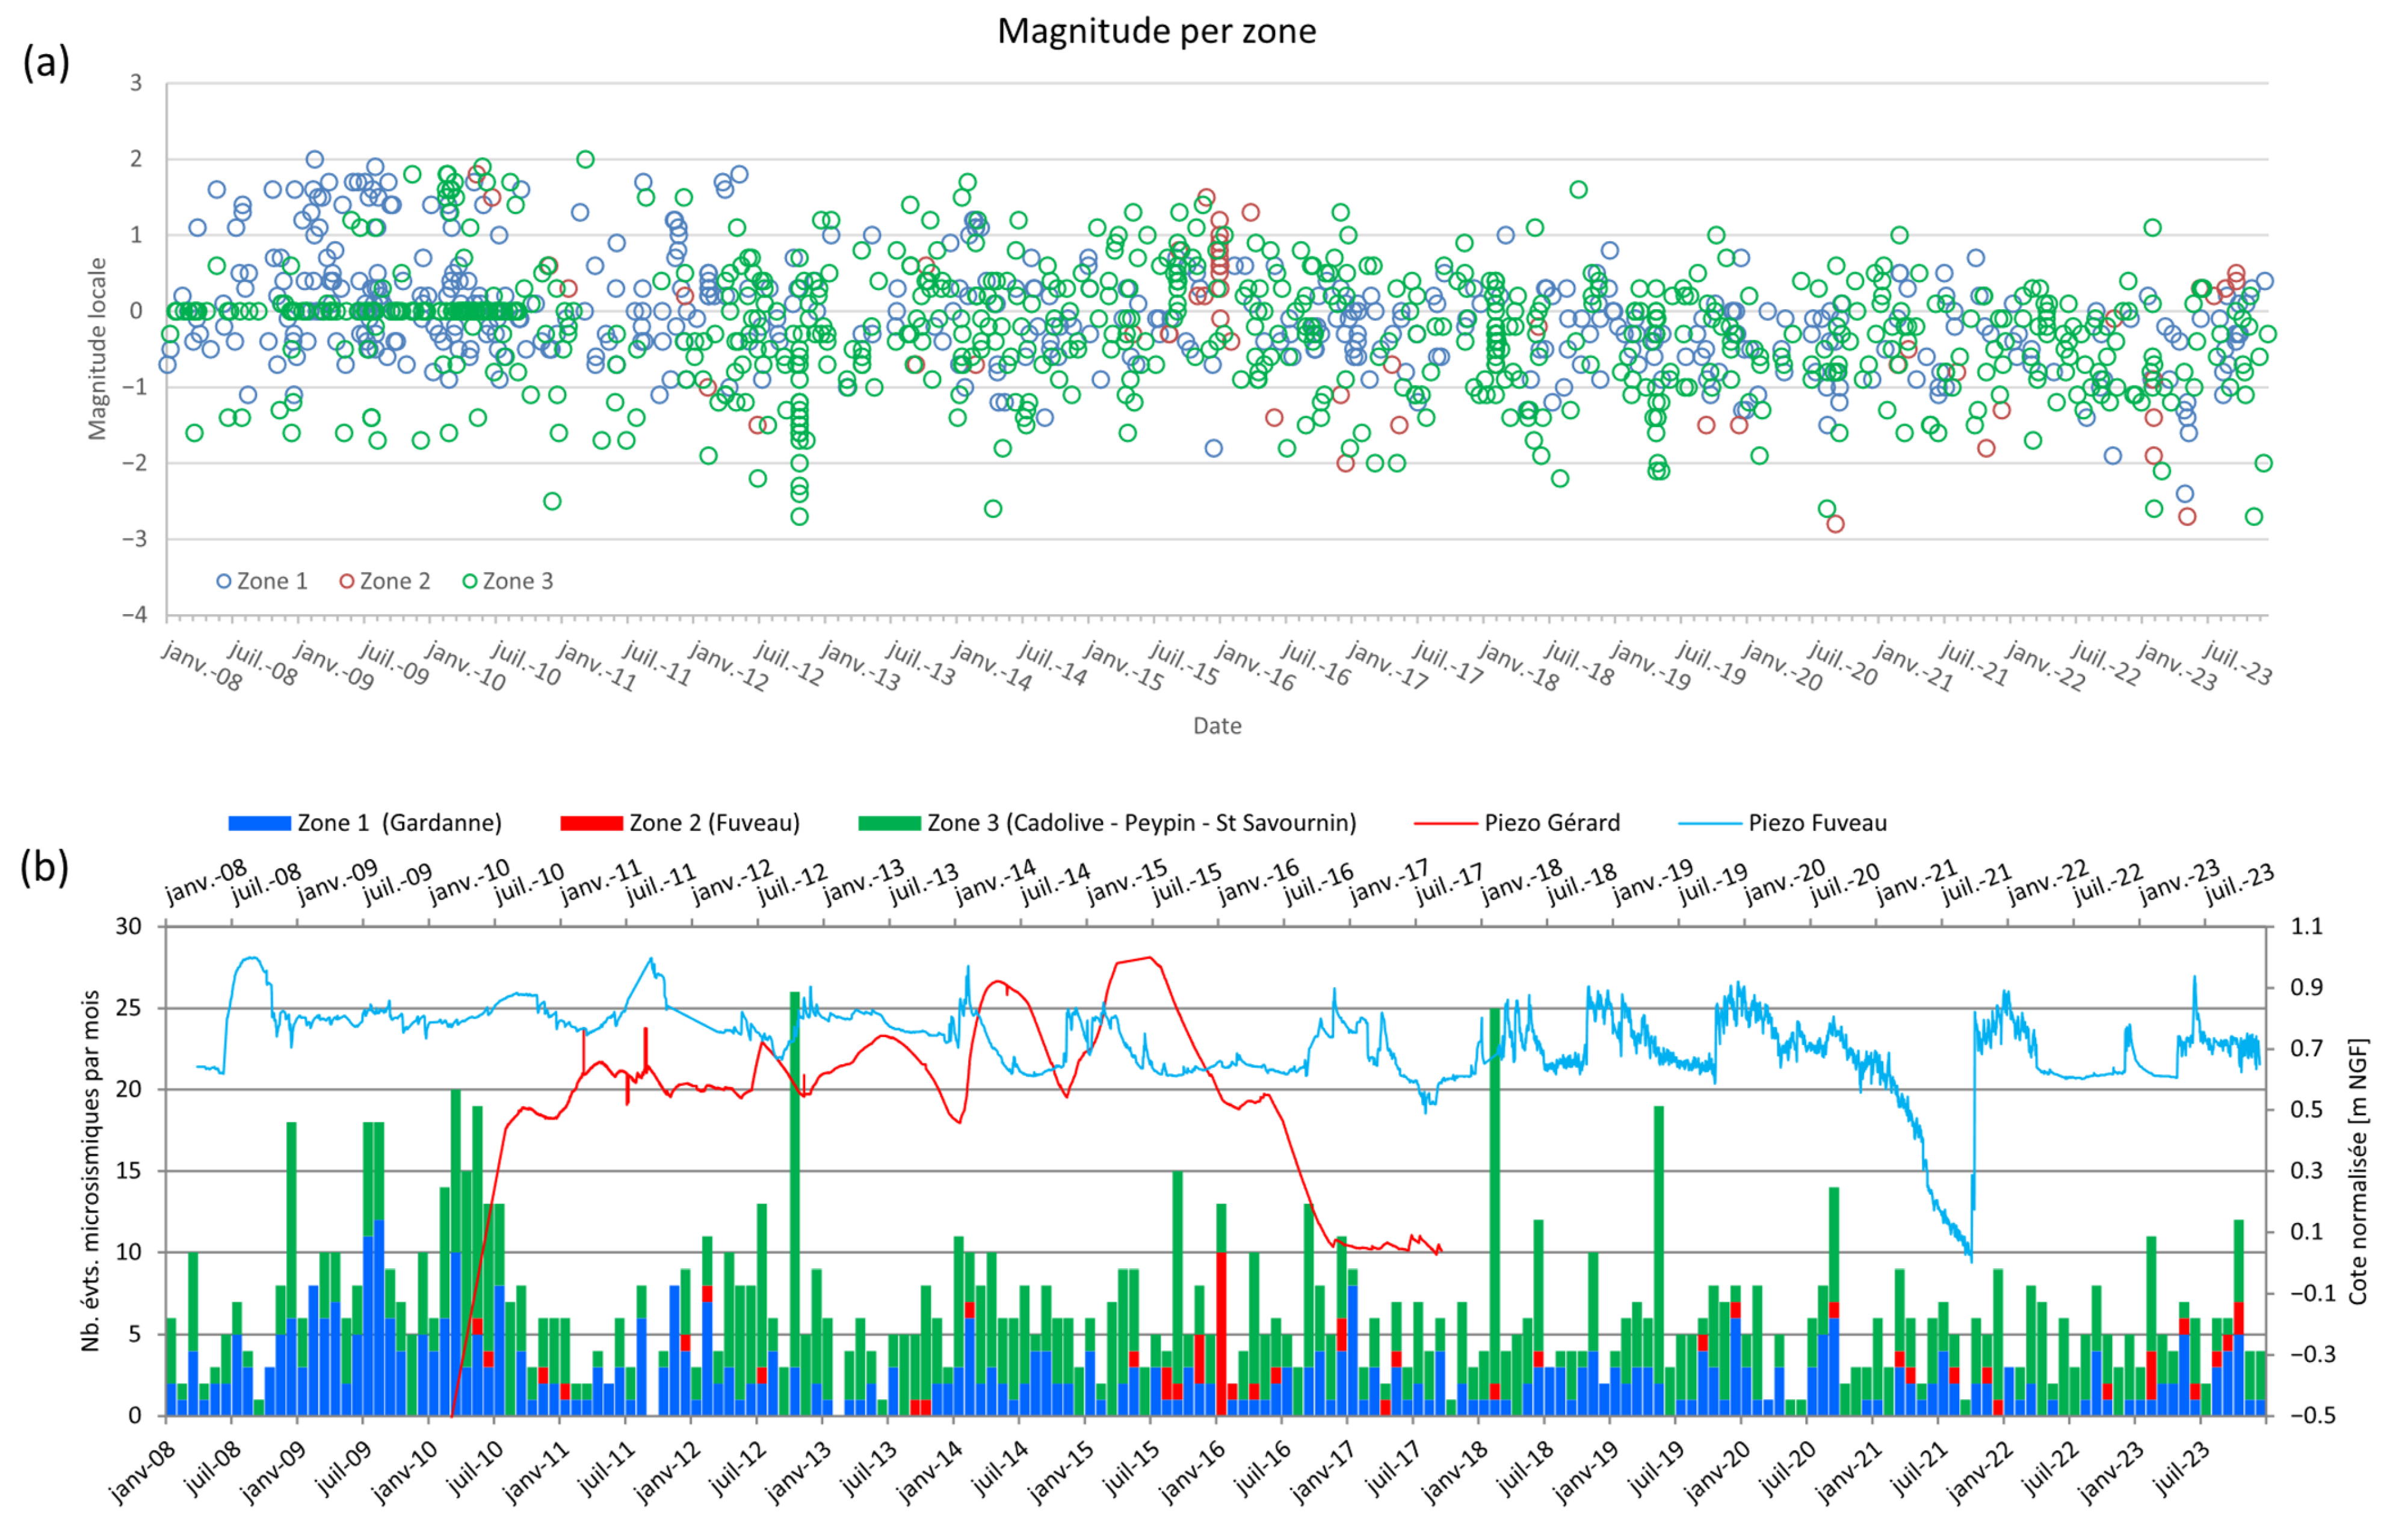
Figure 8a,b show that most of the most significant seismic episodes occur when precipitation is highest, which corresponds to the recharge of groundwater. Except for the last crisis in 2017, the seismic crisis occurred during a dry period.
Over time, this unexpected microseismic activity shows the following characteristics:
It is concentrated along the underground flooding limit, mainly in the center of the basin, and at the level of the “Lambeau charrié” (zone 1);
This activity is persistent over time and seems to be driven by the underground water fluctuations.
This situation poses problems in terms of post-mining risk management, as this seismic activity was not expected in this area. We will discuss all the consequences of this point in
Section 7, “Discussion”.
6.3. Overview the Microseismic Activity Recorded in the Areas Classified as at Risk of Brittle Subsidence
Since its commissioning in 2008, the permanent network has recorded more than 4000 events with local magnitudes between −3 < M
L < 3 in all the basin. Seismic activity in the areas at risk of brittle subsidence, i.e., 400 m around the permanent stations, is observed mainly in zones 1 and 3, respectively, at Gardanne, on the one hand, and Cadolive, Peypin, and St Savournin, on the other hand (
Figure 4).
The events recorded in the monitoring zone reached maximum detected local magnitudes of the order of M
L 2 (see
Figure 8). Between 1 January 2008 and 31 December 2023, there were the following:
A total of 458 events detected in zone 1 (Gardanne);
A total of 54 events detected in zone 2 (Fuveau);
A total of 740 events detected in zone 3 (Cadolive, Peypin, St Savournin).
The three zones show different seismic behaviors. Indeed, in zone 1, the activity is diffuse and punctuated by a few stronger events, while in zone 3, it is more sustained and appears in swarms. Finally, in zone 2, the activity is sporadic with a maximum local magnitude value of 1.5. In zones 1 and 3, these events are very weakly felt on the surface (intensity III), and they are located at the flooding limit of these two zones (
Figure 6).
Zone 2 (Fuveau) is less active, which seems consistent with the fact that the flooding did not reach this sector (
Figure 6).
6.4. Multiplet Analysis in Zones 1 and 3
6.4.1. Results in and Around Zone 1—Gardanne
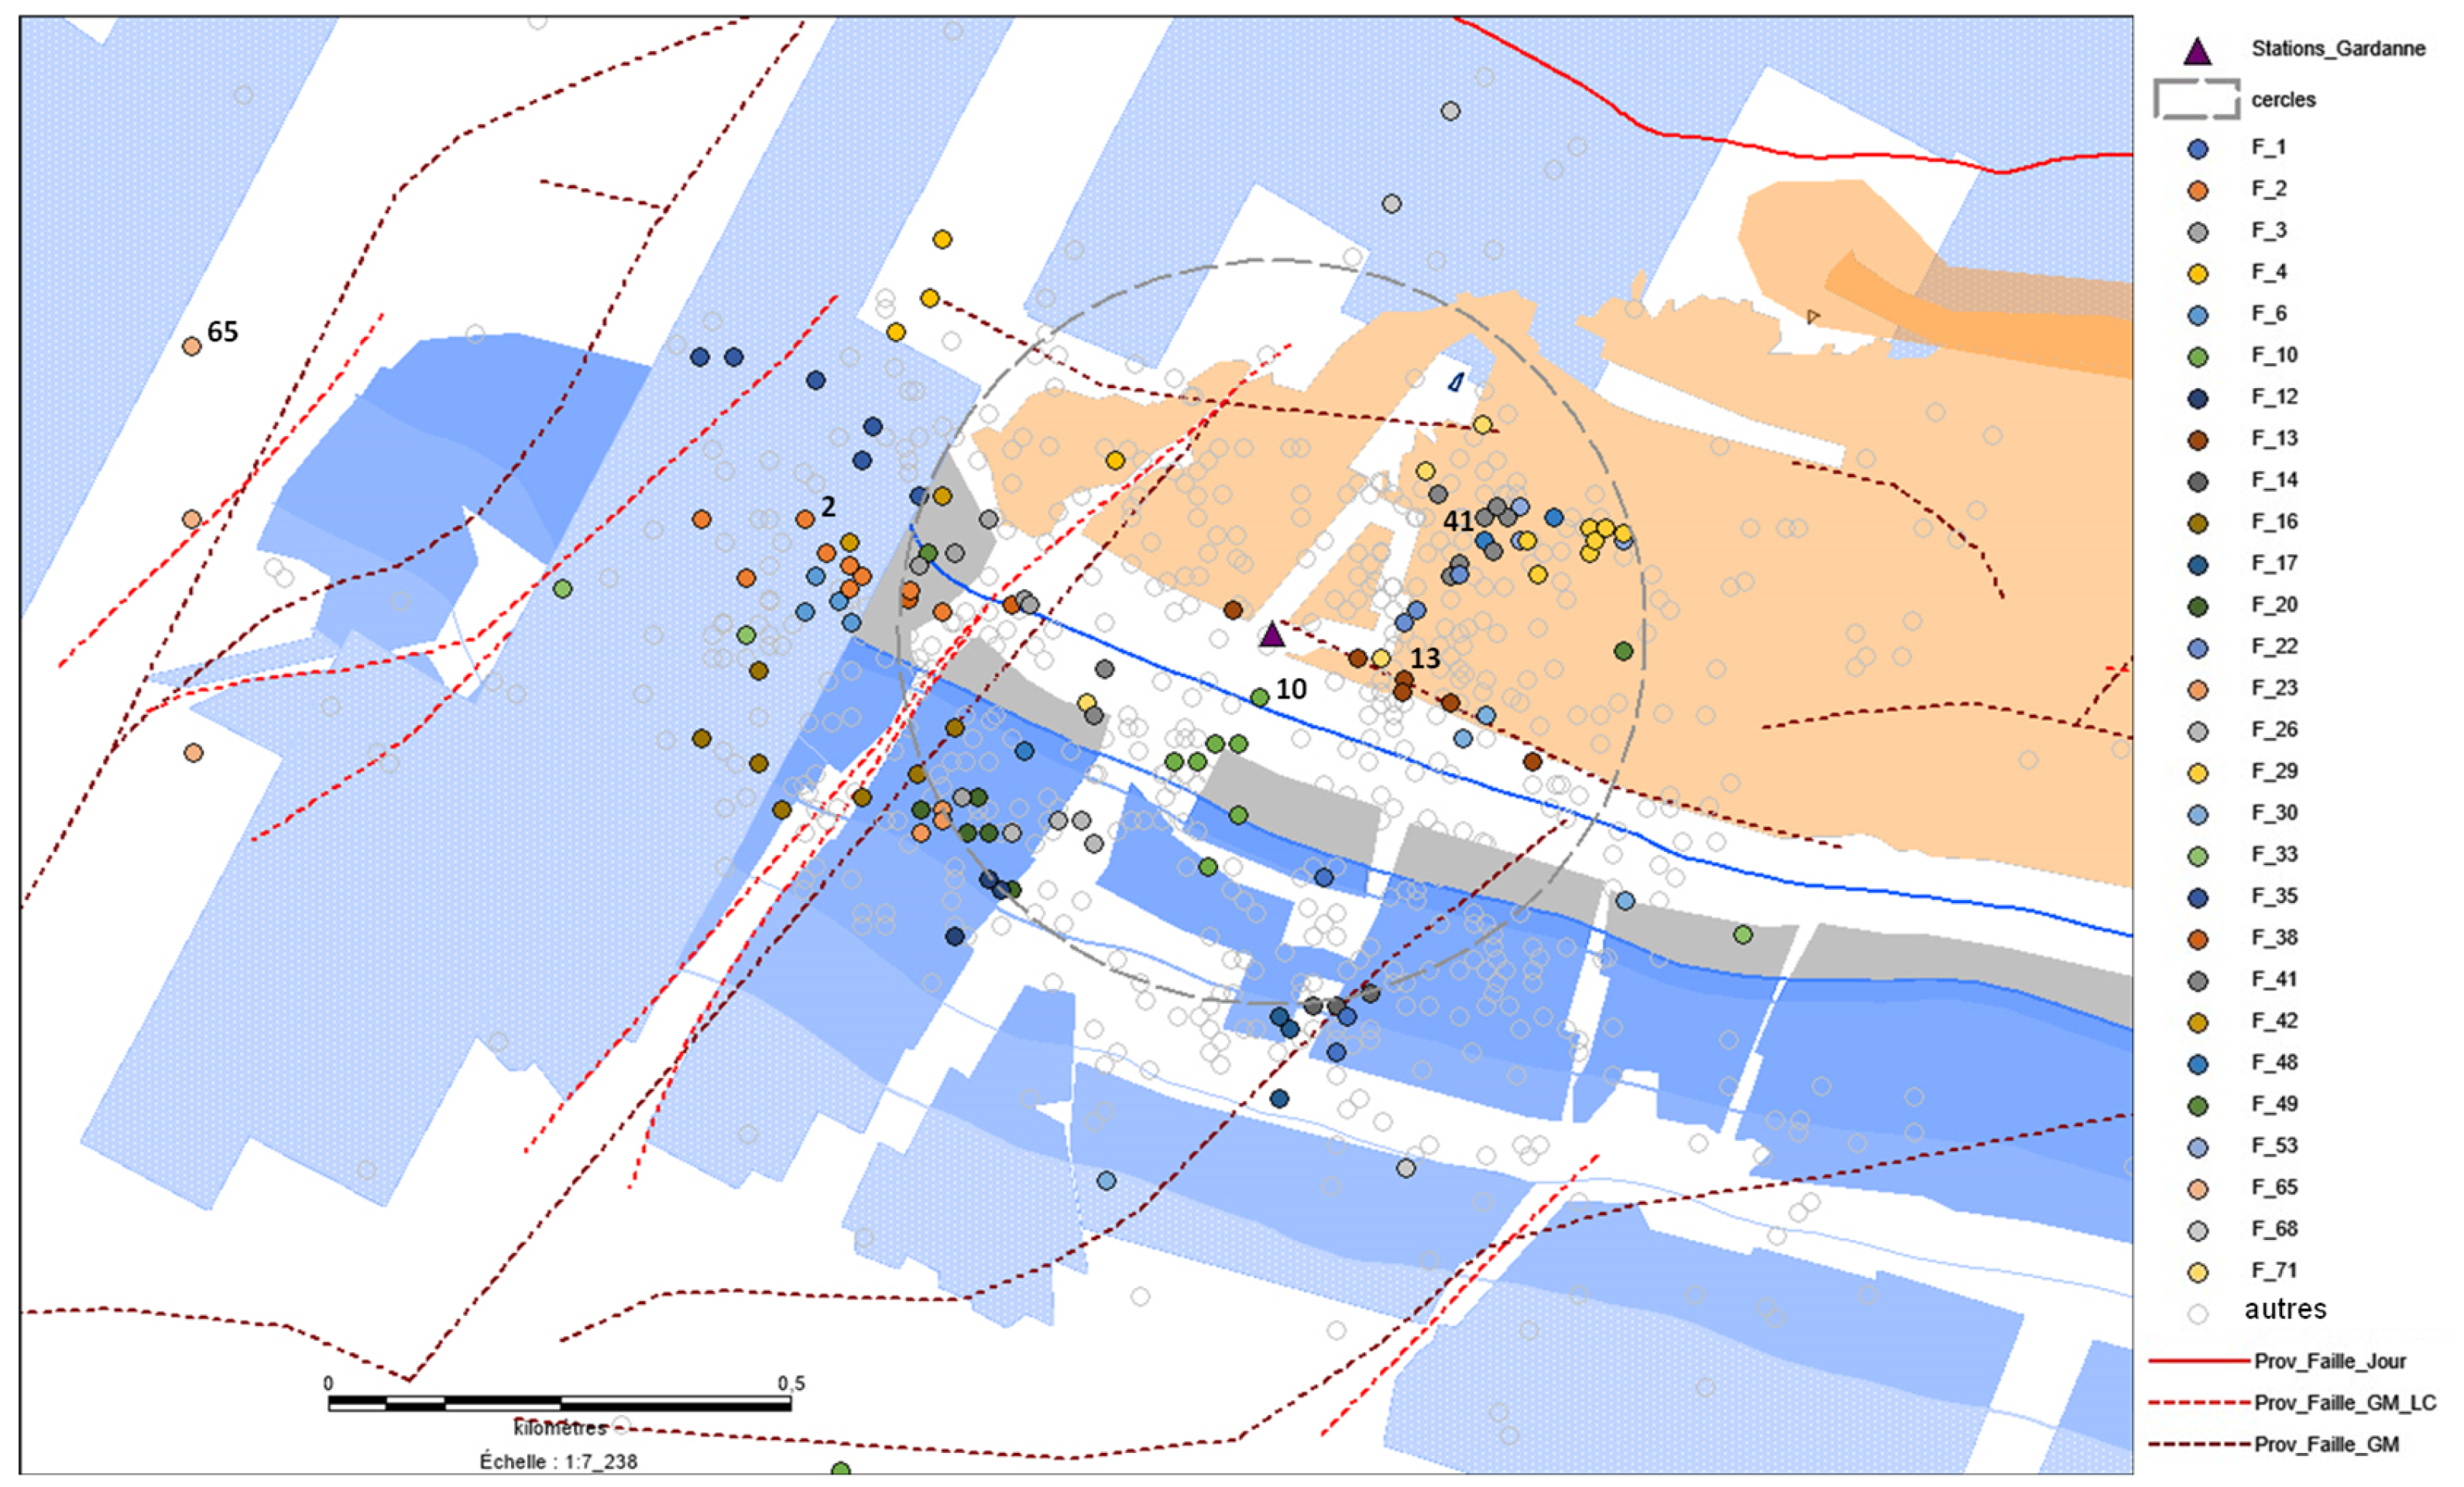
For the multiplet analysis of the Gardanne sector, 782 events were considered, the location of which is shown in
Figure 9, over the period from 1 January 2008 to 30 June 2022. It can be seen, according to the parametric study, that the multiplet analysis in the 1–30 Hz frequency band for a correlation threshold of 0.8 is the optimal combination of parameters for identifying families on the 3D 40 Hz Biver probe located at a depth of 205 m (see
Appendix A for the processing details).
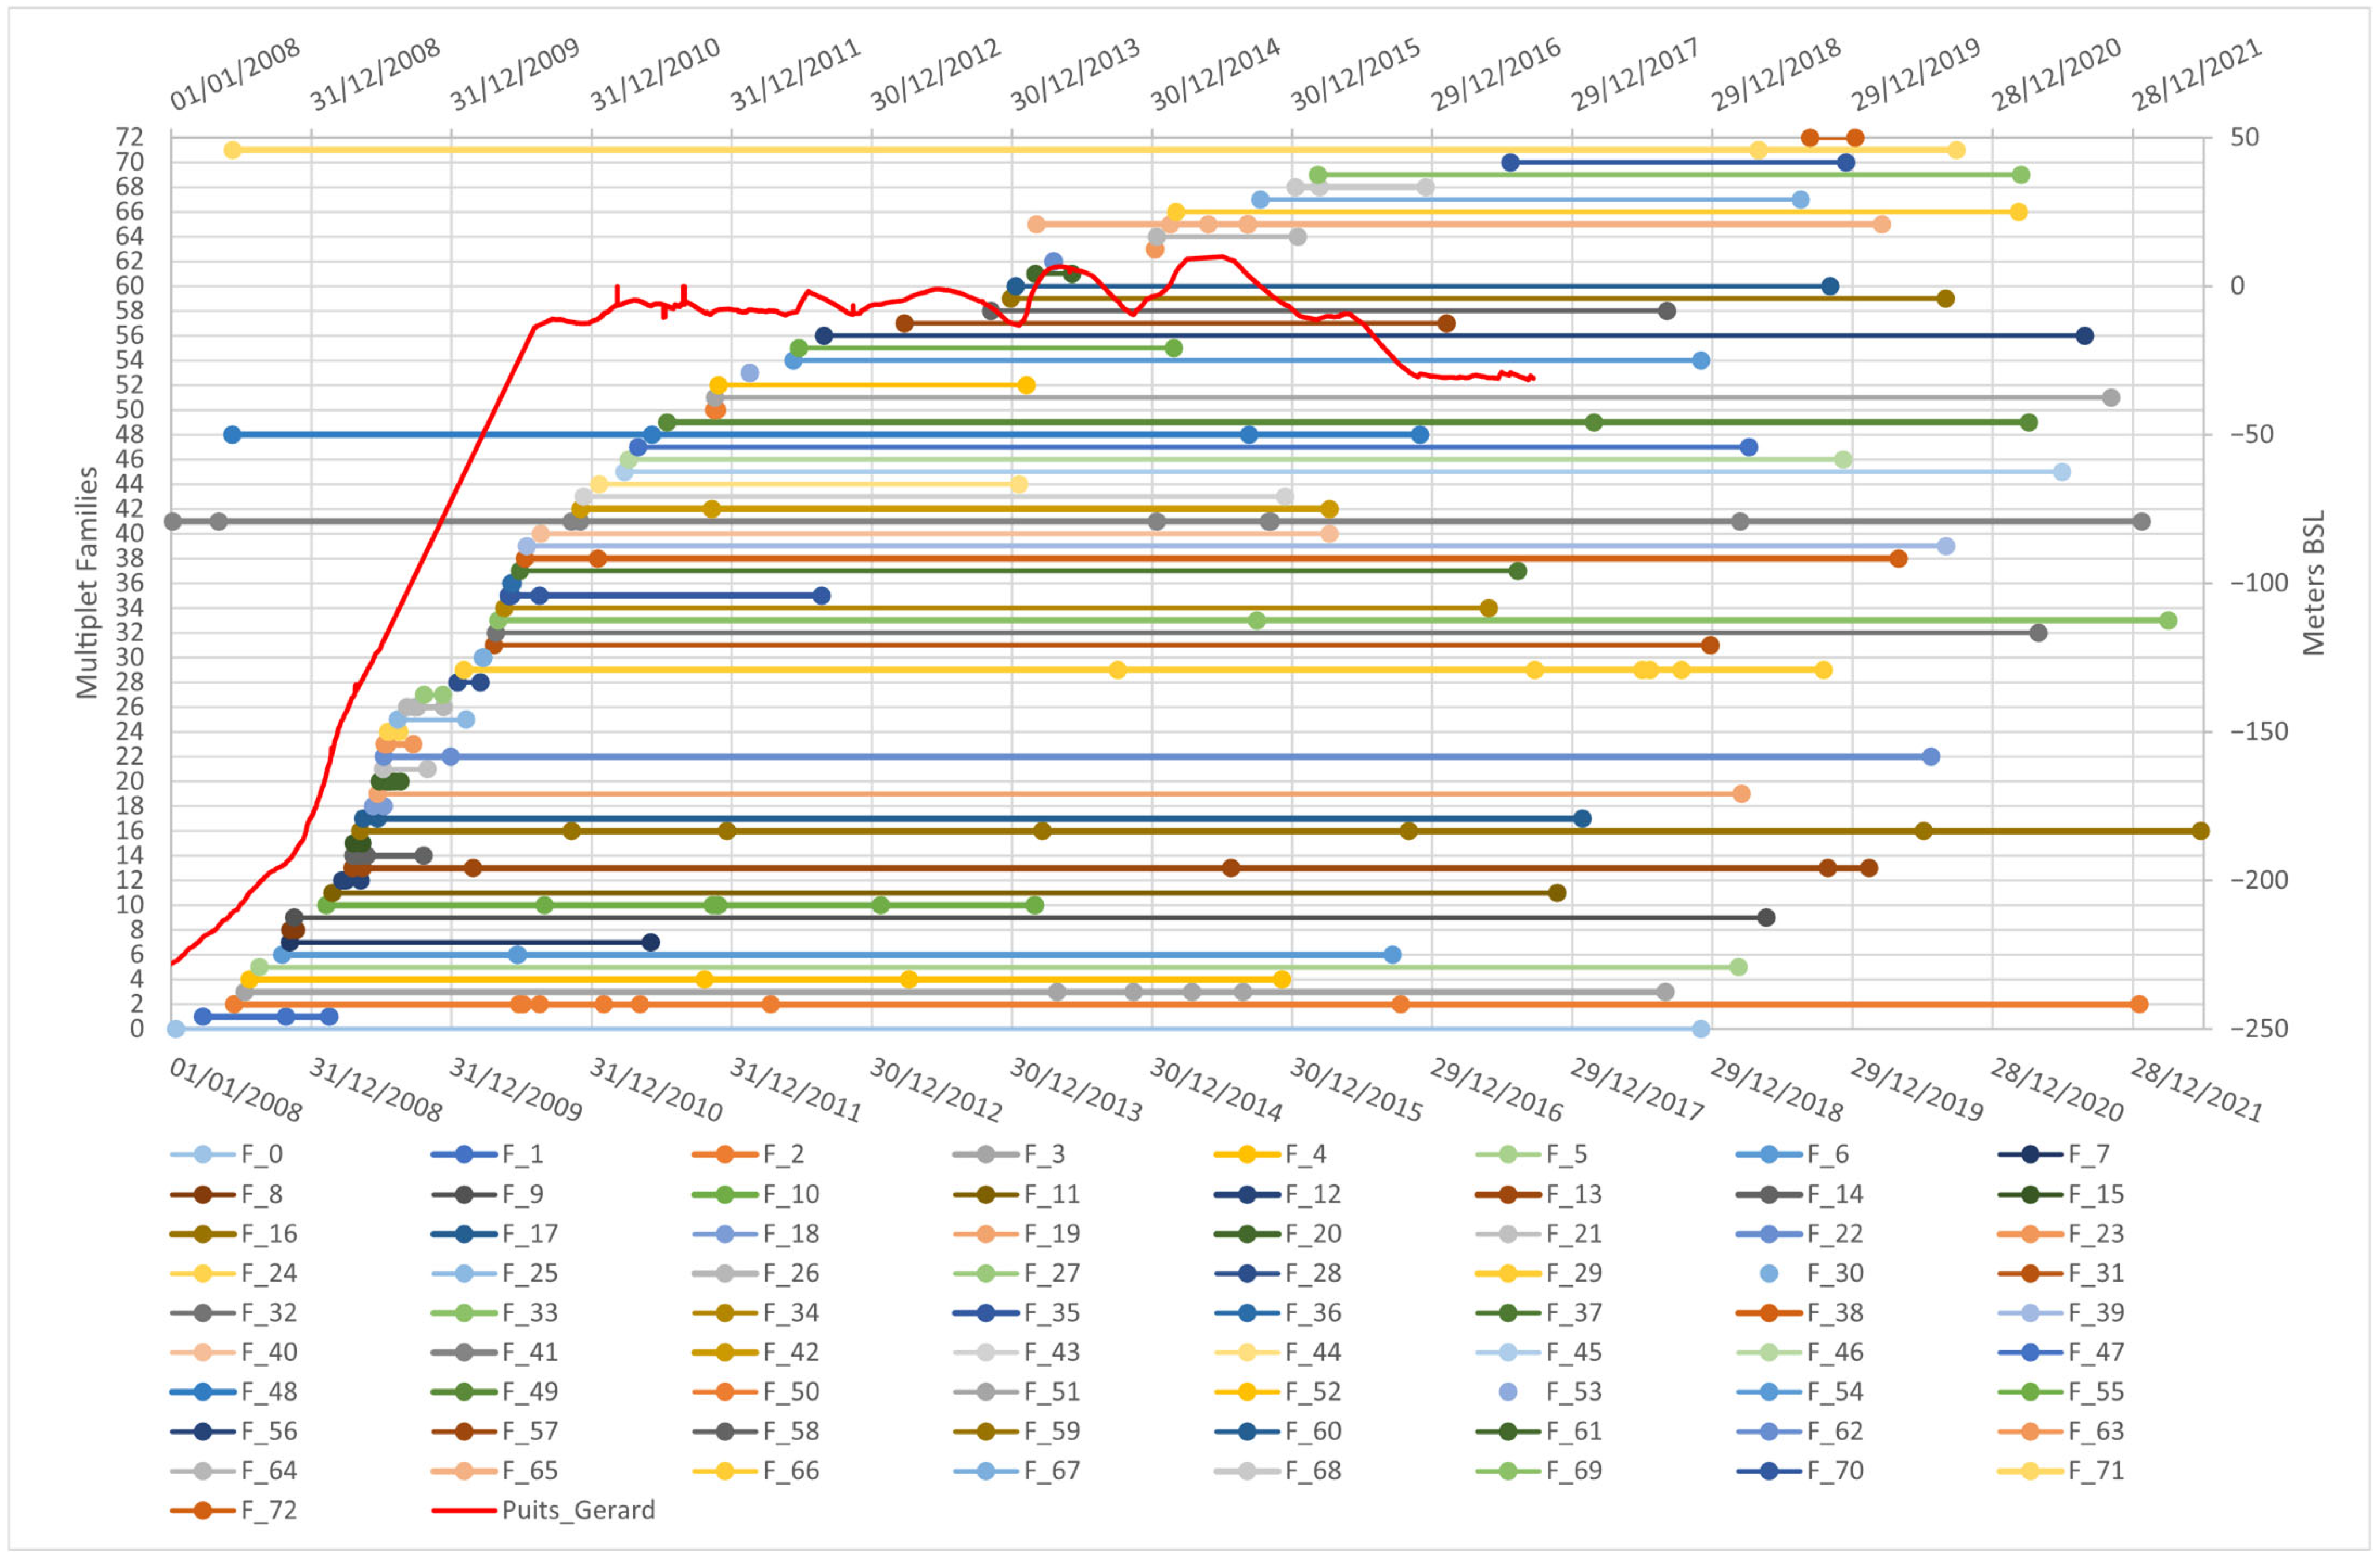
Of the 782 events considered, 221 events were classified into 72 families, or 28% of the events. However, of the 72 families, 45 only include 2 events (
Figure 10). Even though the location is not very precise because it was carried out with a single station, some event families seem to show alignments consistent with the main tectonic directions mapped in the area, i.e., those of the Lambeau Charrié (red dashes in
Figure 9) and those of the autochthonous formations (dark red dashes in
Figure 9).
For example, family 13 is located along a fault with a NW-SE direction, which was mapped in the Grande Mine formation at the time of exploitation in the autochthonous formations. Family 2, although not associated with a mapped fault, also shows an alignment in the same direction.
Families 10 and 41 (
Figure 9 and
Figure 11), for example, with a NE-SW direction, are consistent with directions recognized in the Lambeau Charrié. It should be noted that family 10 (
Figure 9), which is located within the risk zone area, is one of those with the highest magnitudes in the sample of classified events, with eight events with magnitudes between 1 and 1.3. It operated between 2009 and 2014. The other family with the highest magnitudes, of the order of 1, is family 65, which is located furthest west.
In terms of temporal evolution (
Figure 10), over the period 2008–2010, the majority of families appear at the same time as the rise in the groundwater level, which goes from −205 m NGF to approximately −12 m NGF. Two other family series appear in 2014 and 2015 and seem to be correlated with the 2 consecutive variations in the water level of around fifteen meters. Finally, some families operate over the entire period.
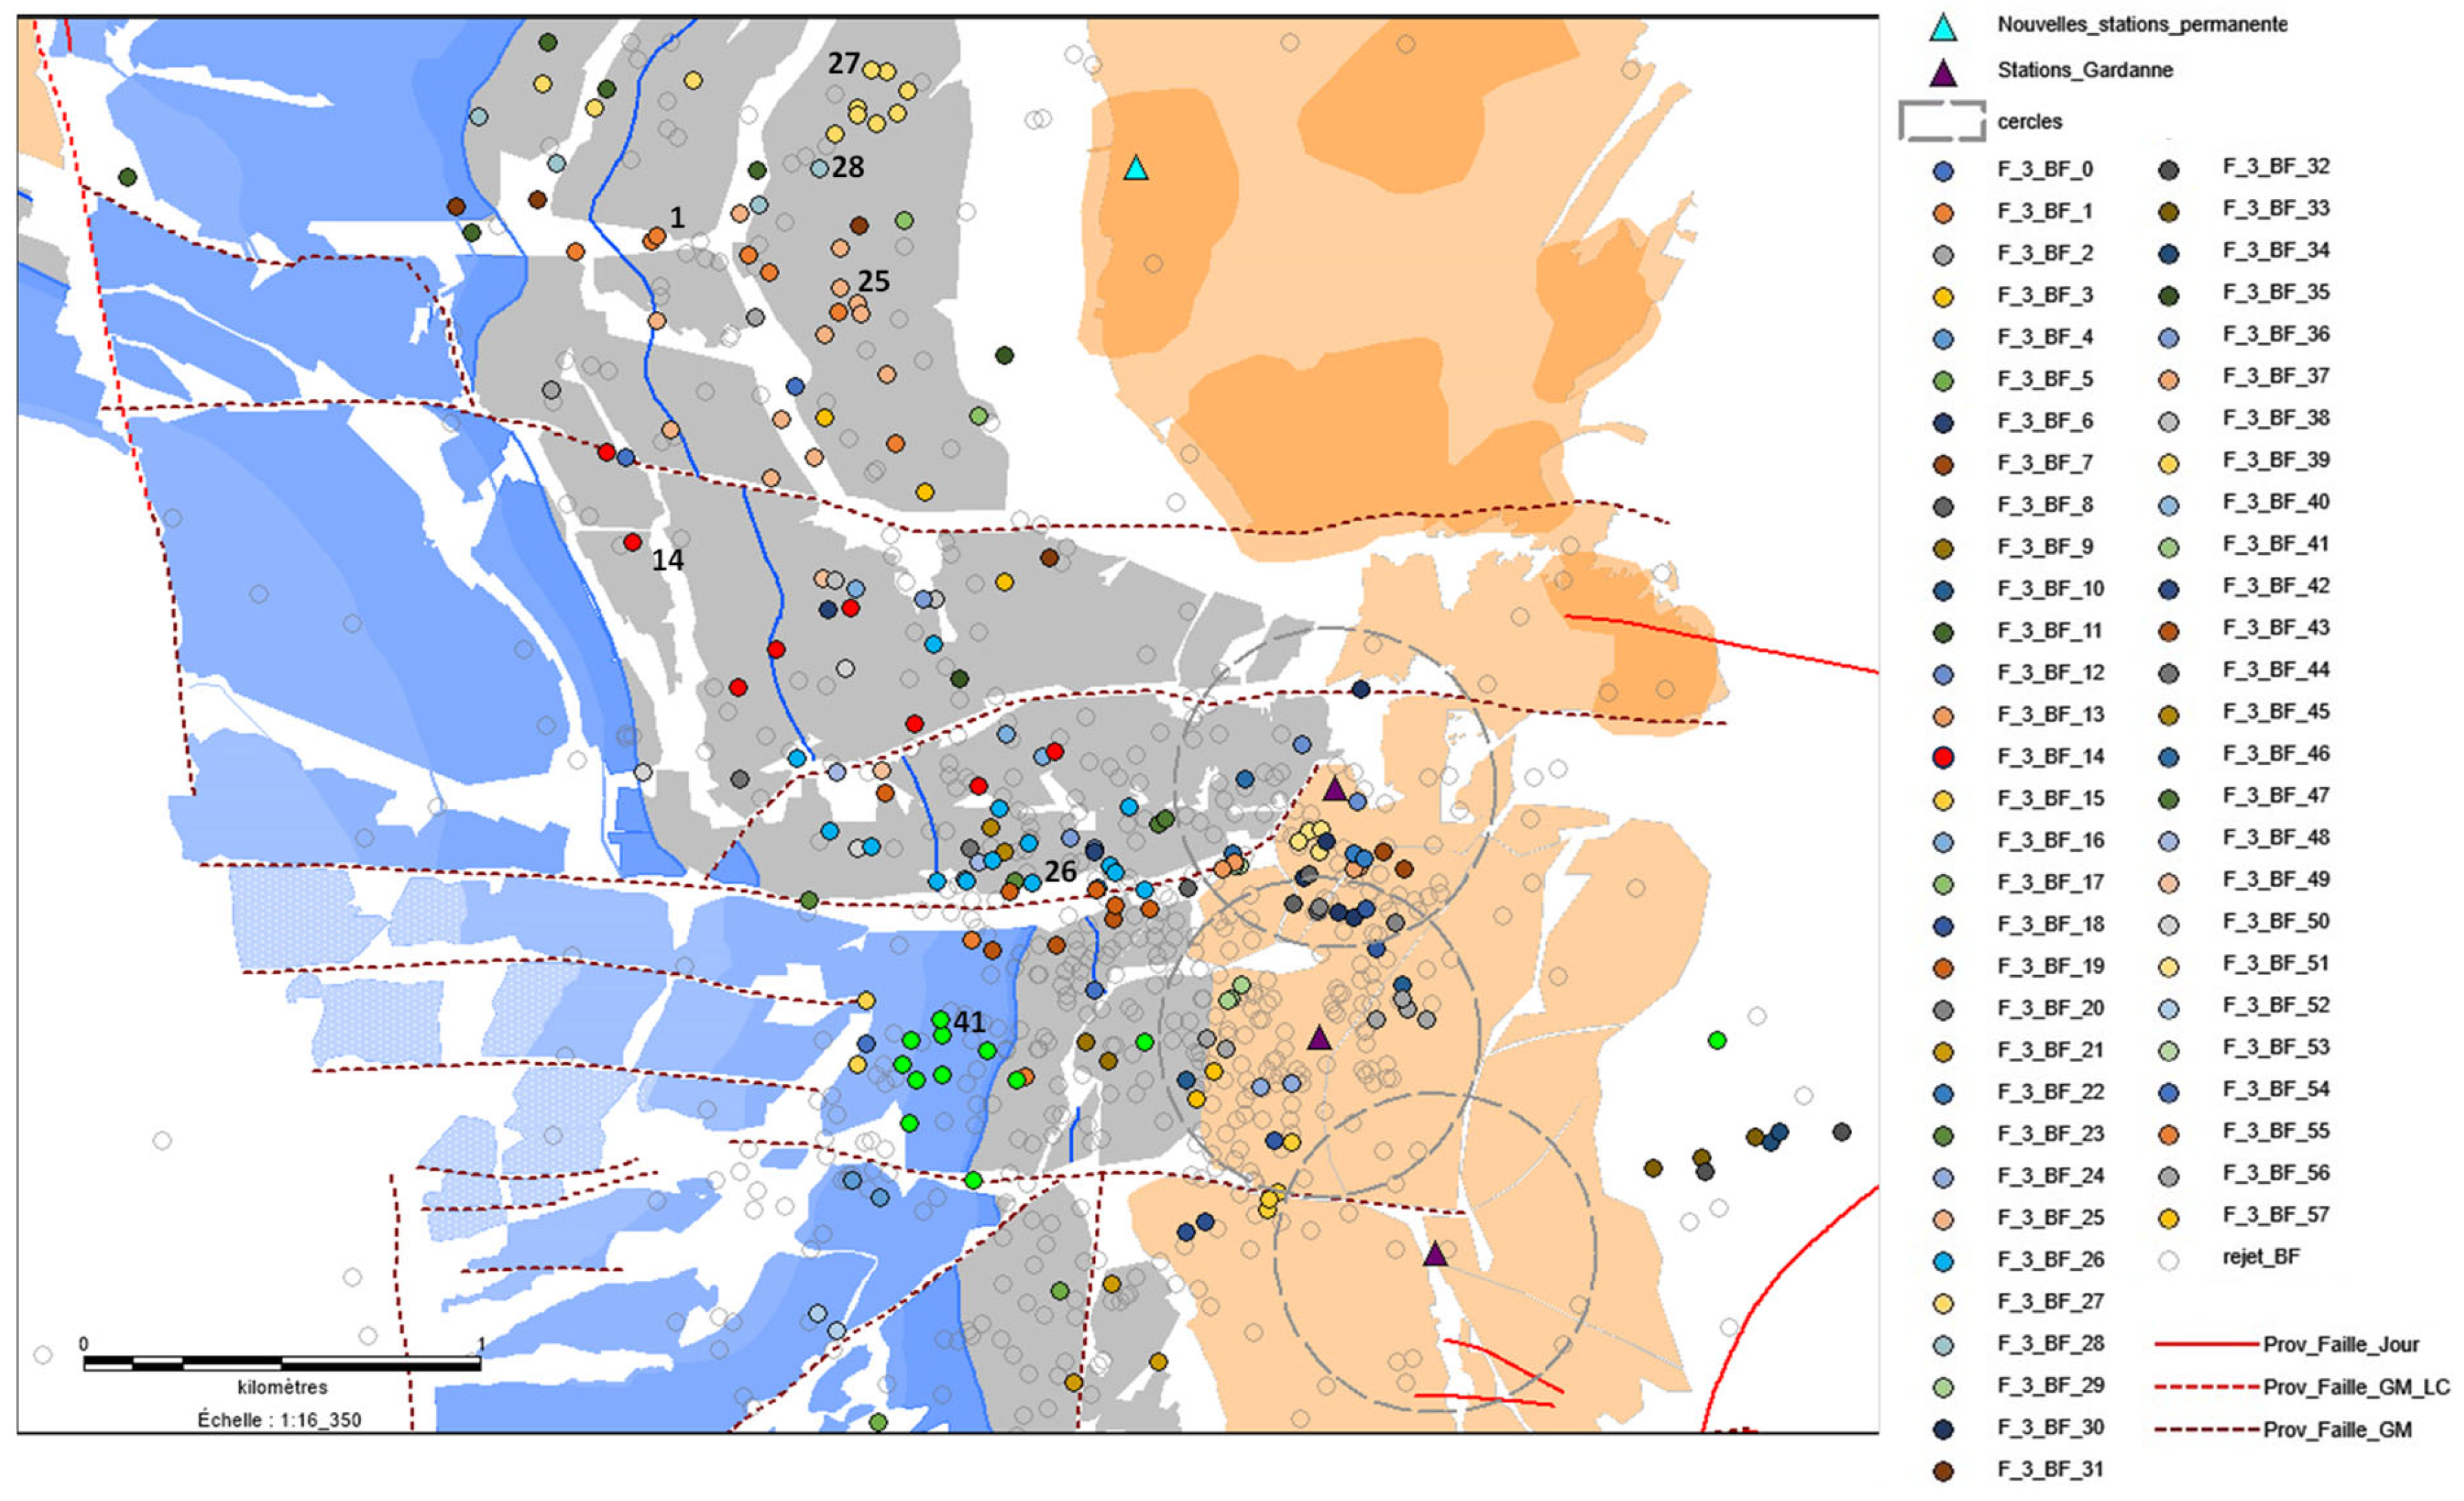
6.4.2. Results in and Around Zone 3—Cadolive–Peypin–St Savournin
The multiplet analysis was carried out on 887 events recorded by the Cadolive low-frequency probe (4.5 Hz) located at a depth of 45 m. The parametric study shows that the multiplet analysis in the 1–30 Hz frequency band for a correlation threshold of 0.8 is the optimal combination of parameters for identifying families (see
Appendix A for more details on the processing).
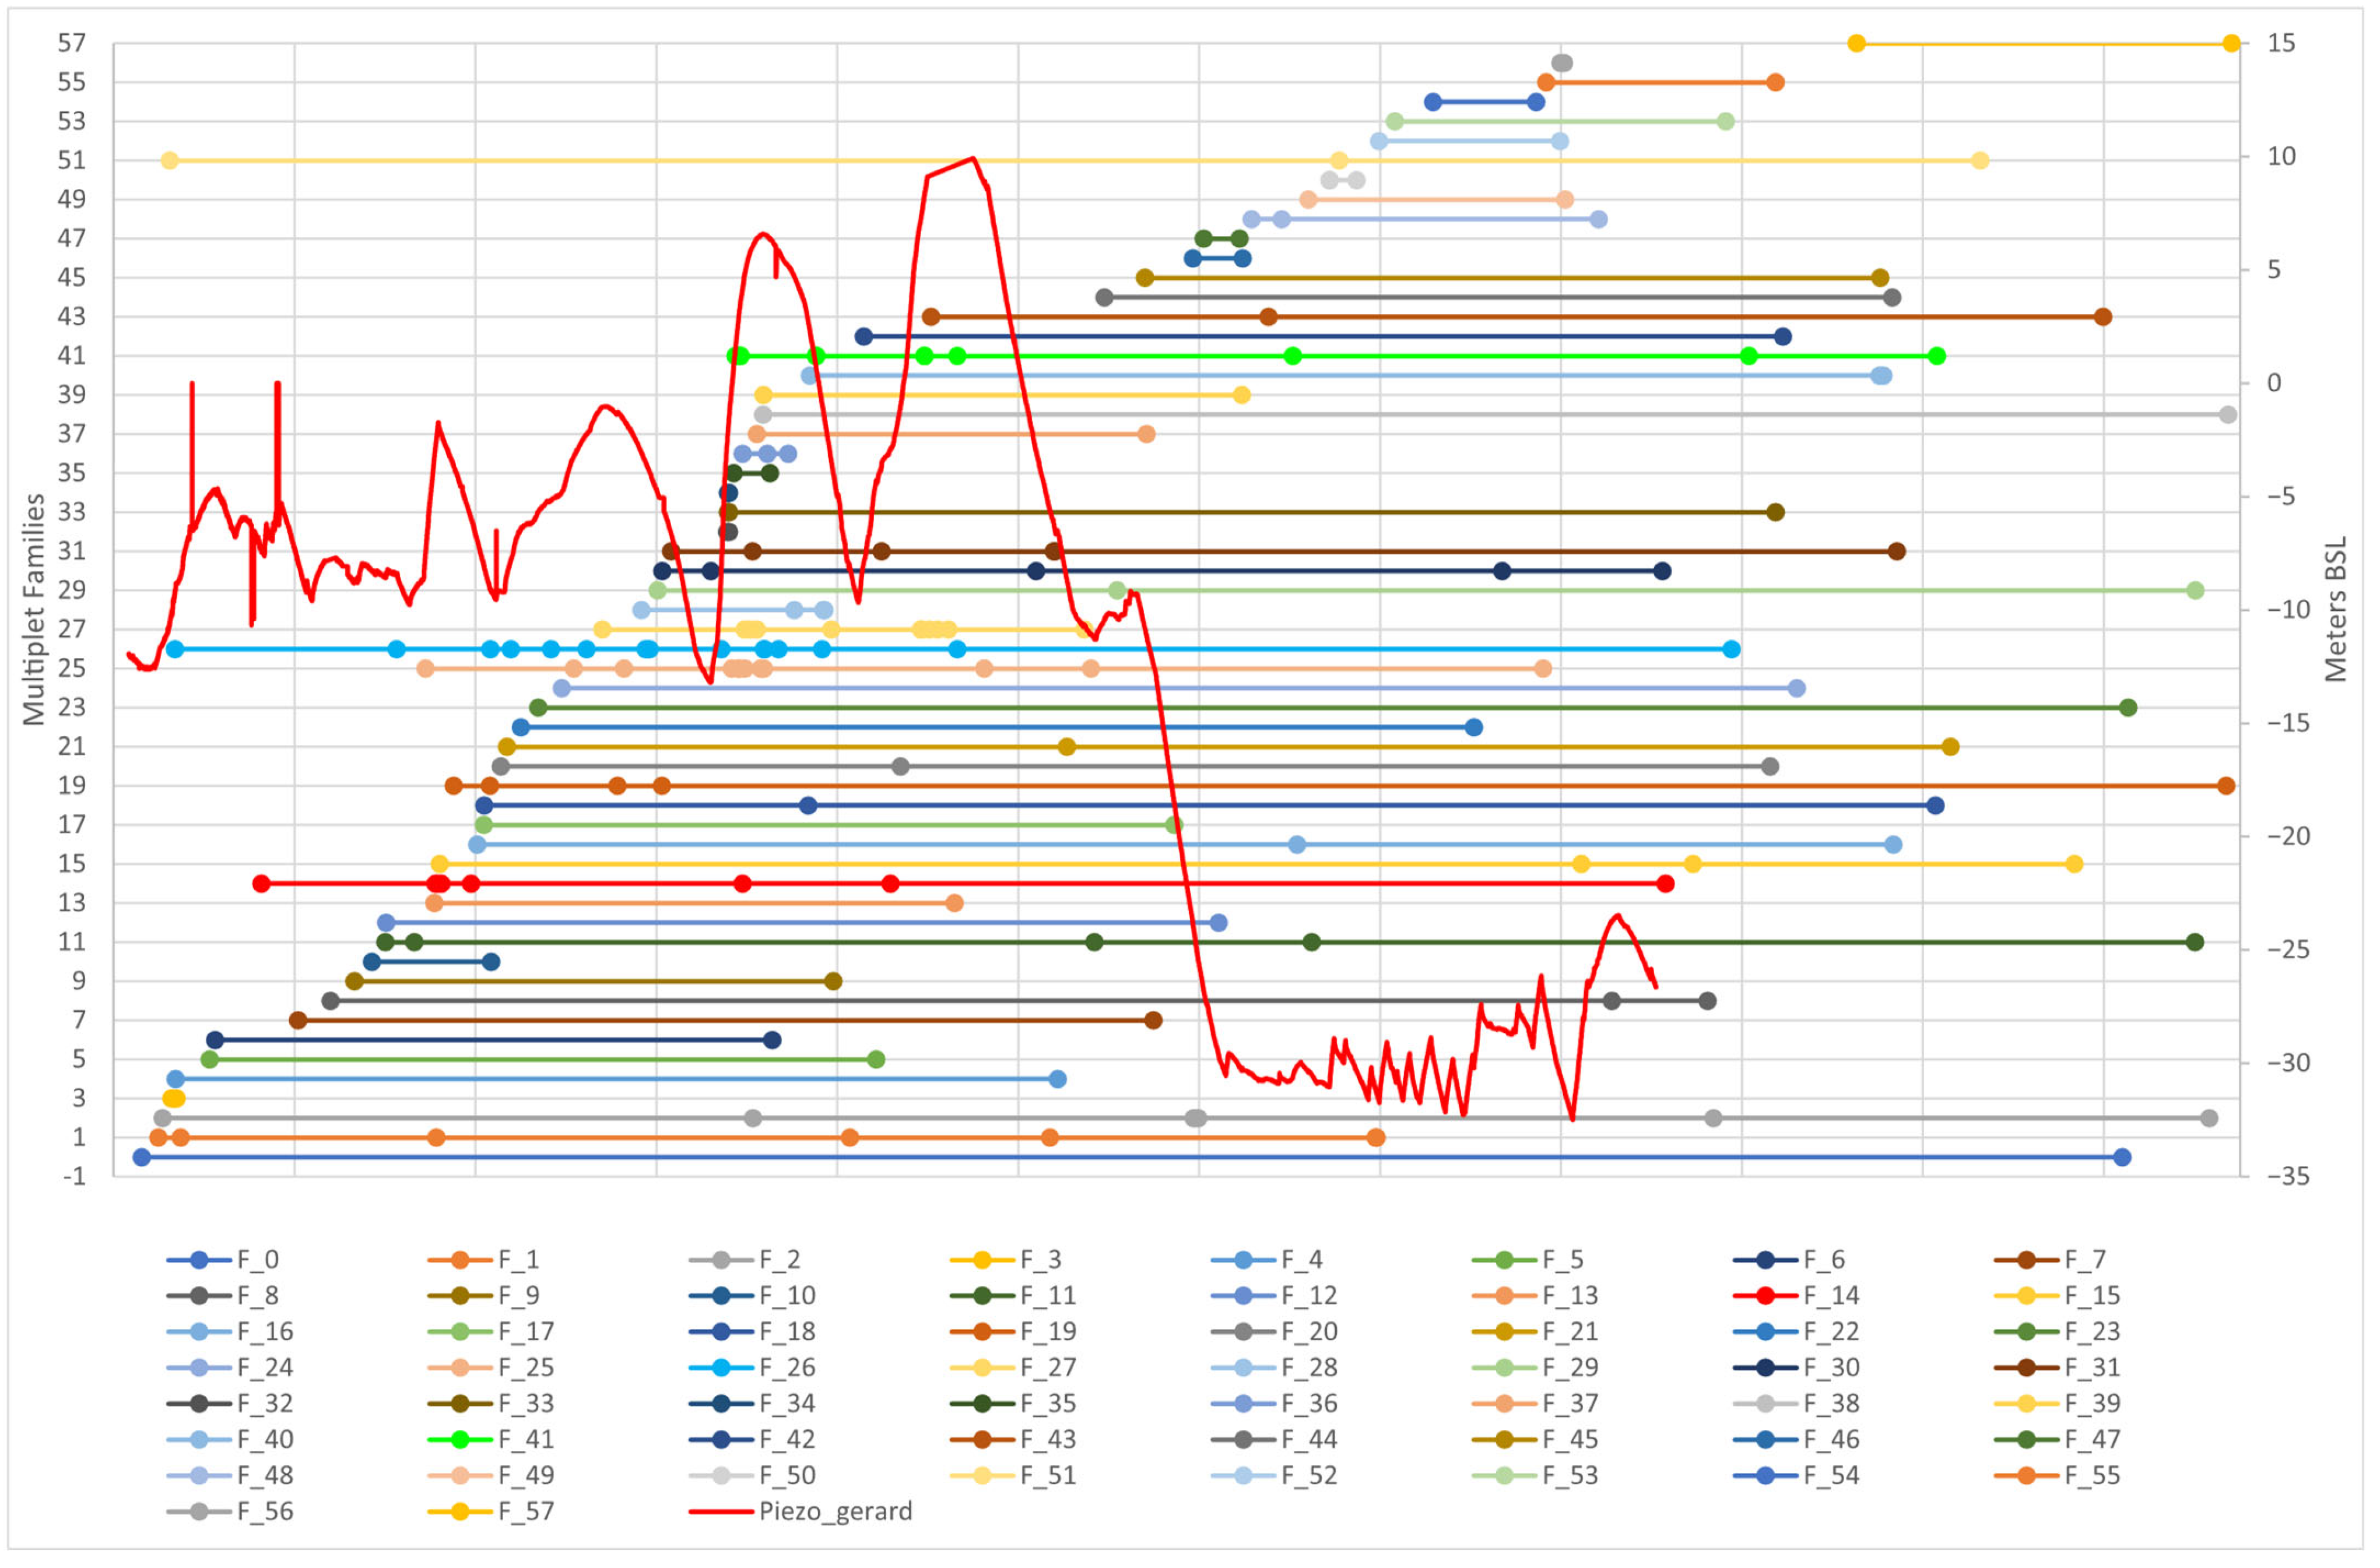
The location of these events is shown in
Figure 12, over the period from 1 October 2010 (date of commissioning of the Cadolive LF probe) to 30 June 2022. Of the 887, 204 events were classified into 57 families, or 23% of the events. Of the 57 families, 30 only have two events (
Figure 13).
The tectonic structures in the region are predominantly E-W oriented. Although the locations are tainted by errors, several multiplets, particularly those with the most events, also show this trend. This is the case, for example, of family 26, which includes 13 events (
Figure 12). It appears to follow a lineament identified in the Grande Mine layer (
Figure 12). This family persists from 2010 to 2019 (
Figure 13). The local magnitudes of this multiplet are close to 1 and can reach a maximum of 1.6.
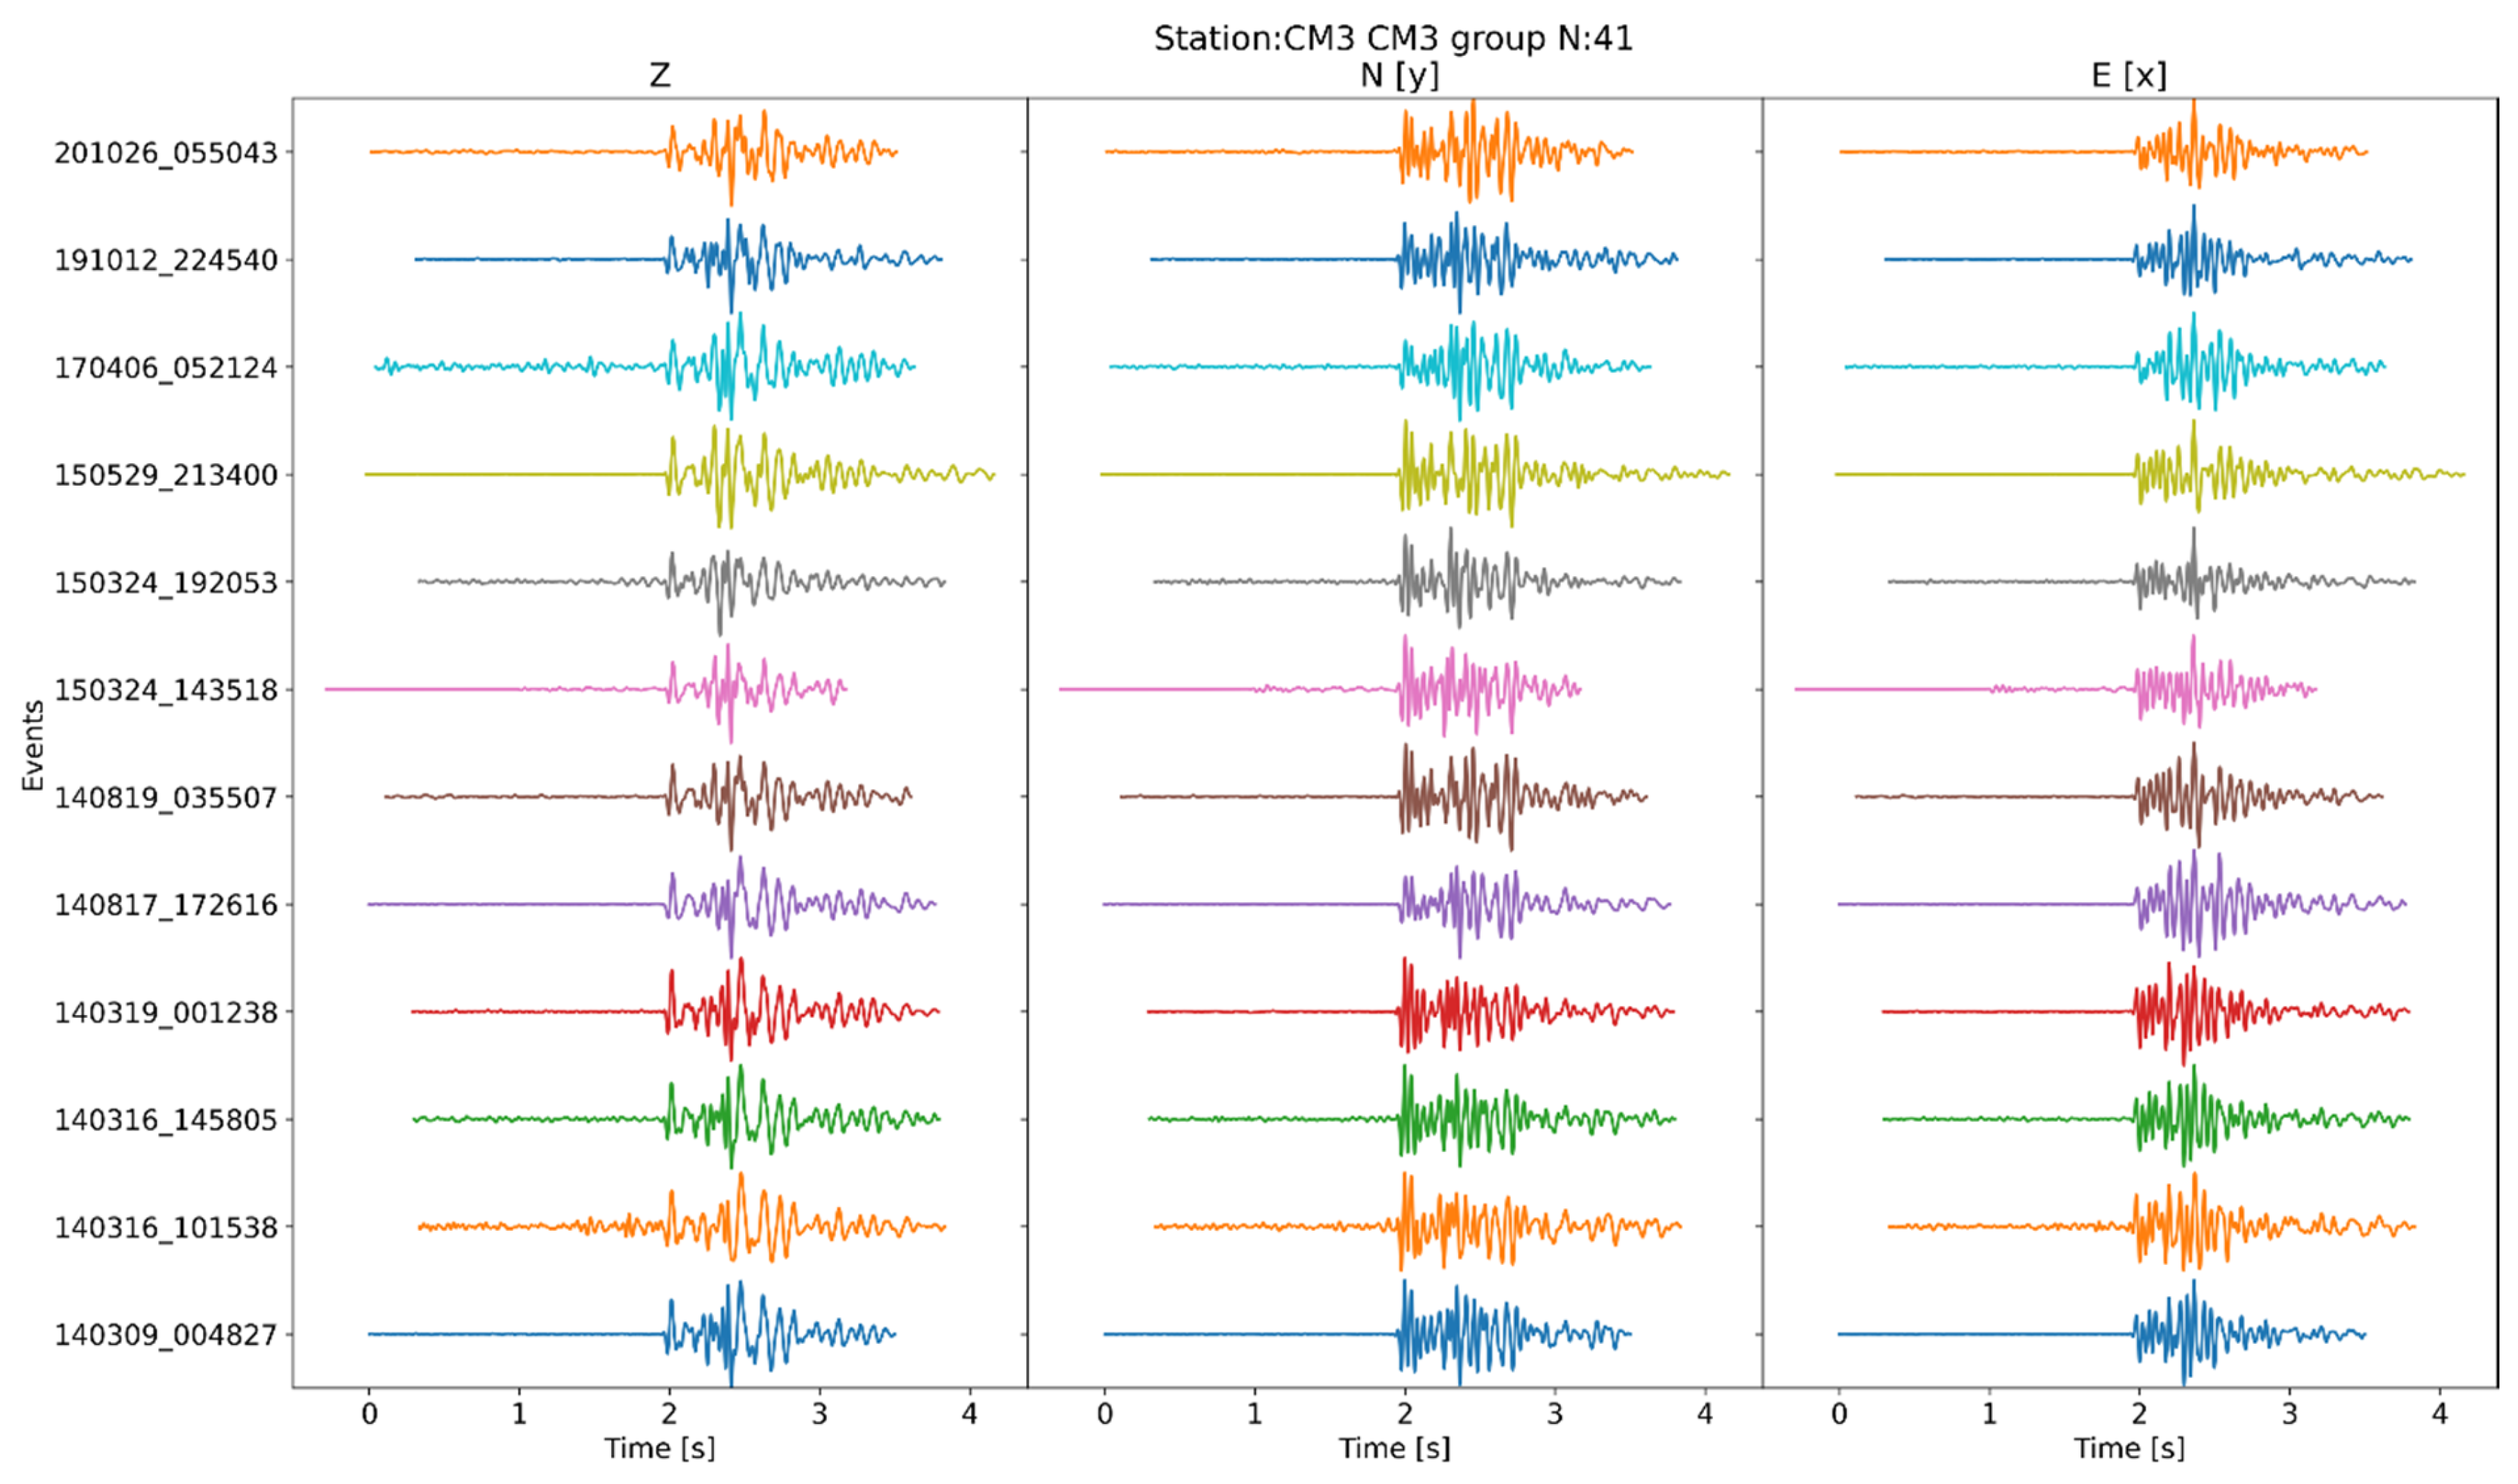
Family 41 (
Figure 14), located to the west of the Cadolive station, also shows an E-W trend (
Figure 12). It operates from 2014 to 2020 (
Figure 13) and includes 12 events with local magnitudes between 1 and 1.3. Except for localization errors, this family could be associated with one of the faults mapped in the Grande Mine layer, which includes several at this location (
Figure 12).
Without going into detail about all the families, we can cite multiplets 27, 28 and 31, which present the strongest events with local magnitudes between 1.9 and 2.1.
7. Discussion and Recommendations
Since its installation in 2008, the permanent network records seismic activity both within the designated monitoring risk zones—areas identified as being at risk of brittle subsidence by GEODERIS—and outside these zones.
Unexpected persistent seismic activity has been detected at the center of the basin, with six significant seismic episodes between 2008 and 2023, characterized by events felt at the surface, particularly in the area known as the Fuveau Swarm. Previous studies based on the analysis of the temporal correlation between this seismic activity and groundwater levels, influenced by pumping operations at the Gérard well, suggest that a major part of seismic activity is driven by fluctuations in groundwater levels [
13,
14,
16,
31]. In addition, the repetitive nature of this seismic activity has made it necessary to take into account mechanisms other than ruptures in the underground mine workings. Fault reactivation triggered by water is now considered the most likely mechanism. The main argument supporting this hypothesis is the repetitive nature of this seismicity that is highly compatible with recurrent reactivation of faults, as mining collapses occur only once.
This paper shows that fault reactivation is also a driving mechanism in the seismicity recorded in risk zones 1 and 3, as the multiplet analysis reveals that more than 20% of the events can be classified as multiplets. The locations of these multiplets are aligned with the orientation of the main faults mapped in the studied areas. Additionally, it is notable that events with the highest local magnitudes, ranging from 1 to 2, cluster into families. At this stage of the study, however, it is not possible to give precise results on the role of groundwater level variations in triggering seismic activity for risk zones 1 and 3.
This critical observation—fault reactivation—must be considered when designing seismic monitoring networks, particularly under the following conditions:
- -
The geological setting is complex, characterized by a network of faults, some of which are near failure;
- -
Mining activity has previously triggered numerous induced events that were felt at the surface.
In such cases, the monitoring network should be specifically designed to both track fault reactivation and detect early signs of surface ground movement resulting from the collapse of underground mine workings to enhance post-mining risk management. Thus, post-mining microseismic monitoring will serve a dual purpose, requiring the establishment of new monitoring criteria to achieve the following:
Detect the underground onset of mining-induced instability before surface effects, such as subsidence, occur;
Quantify surface vibration levels to assess human perception of seismic events and potential damage to buildings and infrastructure.
The key physical parameters to anticipate these phenomena include:
Local and moment magnitudes, which quantify the energy released at the earthquake source;
The number of events within a sliding time window, which helps measure the acceleration of the phenomenon;
Peak Ground Velocity (PGV), with the calculation of shaking map, which quantifies surface vibration levels independently of event magnitude, particularly relevant for shallow seismic activity [
32].
The measurements of the groundwater table level at different places in the basin as it is affected by the pumping activity and the complexity of the hydrogeological system.
Additional parameters can be integrated into the early warning system, such as the surface subsidence. But regarding subsidence hazards, while this is an important parameter, the primary goal of monitoring is to detect underground instability before it manifests at the surface. So, when the subsidence is observed, it may already be too late. Therefore, subsidence measurements should not be used alone; instead, they should be complemented by microseismic activity data to provide a more comprehensive risk assessment. However, GPS measurements can also reveal aseismic ground movements that may occur in post-mining areas. In most cases, these movements are slow enough to allow for the implementation of necessary safety measures.
Currently, in the Gardanne basin, seismic monitoring is primarily focused on detecting early signs of brittle subsidence in high-risk areas, as identified by GEODERIS in its 2003 mining hazard studies. These designated zones were revised and reduced in 2016, leading to a reconfiguration of the monitoring network in 2023. This update included the installation of two new monitoring stations in the eastern region (near Zone 2) and, in early 2024, the decommissioning of three stations in the southern area (Zone 3), where mining hazards were deemed no longer present (
Figure 4).
However, this southern area remains one of the most seismically active, even though the detected magnitudes are low. This continued activity indicates that the area is not entirely stable. Furthermore, the “Fuveau swarm” area in the center of the basin, which produces the strongest seismic events in the region, lacks sufficient instrumentation to accurately characterize surface ground movements. This situation is contradictory and suggests that decision-makers are either unaware of the post-mining seismic hazard or do not fully understand how to manage it effectively.
8. Conclusions
Since its installation in 2008, the permanent seismic monitoring network in the Gardanne basin has recorded over 4000 events, with magnitudes ranging from −3 to 3. While originally designed to detect early signs of mining-induced collapses in designated high-risk areas, unexpected seismic activity has been observed across the entire basin, including 5 notable seismic episodes between 2010 and 2017. The strongest events have occurred in the “Fuveau Swarm” area and were felt by the population.
Initially, mining collapses were considered the primary cause of seismicity, but the repetitive nature of these events suggests an alternative explanation: fault reactivation triggered by groundwater variations. Multiplet analysis presented in this study supports this hypothesis, showing that over 20% of recorded events form clusters aligned with known fault orientations. The largest magnitude events (1 to 2) also cluster into families, further reinforcing the fault reactivation theory. Other studies confirm that variations in groundwater levels are a key driver of seismic activity in the region.
This finding underscores the need to integrate fault reactivation into seismic monitoring strategies, beyond the current focus on mining-induced instabilities. Effective post-mining risk management should incorporate new monitoring criteria to achieve the following:
This conclusion leads us to recommend revising the list of post-mining hazards as defined in French regulations. France and several European countries have well-established frameworks for managing risks associated with subsidence, water pollution, and ground stability after mine closures, but risks related to post-mining seismicity are only addressed to a very limited extent: the regulatory frameworks often do not explicitly address the potential for seismic events linked to mining activities, even though these risks are increasingly documented in areas with historical mining operations. This gap in regulation highlights the need for a broader approach that integrates post-mining seismic hazards into existing risk management frameworks across Europe, ensuring more comprehensive monitoring and mitigation efforts.


