Abstract
Despite the rapid improvement in the availability and resolution of real-time electricity data, budget development processes in mining have remained relatively unchanged. Currently, there is no standard for the evaluation of mine electricity cost budgets. This study aims to determine whether forecasting processes used by mines produce budgets of sufficient quality and resolution to be used as a tool for daily energy- and cost management. A literature review was conducted to determine a set of best practices for electricity budgeting on mines. These findings were used to develop a survey to evaluate the current state of budgeting processes on South African mines. Surveys were conducted at 41 mine business units. Survey results were processed and analyzed and found that there are significant shortcomings in complying with the identified best practices. The majority of mines produced forecasts in lower resolutions than actual available data, thereby reducing their usefulness as energy management tools. The methods currently employed by mining sites are not scalable and are vulnerable to human error. Only 7% of participating business units’ budgets passed the identified best practices. Adherence to best practices, identified in this paper, will assist mines in improving electricity cost forecasts for more proactive- and sustainable energy management. This will also assist the industry in aligning with the UN Sustainable Development Goals (SDGs) of Affordable and Clean Energy (SDG 7), Industry, Innovation, and Infrastructure (SDG 9), and Responsible Consumption and Production (SDG 12).
1. Introduction
1.1. Background
Electricity costs in South Africa are generally much higher than other developing countries. The average electricity cost in South Africa is $0.19/kWh compared to an average of $0.12/kWh for neighboring countries [1].
With the cost of electricity increasing at rates above inflation, and complications in the national energy supply [2], energy management has become vital for South African mines. Mining, especially deep mining which is prevalent in South Africa, is incredibly energy-intensive, with up to 30% of mine operating costs attributed to various forms of energy use [3]. Mining companies implement energy efficiency projects to reduce their electricity usage, thereby reducing their operating costs [4].
Eskom, the sole South African national energy utility provider, uses a time-of-use (TOU) pricing structure to bill clients. Tariffs for electricity purchased from Eskom are based on the period and season of electricity usage [5]. The tariffs are higher during high demand periods, which includes peak hours on weekday mornings and afternoons, and high season winter months. The planning of when electricity will be consumed and how much electricity will be used is thus equally important for cost management.
Mines in South Africa largely use the Eskom Megaflex tariff structure. The Eskom tariff booklet [5] describes Megaflex as a “TOU electricity tariff for urban customers with a notified maximum demand (NMD) greater than 1 MVA”. Charges include active energy charges subject to electricity consumption and TOU, and less flexible transmission, distribution, administration and service charges, as well as subsidies.
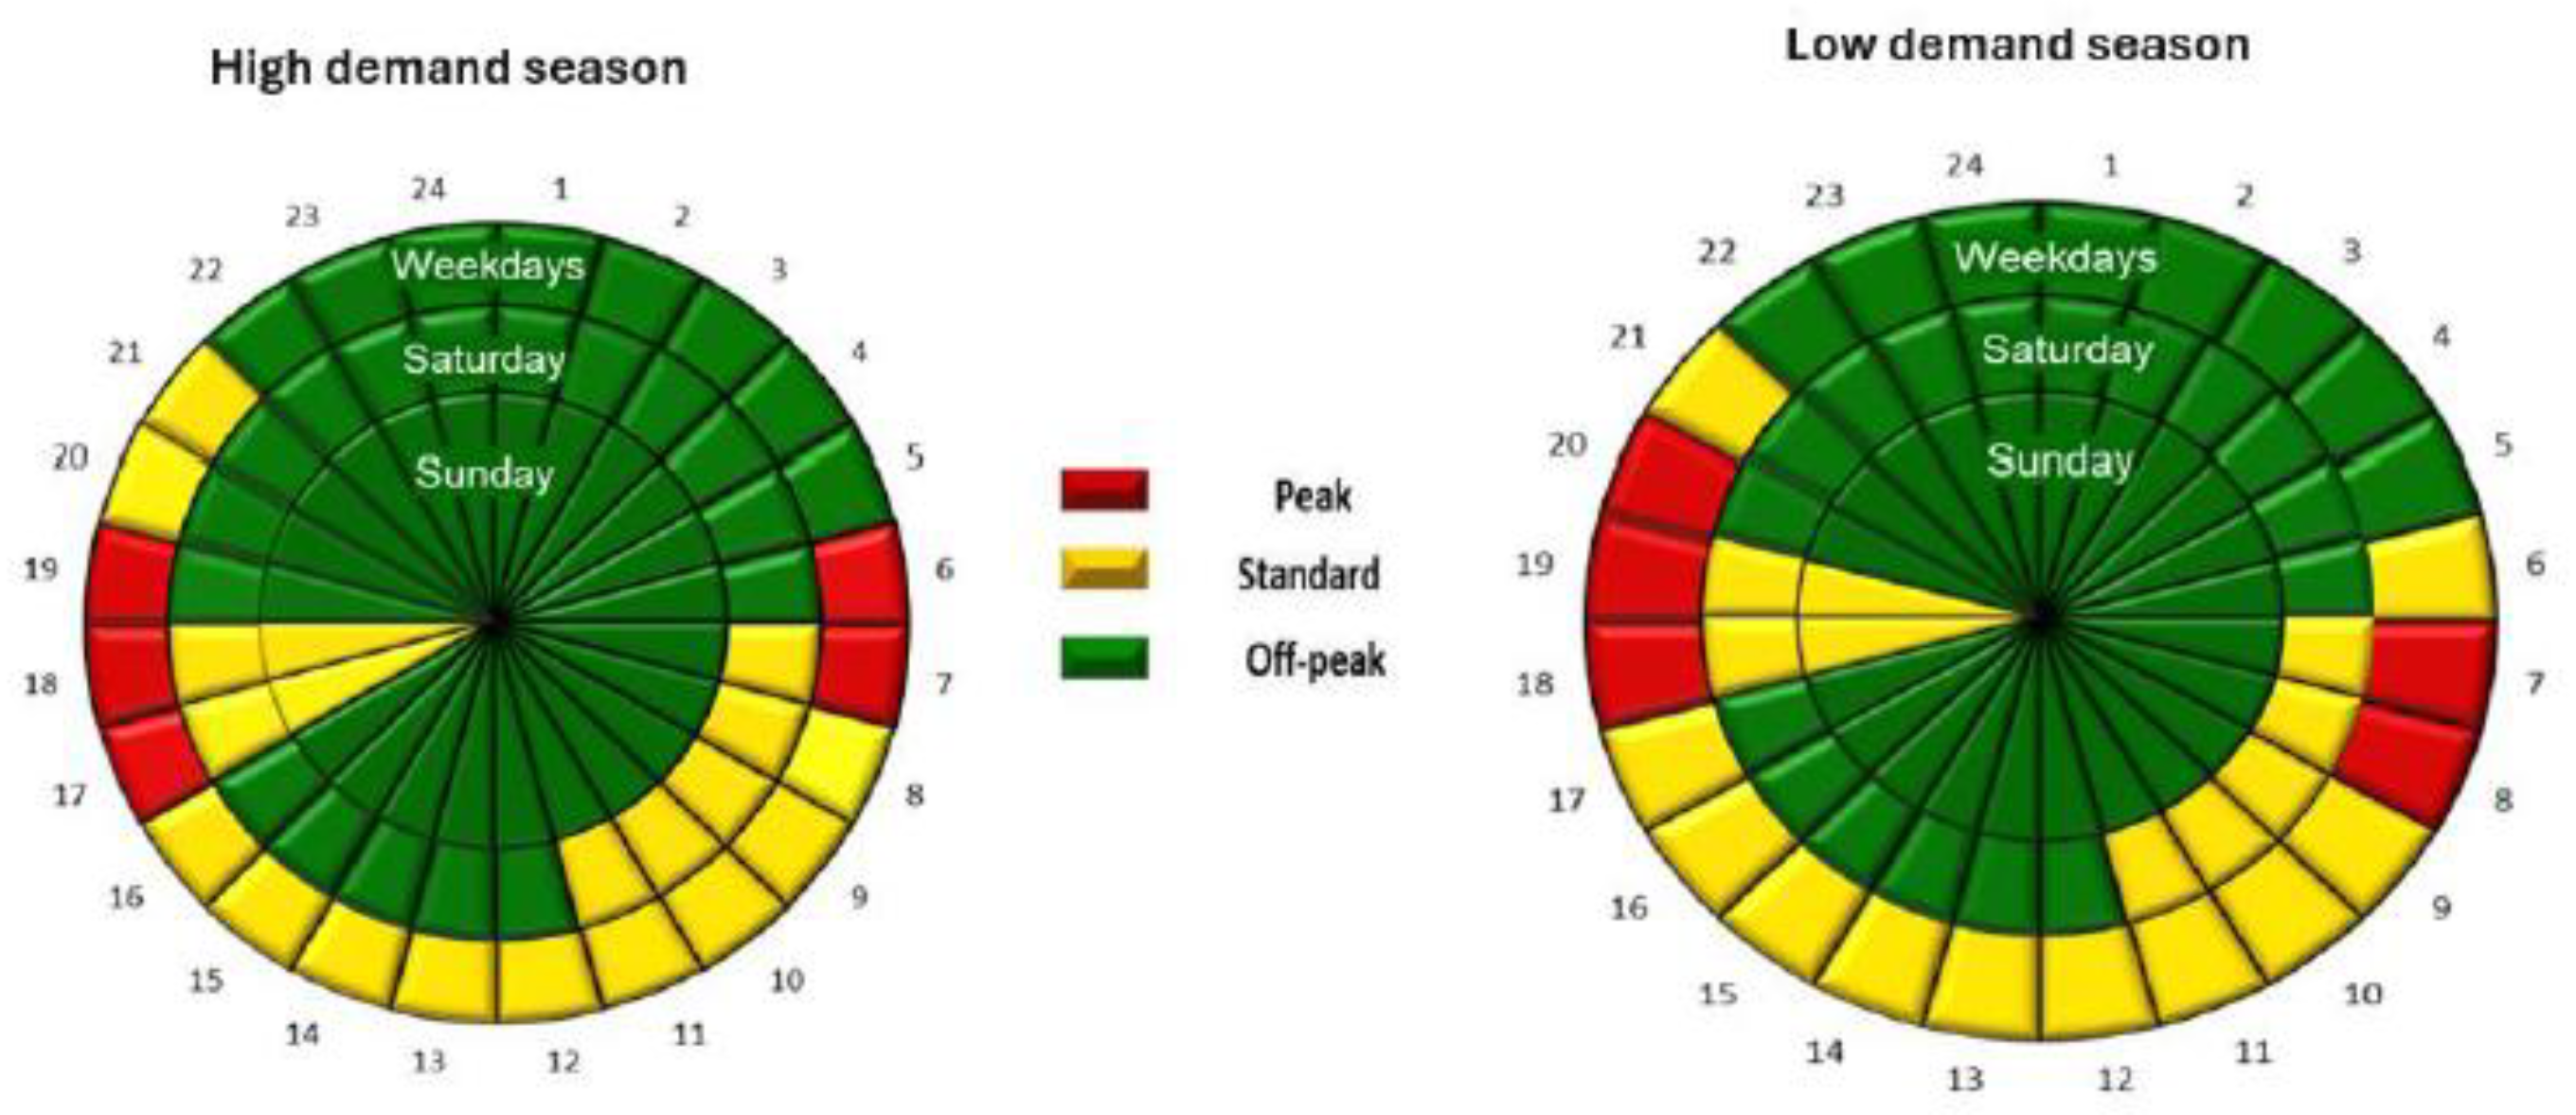
Figure 1 shows the hourly distribution of the Eskom TOU peak-, standard- and off-peak periods for the two billing seasons, namely high demand (June to August) and low demand (September to May).

Figure 1.
Eskom TOU time periods [5].
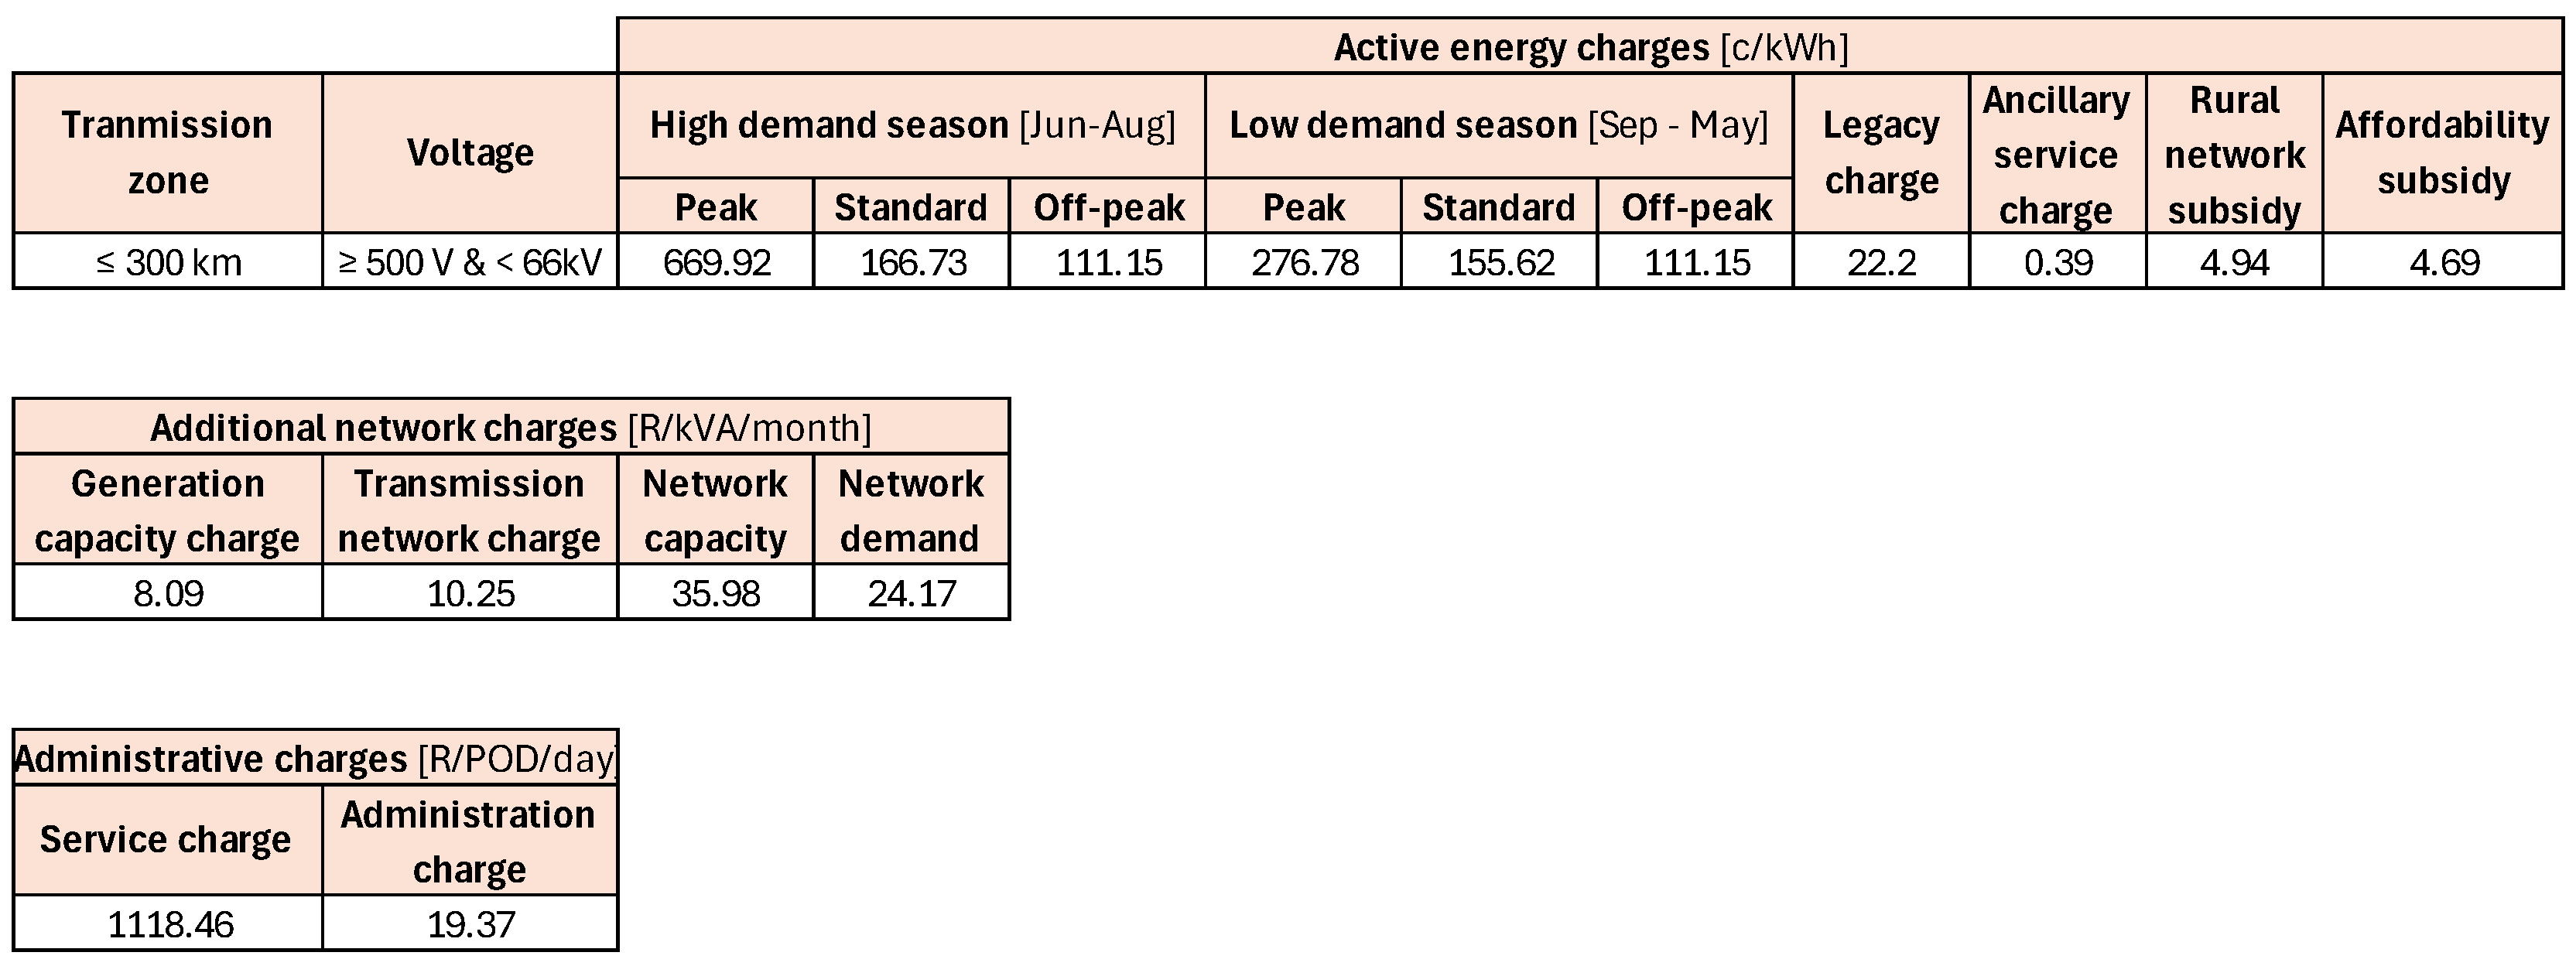
Figure 2 below summarizes the Megaflex tariff charges (in ZAR currency). These tariffs were effective as of 01 April 2025. Active energy charges are applied to all kWh units utilized by the consumer. This includes the TOU charge according to time and season, as well as legacy, ancillary service, rural network subsidy and affordability subsidy charges. Additional network charges are applied to the whole point of distribution (POD) for kVa load consumptions and allowances, and additional administrative charges are applied to the POD on a cost per day basis.
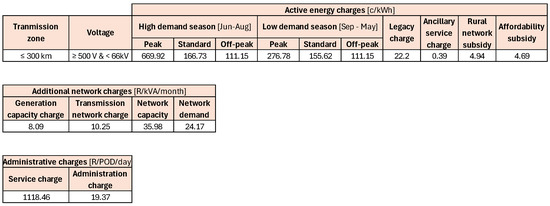
Figure 2.
Eskom Megaflex tariffs (taken from [5]).
Costs are grouped by transmission zone (distance from nearest distribution center) and by voltage.
Electricity budgeting is a form of energy-and cost forecasting commonly used on mines in South Africa. Mines and other industries use budgets to plan for future electricity consumption and related costs [6]. South African mines are under significant financial pressure, thus the focus on accurate cost forecasting is greater than ever [7].
Utility companies bill mines monthly for their electricity usage. Historically, monthly budgets are configured for each POD using these billing values. These budgets are often not sufficiently adjusted for year-on-year changes in operation and TOU, do not include detailed budget profiles, and lack detailed tariffs.
The electricity usage of a mine is evaluated at month-end with the use of the developed budget [8]. These evaluations are used for planning but fall short as a comprehensive energy management tool.
In recent years, there have been noticeable improvements in the quality and availability of data on mines [9,10]. Mines are realizing the value of good information, not just data, and are investing in the gathering, storage and processing thereof. Most South African mines now have real-time data available for energy intensive systems. This data is often used for performance monitoring and impact assessment in energy savings initiatives. There is an opportunity to use this real-time data to assist with proactive energy management.
To gain insight from real-time data, context is important. Electricity budgets are used to contextualize data and provide an electricity consumption forecast for operations. High resolution electricity budgets would allow for energy management to take place on a half-hourly basis, rather than monthly.
1.2. Problem Statement
Industry observations point toward a discrepancy between the quality of actual electricity consumption data and electricity cost forecasts. Budgets and actual data need to be of comparable frequency and quality to allow for real-time electricity cost and usage evaluations. Currently, no standard exists for the evaluation of deep mine electricity cost budgets, and no previous studies have evaluated the effectiveness of the budgets.
1.3. Aim & Scope
This study aims to evaluate whether current budgeting practices used by the mining industry in South Africa are delivering budgets that are effective tools for electricity usage and cost evaluations. To achieve this, a novel set of best practices for the process of electricity cost budgeting on deep mines will be constructed from literature and compared with survey results from a variety of mining operations.
The difference between best practices and industry standards will be discussed, along with the benefits of developing a framework and standards for high-frequency, high-quality budgets. The results will highlight potential areas for development for future studies on improved mine electricity cost forecasting.
2. Literature on Mine Electricity Cost Forecasting
2.1. Search Strategy
The aim of this review section is to identify and evaluate existing electricity budgeting practices in both the South African mining sector and other heavy industries globally to understand the importance of electricity cost forecasting and to identify important criteria for successful electricity budgeting.
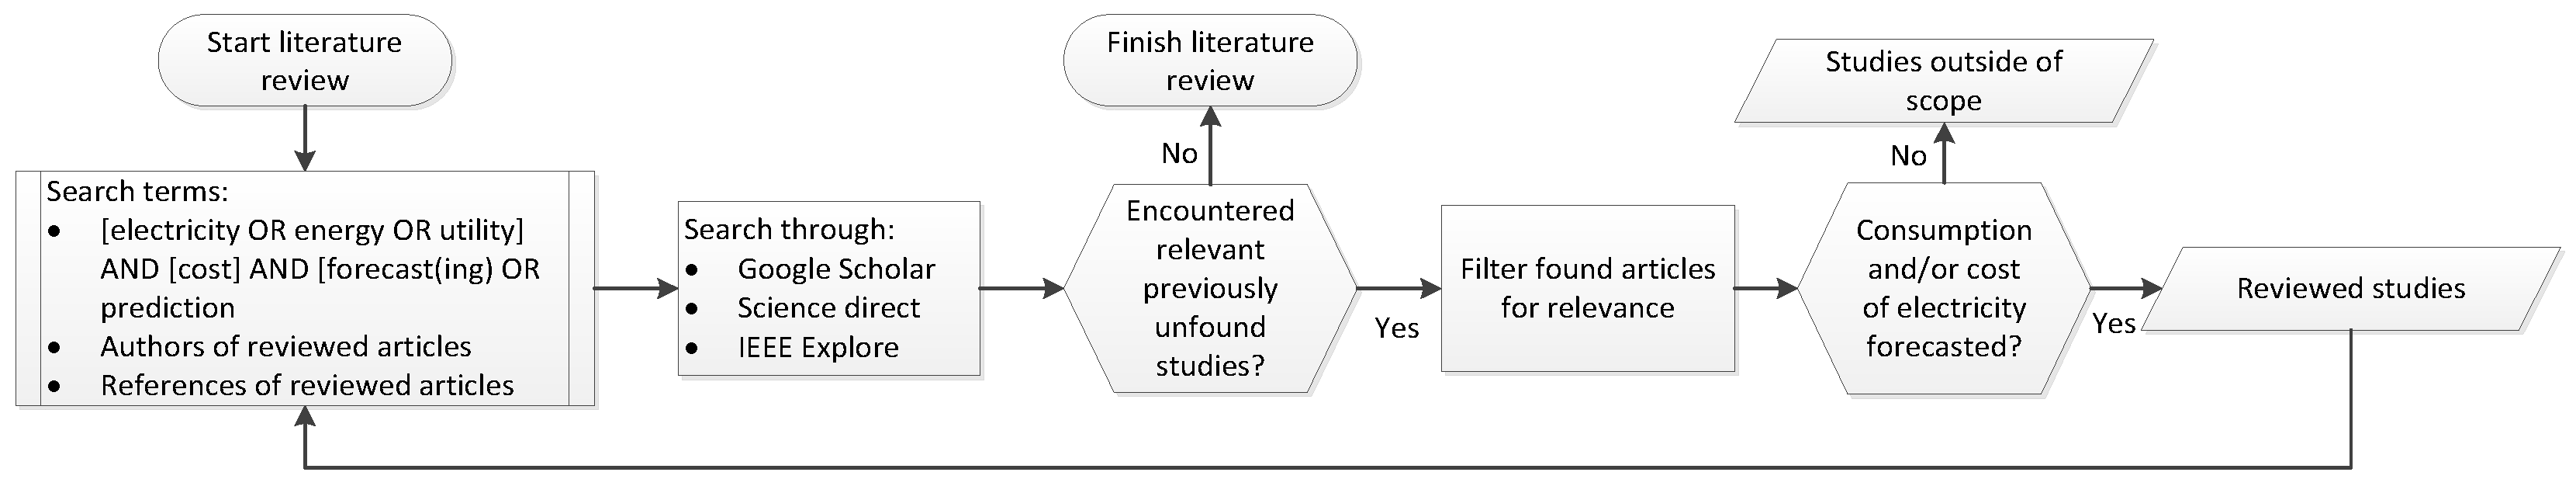
Figure 3 details the search strategy employed to find relevant literature.
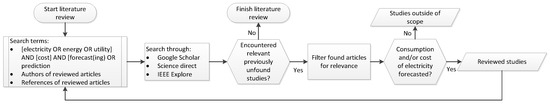
Figure 3.
Literature search strategy.
2.2. Existing Electricity Cost Budgets
The aim of this review section is to evaluate existing electricity budgeting practices in both the South African mining sector and other heavy industries to identify important criteria for successful electricity forecasting.
Shortcomings of current electricity budgeting practices in mining are identified and improvements are proposed in the following section to improve current mine electricity budgeting practices.
This review considered studies related to the forecasting of electricity usage and the forecasting of electricity cost. Studies on the impact of renewables on these parameters were excluded as it is not relevant to the study topic.
Mysatakidis et al. [11] provides a comprehensive review of the critical role of electricity forecasting in energy management. It enables both utilities and consumers to plan for and balance energy generation and consumption. The study finds that there is growing complexity in the techniques available for forecasting in the energy sector. This reinforces the need to evaluate whether available techniques from literature are being applied within the South African mining industry.
Several industries employ energy budgeting as a financial forecasting method such as education [12], city planning [13], healthcare [14] and mining [15]. Electricity consumption forecasting is done both by consumers, to anticipate costs, and by producers to anticipate future demand [13,16,17,18,19,20].
From these studies, several trends in the practice of electricity cost forecasting emerge. Previous usage patterns are used to predict energy usage in future. Most studies recommend contextual grouping of historical data, for instance separating by season and by use type. Several of the studies noted above also use complex models such as machine learning and deep neural networks to match previous usage to forecasted future scenarios.
Studies [13,16,17,18,19,20] forecasted energy usage for electricity production planning, not for electricity consumption. Krishnamurthy et al. [21] investigated advanced methods for production planning in South Africa and found that there is need for smart energy resource management. The study is focused on providing grid stability through forecasting to eliminate practices such as demand side management. While the broader method of forecasting is applicable to the topic of this study, the application of the studies is not as mines are primarily electricity consumers and not producers.
Studies [16,17,18,20] only focused on improving electricity demand and production prediction through several advanced forecasting methods. The studies did not mention the cost of electricity, which is important to the scope of this study.
Zhao et al. [19] forecasted electricity cost in systems where electricity cost is variable, driven by user demand in real-time and not predetermined as is the case in South Africa.
Vassiljeva et al. [22] developed an electricity usage forecasting method for administrative buildings that combines detailed consumption-based profiles with schedule-based predictions.
Most of the studies are focused on creating a model for electricity forecasting, but not on the implementation of the model in practice.
Two studies attempted to improve the current budgeting and electricity costing processes used by mines. Pelser [23] put forth a methodology likening the steps of budget development to measurement and verification (M&V) methods, and proposed improvements to the steps. Goosen [24] suggested improvements to the budget costing methods used by mines. The study implemented TOU and the Megaflex costing structure from Eskom which resulted in improved cost estimations.
Table 1 outlines six steps, distilled from the studies discussed to this point, for developing electricity cost budgets in heavy industries, including mining

Table 1.
Steps of the budgeting process according to literature [23].
These steps are a simplification of how electricity budgets are developed. However, they will be used to structure the literature review. Each of the steps in Table 1 were evaluated, and literature was used to determine how each of these can best be applied for the goal of electricity usage forecasting.
Literature on existing cost budgets found that electricity cost forecasting is widely used and that industry puts emphasis on the importance of electricity cost budgeting. Few studies focused on mining, and none evaluated the application of available literature in industry. In this section, the literature on cost forecasting in budgets will be evaluated and expanded upon to identify criteria for evaluation of the quality of budgets used on South African mines.
2.2.1. Step 1: Inform
The first step of budget creation is boundary selection. For boundary selection, Pelser [23] produces a decision tree to choose between a whole facility evaluation and a component isolation. Energy management and performance evaluation is not taken into consideration for the choice. The ideal boundary on which to develop an electricity budget is per energy intensive system. This is due to energy management evaluations being focused on isolated energy intensive systems rather than the full facility or individual components [25,26]. Meters are mostly installed on feeders rather than on individual components so that operation can switch between components as required, allowing for outages and maintenance without data loss.
The decision tree uses two conditions to decide the budget resolution. First, whether the budget will be used for performance evaluation, and second, whether the component has varying operation throughout a day. As this study aims to improve budgets so they can always be used for performance evaluation the developed budget resolution should be at least as high as that of the available operational data.
Using the electricity budgets to evaluate performance in real-time is priority for this study, as well as improving daily associated budgeting costs. Eskom TOU tariffs are separated by the hour and notified maximum demand (NMD) is evaluated half-hourly. Hourly is thus the lowest possible resolution on which budgets can contain accurate cost information [5]. The ideal resolution for an electricity budget is therefore hourly or higher to account for the different tariffs throughout the day, and half-hourly for accurate semi real-time cost forecasts.
2.2.2. Step 2: Data
The second step of budget creation is data acquisition and evaluation. The data should be traceable to a calibrated meter, evaluated for consistency and additionally checked for outliers or unplanned events.
It is important that the input data is of the highest possible quality. Ideally this data should come from a calibrated meter and should undergo some data analysis before being used. Using poor input data for forecasting results in poor prediction accuracy [27].
Electricity usage data should be used as the main input to the electricity budget. There is little correlation between production and electricity used by the mine [23]. This is due to several energy-intensive processes operating independently of the mining of material. Production tonnages (tons mined) should rather be used to plan for rock hoisting and processing estimates, as these activities are directly correlated to the material mined and treated [28]. Electricity usage data is therefore the most suitable input for electricity budget development while production data can be used to develop budgets for systems directly related to material processing or hoisting.
2.2.3. Step 3: Evaluate
In the evaluate step of the budgeting process, adjustments are made to the established baseline. Planned operational changes and energy savings initiatives should be included in the electricity budget. Historic electricity consumption can be adjusted according to planned future interventions. When budgeting, relevant data should be used to plan for these expected changes. Increases and decreases should be planned for according to equipment additions or removals, using the rated capacities, running hours and schedules of the relevant equipment. Knowledge of equipment additions and removals, new mining areas and up- or downscaling is required. All this data is available to mines and should thus be used. Deviations between previous developed budgets and actual electricity usage can be used to identify areas where adjustment may be required.
Scaled increases using production values can be used for processing plants and for hoisting systems [28].
This step requires thorough year-ahead planning and specialized knowledge of the operation. This could pose problems for budget development if projects and initiatives are not planned that far ahead, or if the budget developer is not involved enough in future planning for the operation.
2.2.4. Step 4: Develop
In the development step of the budgeting process, information gathered in the previous three steps is combined. It is important that budget development be done by someone with adequate knowledge of the mining operations. As discussed in Step 3, a minimum level of knowledge of planned mine changes and energy efficiency initiatives are required to develop an accurate electricity budget.
Real-time data is available to most mines [29]. TOU tariffs can thus be accounted for in the electricity budget development. Changes in TOU between the baseline period and future budget period, for instance leap day or the number of weekends in a billing month, should be considered during the budget development phase, and consequently adjusted for as they may have impacts on planned operation.
The method of budget development should be scalable so that high detail budgets can be developed regardless of the size of the operation. The scalability and adaptability of the budgeting method is important when electricity forecasting is done, especially with large data sets [30,31].
2.2.5. Step 5: Convert
This step entails assigning a cost to the budget developed in Step 4. Costing of an electricity budget must be done according to the relevant Eskom costing structure used by the mine, typically Megaflex [24]. To use the Megaflex tariff structure, budgets should be developed per utility POD, as this is the measurement used for billing. Electrical feeders for energy intensive systems on a mine are typically downstream of the POD and the sum of the electricity usage of the feeders should add back up to the electricity usage of the POD. Developing a budget per energy intensive system is possible in this configuration.
The Megaflex tariff structure is comprised of a set of active energy costs, per kilowatt hour (kWh) used, reactive energy charges, demand charges and fixed costs, independent of electricity consumption [5]. Active energy costs can be directly applied to electricity consumption. Fixed costs can be added to systems by weight to ensure that the sum of the systems and total mine are equal. The resulting costs should be itemized according to the Eskom structures for maximum transparency.
For the proposed electricity budget, costing of active energy should be done per system. Not all systems have the same usage patterns but still needs to be incorporated into the electricity budget to account for all operating conditions. For example, systems with load shifting projects that operate outside of peak periods have significantly lower costs than systems that operate consistently during peak periods.
Consequently, the forecasted costs can be divided by the forecasted electricity usage to determine the effective tariff (R/kWh) for each system.
2.2.6. Step 6: Report and Approve
The final step of the electricity budgeting process is reporting and approval. This entails documenting the budgeting process and its outcomes, and validation of the resulting budget.
It is essential that the developed budgets undergo a validation process to ensure the development was done accurately and transparently. Past budgets and actual data can be used to check that the budget is within the expected boundaries. It is also important that the results from the electricity budgets are traceable. Deviations from past usage patterns, as well as changes due to TOU should be documented.
Final approval of the developed budgets is critical and needs to be presented to a wide variety of personnel across multiple disciplines. Results should be presented in a concise format and should also be visualized for easy and effective reporting [32].
This literature study provides an analysis of current budgeting practices, combined with actual data and resource availability. The electricity cost budget is designed to be an effective tool for proactive energy management. This literature review of electricity budgeting processes identified shortcomings that, when addressed, could enhance the efficiency of electricity cost budgets in mining operations and improve overall energy management.
2.3. Summary of Literature
Six steps for budget development relevant to mining operations in South Africa were identified from literature. These steps provide a realistic framework for the development of high-quality budgets, but existing implementation falls short of the quality and availability of real-time data in mining. For budgets to be relevant and comparable to real-time data, they should have various inputs.
One such input is data representing the electricity consumption of an energy-intensive system on the mine, in at least hourly intervals. This data should also be traceable to a verifiable source.
With this data, the following method should be followed:
- Adjustments to the baseline electricity usage data should be made using knowledge of planned increases in electricity consumption by each energy-intensive system. Adjustments should also be made to account for changes between the TOU of the baseline period and the future period being budgeted for. All this should be overseen by a person with in-depth knowledge of the electricity usage patterns of the mine. This method should ultimately be easily scalable. Costs should then be assigned to the electricity budget using the relevant utility costing structure.
The resulting electricity cost budget should then be verified and finalized in the following manner to produce a usable output:
- The developed budget should be validated using past data and knowledge about planned future changes to ensure its accuracy. Changes made to the input data should be well documented. The validated budgets and supporting documents should thereafter be approved by a responsible entity. The budget should be reported in an easily accessible manner using visual mediums.
The steps identified from literature fit into three components, namely:
- Input: The collection and evaluation of all data and information required for the budgeting process.
- Method: The processing of the data collected in the “Input” into electricity profiles and costs.
- Output: The presentation of the results of the “Method” to relevant parties.
Each step also involves a measure of quality control. Within each component, certain criteria must be met to ensure a high-quality budget that is usable for energy management. Criteria for each of these steps, and survey questions to determine whether best practices are met, are presented in the following section.
3. Methods
This study used a mixed methods approach to determine the best practices for electricity cost budgets on mines in order to establish criteria for efficient mine budgets. Qualitative and quantitative methods are combined in the form of a literature review, survey design, and interviews. The resulting data is analyzed and discussed in Section 4.
3.1. Determining Best Practices for Electricity Cost Budgets on Mines
This section uses the information gathered in the literature study to determine a set of best practices for electricity cost forecasting on mines. The identified best practices are used to compile a survey to determine the quality of budgets currently used on mines.
The steps of budget development as discussed in the literature review, can be divided into three components: Input, Method, and Output. Table 2 below shows how the literature sections fit into each component.
Table 2.
Electricity budget component contents aligning with the criteria from literature.
A few additional points are highlighted under each component to effectively evaluate the current budgeting methods applied in practice. These points are gathered from literature and industry standards, evaluated in the literature study. This is done to ensure accurate, traceable and scalable electricity budgets are developed which can be applied for effective energy and cost management in the mines.
The application of this methodology is limited to the budgeting processes of South African mines, as well as to the relevant personnel involved in the processes.
3.1.1. Input
The budget input provides a starting point, where data to construct the budget is gathered and where a boundary is selected. A successful budget should employ the following best practices for its input:
- (a)
- Budgets should be developed per energy intensive system.
- (b)
- Input data should be in a half-hourly resolution.
- (c)
- Input data should be of verifiable quality.
- (d)
- Electricity usage data should be used for most systems. Production data can be used for systems directly related to processing or hoisting.
- (e)
- Relevant data should be used to adjust the historic electricity usage baseline.
For the input, direct questions can be asked to determine the boundary and data resolutions. This covers the boundary and resolution of the output as well. For data quality a checklist of possible data quality interventions can be used. A checklist can also be used to evaluate the input data, as there is only a set number of possibilities. How planned changes are currently budgeted for should also be discussed as this will provide the surveyor with insight of the methods used and how to evaluate them. A combination of multi-answer and single-answer questions will be used to evaluate each.
3.1.2. Method
The method section of the budget includes the compilation of the input data into a budget, adjustments for planned changes in operation and the costing of the electricity budget. The following best practice steps should be employed:
- (a)
- Budgets should be developed by a person with established knowledge of the energy management systems of the mining operation.
- (b)
- Time-of-use should be accounted for in the development of the electricity budget.
- (c)
- Tariff structures from the relevant utility company should be used to assign costs to electricity forecasts. In the case of most South African mines this is the Eskom Megaflex tariff structure.
- (d)
- The budgeting method should be scalable and adaptable.
- (e)
- Developed budgets (electricity and cost) should be validated before being presented for use.
For the method section, a checklist can be used to determine the person responsible for budget development. Whether TOU is used and whether the budget is validated are binary yes or no questions. How costing is done is again a question that needs to be discussed. The surveyor needs to gain an understanding of the whole process as well as the tariffs and breakdowns used. To gain an understanding of the adaptability and scalability of the budget is difficult, as it is not easily quantifiable. The survey can ask how time intensive the budgeting process is, or how tedious the process is. Budgeting processes that take a lot of time and are tedious are unlikely to easily scale to large systems.
A combination of empirical and open-ended questions will be required to gain a well-rounded understanding of the mine budgeting method.
3.1.3. Output
The output section of the budget outlines how the budget should be checked, approved and presented. The following steps are the best practices according to literature for the output of a mine electricity budget:
- (a)
- The developed budget should be available per energy intensive system.
- (b)
- The developed budget should be available in at least an hourly resolution.
- (c)
- Costs and effective tariffs should be available per energy intensive system and should have different tariffs according to their operation.
- (d)
- Planned deviations from historic electricity usage patterns should be well documented for traceability.
- (e)
- Developed budgets should be presented in a concise manner and visualized in an appropriate way for the intended audience.
The three components of budget development are therefore now linked. High quality input data is required for all steps in the method, and a high-quality result from the method is required for a high-quality output to be achieved.
Some of the output points can be deduced from questions in the input section, namely the resolution and boundary of the budget. To determine if costing is split and how, the question should be followed up by options to ensure that the costs are not just split by percentage usage. To determine what records are kept on budgeting and how budgets are reported on, the survey can ask for an example on how the budget is presented. This will determine whether a record of changes was given, whether visualizations were used, and if the presentation is varied according to the recipient.
The output section of the survey will be comprised of binary yes or no questions, single-answer questions, and discussion questions to understand the final budget result.
3.2. Survey Development
The identified best practices were converted into survey questions to be used to determine mines’ adherence to the established best practices.
The initial survey was composed in a narrative format, following the flow of the input, method, and output best practices as identified in this section.
Empirical and binary questions were included, where the participant is expected to select only one answer. Open-ended questions are included to allow for discussion of budget practices and to promote a better understanding of the budgeting process for the interviewer. Accepted answers within the open ended questions are provided, and multiple answers may be selected.
The initial survey (Appendix A) comprised 15 questions, five per section. The questions in Table 3 represent an edited version of the questionnaire that was distributed to obtain the results in Section 4. The questions were condensed where results overlapped to present the most concise set of results without losing the detail of information that was obtained. Letters in brackets ( ) refer to the best practices from Section 3.1.1, Section 3.1.2 and Section 3.1.3 addressed by each question.
Table 3.
Survey question allocations to evaluate electricity budget quality.
Participants were selected from a mine energy management company who represents several large mining groups in South Africa. After obtaining informed consent, the surveys were sent to the participants and the data collected over a period of two months by the first author. The surveys were performed in the form of interviews between the participants and the first author. Participants were guided through completion of the questionnaire during the interview.
Survey participants were selected according to the following criteria:
- At least two years of experience with mine budget cycles.
- Have some knowledge of the entire budget development process.
To prevent bias, the survey aimed to present the participants with clear, neutral questions based only on the findings from the literature. All results were collected anonymously.
The complete survey is presented in Appendix A.
4. Industry Performance vs. Best Practice Results
The survey constructed in Section 3 was used to evaluate whether the budgeting procedures of 41 mine business units deliver a high-quality budget that is comparable with available real-time electricity usage data. The mining operations used to evaluate the industry performance form part of the leading mining companies in South Africa and play an important role in the country’s Gross Domestic Product (GDP).
Representatives of several South African deep-level gold and platinum mines were identified to participate in this survey. All representatives are involved in some capacity in the electricity cost budgeting process of the business unit they represent. The problem being investigated by this paper was discussed briefly with each participant before commencing with the survey. After answering the questions, deviations from the literature best practices and reasons for their occurrence were discussed.
Findings of the application of this survey are presented in the next three sections.
4.1. Input
This section discusses the outcomes of the application of the Input questions of the survey developed in Section 3. Both multiple choice, single answer and discussion questions were used to evaluate the data utilized as input for development of electricity cost budgets on the relevant mines. The results per identified best practice as presented in Section 3 are discussed below.
- (a)
- Most of the mines surveyed (78%) develop budgets per energy intensive system. The remaining sites develop them per feeder or for the whole POD. To pass, the input data should be split at least per feeder, as 85% of the mines have done.
- (b)
- The utilization of monthly input data during the budgeting processes was most prominent. Only seven mines used half-hourly data as input for their budgeting process. Input data needs to be half-hourly to align with best practices.
- (c)
- The surveys found that the input data used to develop electricity cost budgets on mines is generally of high quality. All the mines surveyed contract third party metering companies where data quality is a contractual obligation. For half of the business units, data is from calibrated meters. For best practices, at least two data quality checks should be present in the process.
- (d)
- The majority of sites (78%) used electricity usage data to account for planned changes. Some of the surveyed sites (9/41) uses production data as the only input for their budget development and did not align with best practices.
- (e)
- 78% of the surveyed sites utilized planned electricity usage increases to plan for future changes, while 9 of the 41 sites relied on production scaling. Production scaling for systems other than hoisting and processing is not in line with best practices.
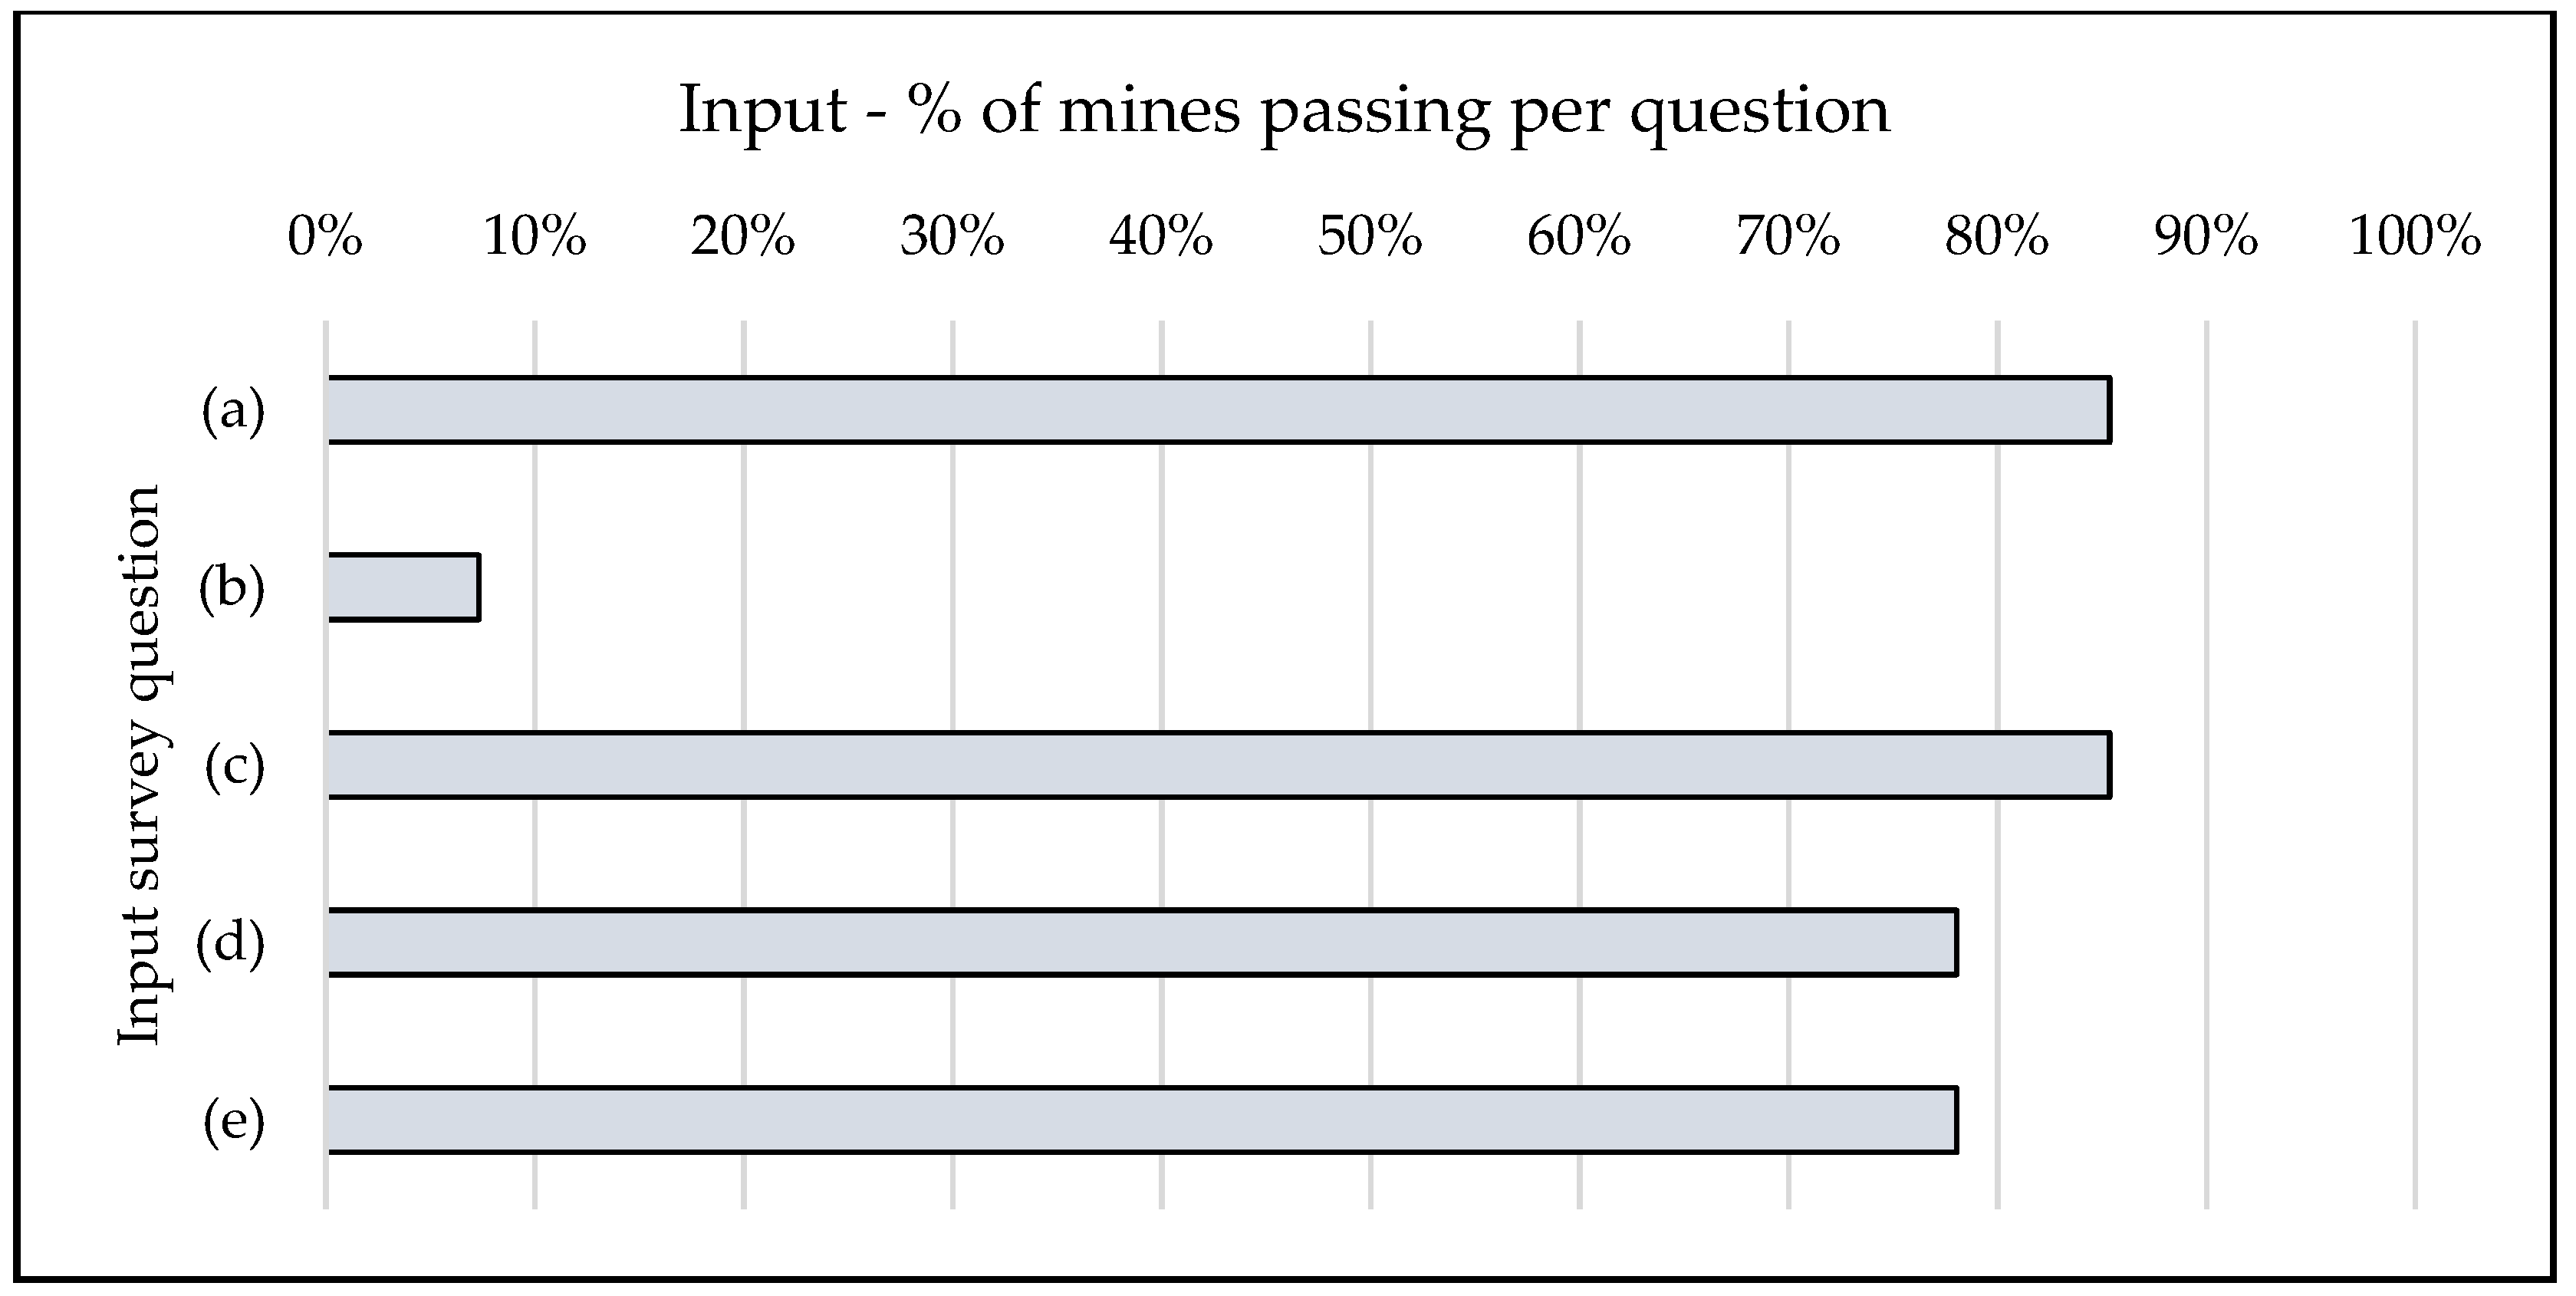
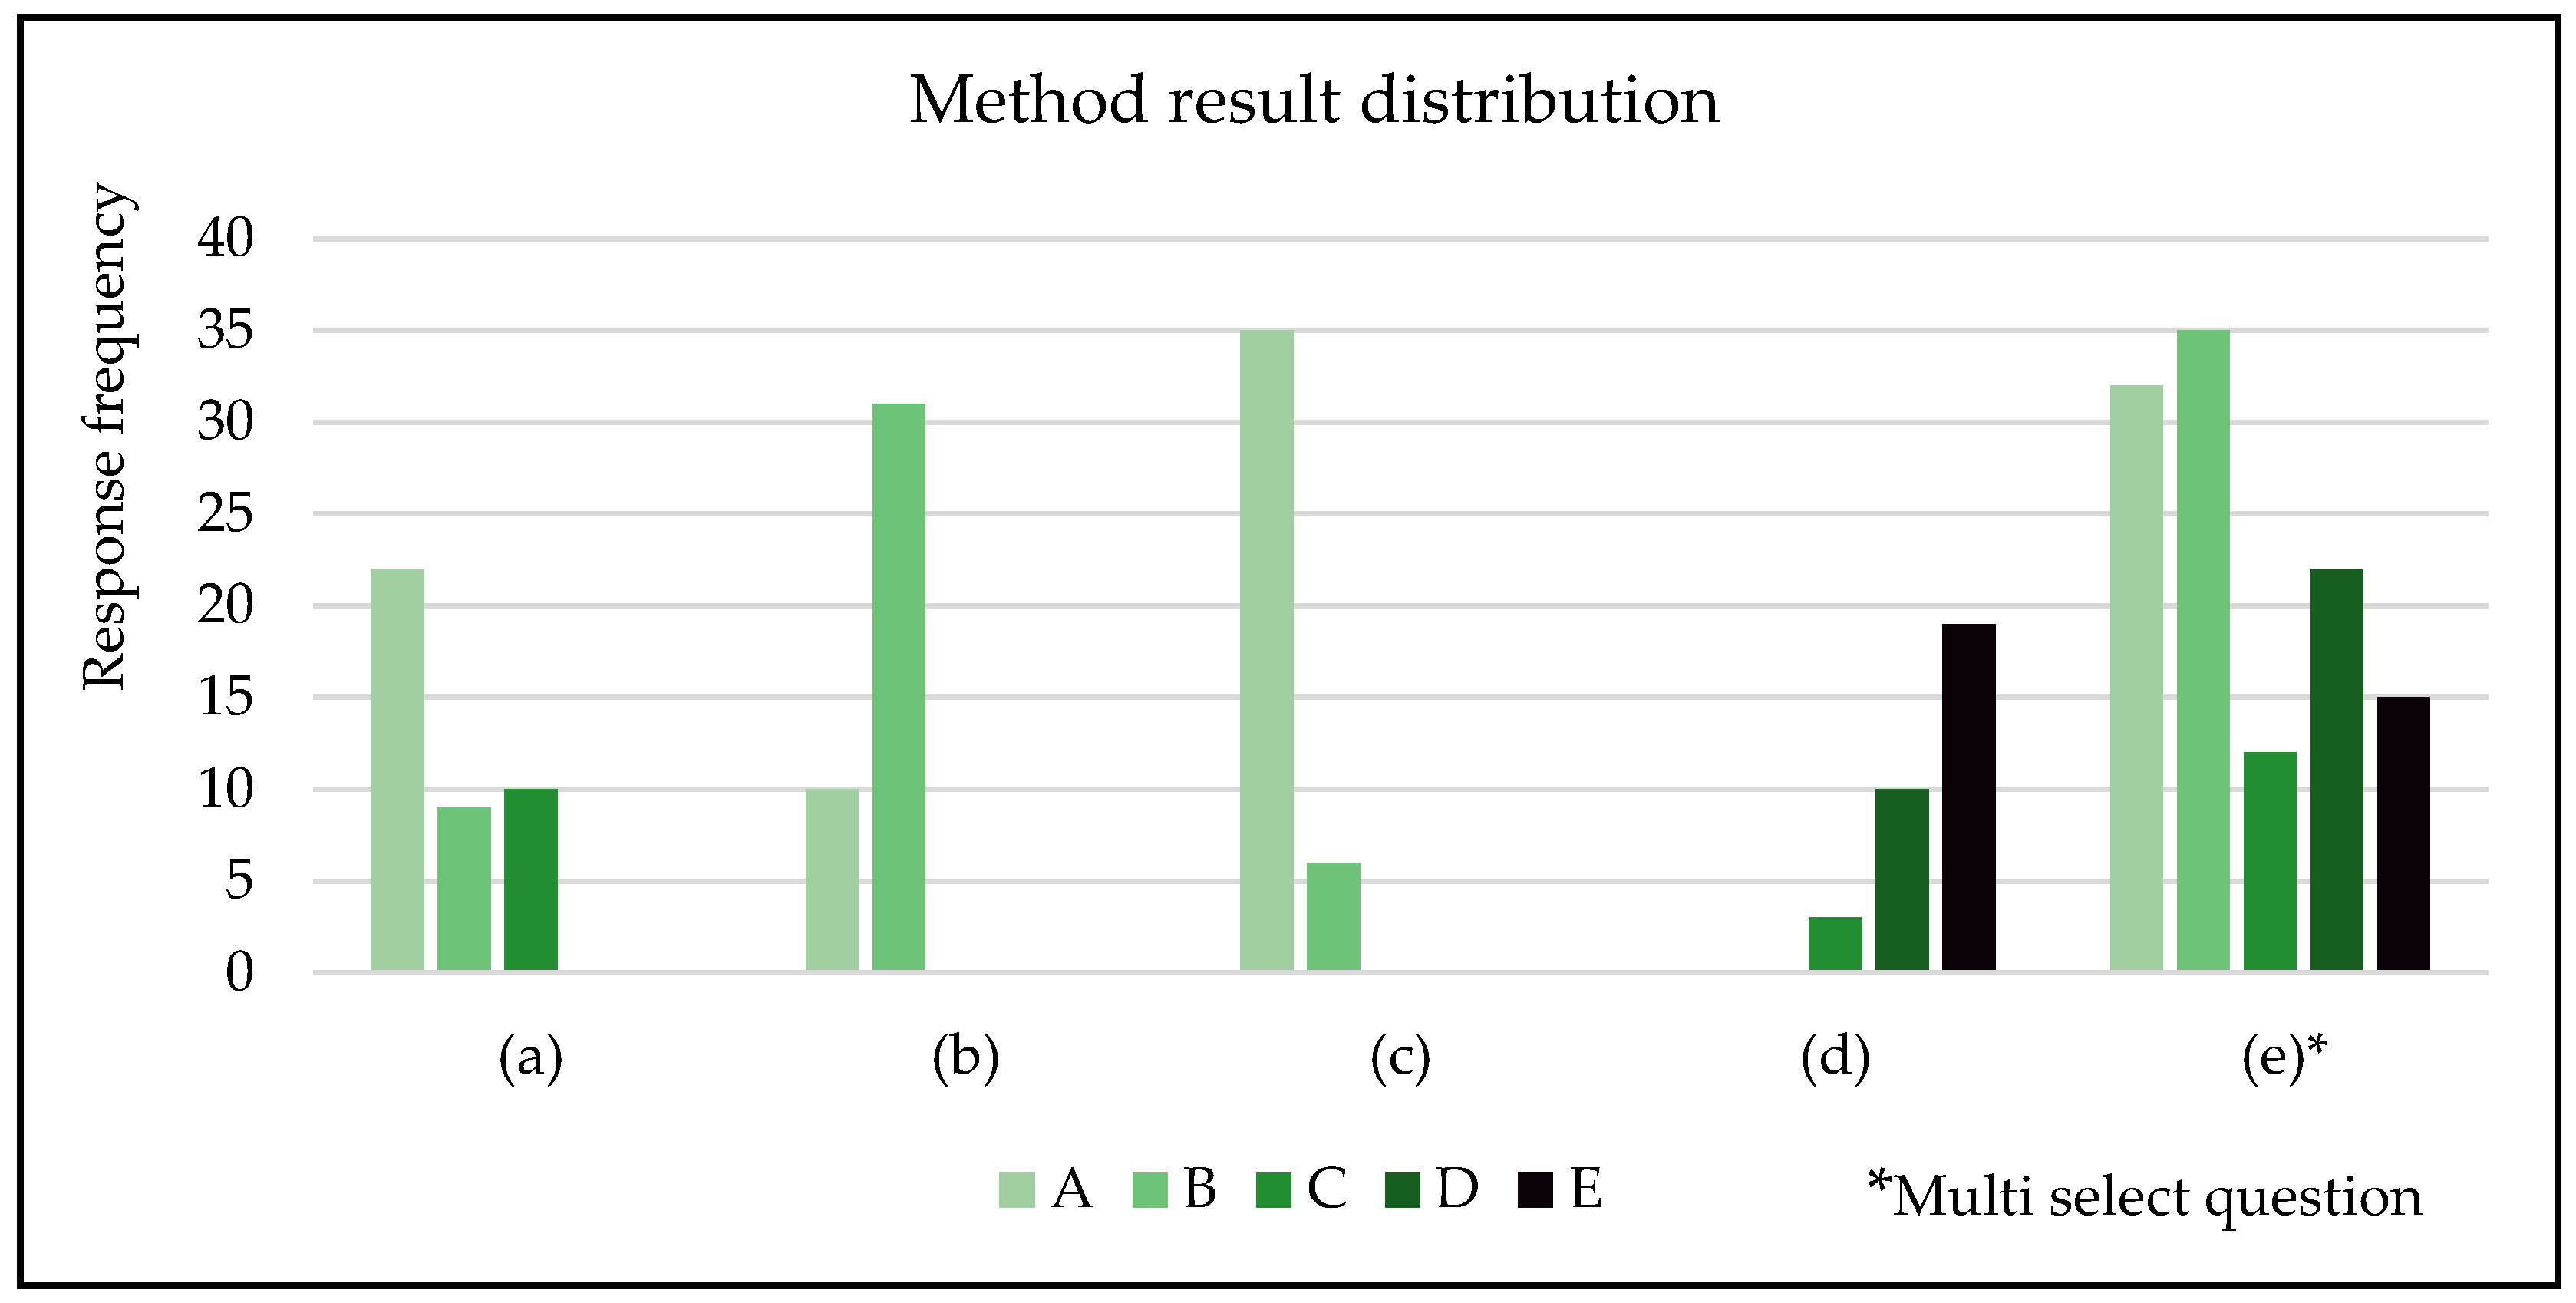
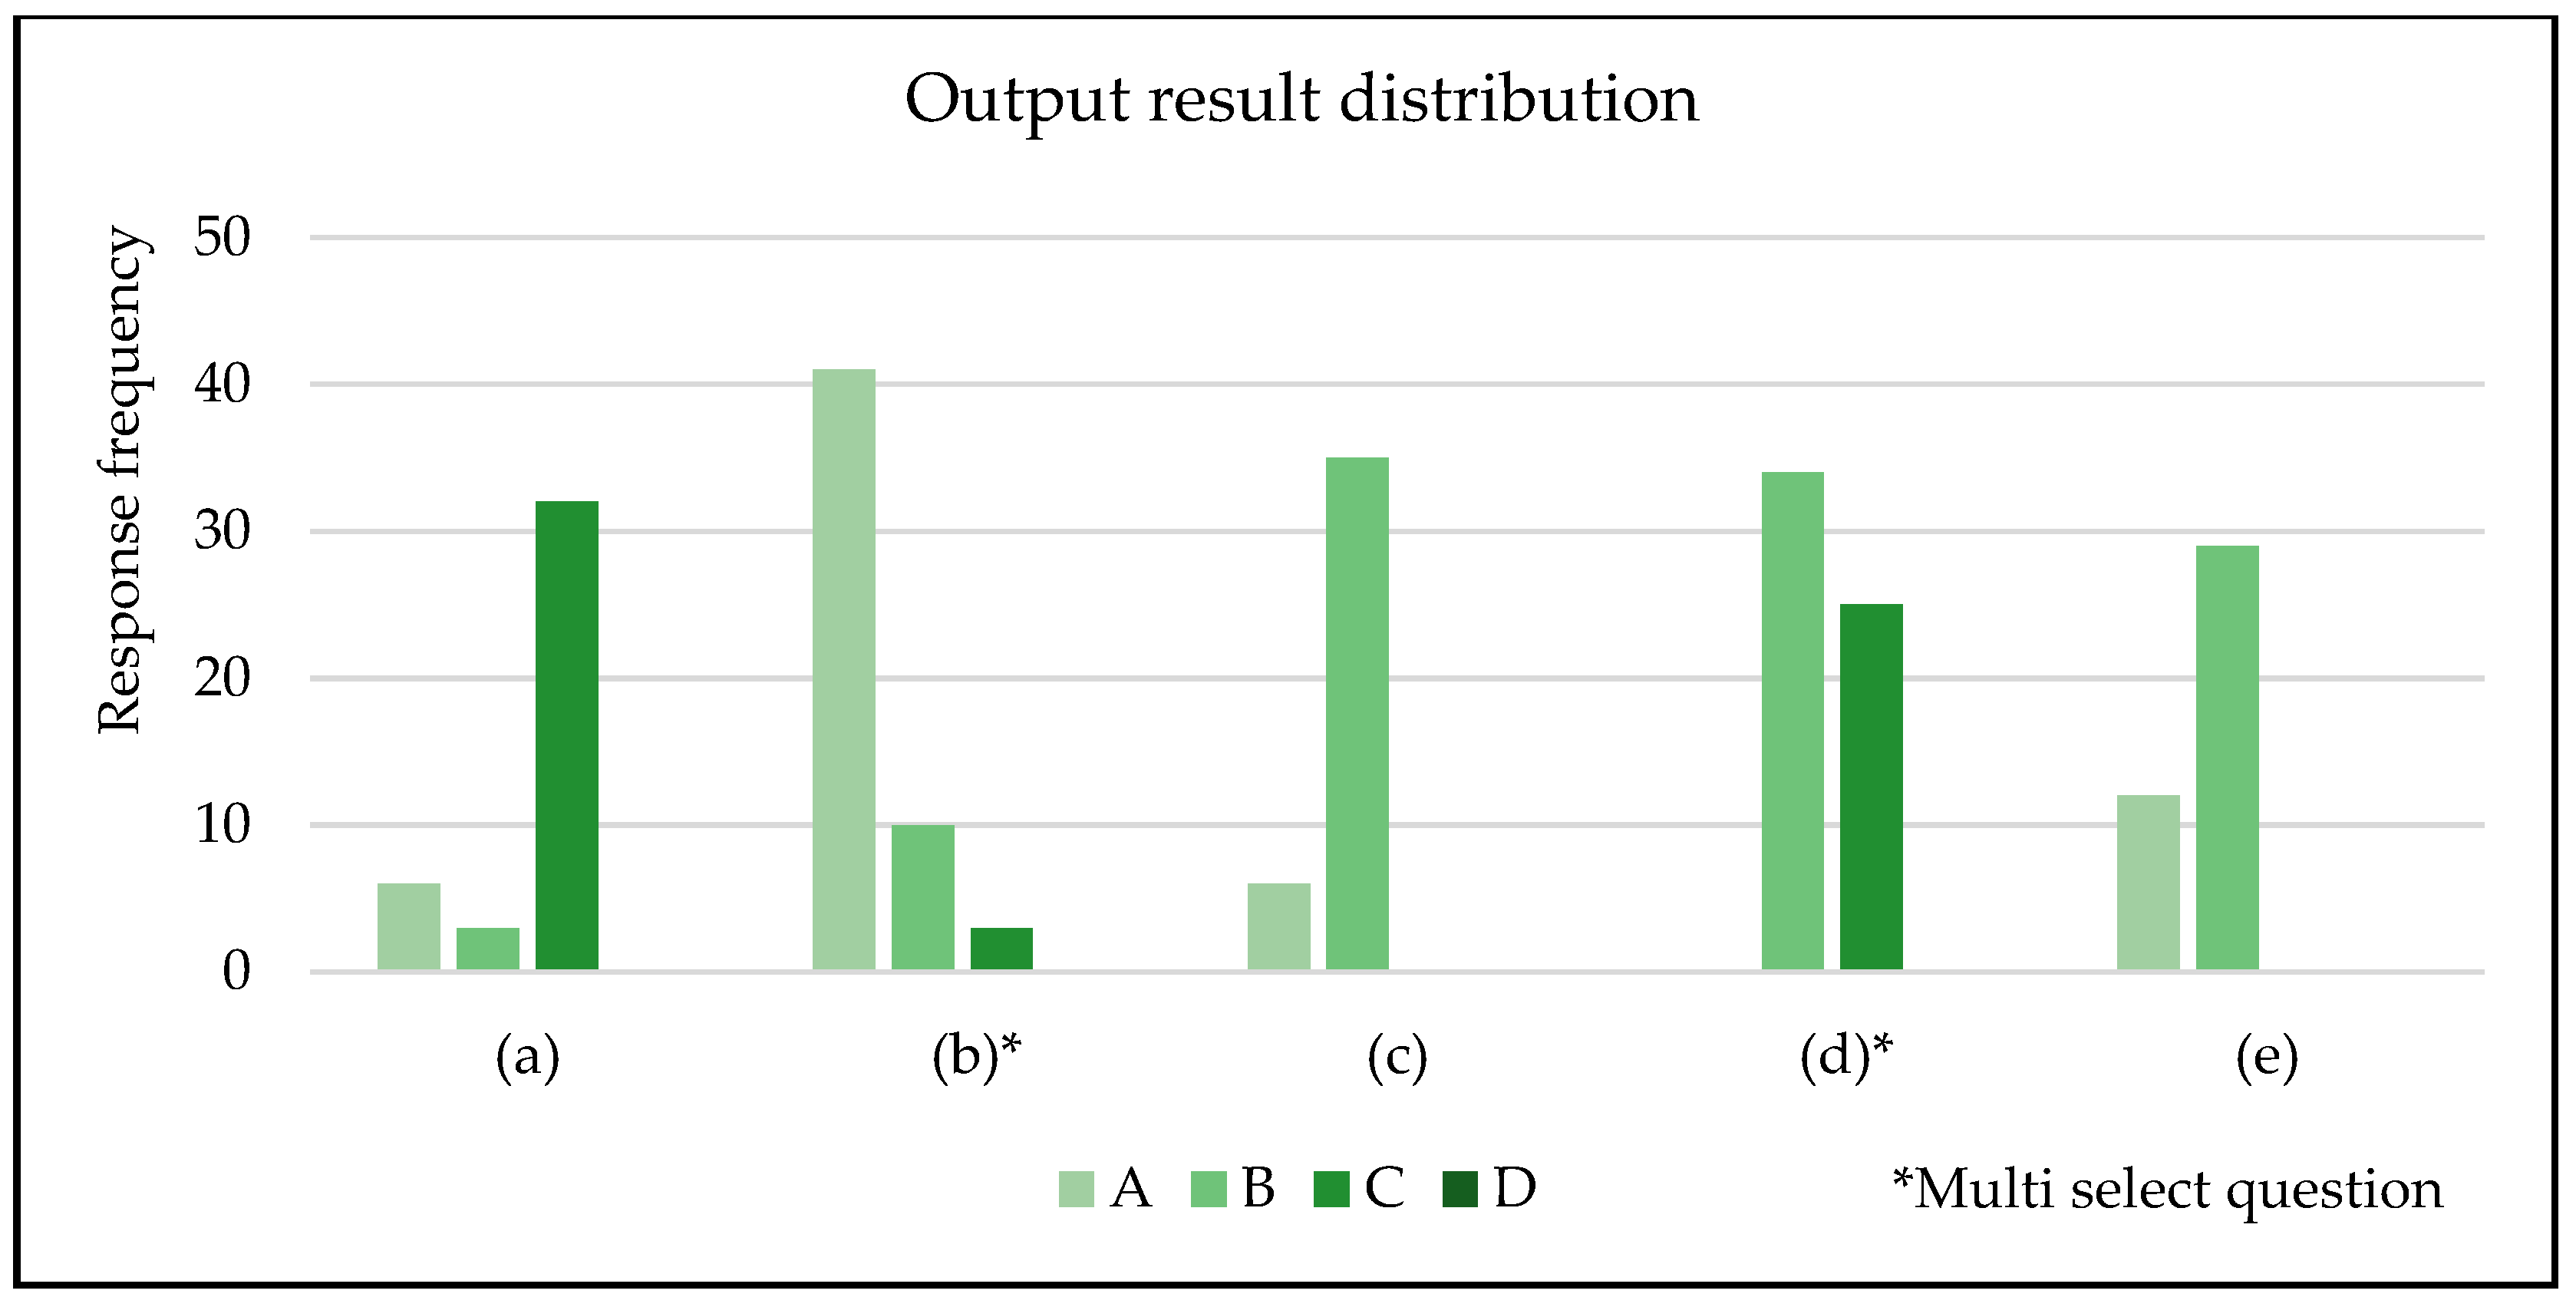
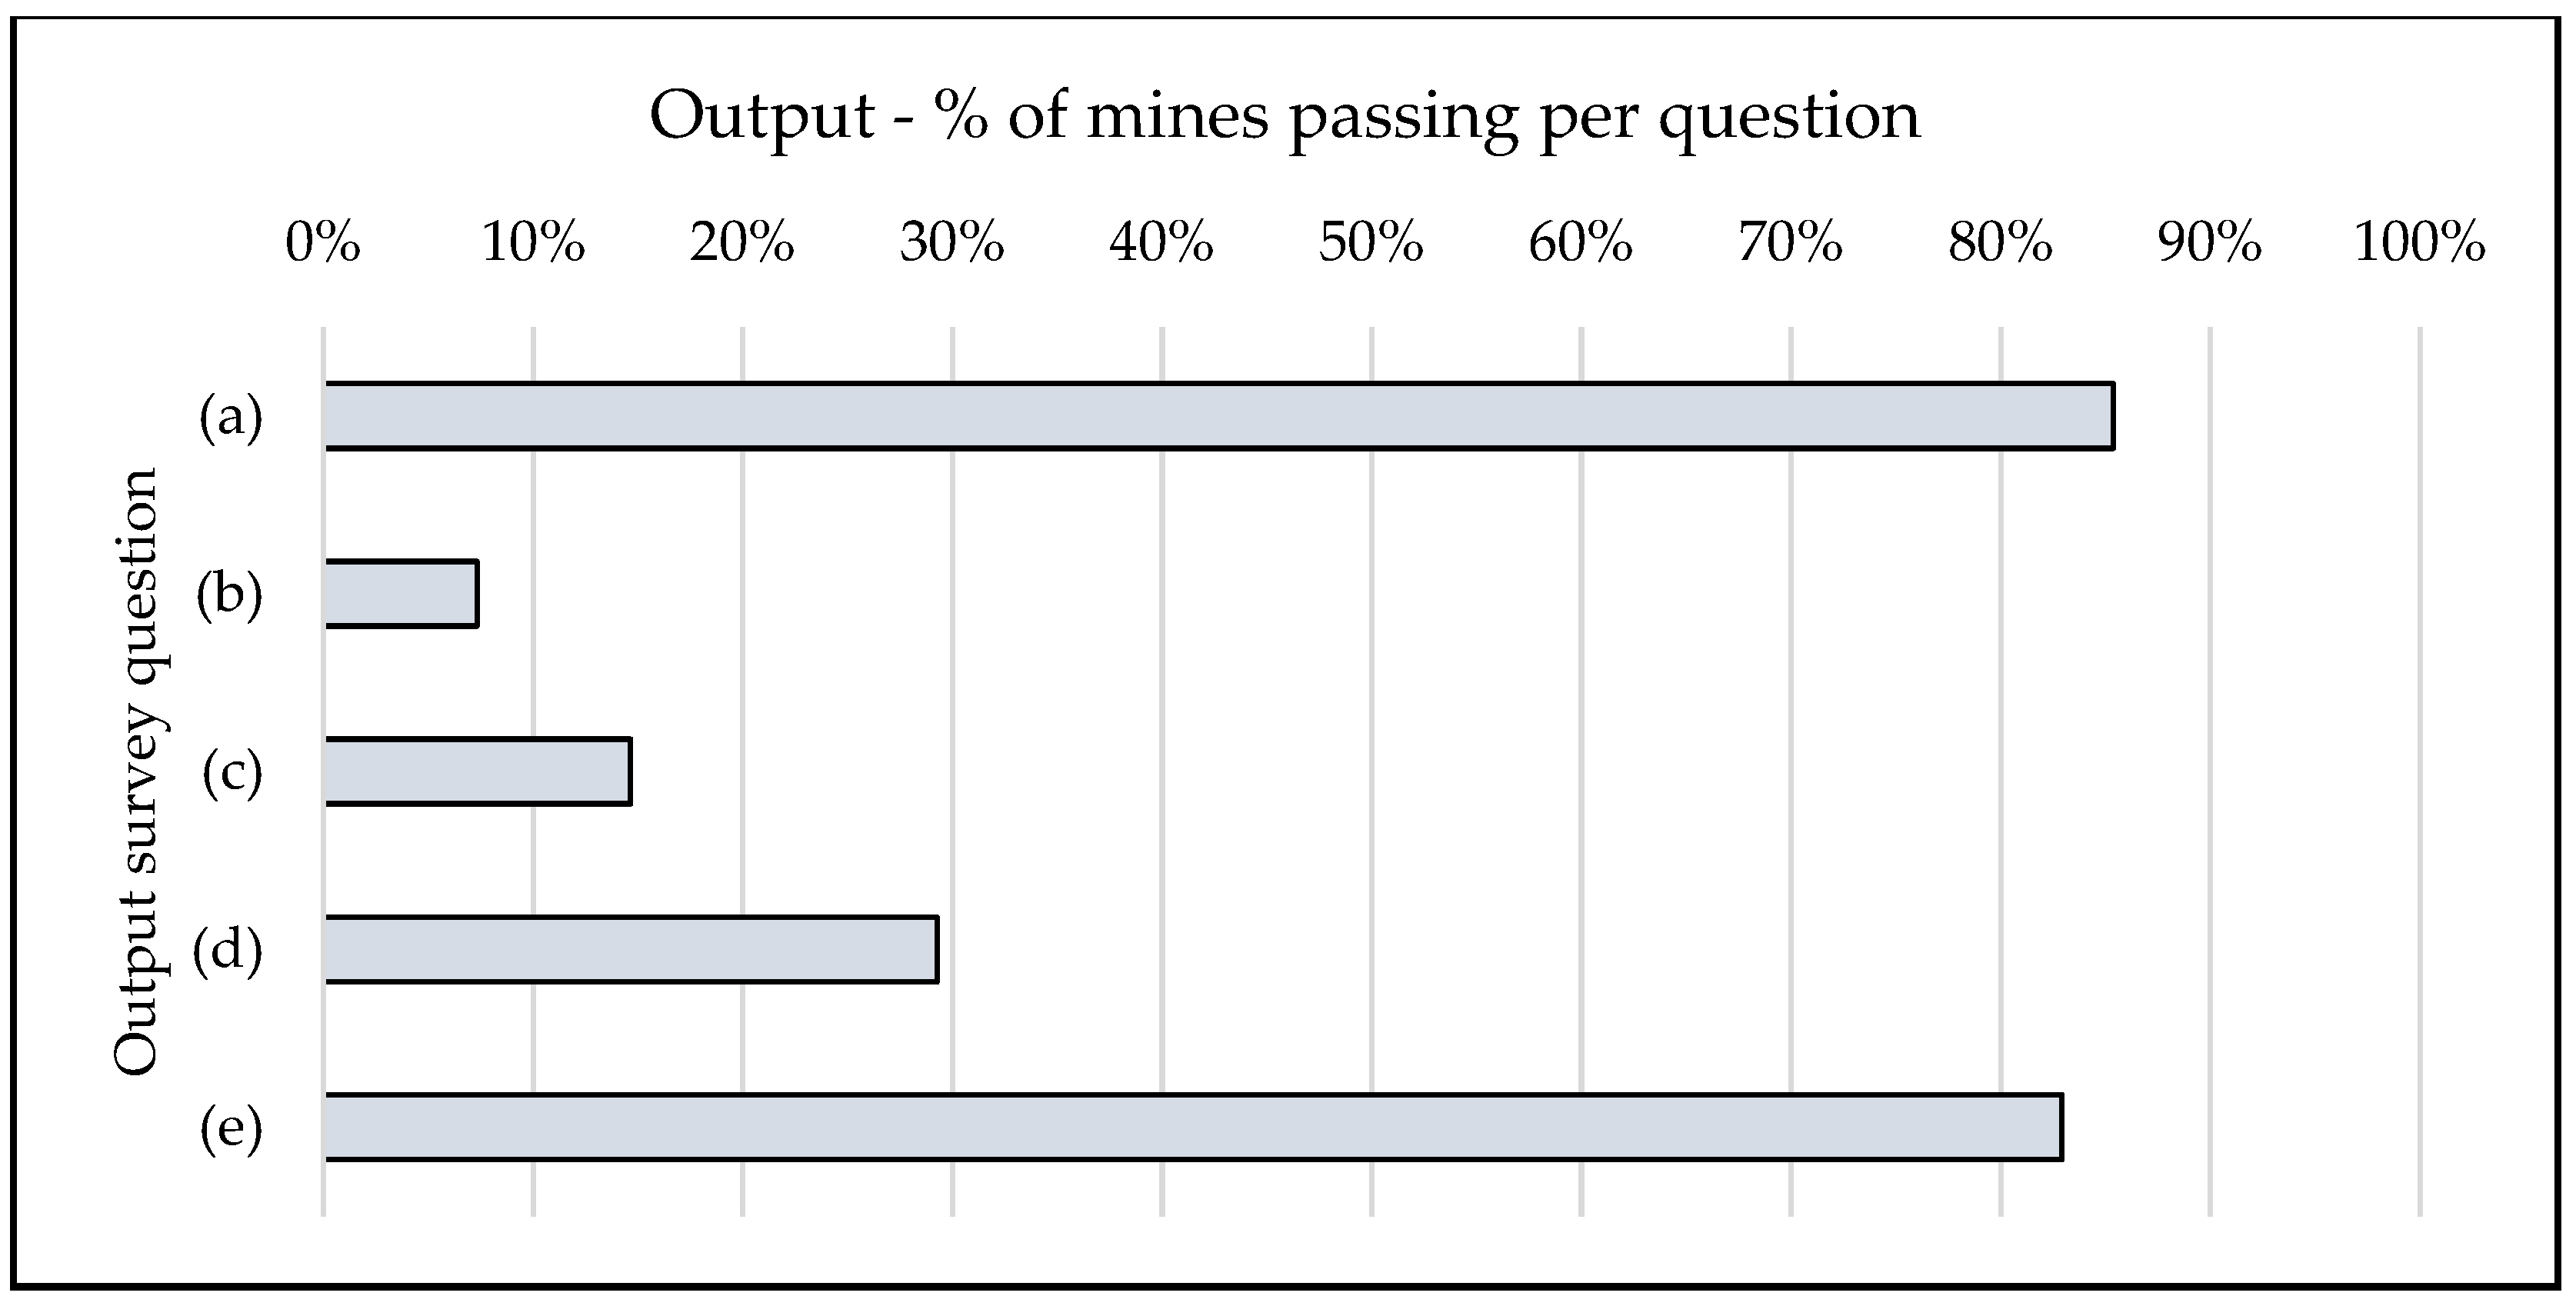
Figure 4 shows the detailed results of the Input section of the survey. Questions (a)–(e) and answers A-E can be found in Appendix A.1.1. Results were analyzed and consolidated into pass/fail, shown in Figure 5.
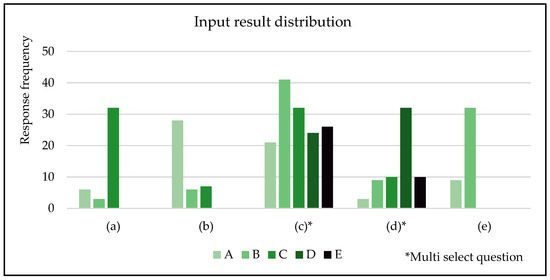
Figure 4.
Input survey results distribution.

Figure 5.
Input survey results—percentage passing.
Although the right type of data is used, on the right boundary and with high quality data, the input will not deliver a high-quality budget unless the data is also in a high enough resolution. Monthly budgets are not an effective energy management tool when contrasted with real-time data. Monthly budgets also cannot be costed as accurately as higher resolution budgets allow, as the Eskom Megaflex costing structure is billed half-hourly.
The survey questions from the methodology were effective in gathering all required data from the participants.
All the sites surveyed had at least hourly data available for systems where energy management is required. Approximately 61% of the operations have this data available in real-time and could thus employ effective energy management if budgets were of a high enough resolution. When the data is not used, it is largely due to time constraints. If the time constraints could be overcome, half hourly data can be used as input for electricity cost budgets for mines. This would allow for high quality and high-resolution budgets that can be used for energy management to be developed.
4.2. Method
This section discusses the outcomes of the application of the Method questions of the survey developed in Section 3. A combination of single answer, yes/no, multiple choice and discussion questions were used to better understand the steps taken by the mines to develop an electricity cost budget.
- (a)
- For most mines, electricity cost budget development is done by the engineering department. The remaining mines had budgets developed by their respective financial departments, or by third party companies involved in the energy management of the mines. For best practices, the mine’s engineering department should be either fully responsible for, or at least heavily involved in, the development of the budget.
- (b)
- As 68% of mines only used monthly data as their input, they could not account for TOU in detail using Megaflex tariffs to determine the cost of their budgets.
- (c)
- The mines interviewed all use similar methods to cost their developed electricity budgets. This involves using historical percentage splits for the TOU of active energy charges. The charges are then combined with historical fixed charges and multiplied with the expected tariff increase for the year. Only 6 of the 41 sites did account for TOU in the costing of their budgets using the official Eskom tariff structure. This could only be done because they started the budget process with at least hourly data.
- (d)
- On average, those surveyed rated their budgeting process as 9/10 in terms of how time consuming and tedious the process is. This is an indication that the methods are not scalable and would not easily adapt to a larger scale or other systems. There is a positive correlation between the sites who find the process less time-consuming and the sites that outsource the development of budgets.
- (e)
- Most budgets are validated before they are used. The majority of sites (85%) used at least two forms of validation. The most applied method was to compare the developed budget to past actual data and past budgets. Both internal and third-party validation is used. It is important to note that despite validation and checks being in place, errors in budgets do still occur. This is largely due to human error, amplified by the large volumes of budgets that often need to be developed in a short period of time, and due to the bulk of budget development being done in Excel, thus there are no built-in checking mechanisms.
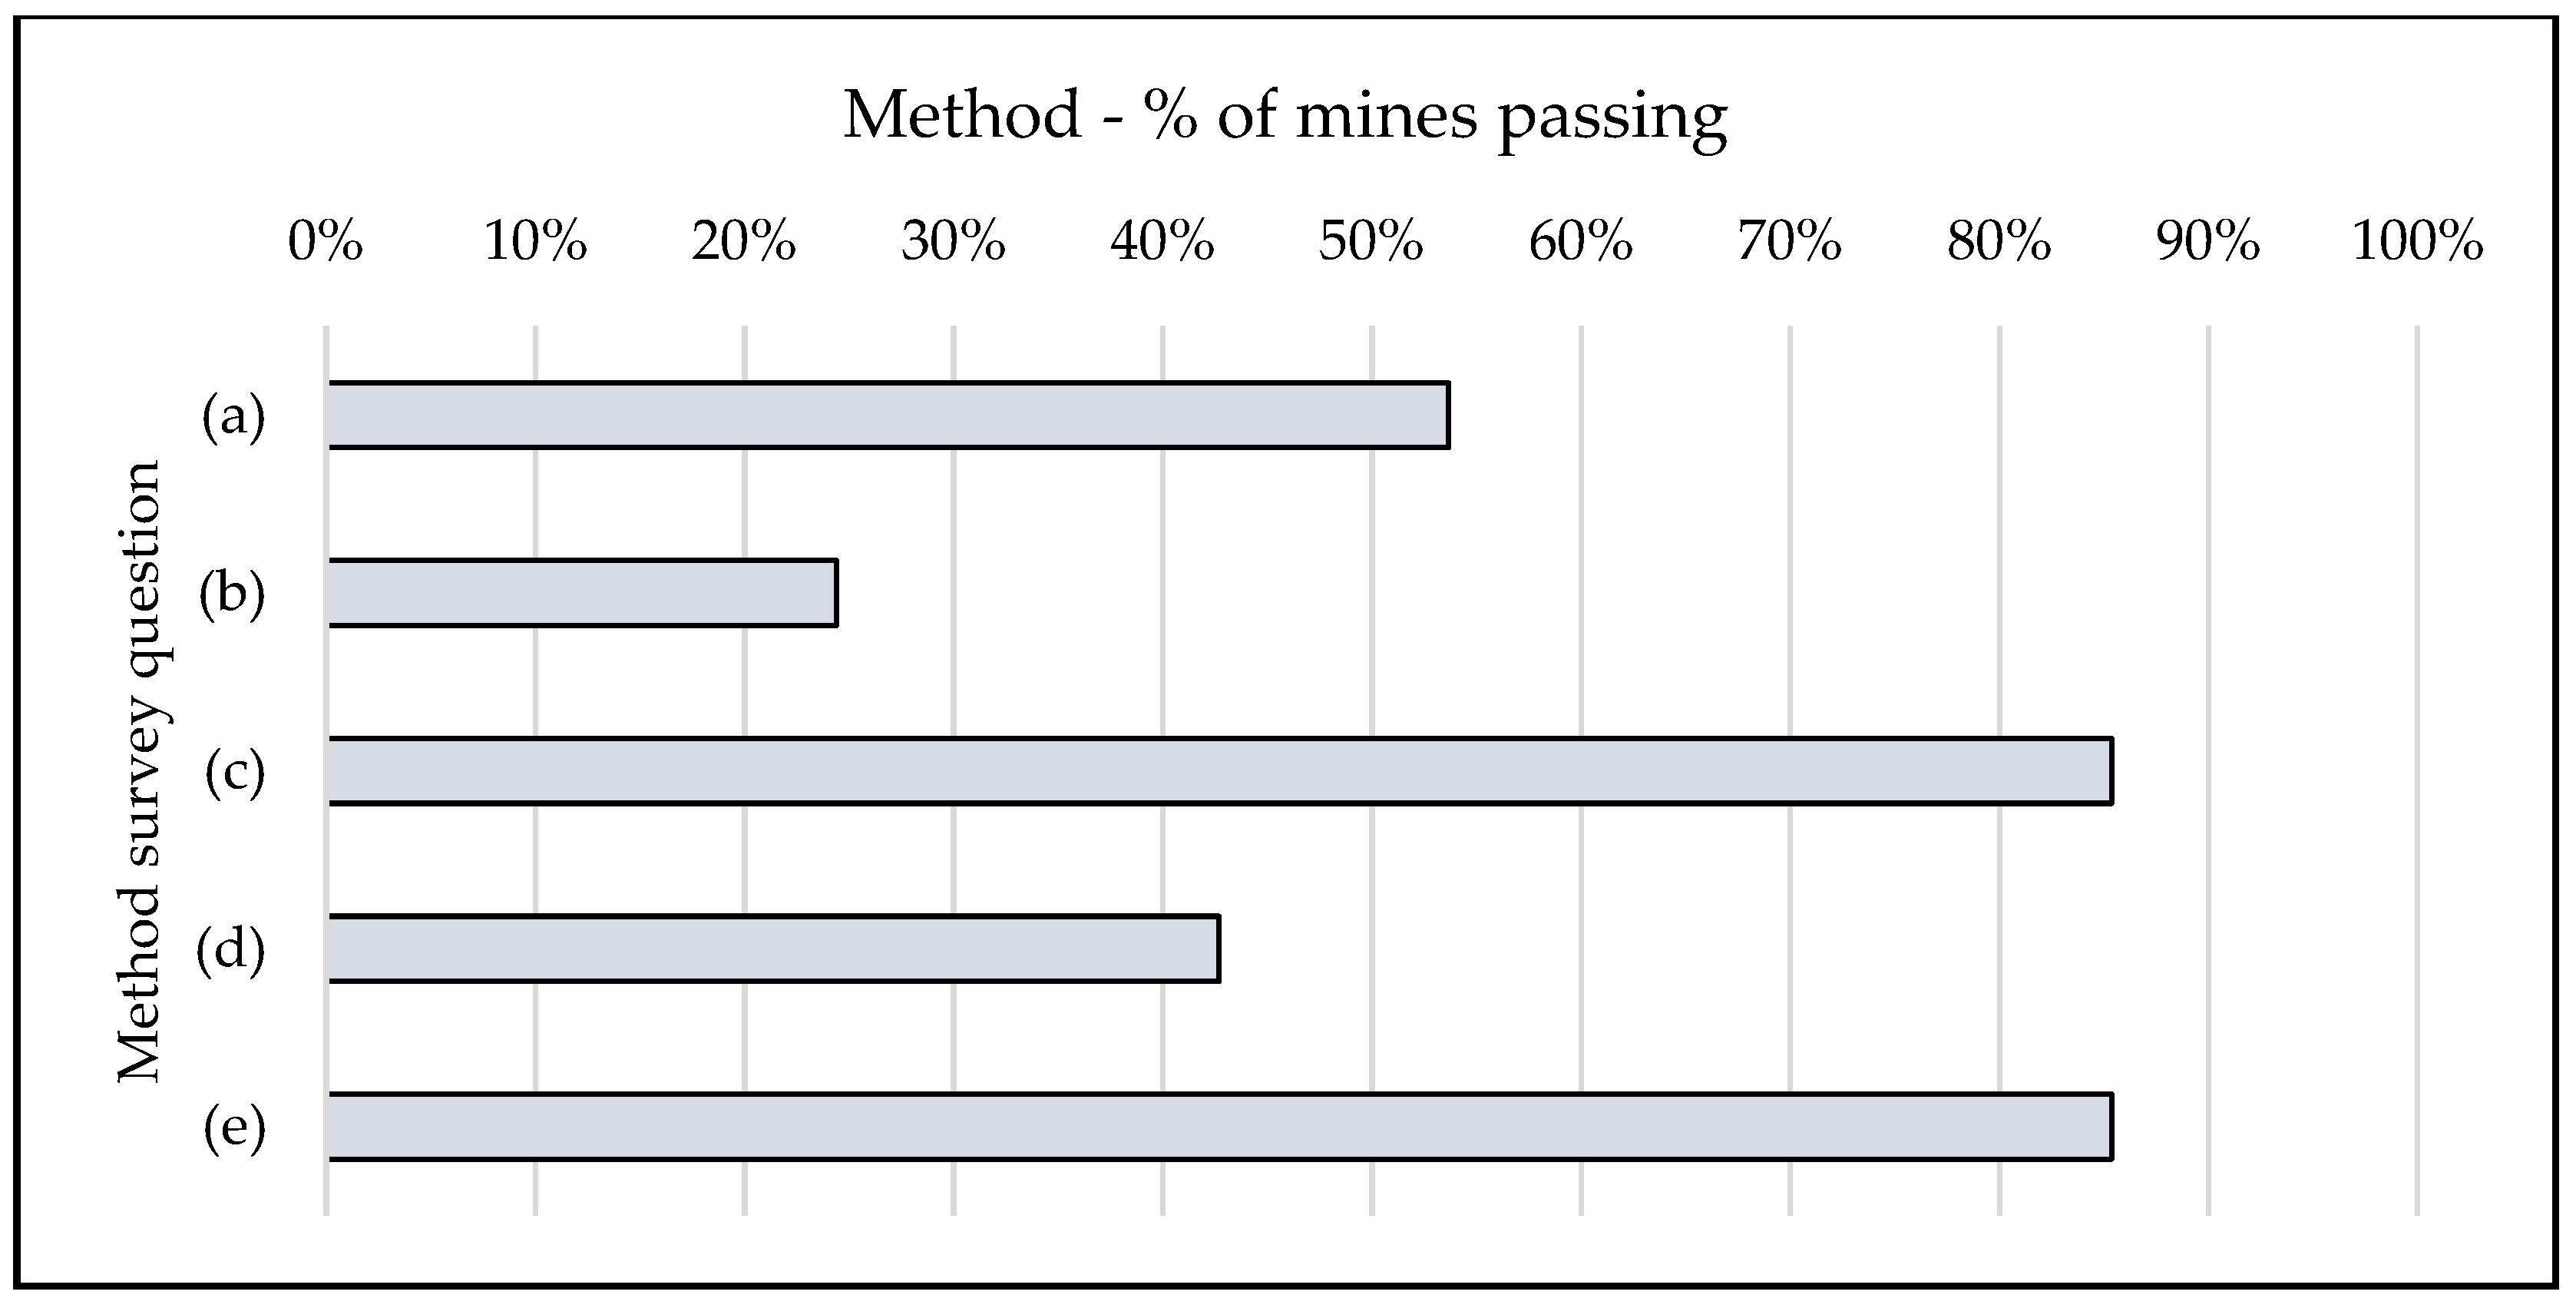
The questions developed in Section 3 proved effective in gaining enough information to evaluate the methods used by mines to develop electricity cost budgets. Figure 6 shows the detailed results of the Method section of the survey. The complete set of questions (a)–(e) and answers A–E can be found in Appendix A.1.2. Results were analyzed and consolidated into pass/fail, shown in Figure 7.
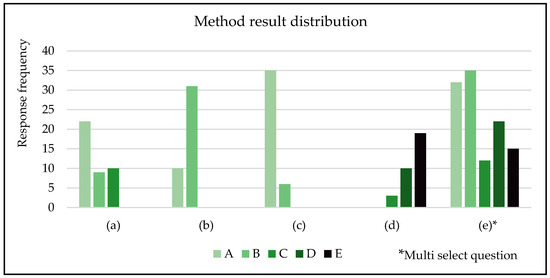
Figure 6.
Method survey results distribution.
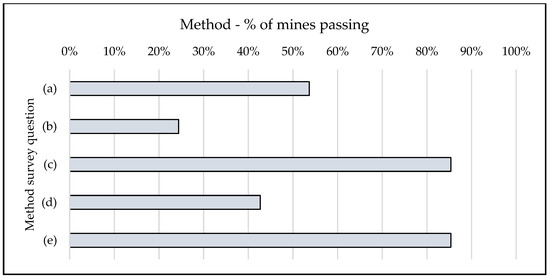
Figure 7.
Method survey results—percentage passing.
Several mines have electricity budgets developed by financial departments who do not have the expertise to plan for changes in planned mining activities. While most mines use the Eskom tariff structures, few account for TOU in their costing. The methods currently used by mines were also found to not be very scalable, contributing to the lack of high-resolution budgets available.
From the Method survey results there is a clear shortcoming in the level of detail used when costing electricity forecasts. This is a knock-on effect, due to the low resolution of input data used. As all costs are known, costing in high detail can easily be automated to improve this. Costing done with high resolution data will yield better quality results, especially if changes in electricity usage patterns are planned.
4.3. Output
This section discusses the outcomes of the application of the Output questions of the survey developed in Section 3. Yes/no, multiple choice and discussion questions were used to determine the quality of the output produced by the budgeting methods employed by the mines surveyed.
- (a)
- In line with the inputs, most budgets were developed per energy intensive system or feeder (85%).
- (b)
- The budgets developed by the mines surveyed were mostly available in a monthly resolution due to the monthly inputs used. All mines presented their budgets in a monthly format, even if it was also available in higher resolutions. Some sites used daily data only for data cleaning, and still developed a monthly budget. Ten sites developed daily budgets, and three sites developed half-hourly budgets.
- (c)
- Most sites split their budget cost beyond the POD level. Unfortunately, most do this by just splitting the cost by percentage, not using TOU. 6/41 sites used TOU and have individual tariffs per energy intensive system.
- (d)
- Only 29% of mines surveyed formally reported on specific changes made to baseline input data. There is a correlation between mines who formally document the budgeting process and mines using third party companies to develop their budgets.
- (e)
- All surveyed mines used visualization to present developed budgets, and most had various types of formats used to present the budgets, depending on who it is presented to. Effective reporting requires a combination of values and visuals, as done by 82% of participants.
Figure 8 depicts the detailed results of the Output survey. The complete set of questions (a)–(e) and answers A–E can be found in Appendix A.1.3. Results were analyzed and consolidated into pass/fail, shown in Figure 9.

Figure 8.
Output survey results distribution.
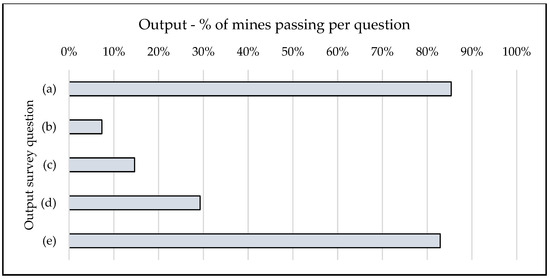
Figure 9.
Output survey results—percentage passing.
The developed survey questions were successful in determining whether the budget outputs developed by mines adhere to best practices. The developed budgets are mostly are separated by energy intensive system, as in the input, adhering to best practices. The resolution however remains a problem, as the input was not of a high enough resolution to produce a high-resolution output. Costing issues arising from the Method section of the survey led to budgets that are split beyond POD level, but without accounting for TOU. This results in inaccurate cost estimations per system. Changes to the baselines are not frequently formally documented. Most mines do however employ effective visualization and presentation strategies to communicate the developed budgets.
5. Discussion
5.1. Results Summary
The study shows that the monthly budgets produced by mines in South Africa would not be useful tools for real-time energy management. The novel research question was answered by the methods developed in this study. Because most sites only split their costs by percentage, even the monthly cost values for each energy intensive system would not be useful for evaluating the cost performance of the system. Budgets in high resolutions and with costs representative of their TOU can be used to track electricity and cost performance progressively throughout a month, enabling proactive energy management by identifying and rectifying issues without having to wait for month end to compare to the budget.
Formally reporting on the electricity cost forecasting process legitimizes it as an energy management tool. Having transparency on the targets set for operations will assist with compliance to meet these targets.
5.2. Next Steps
This study has shown that literature frameworks for mine electricity cost budgets, while available, are quite sparse. The study further found that the established methods from literature are not practically implemented on South African mines in a way that enables the mines to use the budgets for proactive real-time energy management.
A framework incorporating the findings from this study could assist in the practical implementation of existing electricity forecasting and costing methodologies and would result in higher-quality budgets that can be used for real-time energy management.
Table 4 highlights the focus areas to improve practical implementation of electricity cost budgets on mines.
Table 4.
Identification of focus for future studies.
Future studies should focus mainly on the method and output of the budget, as they have the most questions with under 50% of mines passing. A framework should be developed to ensure that a scalable and adaptable method is applied to budget development, meeting the criteria from literature, and delivering the desired output.
5.3. Alignment with Sustainable Development Goals (SDGs)
- Affordable and Clean Energy (SDG 7): The focus on improving electricity cost forecasting and energy management supports the goal of ensuring access to affordable, reliable, sustainable, and modern energy for all.
- Industry, Innovation, and Infrastructure (SDG 9): Enhancing the budgeting processes and adopting best practices in electricity management contributes to resilient infrastructure, promoting inclusive and sustainable industrialization and innovation.
- Responsible Consumption and Production (SDG 12): By improving energy management and reducing inefficiencies, the study supports sustainable consumption and production.
By aligning the recommended best practices for electricity forecasting with these SDGs, mining companies can improve their operational efficiency, minimize energy wastage, and contribute to the broader sustainability goals.
6. Conclusions
This study aimed to determine whether the electricity budget development methods currently employed in the South African mining industry results in high quality electricity cost budgets that can be used for meaningful, real-time energy management. A gap in the literature was identified: there are no existing evaluation criteria to determine whether a developed electricity cost budget will serve as an effective tool for energy management.
Key steps for the development of electricity budgets were identified from literature. Each step was evaluated for relevance within the context of mine electricity cost budgets. Subsequently, a set of best practices were developed to evaluate the quality of the electricity cost budget development process of mines. The best practices are grouped to evaluate the input, method and output of a budget development process.
A survey was compiled based on the best practices identified. A total of 41 mine business units participated in the survey, representing several major South African mining companies. The surveys found that there are significant shortcomings in the budgeting processes of most of the mines. Only 3 of the 41 mines surveyed produced budgets in a half-hourly resolution, as required by the identified best practices. Budgets in lower resolutions than half-hourly do not accurately represent expected patterns in electricity consumption and the related cost implications of TOU.
Surprisingly, most mines surveyed do have high-resolution electricity usage data available for budget development. The barriers to producing high-resolution, high-quality budgets are largely dependent on time, effort and resources available.
The identified barriers hindering the implementation of each best practice should be isolated, investigated and addressed in order to overcome them. From the study results, the following key areas should be addressed:
- Input data resolution.
- Improvement will allow improved costing by allowing TOU costing. This will improve the cost results as well.
- Improvement will result in a high-resolution result.
- Budget method scalability.
- Currently, manual methods are relied on.
- Investigations into advanced forecasting methods, their applicability and scalability are recommended to identify suitable solutions.
- Process and result documentation.
- Improvement of documentation practices throughout the process will improve the quality and traceability of the budgets and allow for repeatability of methods.
Overcoming each of these will enable the development of high-quality electricity cost budgets that can be used as effective tools for energy management. The development of a framework for the budget development process based on the identified best practices is recommended.
By improving the electricity forecasting methods, these energy-intensive mining companies can contribute to SDG 7 by optimizing energy use and reducing costs, SDG 9 by promoting technological innovation and resilient infrastructure, and SDG 12 by minimizing energy wastage and supporting sustainable production practices.
Author Contributions
Conceptualization, A.C. and J.H.v.L.; Methodology, A.C.; Validation, A.C.; Formal Analysis, A.C.; Investigation, A.C.; Resources, J.F.v.R.; Data Curation, A.C.; Writing—Original Draft Preparation, A.C.; Writing—Review & Editing, J.H.v.L. and J.C.V.; Visualization, A.C.; Supervision, J.C.V.; Project Administration, J.F.v.R.; Funding Acquisition, J.F.v.R. and J.C.V. All authors have read and agreed to the published version of the manuscript.
Funding
The APC was funded by the Centre for Sustainable Mining, North-West University, South Africa. The research was supported by ETA Operations (Pty) Ltd., South Africa.
Institutional Review Board Statement
The study was approved by the Engineering Research Ethics Committee of the North-West University (Ethics application no. NWU-00324-19-A1).
Data Availability Statement
The data presented in this article can be made available by the authors on reasonable request. No personal information of any participants was collected.
Conflicts of Interest
The authors declare no conflicts of interest.
Abbreviations
The following abbreviations are used in this manuscript:
| GDP | Gross Domestic Product |
| M&V | Measurement and Verification |
| NMD | Notified Maximum Demand |
| POD | Point of Delivery |
| SDG | Sustainable Development Goal |
| TOU | Time-of-Use |
| UN | United Nations |
Appendix A
Appendix A.1. Budgeting Process Questionnaire
Key: Single answer (s), multi-answer (m), discussion (q)
Appendix A.1.1. Input
- (a)
- To what level of the operation is the input data separated? (s)
- A.
- Incomer/POD
- B.
- Feeders
- C.
- Systems
- D.
- Components
- (b)
- What is the resolution of the input data? (s)
- A.
- Monthly
- B.
- Daily
- C.
- Half-hourly
- D.
- Other
- (c)
- How is the quality of the input data ensured? (q, m)
- A.
- Calibrated meters
- B.
- Independent checks
- C.
- Incident tracking
- D.
- Outlier elimination
- E.
- External validation—data used for reporting etc.
- (d)
- What input data is used in the budget creation process? (m)
- A.
- Historic tonnes with fixed kWh/t
- B.
- Planned tonnes with fixed kWh/t
- C.
- Historic energy budgets
- D.
- Historic actual energy data
- E.
- Combination of tonnes and energy data
- (e)
- How are planned changes budgeted for? (q, s)
- A.
- Using increased tonnes (rate kWh/t)
- B.
- Using increased energy
- C.
- Not budgeted for
- D.
- Other
Appendix A.1.2. Method
- (a)
- Who is responsible for budget development? (q, s)
- A.
- Engineering department
- B.
- Financial department
- C.
- Third party company
- (b)
- Are adjustments made to the input data to account for changes in TOU between the baseline period and future budget period (for example when the baseline month has more weekdays than the future budget month)? (s)
- A.
- Yes
- B.
- No
- (c)
- Is costing split into systems? (s)
- A.
- Yes
- B.
- No
- (d)
- On a scale of 1–10, where 1 is very quick and 10 is very time consuming, how time-consuming is the current budgeting process? (q, s)
- A.
- 0–2
- B.
- 3–4
- C.
- 5–6
- D.
- 7–8
- E.
- 9–10
- (e)
- How is the budget output validated? (q, m)
- A.
- Compare to past actual data
- B.
- Compare to past budget data
- C.
- Internal validation process
- D.
- Third party validation process
- E.
- Validated in use
Appendix A.1.3. Output
- (a)
- To what level of the operation is the budget separated? (s)
- A.
- Incomer/POD
- B.
- Feeders
- C.
- Systems
- D.
- Components
- (b)
- What is the resolution of the created budget? (m)
- A.
- Monthly
- B.
- Daily
- C.
- Hourly
- D.
- Half hourly
- E.
- Other
- (c)
- Are the final costs split into systems according to TOU? (q, s)
- A.
- Yes
- B.
- No
- (d)
- How is the budget presented? (q, m)
- A.
- Values only
- B.
- Values and visual medium
- C.
- Values, visuals and summary of changes
- D.
- Other
- (e)
- Is the budget process formally documented? (q, s)
- A.
- Yes
- B.
- No
References
- World Population Review Cost of Electricity by Country: 2025. Available online: https://worldpopulationreview.com/country-rankings/cost-of-electricity-by-country (accessed on 10 May 2025).
- Ateba, B.B.; Prinsloo, J.J.; Gawlik, R. The significance of electricity supply sustainability to industrial growth in South Africa. Energy Rep. 2019, 5, 1324–1338. [Google Scholar] [CrossRef]
- Davidse, A.; Swart, A.; Padisetti, K.; Ivory, N.; Tyagi, S. Driving Value Through Energy Management in Mining. Deloitte the Bottom Line; Deloitte: London, UK, 2016. [Google Scholar]
- Neingo, P.N.; Tholana, T. Trends in productivity in the South African gold mining industry. J. S. Afr. Inst. Min. Metall. 2016, 116, 283–290. [Google Scholar] [CrossRef]
- Eskom. Schedule of Standard Prices for Eskom Tariffs 2025/26; Eskom Holdings SOC Ltd.: Sandton, South Africa, 2025. [Google Scholar]
- Hong, T.; Pinson, P.; Wang, Y.; Weron, R.; Yang, D.; Zareipour, H. Energy forecasting: A review and outlook. IEEE Open Access J. Power Energy 2020, 7, 376–388. [Google Scholar] [CrossRef]
- Minerals Council of South Africa. Facts and Figures Pocketbook 2023. Available online: https://www.mineralscouncil.org.za/special-features/1374-facts-and-figures-pocketbook-2023 (accessed on 4 April 2025).
- Goosen, P. The Development and Implementation of an Energy Management Information System for Industries. Ph.D. Thesis, North-West University, Potchefstroom, South Africa, 2020. [Google Scholar]
- Avancini, D.B.; Rodrigues, J.J.P.C.; Martins, S.G.B.; Rabêlo, R.A.L.; Al-Muhtadi, J.; Solic, P. Energy meters evolution in smart grids: A review. J. Clean. Prod. 2019, 217, 702–715. [Google Scholar] [CrossRef]
- Zhou, K.; Fu, C.; Yang, S. Big data driven smart energy management: From big data to big insights. Renew. Sustain. Energy Rev. 2016, 56, 215–225. [Google Scholar] [CrossRef]
- Mystakidis, A.; Koukaras, P.; Tsalikidis, N.; Ioannidis, D.; Tjortjis, C. Energy forecasting: A comprehensive review of techniques and technologies. Energies 2024, 17, 1662. [Google Scholar] [CrossRef]
- Jeong, K.; Koo, C.; Hong, T. An estimation model for determining the annual energy cost budget in educational facilities using SARIMA and ANN. Energy 2014, 71, 71–79. [Google Scholar] [CrossRef]
- Fan, G.F.; Wei, X.; Li, Y.T.; Hong, W.C. Forecasting electricity consumption using a novel hybrid model. Sustain. Cities Soc. 2020, 61, 102320. [Google Scholar] [CrossRef]
- Zhao, A.; Chen, M.; Quan, W.; Zhang, S. A hybrid forecasting model for general hospital electricity consumption based on mixed signal decomposition. Energy Build. 2024, 325, 115006. [Google Scholar] [CrossRef]
- Patyk, M.; Bodziony, P. Empirical analysis of mining costs amid energy price volatility for secondary deposits in quarrying. Energies 2024, 17, 718. [Google Scholar] [CrossRef]
- Baker, K.J.; Rylatt, R.M. Improving the prediction of UK domestic energy-demand using annual consumption-data. Appl. Energy 2008, 85, 475–482. [Google Scholar] [CrossRef]
- Gonzales Chavez, S.; Xiberta Bernat, J.; Llaneza Coalla, H. Forecasting of energy production and consumption in Asturias (northern Spain). Energy 1999, 24, 183–198. [Google Scholar] [CrossRef]
- Lee, T.K.; Kim, J.U. A cost-effective and heuristic approach for building energy consumption prediction: BES model calibration and forecasting algorithm. Energy Build. 2024, 303, 113800. [Google Scholar] [CrossRef]
- Zhao, X.; Gao, W.; Qian, F.; Ge, J. Electricity cost comparison of dynamic pricing model based on load forecasting in home energy management system. Energy 2021, 229, 120538. [Google Scholar] [CrossRef]
- Işık, G.; Öğüt, H.; Mutlu, M. Deep learning based electricity demand forecasting to minimize the cost of energy imbalance: A real case application with some fortune 500 companies in Türkiye. Eng. Appl. Artif. Intell. 2023, 118, 105664. [Google Scholar] [CrossRef]
- Krishnamurthy, S.; Adewuyi, O.B.; Luwaca, E.; Ratshitanga, M.; Moodley, P. Artificial intelligence-based forecasting models for integrated energy system management planning: An exploration of the prospects for South Africa. Energy Convers. Manag. X 2024, 24, 100772. [Google Scholar] [CrossRef]
- Vassiljeva, K.; Matson, M.; Belikov, J.; Petlenkov, E. Profiling and schedule based forecast of electricity usage to improve energy performance of administrative buildings. In Proceedings of the 2024 IEEE International Conference on Engineering, Technology, and Innovation (ICE/ITMC), Funchal, Portugal, 17–20 June 2024. [Google Scholar] [CrossRef]
- Pelser, C. Improved Energy Budgeting Process for Mines Using Measurement and Verification Principles. Ph.D. Thesis, North-West University, Potchefstroom, South Africa, 2021. [Google Scholar]
- Goosen, P.; Pelzer, R.; du Plessis, H.J. A method for accurate electricity budget cost calculations for a deep mine. In Proceedings of the 2015 International Conference on the Industrial and Commercial Use of Energy (ICUE), Cape Town, South Africa, 18–19 August 2015. [Google Scholar] [CrossRef]
- Laayati, O.; Bouzi, M.; Chebak, A. Smart energy management: Energy consumption metering, monitoring and prediction for mining industry. In Proceedings of the 2020 IEEE 2nd International Conference on Electronics, Control, Optimization and Computer Science (ICECOCS), Kenitra, Morocco, 2–3 December 2020. [Google Scholar] [CrossRef]
- Bredenkamp, J.I.G.; Mathews, M.J.; Vosloo, J.C. An integrated energy management strategy for the deep-level gold mining industry. In Proceedings of the 2016 International Conference on the Industrial and Commercial Use of Energy (ICUE), Cape Town, South Africa, 16–17 August 2016. [Google Scholar]
- Amasyali, K.; El-Gohary, N.M. A review of data-driven building energy consumption prediction studies. Renew. Sustain. Energy Rev. 2018, 88, 297–325. [Google Scholar] [CrossRef]
- Pitis, C. New approach on energy conservation measures types applied in mining industry. In Proceedings of the 2016 IEEE Electrical Power and Energy Conference (EPEC), Ottawa, ON, Canada, 12–14 October 2016. [Google Scholar] [CrossRef]
- Agioutanis, Z.; Luxbacher, K.; Karmis, M.; Schafrik, S. Development of an atmospheric data-management system for underground coal mines. J. S. Afr. Inst. Min. Metall. 2014, 114, 1059–1063. [Google Scholar]
- Debnath, K.B.; Mourshed, M. Forecasting methods in energy planning models. Renew. Sustain. Energy Rev. 2018, 88, 297–325. [Google Scholar] [CrossRef]
- Marinakis, V. Big data for energy management and energy-efficient buildings. Energies 2020, 13, 1555. [Google Scholar] [CrossRef]
- Shen, H.; Bednarz, T.; Nguyen, H.; Feng, F.; Wyeld, T.; Hoek, P.J.; Lo, E.H. Information visualisation methods and techniques: State-of-the-art and future directions. J. Ind. Inf. Integr. 2019, 16, 100102. [Google Scholar] [CrossRef]

Disclaimer/Publisher’s Note: The statements, opinions and data contained in all publications are solely those of the individual author(s) and contributor(s) and not of MDPI and/or the editor(s). MDPI and/or the editor(s) disclaim responsibility for any injury to people or property resulting from any ideas, methods, instructions or products referred to in the content. |
© 2025 by the authors. Licensee MDPI, Basel, Switzerland. This article is an open access article distributed under the terms and conditions of the Creative Commons Attribution (CC BY) license (https://creativecommons.org/licenses/by/4.0/).