
GIS-Based Subsurface Analysis and 3D Geological Modeling as a Tool for Combined Conventional Mining and In-Situ Coal Conversion: The Case of Kardia Lignite Mine, Western Greece

 ,
, 
 , and
, and 
Abstract
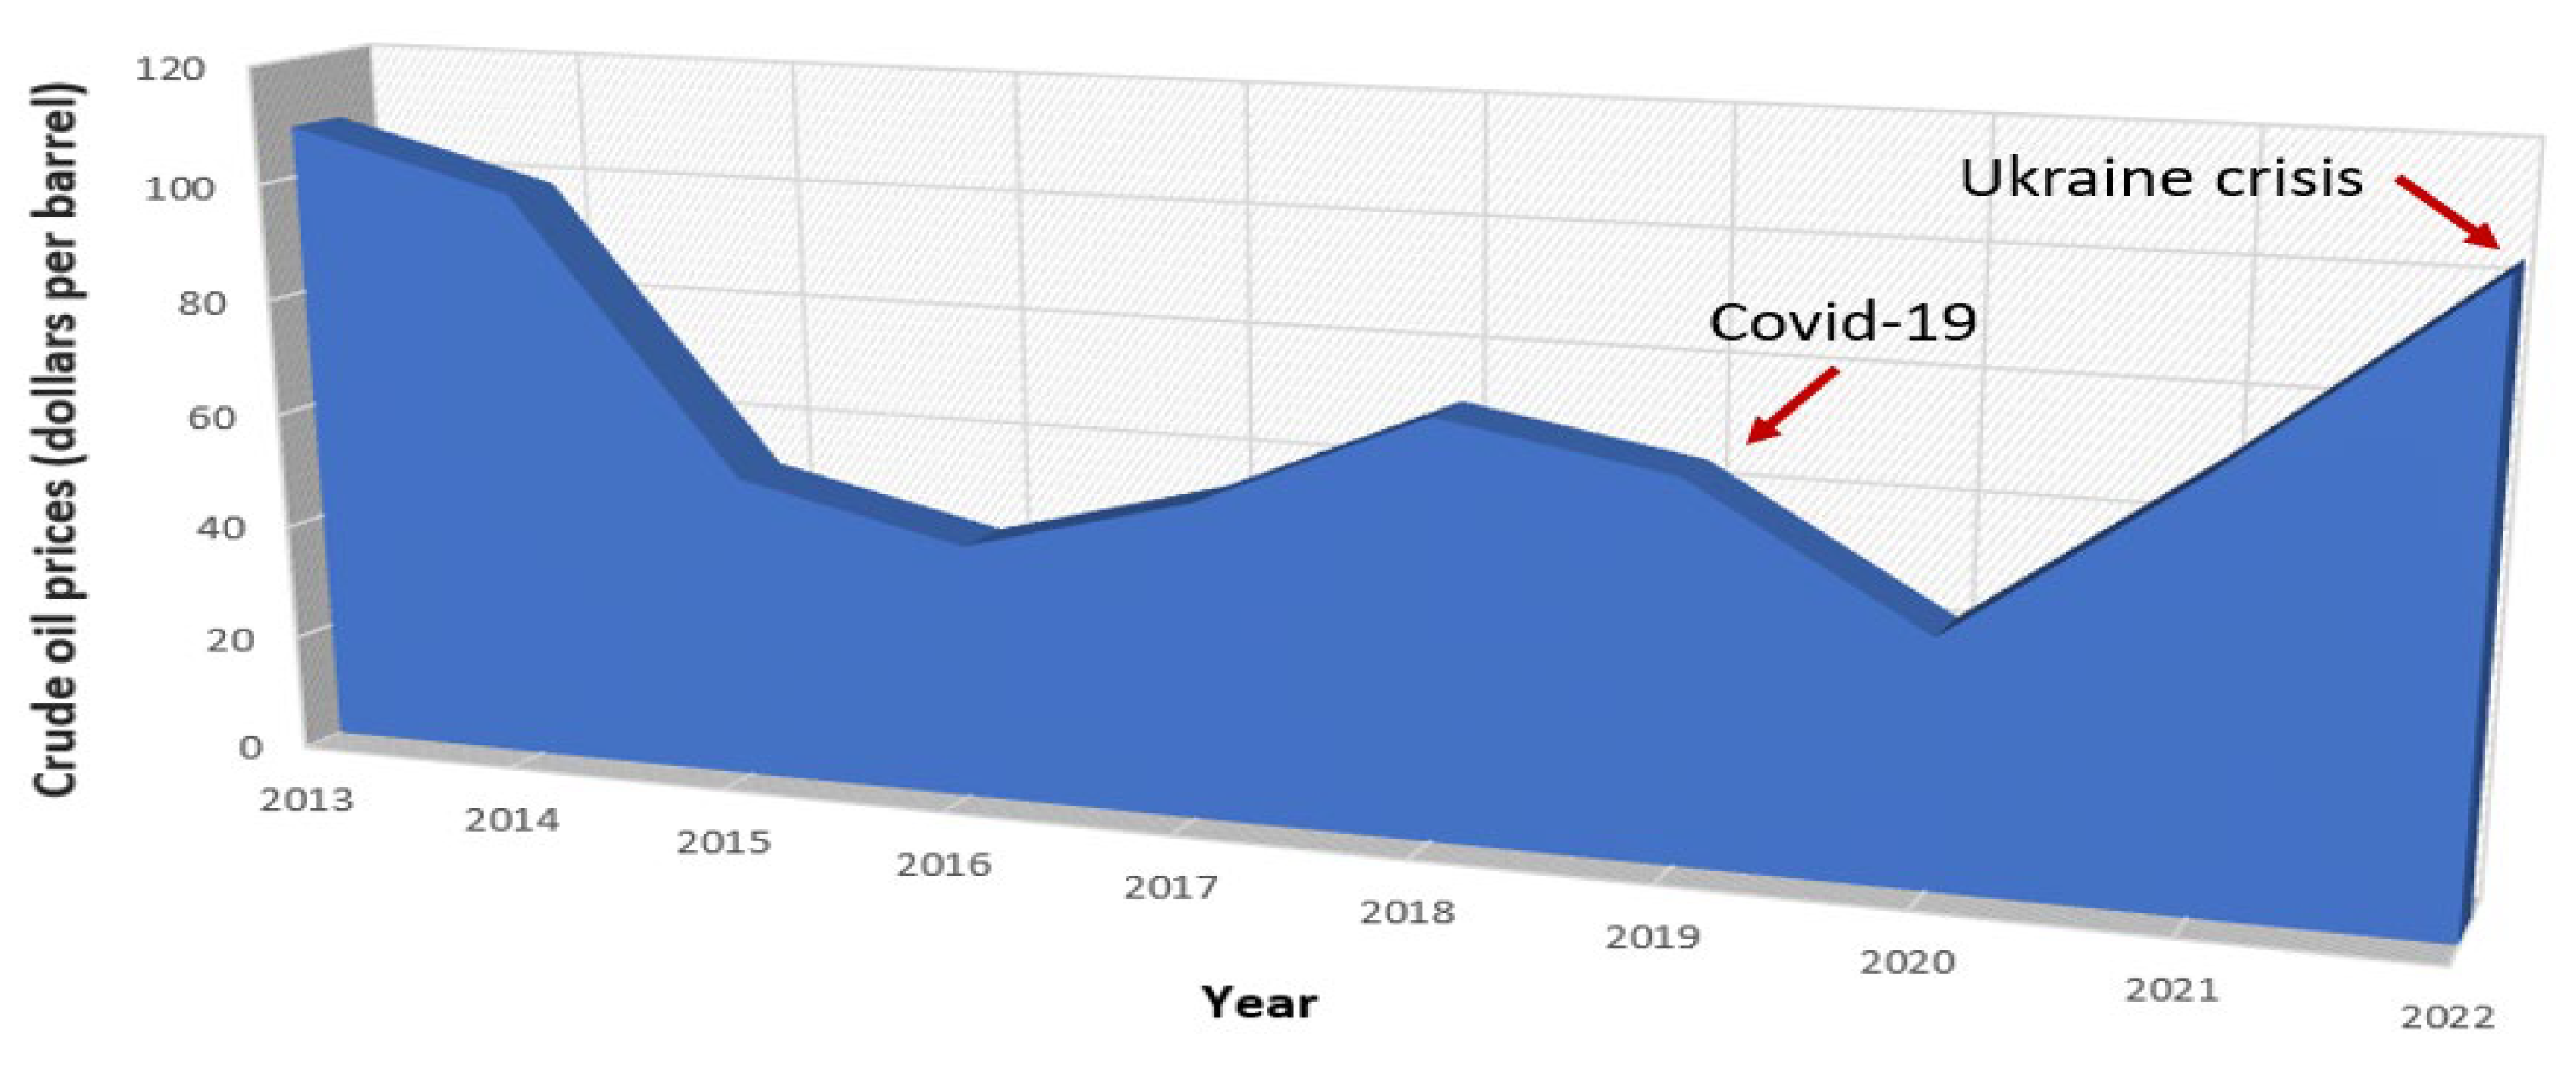
:1. Introduction
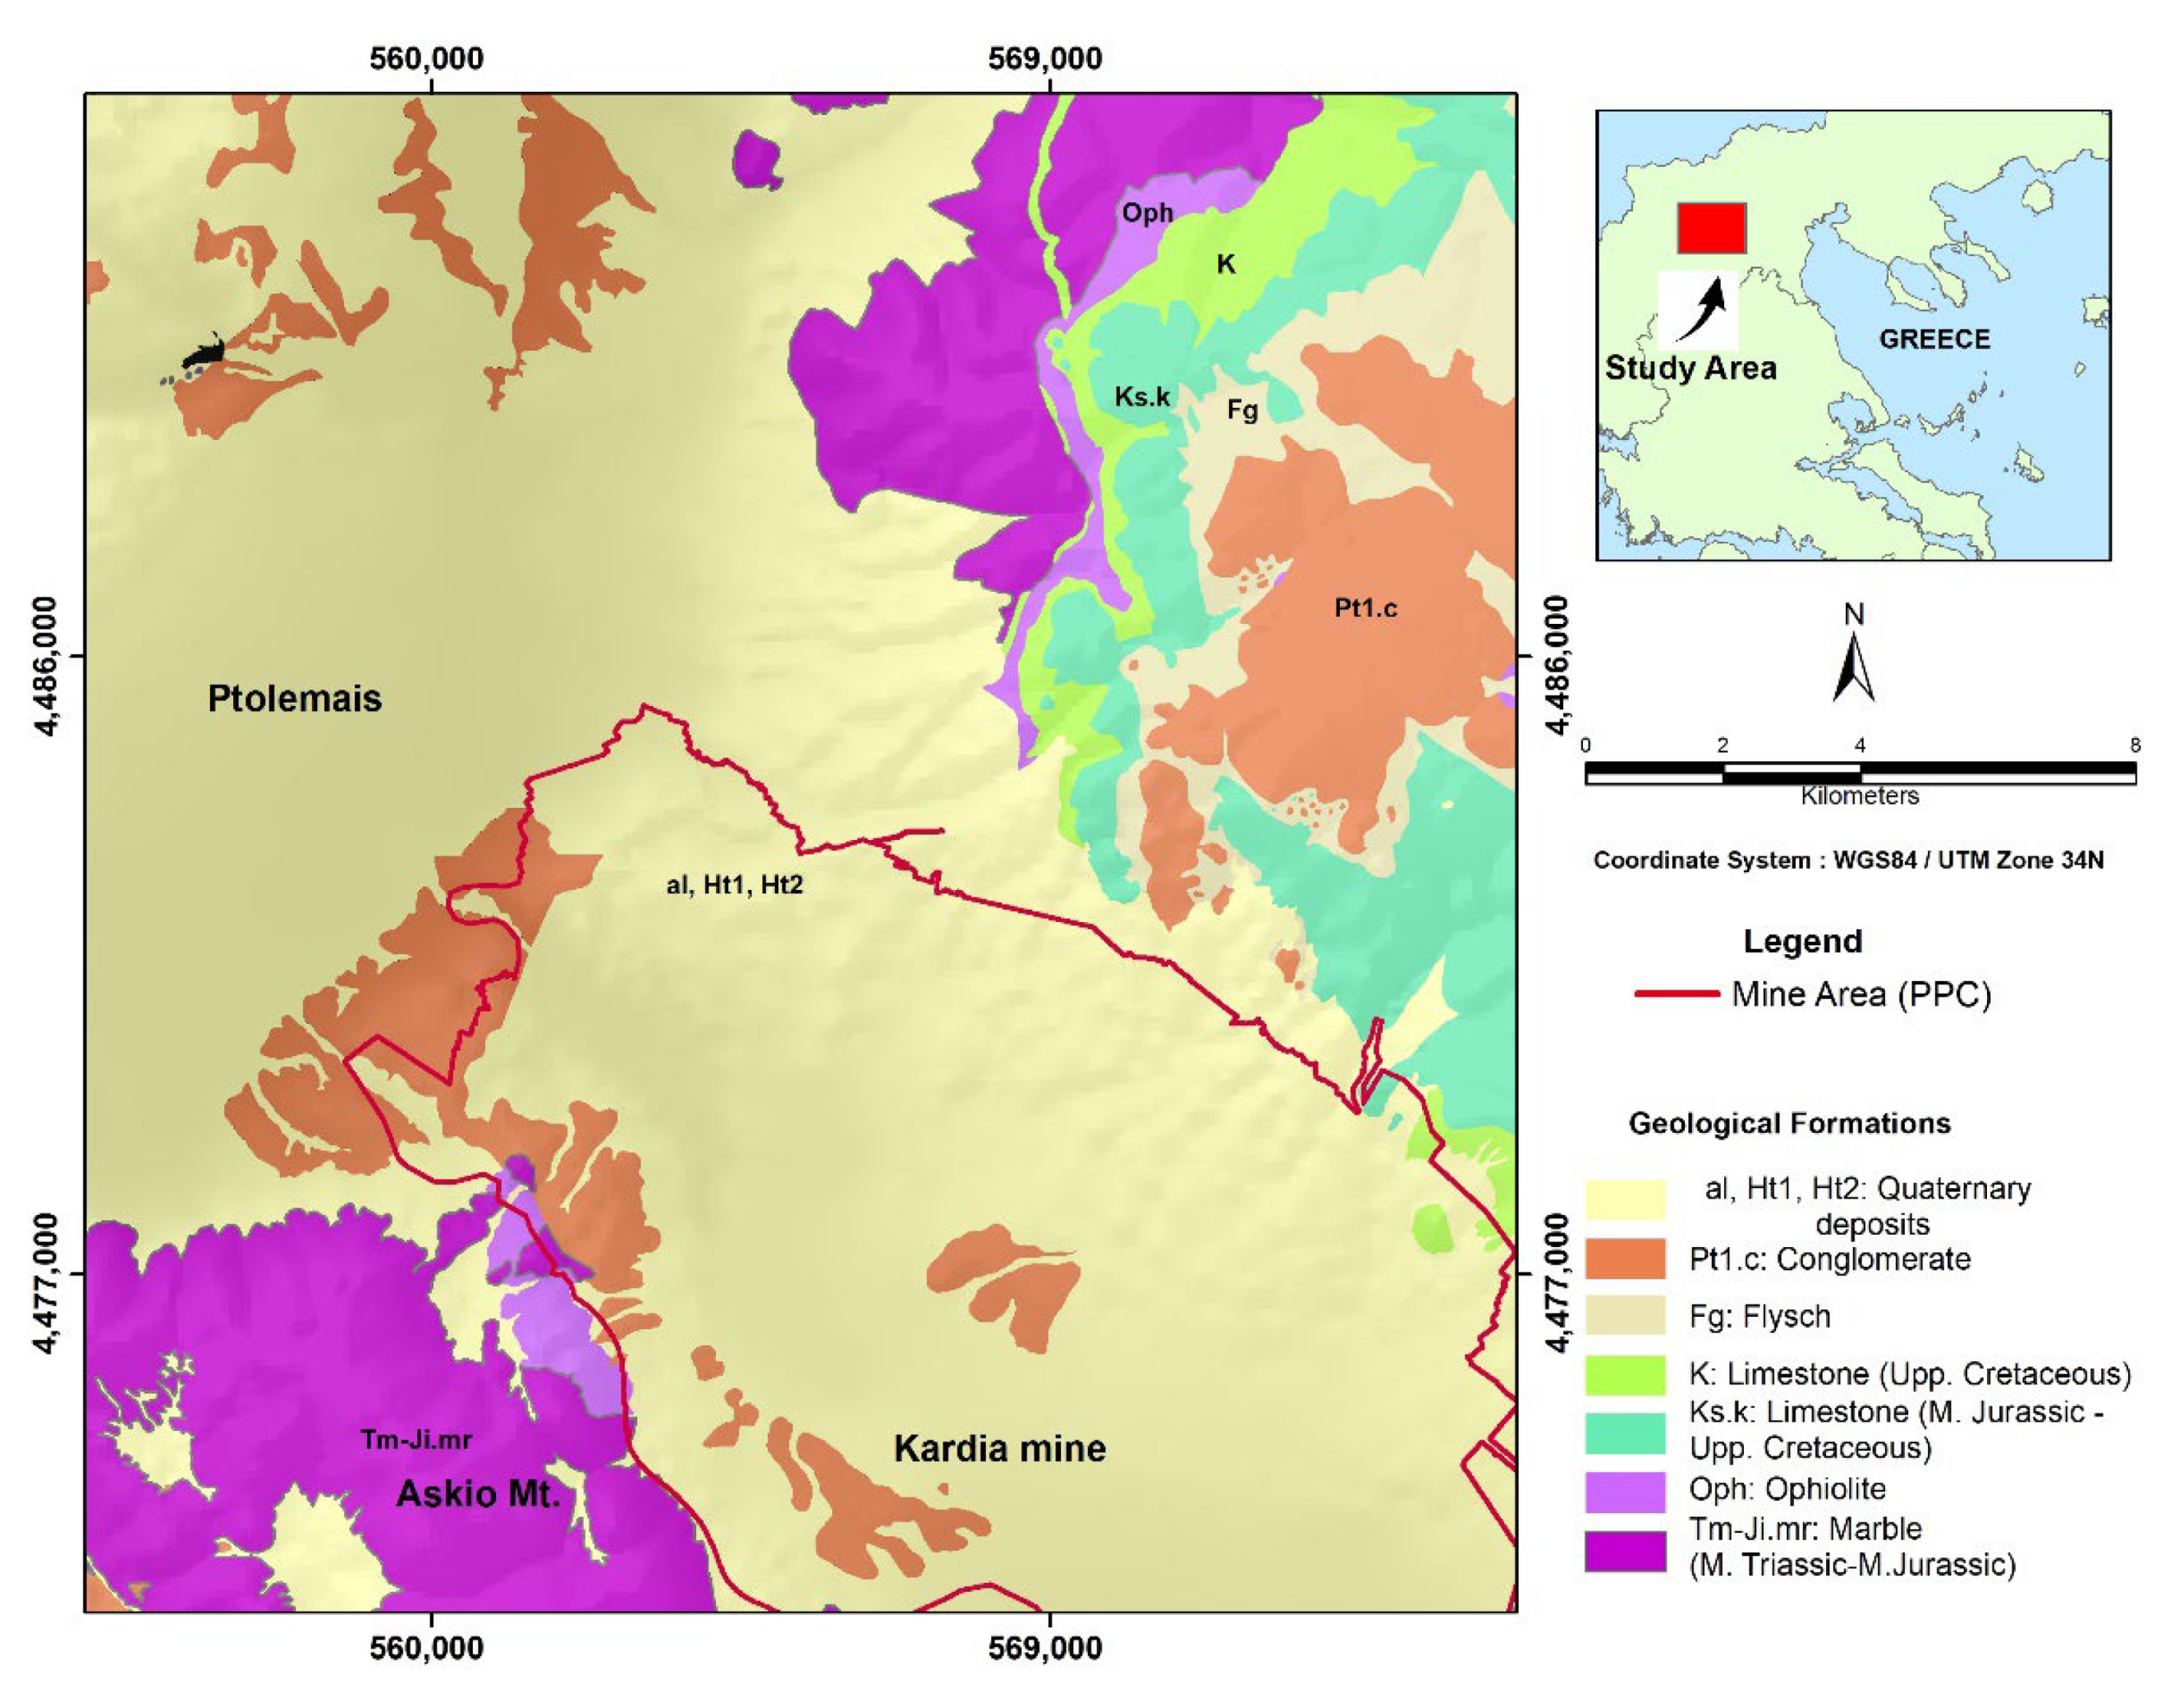
2. Geological and Geomorphological Settings
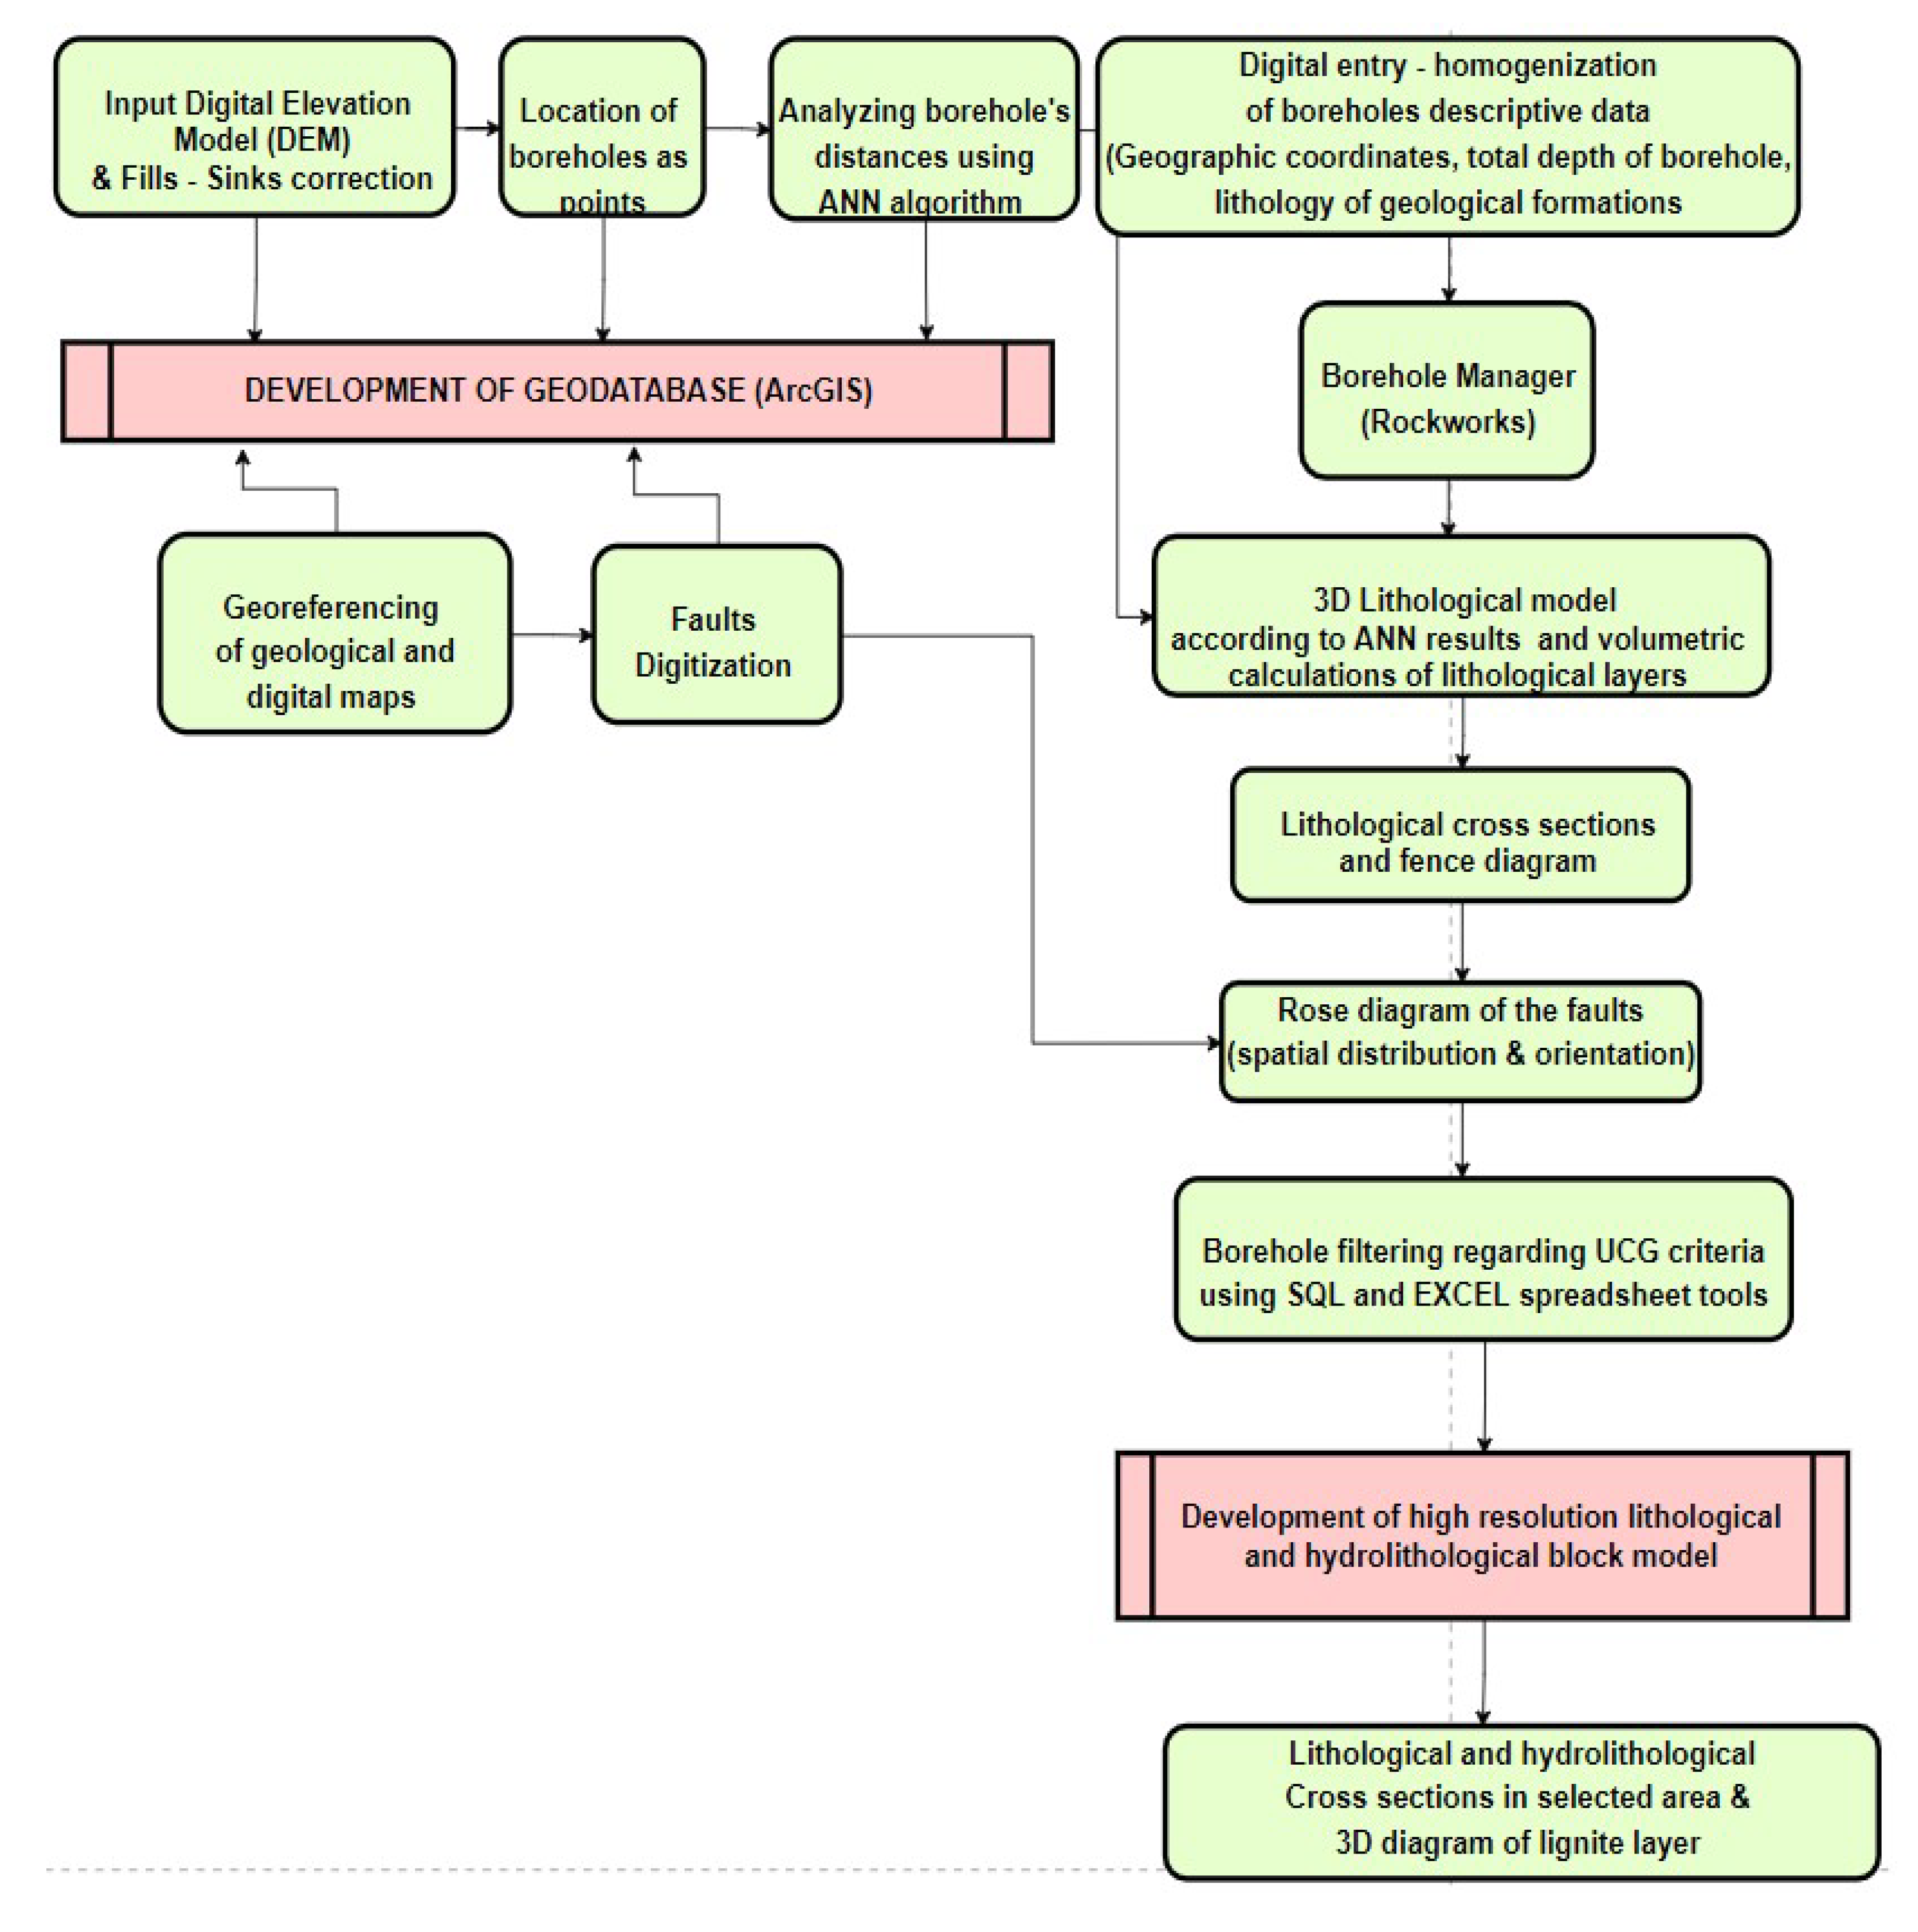
3. Materials and Methods
Geospatial Analysis Framework and Resolution
4. Results and Discussion
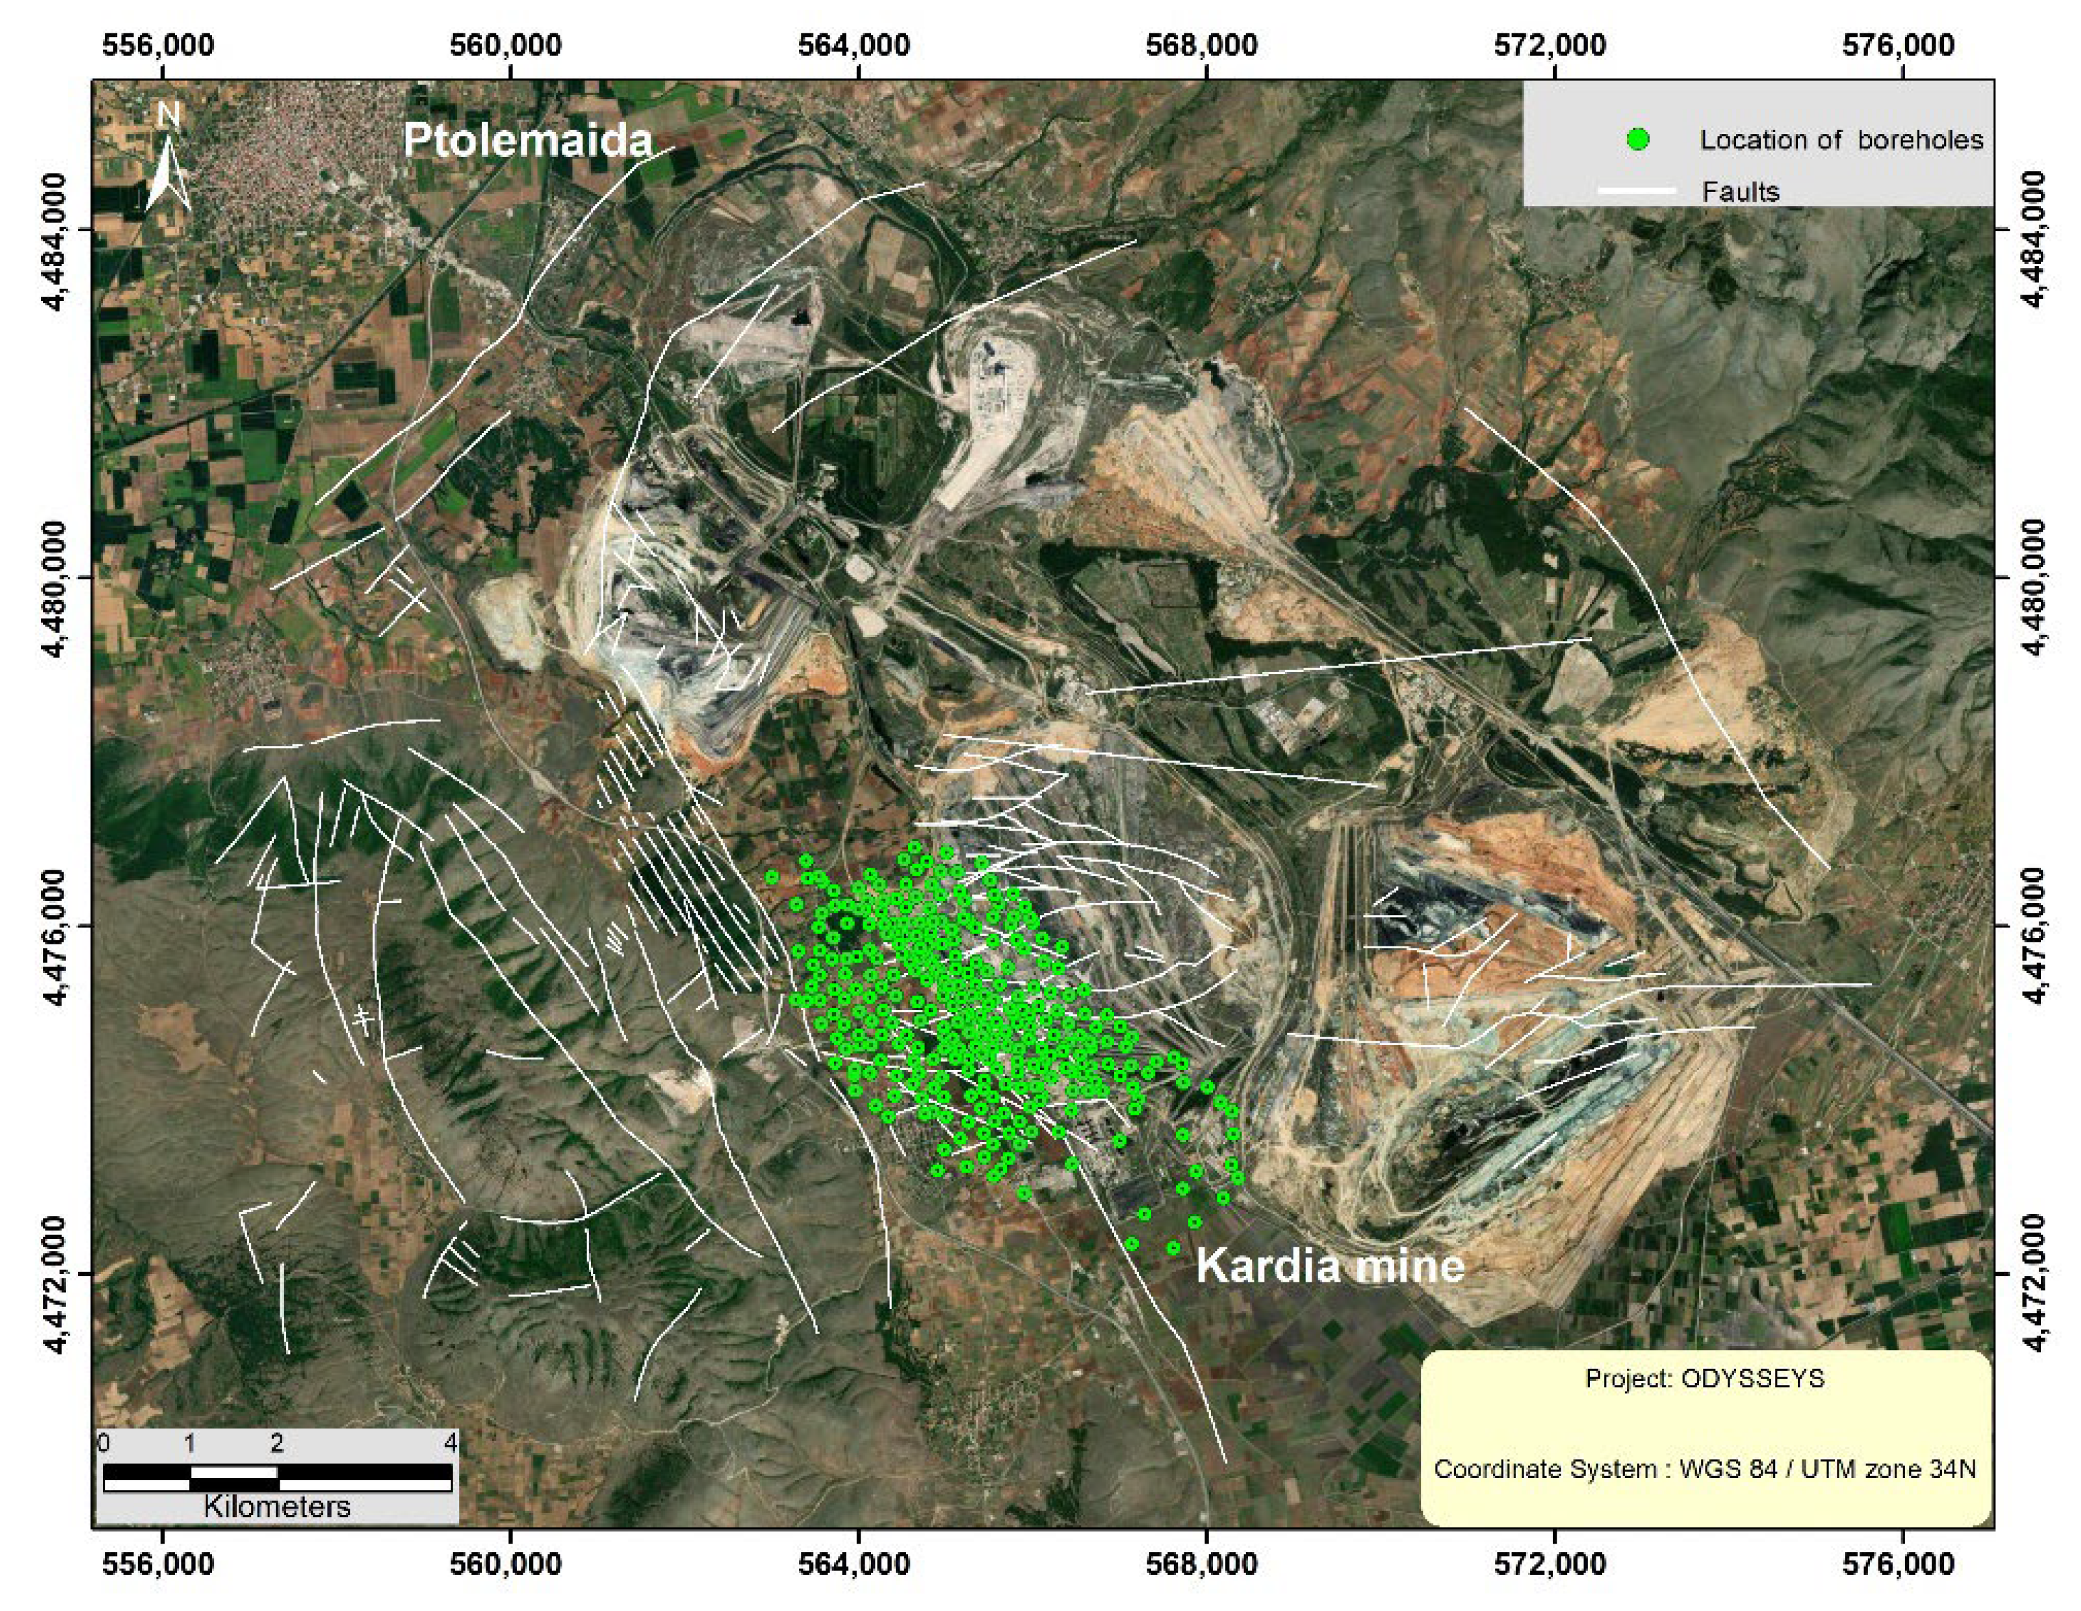
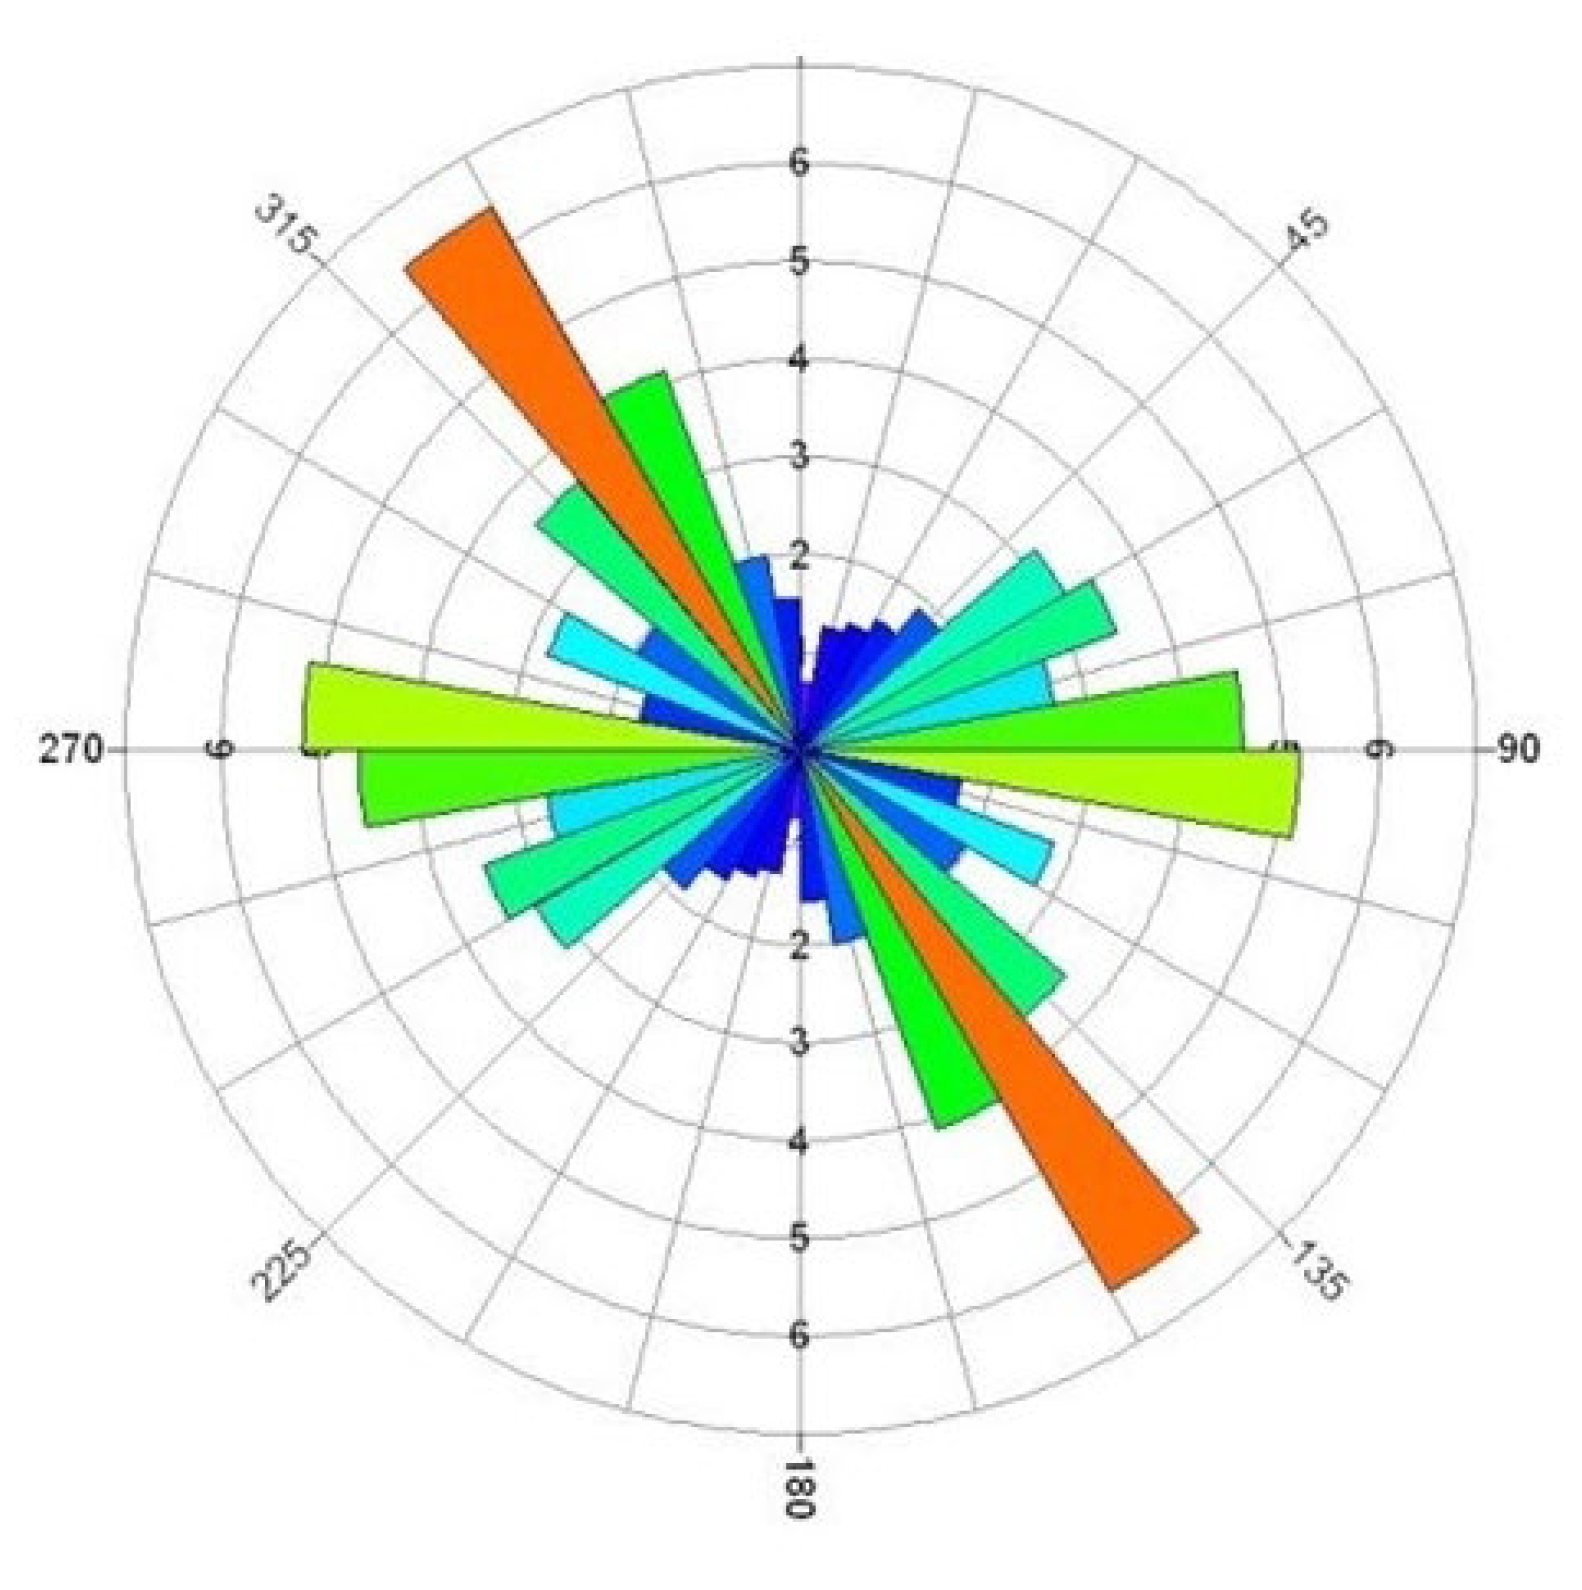
4.1. Geospatial Analysis Results
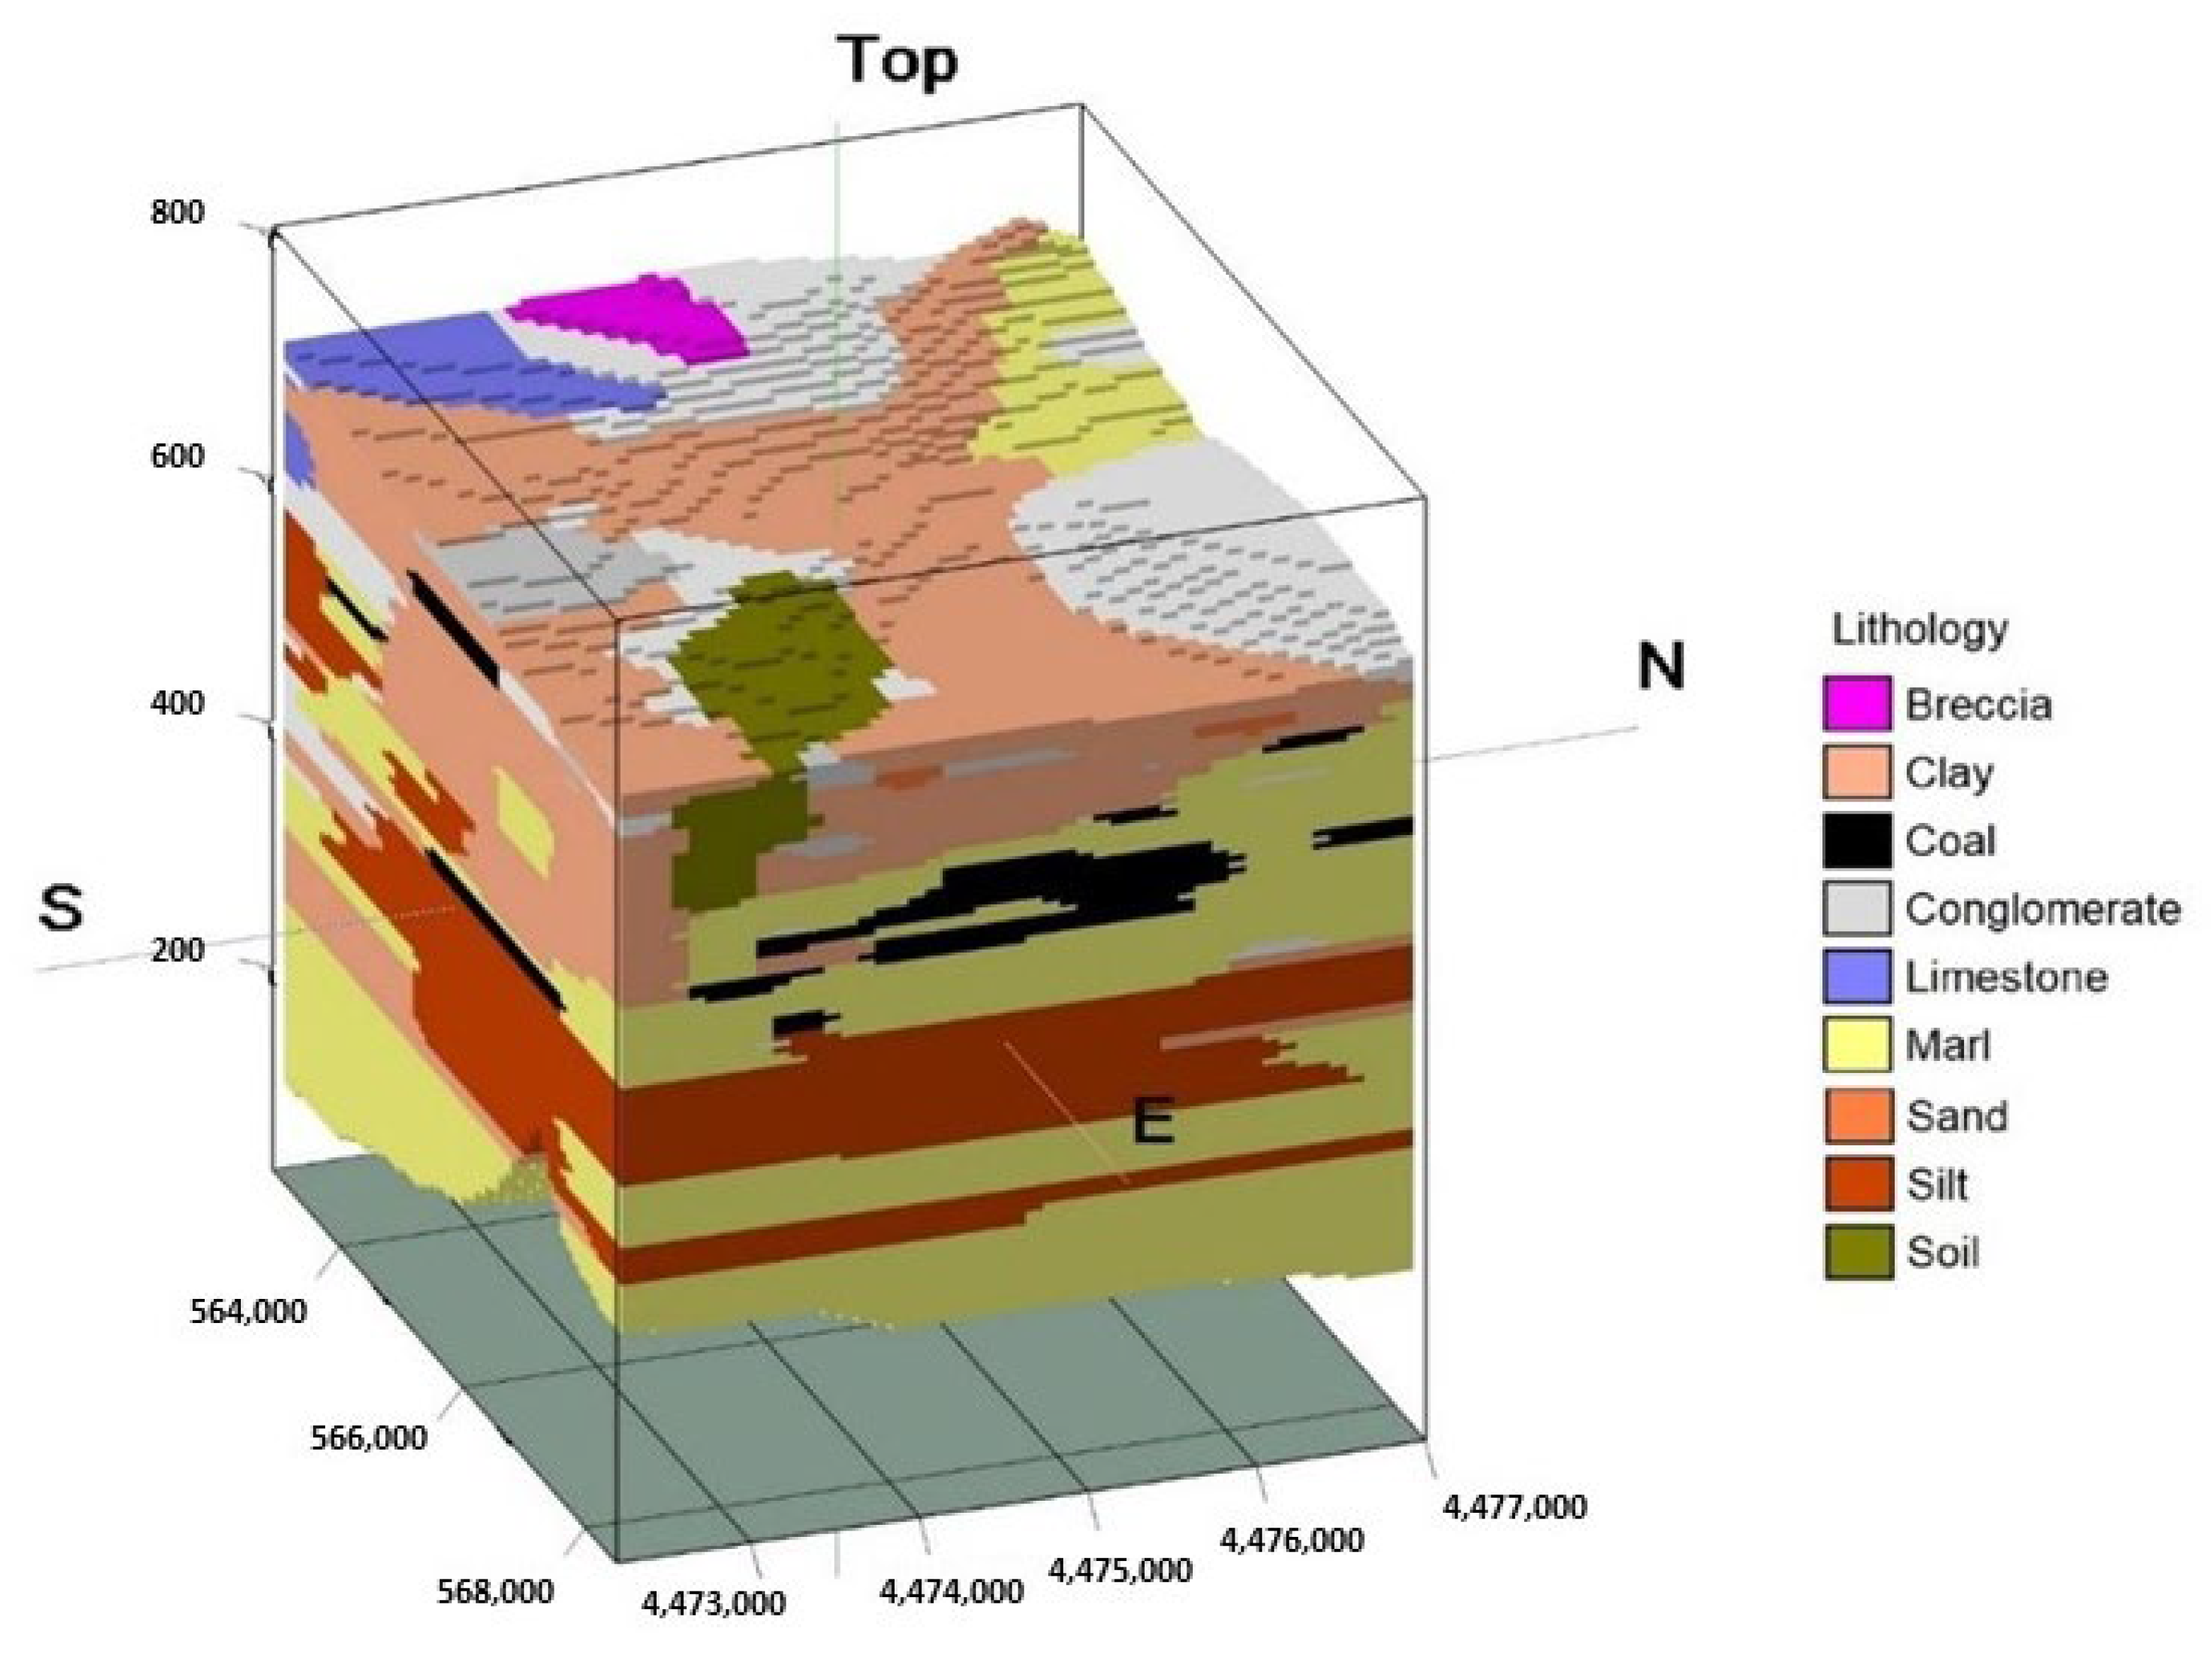
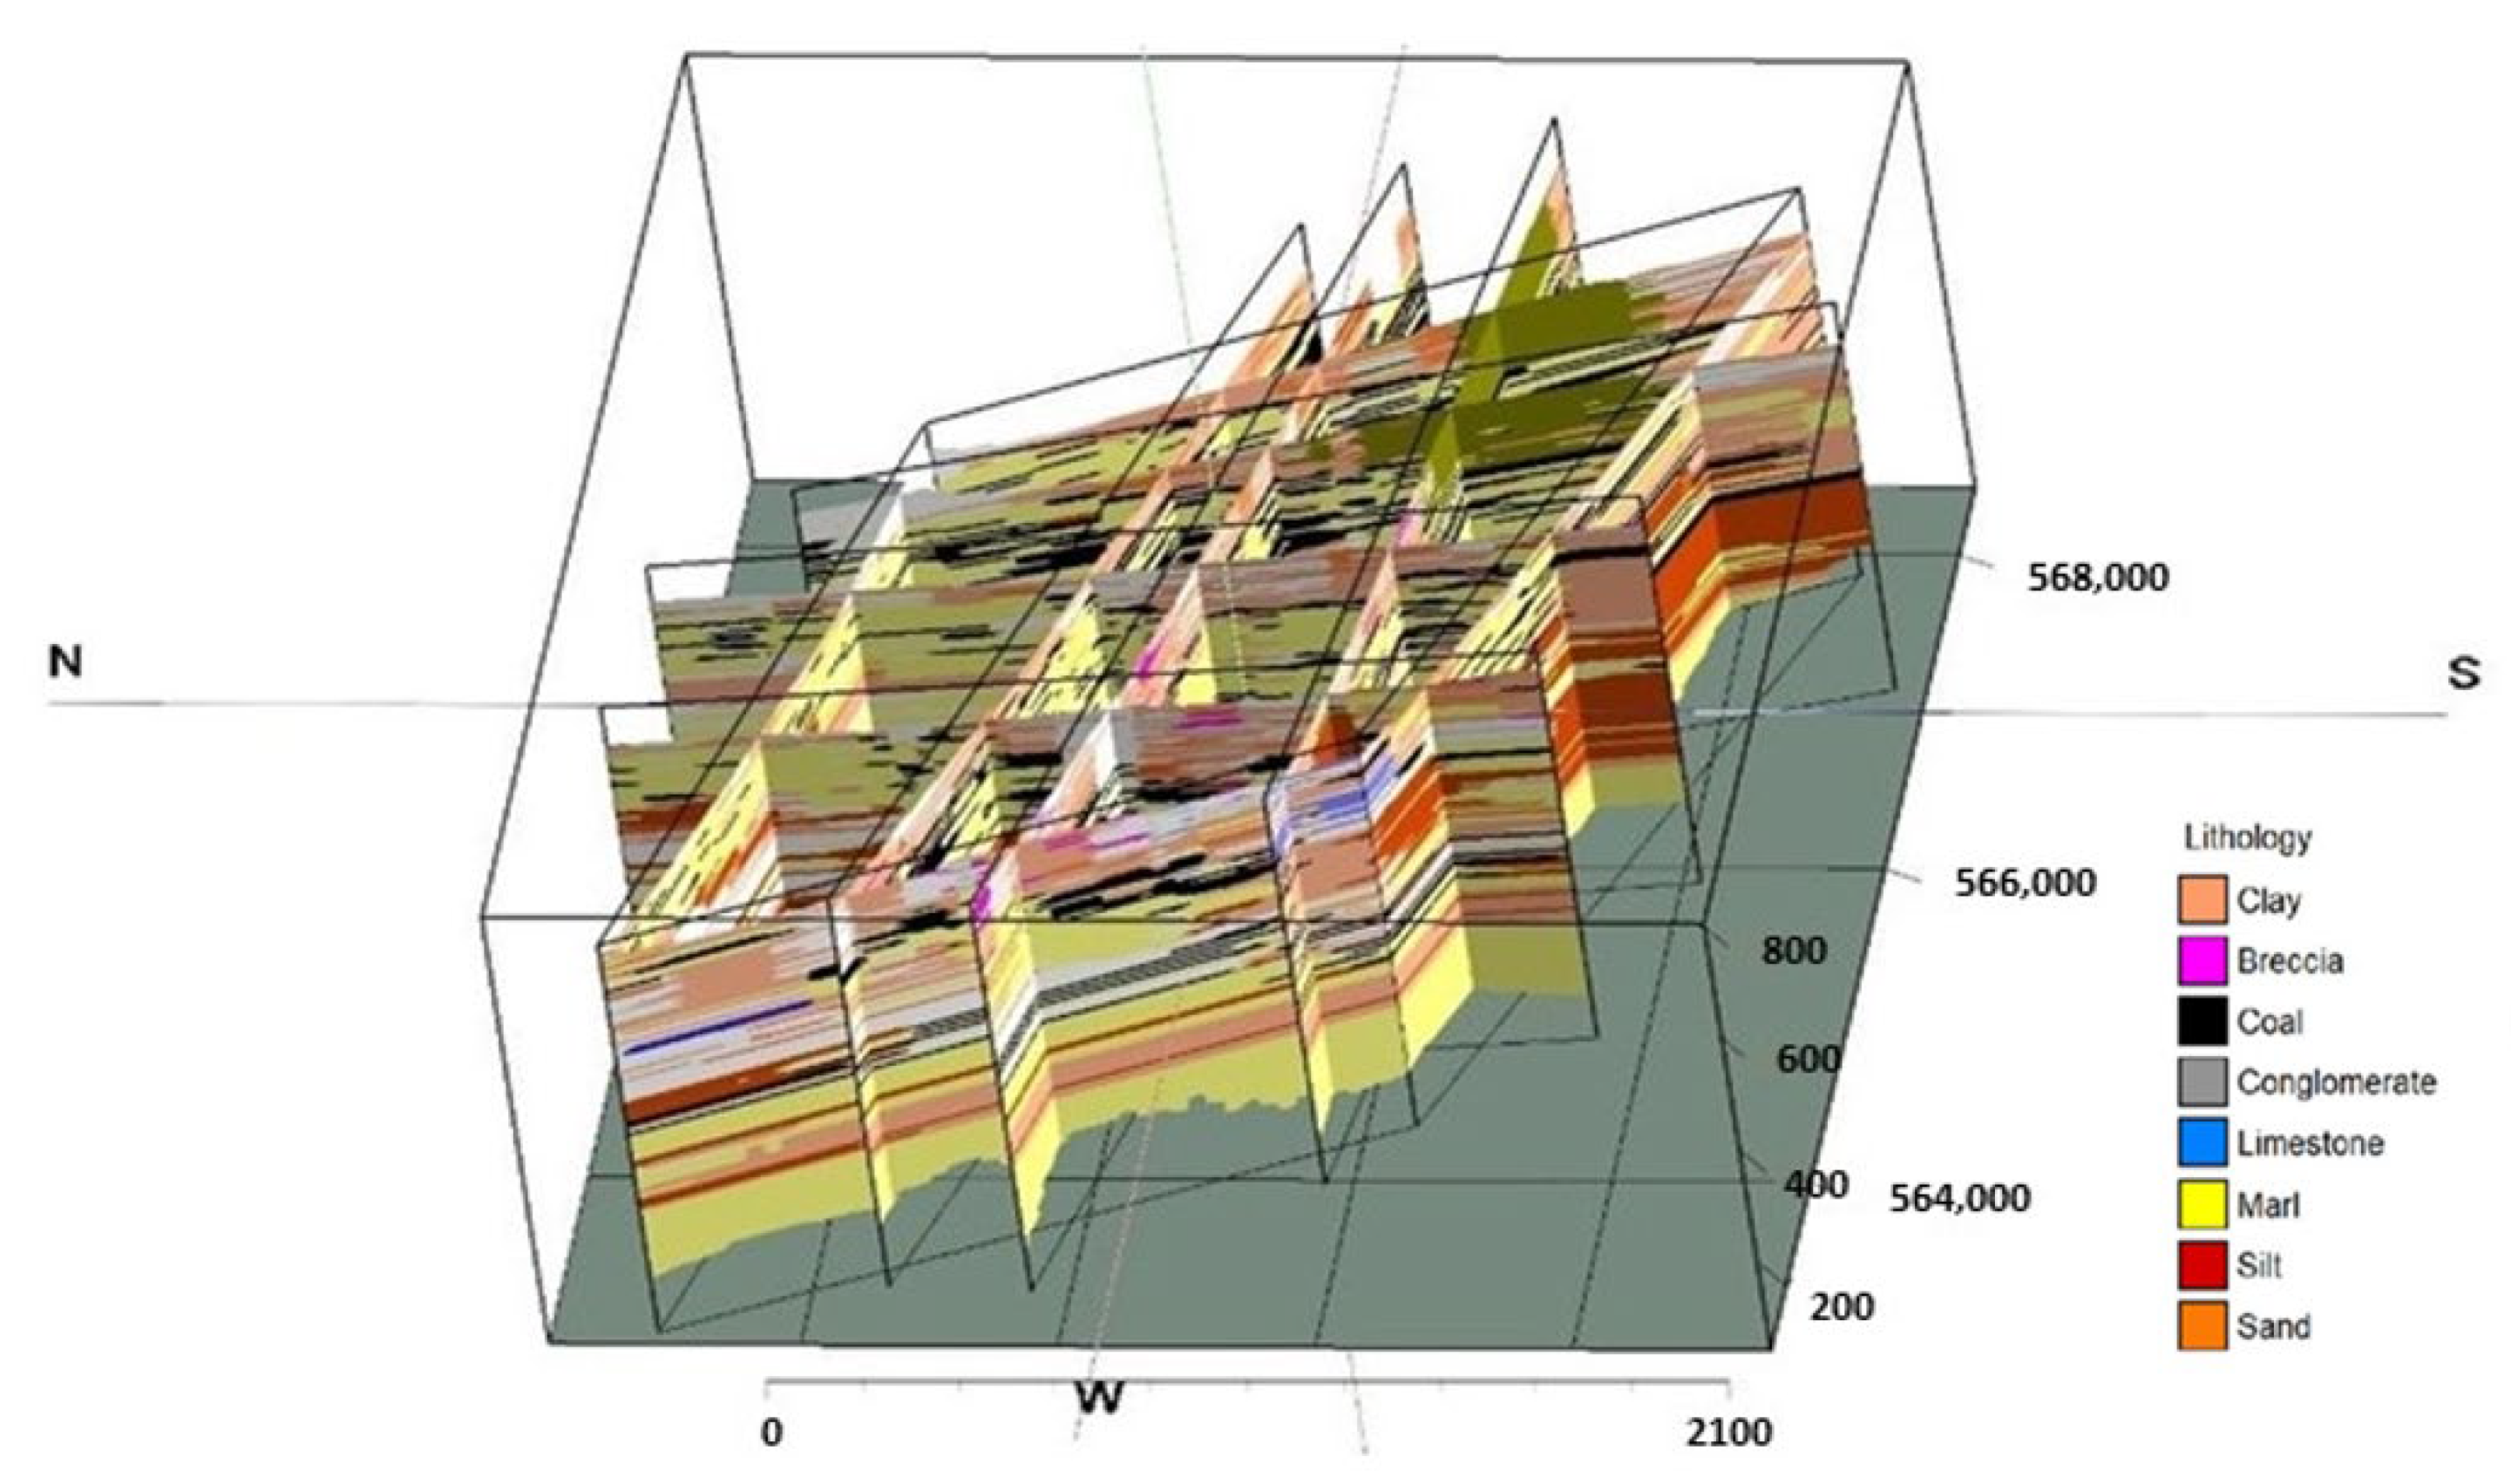
4.2. Three-Dimensional Geological Modelling
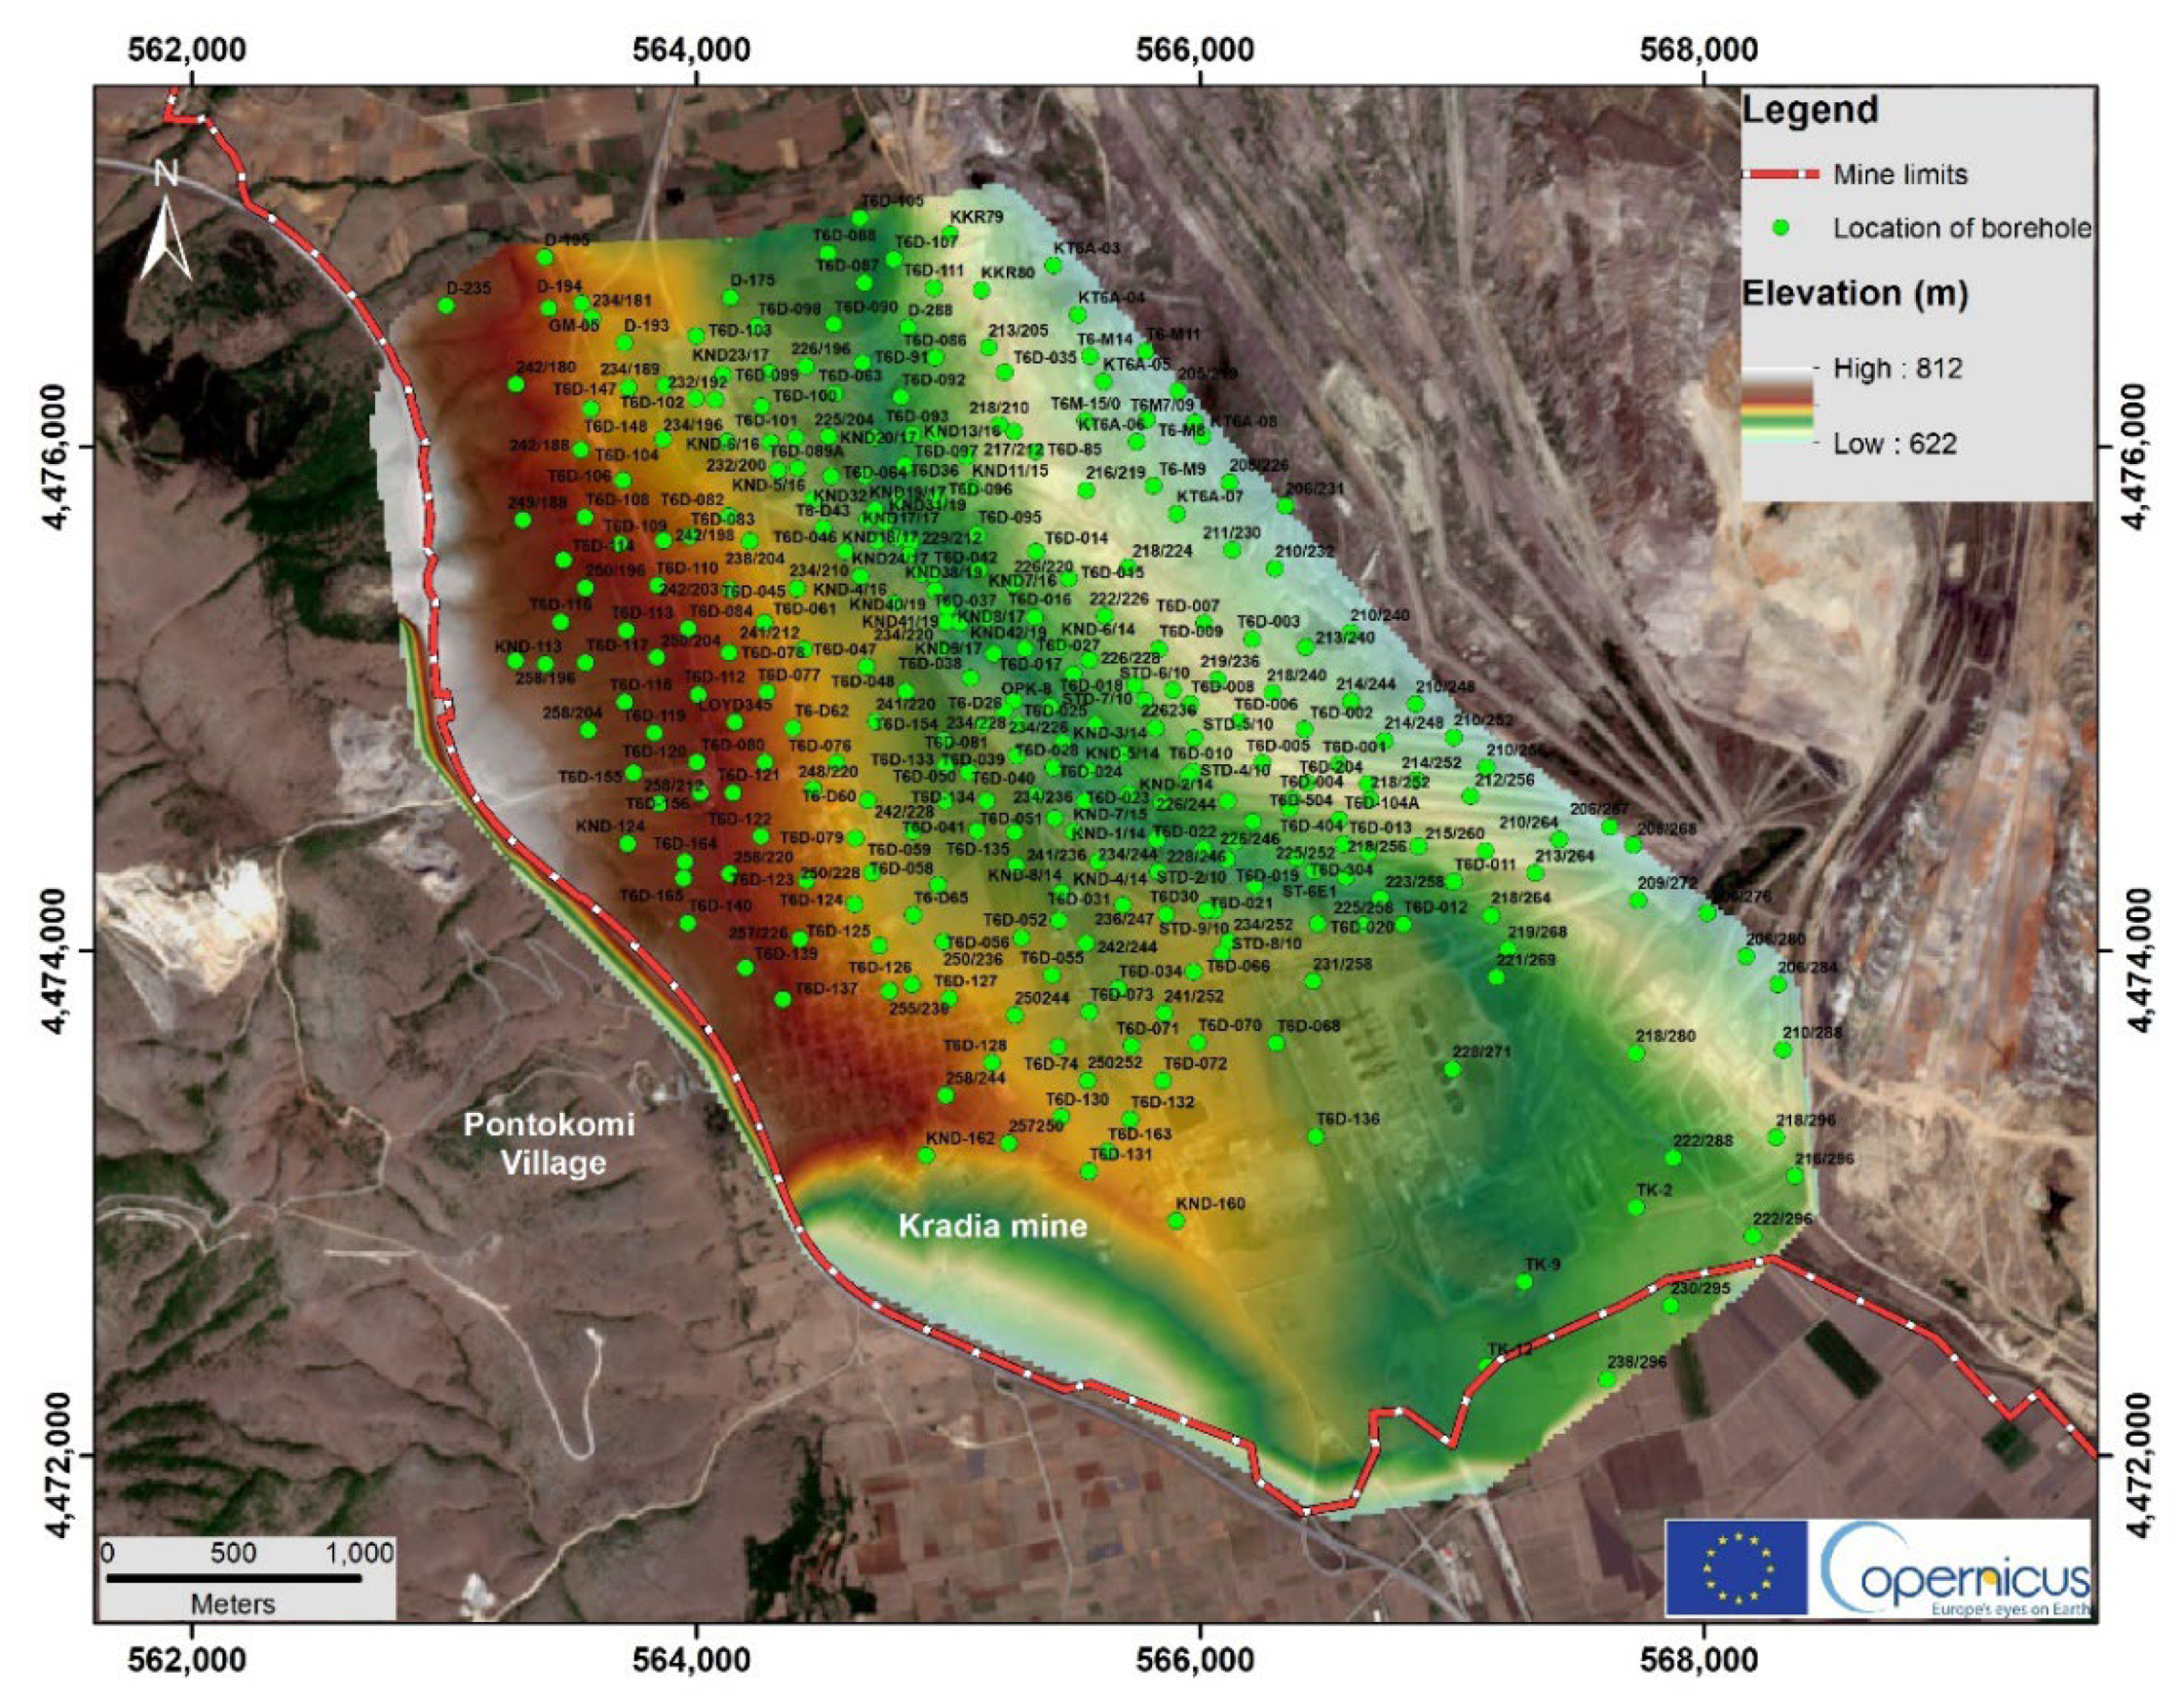
4.3. UCG Site Identification
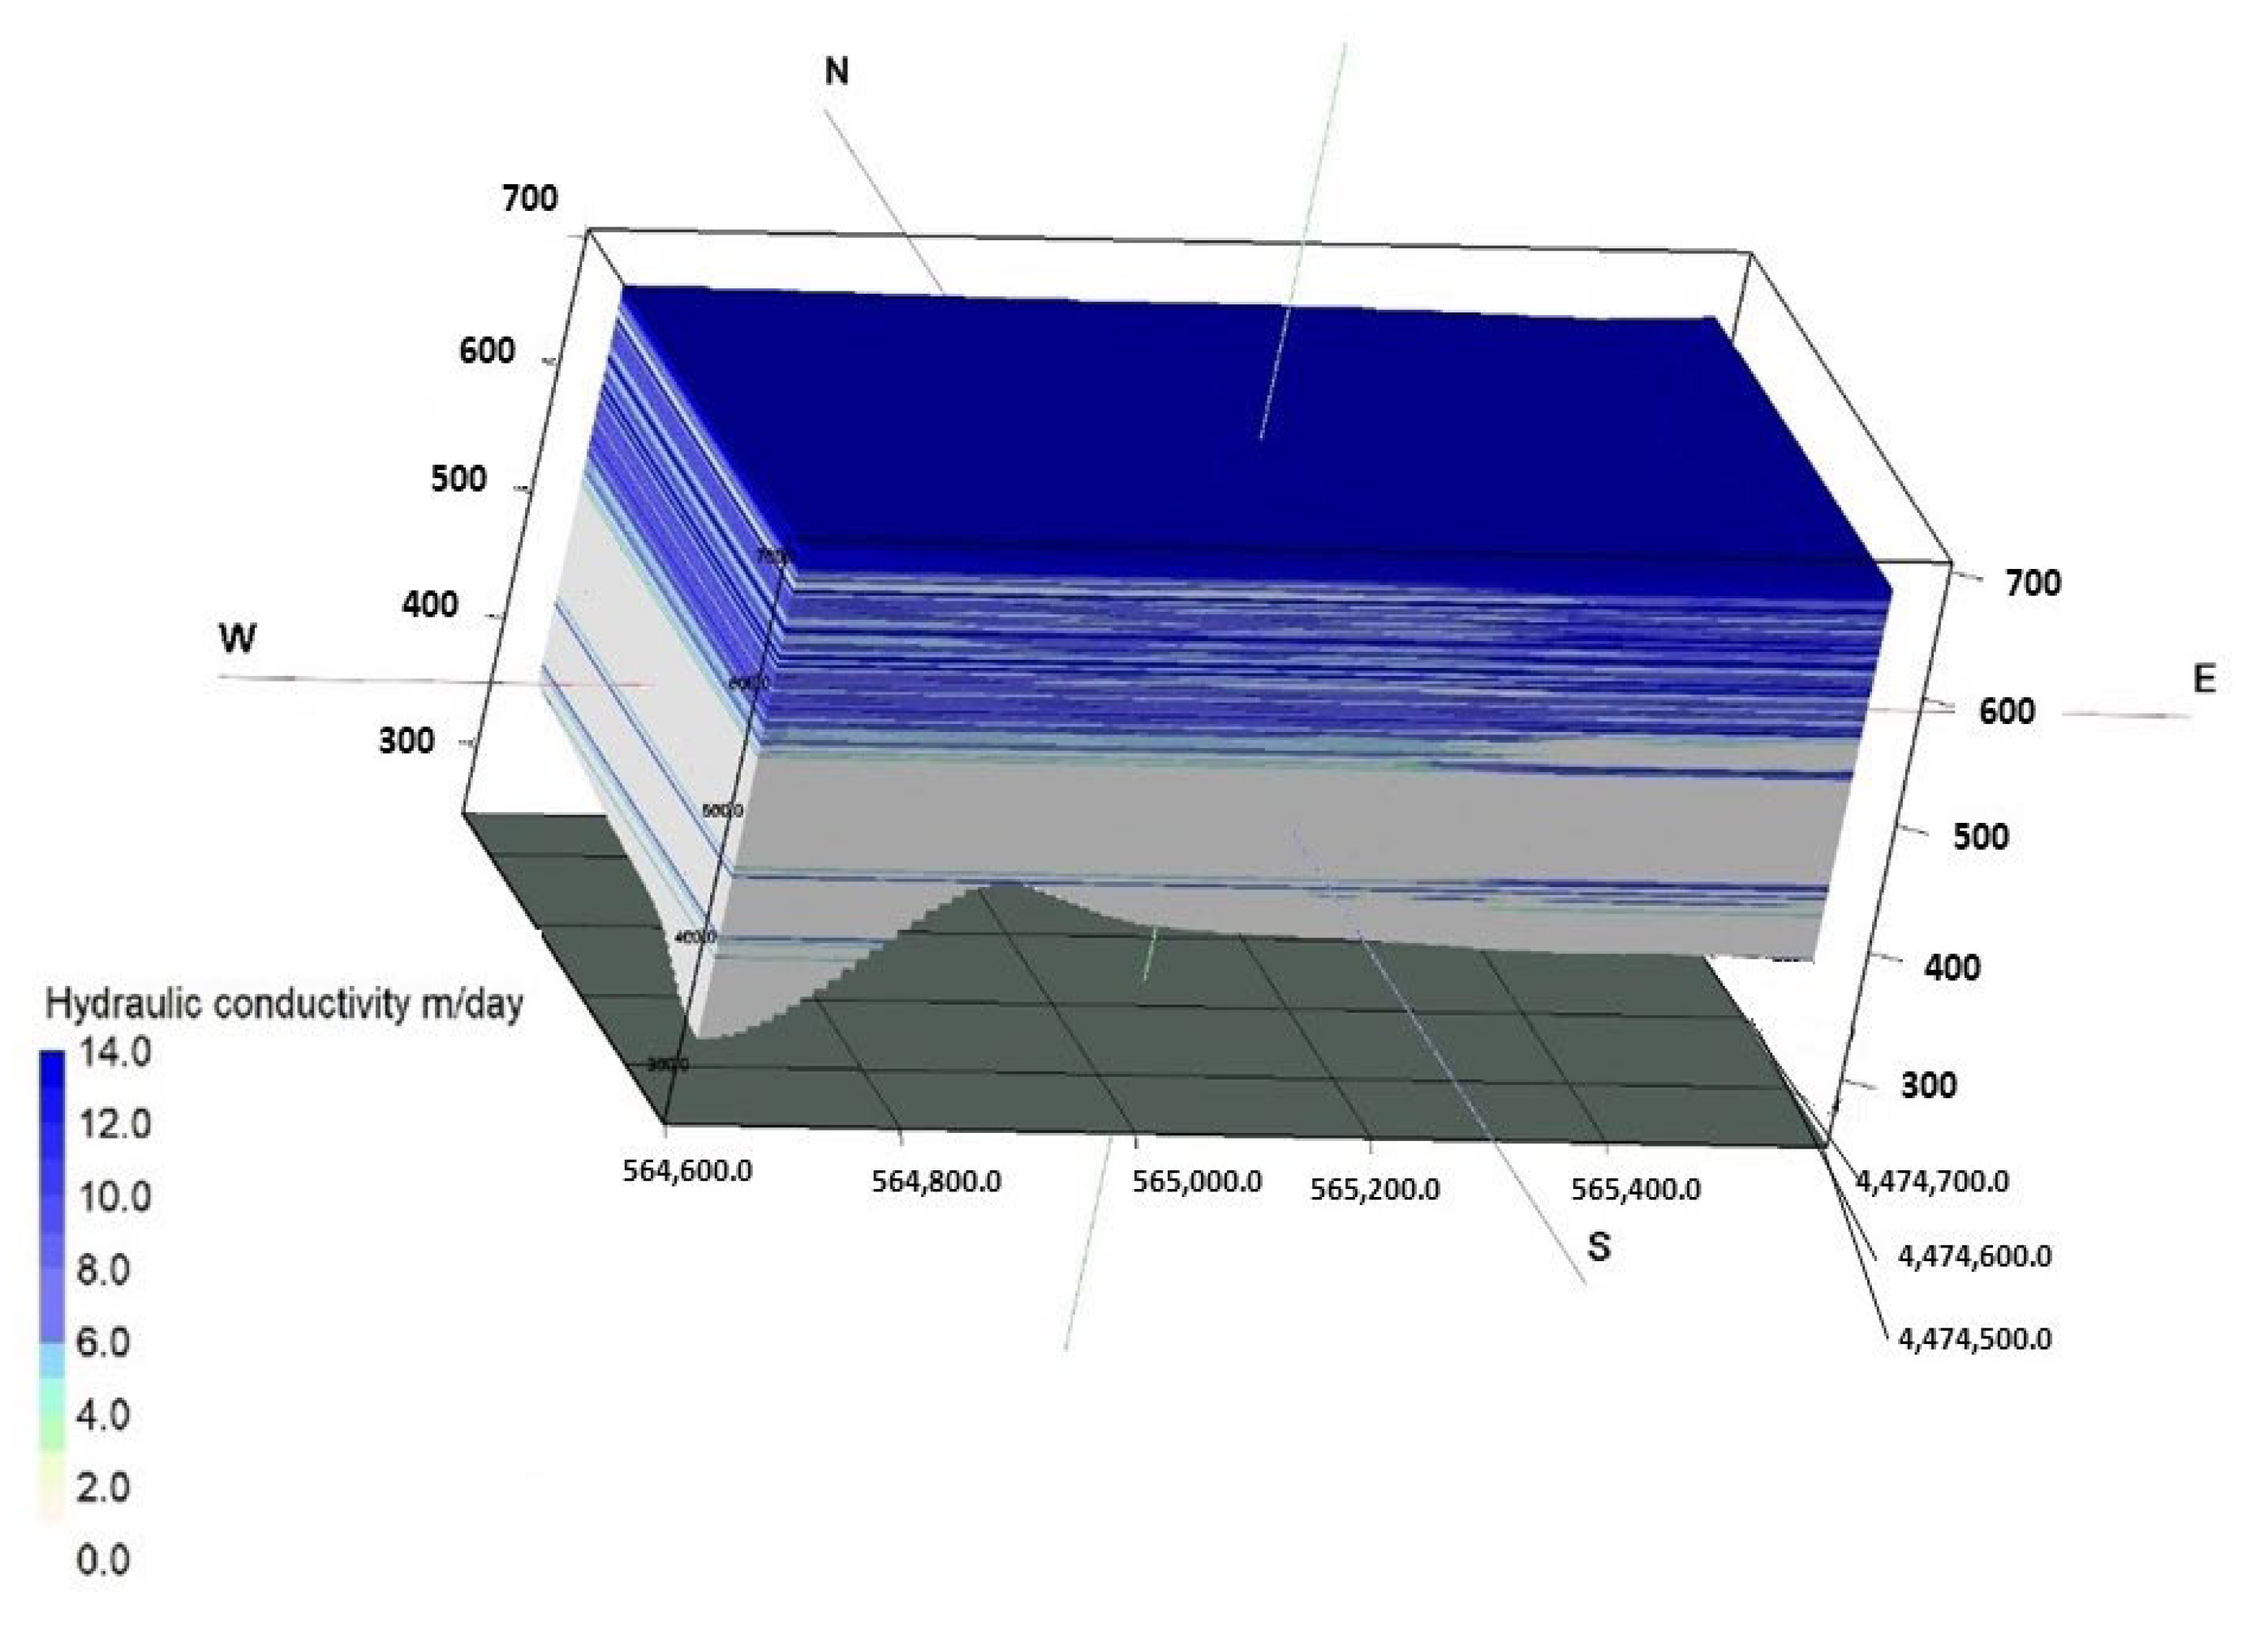
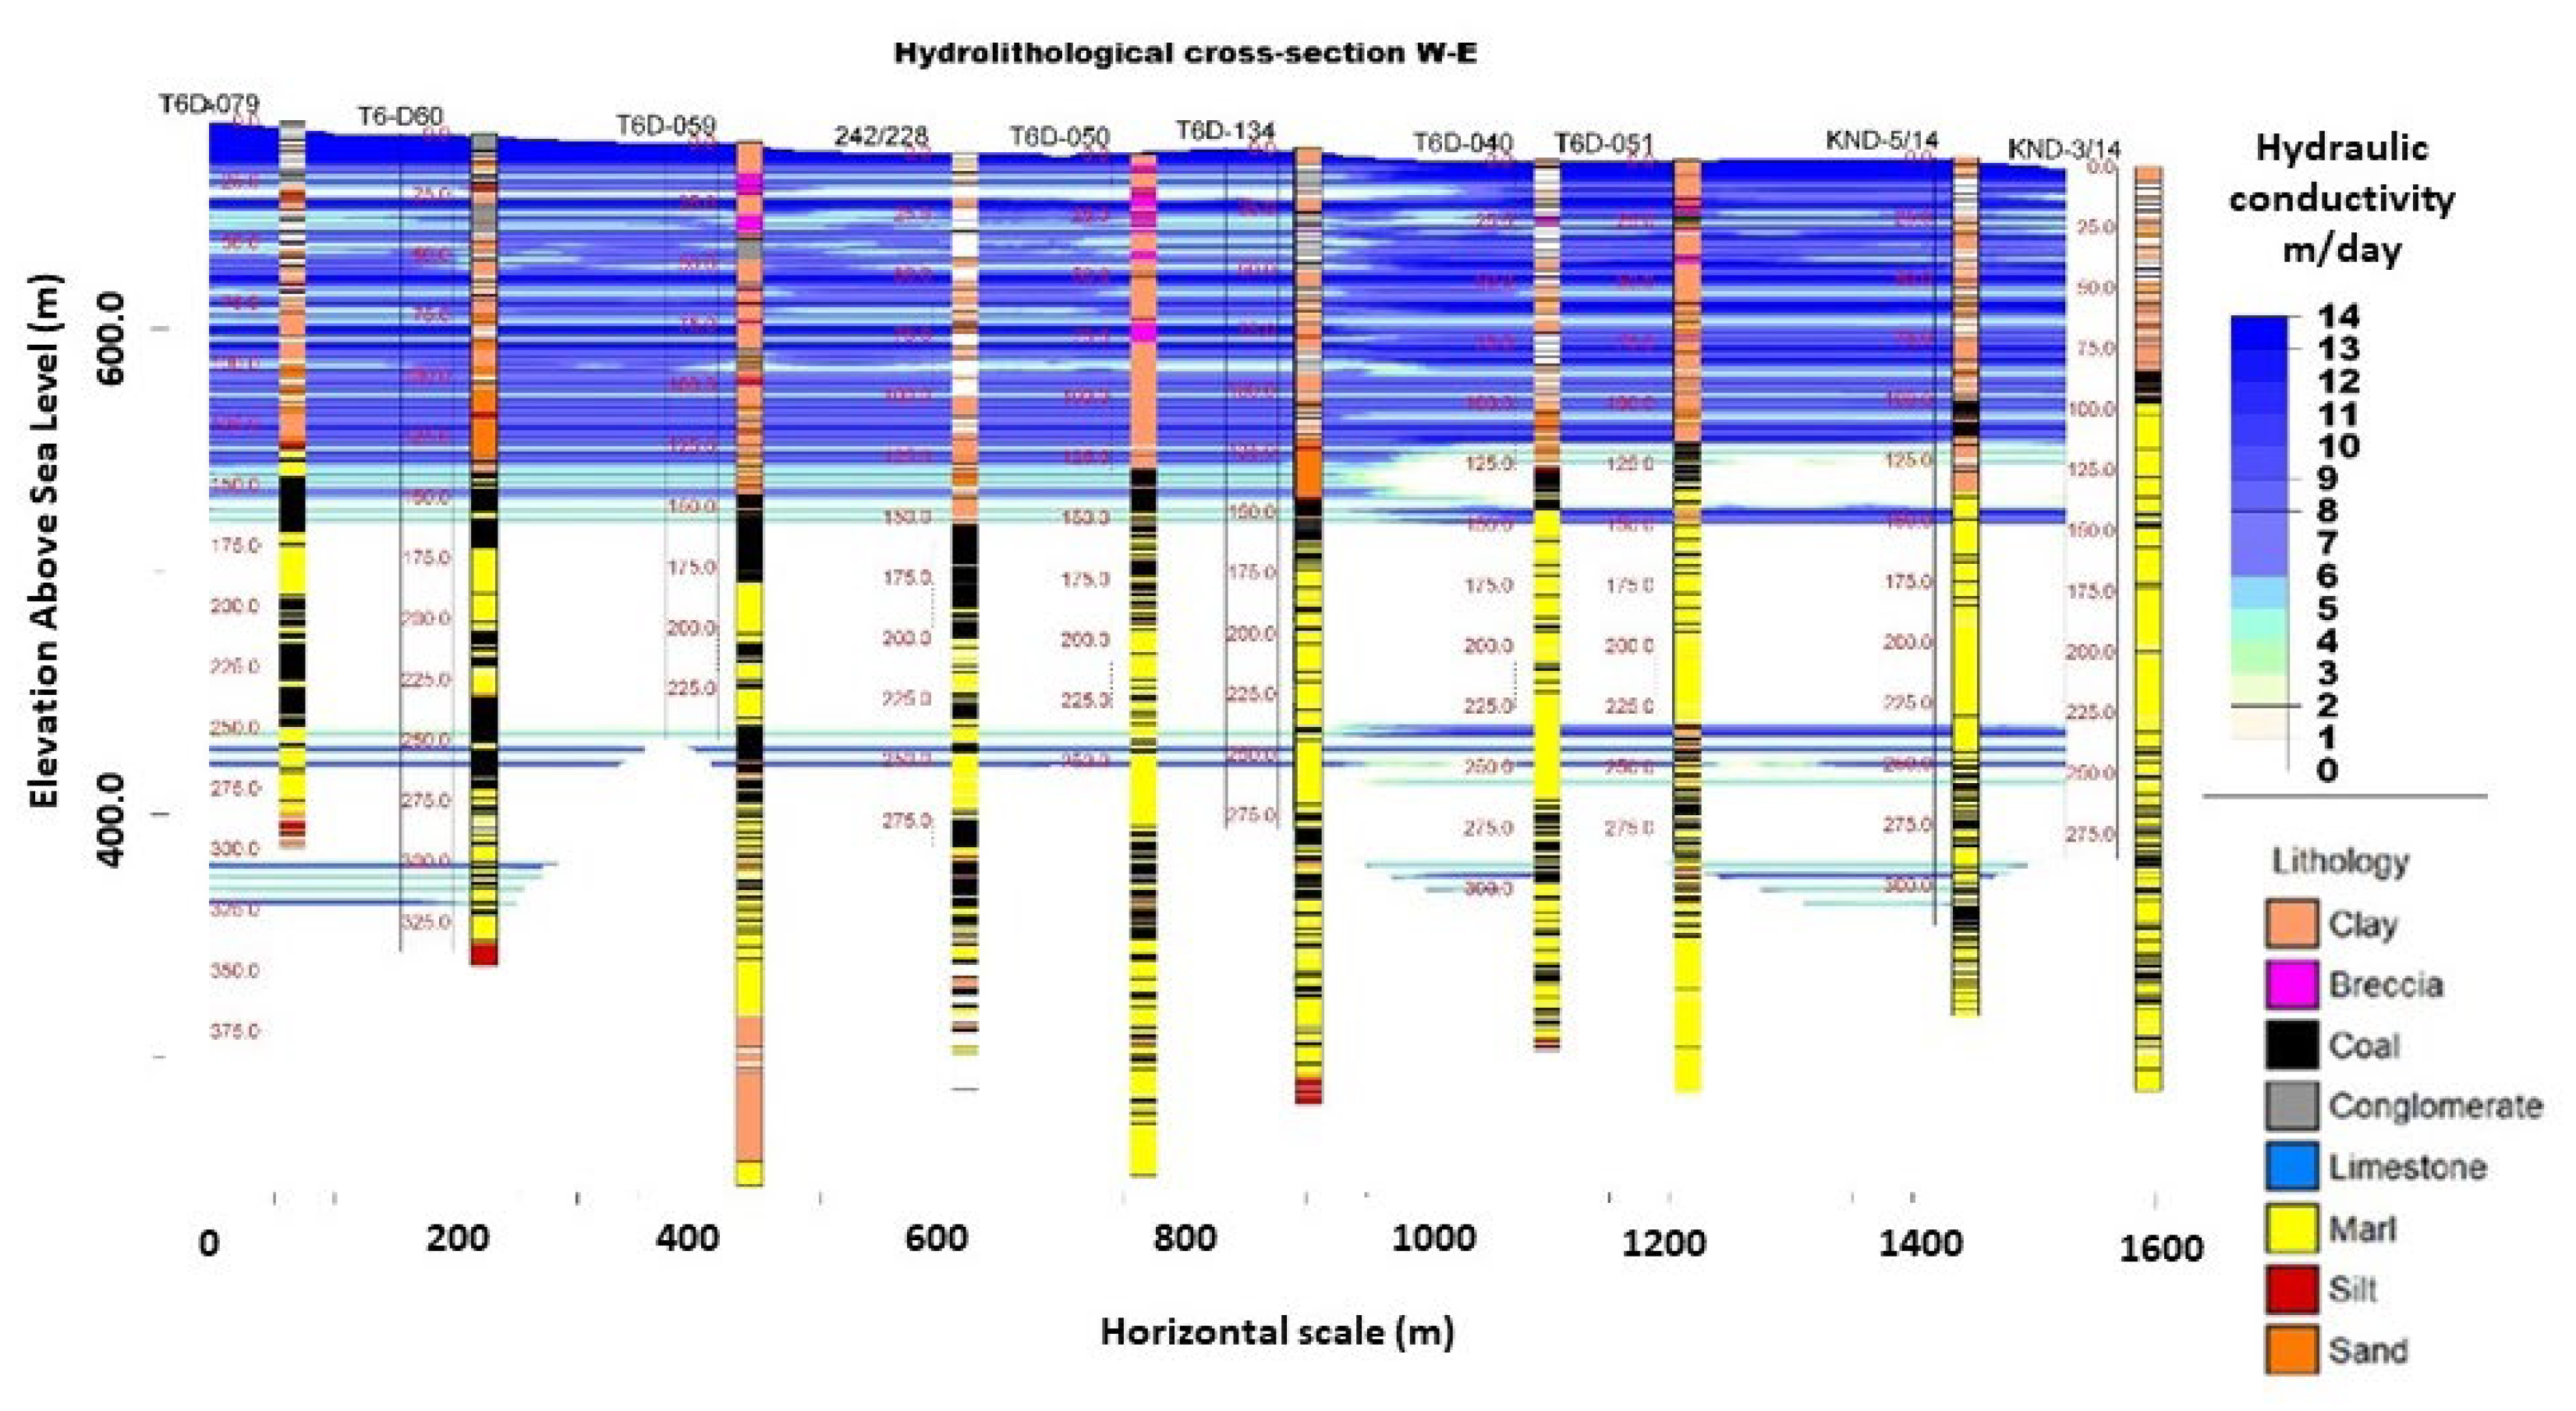
4.4. Three-Dimensional Hydrolithological Model

| Lithology | Hydrolithological Unit | Hydraulic Conductivity Range (m/d) | Average Value (m/d) |
|---|---|---|---|
| Sand, Clay, Breccia, and Conglomerate | Pleistocene–Pliocene formation: Sandy Clay & Sand alternations | 1.03 to 25.92 | 13.48 |
| Marl and Lignite | Lignite sequence: Marl and Lignite alternations | 0.05 to 0.32 | 0.191 |
5. Conclusions
- The creation of a geoinventory and the development of a GIS-managed database;
- The generation of 2D maps and 3D models as long as datasets;
- The creation of 3D lithological and hydrolithological models through a solid modeling methodology and regarding spatial analysis and SQL queries;
- The identification of a suitable area regarding borehole information, UCG major criteria, and spatial distribution of lithology,
- The development of a new high-resolution model to better interpret and understand the subsurface conditions.
Author Contributions
Funding
Data Availability Statement
Acknowledgments
Conflicts of Interest
References
- IEA. Crude Oil Prices Rise Above $100 Per Barrel after Russia’s Further Invasion into Ukraine. Available online: https://www.eia.gov/todayinenergy/detail.php?id=51498 (accessed on 10 March 2022).
- IEA. Coal 2021, IEA, Paris. 2021. Available online: https://www.iea.org/reports/coal-2021 (accessed on 17 January 2022).
- Pershad, S.; van der Riet, M.; Brand, J.; van Dyk, J.; Love, D.; Feris, J.; Strydom, C.C.; Kauchali, S. SAUCGA: The potential, role, and development of underground coal gasification in South Africa. J. South. Afr. Inst. Min. Metall. 2018, 118, 1009–1019. [Google Scholar] [CrossRef] [Green Version]
- Burton, E.; Friedmann, J.; Upadhye, R. Best Practises in Underground Coal Gasification; Lawrence Livermore National Laboratory: Livermore, CA, USA, 2006.
- Koukouzas, N.; Katsimpardi, I.; Merachev, D. Simulation of Underground Coal Gasification process in a Bulgarian Coal field. Bulletin of the Geological Society of Greece, vol. XLVII No 3. In Proceedings of the 13th International Congress, Chania, Greece, 21 January 2013; pp. 2090–2100. [Google Scholar] [CrossRef] [Green Version]
- Sarhosis, V.; Lavis, S.; Mostade, M.; Thomas, H.R. Towards commercialising underground coal gasification in the EU. Environ. Geotech. 2016, 4, 113–122. [Google Scholar] [CrossRef]
- Yang, D.; Koukouzas, N.; Green, M.; Sheng, Y. Recent Development on Underground Coal Gasification and Subsequent CO2 Storage. J. Energy Inst. 2016, 89, 469–484. [Google Scholar] [CrossRef]
- Tyurina, E.A.; Elsukov, P.Y.; Mednikov, A.S. Synthetic liquid fuels: Prospects for innovative technologies based on underground coal gasification. In Proceedings of the E3S Web of Conferences, Irkutsk, Russia, 23 November 2020; Volume 209, p. 3026, EDP Sciences. [Google Scholar] [CrossRef]
- Perkins, G.; du Toit, E.; Koning, B.; Ulbrich, A. Unconventional Oil Production from Underground Coal Gasification and Gas to Liquids Technologies. In Proceedings of the Society of Petroleum Engineers (SPE) Unconventional Resources Conference and Exhibition-Asia Pacific, Brisbane, Australia, 11 November 2013. [Google Scholar] [CrossRef]
- Kadam, A.K.; Kale, S.S.; Pande, N.N.; Pawar, N.J.; Sankhua, R.N. Identifying potential rainwater harvesting sites of a semi-arid, basaltic region of Western India, using SCS-CN method. Water Resour. Manag. 2012, 26, 2537–2554. [Google Scholar] [CrossRef]
- Trabelsi, F.; Tarhouni, J.; Mammou, A.B.; Ranieri, G. GIS-based subsurface databases and 3-D geological modeling as a tool for the set up of hydrogeological framework: Nabeul–Hammamet coastal aquifer case study (Northeast Tunisia). Environ. Earth Sci. 2013, 70, 2087–2105. [Google Scholar] [CrossRef]
- Anderson, M.P.; Woessner, W.W.; Hunt, R.J. Applied Groundwater Modeling: Simulation of Flow and Advective Transport; Academic Press: London, UK, 2015; ISBN 978-0-12-058103-0. [Google Scholar]
- Kohn, K.E. Conceptualization and characterization of ground-water systems using Geographic Information Systems. Eng. Geol. 1996, 42, 111–118. [Google Scholar] [CrossRef]
- Brassington, F.C.; Younger, P.L. A proposed framework for hydrogeological conceptual modelling. Water Environ. J. 2010, 24, 261–273. [Google Scholar] [CrossRef]
- Hassen, I.; Gibson, H.; Hamzaoui-Azaza, F.; Negro, F.; Rachid, K.; Bouhlila, R. 3D geological modeling of the Kasserine Aquifer System, Central Tunisia: New insights into aquifer-geometry and interconnections for a better assessment of groundwater resources. J. Hydrol. 2016, 539, 223–236. [Google Scholar] [CrossRef]
- Delogkos, E.; Childs, C.; Manzocchi, T.; Walsh, J.J. The nature and origin of bed-parallel slip in Kardia Mine, Ptolemais Basin, Greece. J. Struct. Geol. 2018, 113, 115–133. [Google Scholar] [CrossRef]
- Koukouzas, N. Mineralogy and geochemistry of diatomite associated with lignite seams in the Komnina Lignite Basin, Ptolemais, Northern Greece. Int. J. Coal Geol. 2007, 71, 276–286. [Google Scholar] [CrossRef]
- Van Vugt, N.; Steenbrink, J.; Langereis, C.G.; Hilgen, F.J.; Meulenkamp, J.E. Magnetostratigraphy-based astronomical tuning of the early Pliocene lacustrine sediments of Ptolemais (NW Greece) and bed-to-bed correlation with the marine record. Earth Planet. Sci. Lett. 1998, 164, 535–551. [Google Scholar] [CrossRef] [Green Version]
- Steenbrink, J.; Van Vugt, N.; Hilgen, F.J.; Wijbrans, J.R.; Meulenkamp, J.E. Sedimentary cycles and volcanic ash beds in the lower Pliocene lacustrine succession of Ptolemais (NW Greece): Discrepancy between 40Ar/39Ar and astronomical ages. Palaeogeogr. Palaeoclimatol. Palaeoecol. 1999, 152, 283–303. [Google Scholar] [CrossRef] [Green Version]
- Koukouzas, N.; Ward, C.; Li, Z. Mineralogy of lignites and associated strata in the Mavropigi field of the Ptolemais Basin, northern Greece. Int. J. Coal Geol. 2009, 81, 182–190. [Google Scholar] [CrossRef]
- Koukouzas, C. Geological Map of Greece, Ptolemais Sheet, Scale: 1:50.000; IGME: Athens, Greece, 1997. [Google Scholar]
- Roumpos, C.P.; Paraskevis, N.I.; Galetakis, M.J.; Michalakopoulos, T.N. Mineable Lignite Reserves Estimation in Continuous Surface Mining. In Proceedings of the 12th International Symposium Continuous Surface Mining-Aachen 2014; Niemann-Delius, C., Ed.; Lecture Notes in Production Engineering; Springer: Cham, Switzerland, 2015; pp. 177–194. [Google Scholar] [CrossRef]
- Koukouzas, N.; Krassakis, P.; Koutsovitis, P.; Karkalis, C. An integrated approach to the coal deposits in the Mesohellenic Trough, Greece. Bull. Geol. Soc. Greece 2019, 54, 34–59. [Google Scholar] [CrossRef] [Green Version]
- Jacobsen, K. DEM generation from satellite data. In Remote Sensing in Transition. In Proceedings of the 23rd EARSeL Symposium, Ghent, Belgium, 2–5 June 2003; pp. 513–525. [Google Scholar]
- Rockware 2010, RockWorks 15. User’s Manual, CO, USA, 312p. Available online: https://jaketa.hu/files/szoftverek/rockworks/RockWorks_15_Manual.pdf (accessed on 3 May 2022).
- Environmental Systems Research Institute (ESRI). ArcGIS Release; 10.1.ESRI: Redlands, CA, USA, 2012. [Google Scholar]
- Planchon, O.; Darboux, F. A fast, simple and versatile algorithm to fill the depressions of digital elevation models. Catena 2002, 46, 159–176. [Google Scholar] [CrossRef]
- Tarboton, D.G.; Bras, R.L.; Rodriguez-Iturbe, I. On the extraction of channel networks from digital elevation data. Hydrol. Processes 1991, 5, 81–100. [Google Scholar] [CrossRef]
- Krassakis, P.; Kazana, S.; Chen, F.; Koukouzas, N.; Parcharidis, I.; Lekkas, E. Detecting subsidence spatial risk distribution of ground deformation induced by urban hidden streams. Geocarto Int. 2019, 36, 622–639. [Google Scholar] [CrossRef]
- Nomikou, P.; Krassakis, P.; Kazana, S.; Papanikolaou, D.; Koukouzas, N. The Volcanic Relief Within the Kos-Nisyros-Tilos Tectonic Graben at the Eastern Edge of the Aegean Volcanic Arc, Greece and Geohazard Implications. Geosciences 2021, 11, 231. [Google Scholar] [CrossRef]
- Ebdon, D.; Blackwell, B. Statistics in Geography, 2nd ed.; Oxford: New York, NY, USA, 1985. [Google Scholar]
- Mitchell, A. The ESRI Guide to GIS Analysis; ESRI Press: Redlands, CA, USA, 2005; Volume 2, ISBN 978-1589481169. [Google Scholar]
- Gimond, M. GitHub Repository. 2019. Available online: https://mgimond.github.io/Spatial/index.html (accessed on 29 April 2022).
- Moore, D.A.; Carpenter, T.E. Spatial analytical methods and geographic information systems: Use in health research and epidemiology. Epidemiol. Rev. 1999, 21, 143–161. [Google Scholar] [CrossRef] [Green Version]
- Williams, B. Assessment of Underground Coal Gasification in Bituminous Coals; Final Report; Williams Bros. Engineering Co.: Tulsa, OK, USA, 1982. [Google Scholar]
- Mastalerz, M.; Drobniak, A.; Parke, M.; Rupp, J.A. Site Evaluation of Subsidence Risk, Hydrology, and Characterization of Indiana Coals for Underground Coal Gasification (UCG), Indiana Geological Survey Report of Progress 45, 2013, Bloomington, Indiana. Available online: https://igws.indiana.edu/bookstore/details.cfm?Pub_Num=RP45# (accessed on 3 May 2022).
- Shafirovich, E.; Mastalerz, M.; Rupp, J.; Varma, A. The Potential for Underground Coal Gasification in Indiana; Phase 1 Report to CCTR. Slide Presentation; Discovery Park Energy Centre, Purdue University: Indianapolis, IN, USA, 2008; Available online: https://www.purdue.edu/discoverypark/energy/assets/pdfs/cctr/researchReports/UCG-Phase1-08-31-08.pdf (accessed on 3 May 2022).
- Beath, A. Underground Coal Gasification Resource Utilisation Efficiency; Technical Report; Elsevier: Amsterdam, The Netherlands, 2006. [Google Scholar]
- Afzal, P.; Ahari, H.D.; Omran, N.R.; Aliyari, F. Delineation of gold mineralized zones using concentration–volume fractal model in Qolqoleh gold deposit, NW Iran. Ore Geol. Rev. 2013, 55, 125–133. [Google Scholar] [CrossRef]
- Jerbi, H.; Massuel, S.; Leduc, C.; Tarhouni, J. Assessing groundwater storage in the Kairouan plain aquifer using a 3D lithology model (Central Tunisia). Arab. J. Geosci. 2018, 11, 236. [Google Scholar] [CrossRef]
- Rockware. Rockworks17 Software Help; RockWare: Boulder, CO, USA, 2016. [Google Scholar]
- Louloudis, G.; Stathopoulos, N.; Kasfikis, G. Hydrogeological Report for Ptolemais Mines; Technical Report; The Public Power Corporation: Athens, Greece, 2020. (In Greek) [Google Scholar]
- Intergeo. Execution of 9 Drillings, Permeability Tests and Chemical Analyzes of Soil and Water in the Area of the Mavropigi Mine in Ptolemaida; Technical Report; Intergeo: Essen, Germany, 2009. (In Greek) [Google Scholar]


| Lithological Units | Code |
|---|---|
| Soil | SO |
| Clay | AL |
| Sand | SN |
| Silt | SI |
| Marl | MR |
| Conglomerate | KC |
| Coal | CO |
| Limestone | LI |
| Breccia | BC |
| Borehole | X (UTM WGS84) | Y (UTM WGS84) | Elevation (m a.s.l.) | Total Depth (m) |
|---|---|---|---|---|
| KND-5/14 | 565,555.3 | 4,474,715 | 670.86 | 354 |
| T6D-051 | 565,422.6 | 4,474,529 | 669.44 | 384 |
| KND-3/14 | 565,454.5 | 4,474,827 | 666.89 | 381 |
| T6D-040 | 565,346.6 | 4,474,617 | 669.49 | 367 |
| T6D-134 | 565,125.3 | 4,474,595 | 674.54 | 394 |
| T6D-050 | 565,079.4 | 4,474,711 | 671.98 | 421 |
| 242/228 | 564,988.3 | 4,474,596 | 672.54 | 386 |
| T6D-059 | 564,859.4 | 4,474,473 | 676.86 | 430 |
| T6-D60 | 564,680.1 | 4,474,598 | 680.60 | 343 |
| T6D-079 | 564,631.2 | 4,474,449 | 685.93 | 386 |
Publisher’s Note: MDPI stays neutral with regard to jurisdictional claims in published maps and institutional affiliations. |
© 2022 by the authors. Licensee MDPI, Basel, Switzerland. This article is an open access article distributed under the terms and conditions of the Creative Commons Attribution (CC BY) license (https://creativecommons.org/licenses/by/4.0/).
Share and Cite
Krassakis, P.; Pyrgaki, K.; Gemeni, V.; Roumpos, C.; Louloudis, G.; Koukouzas, N. GIS-Based Subsurface Analysis and 3D Geological Modeling as a Tool for Combined Conventional Mining and In-Situ Coal Conversion: The Case of Kardia Lignite Mine, Western Greece. Mining 2022, 2, 297-314. https://doi.org/10.3390/mining2020016
Krassakis P, Pyrgaki K, Gemeni V, Roumpos C, Louloudis G, Koukouzas N. GIS-Based Subsurface Analysis and 3D Geological Modeling as a Tool for Combined Conventional Mining and In-Situ Coal Conversion: The Case of Kardia Lignite Mine, Western Greece. Mining. 2022; 2(2):297-314. https://doi.org/10.3390/mining2020016
Chicago/Turabian StyleKrassakis, Pavlos, Konstantina Pyrgaki, Vasiliki Gemeni, Christos Roumpos, Georgios Louloudis, and Nikolaos Koukouzas. 2022. "GIS-Based Subsurface Analysis and 3D Geological Modeling as a Tool for Combined Conventional Mining and In-Situ Coal Conversion: The Case of Kardia Lignite Mine, Western Greece" Mining 2, no. 2: 297-314. https://doi.org/10.3390/mining2020016
APA StyleKrassakis, P., Pyrgaki, K., Gemeni, V., Roumpos, C., Louloudis, G., & Koukouzas, N. (2022). GIS-Based Subsurface Analysis and 3D Geological Modeling as a Tool for Combined Conventional Mining and In-Situ Coal Conversion: The Case of Kardia Lignite Mine, Western Greece. Mining, 2(2), 297-314. https://doi.org/10.3390/mining2020016