1. Introduction
The digital transformation in higher education has resulted in the fast-paced integration of fully online and hybrid learning modes with the old, fixed way of learning, thus allowing flexibility and accessibility to different groups of students. There has been an increase in the tendency of colleges and universities to obtain collective data systems so as to make decisions based on analytics, and the studies show that they can attain better results when the system correlates with the institution’s objectives [
1]. Even though this transformation has also created new problems, such as monitoring student involvement and ensuring academic success, this shift has also marked a new beginning. Through the digitalization of classrooms, analytics have changed e-learning from a fixed module format to a more dynamic and data-driven personalized version which can now be applied on a large scale [
2]. Conventional academic monitoring systems are based on retrospective data and generally receive old information, thus only allowing intervention after students have already disengaged or performed poorly [
3]. This reactionary methodology considerably detracts from the implementation of effective support measures; more so, these problems become more serious in larger groups of students and/or asynchronous courses.
To cope with these limitations, institutions of learning are now increasingly powered by real-time learning analytics (RTLA) and early warning systems (EWSs). Their missions are to highlight the first indicators of possible disengagement by measuring behavioral factors, namely frequency of login, clickstream activity, and participation in the virtual learning environment [
4,
5]. For instance, the majority of the systems implementing EWSs are either subject to strict thresholds or process data slowly, which makes them accumulate missed opportunities for timely intervention [
6]. The latest achievements in artificial intelligence (AI) and data-driven management have brought to life heretofore unseen flexible and responsive systems for educational purposes. Smart tools infused with AI are easily able to establish individualized learning paths and the best supportive approaches based on the actual data at their disposal [
7,
8]. Even so, these mechanisms frequently have a high demand for computational resources and run short of logically explainable output, thus making them hard to use in teaching environments where the properties of resources are limited [
9,
10].
This paper presents D3S3real (Data-Driven Decision Systems for Student Success and Security in Real-Time), the lightest and simplest rule-based decision support system for the purpose of improving student performance through the early detection of student disconnection. Unlike traditional models that operate along the lines of retrospective analysis or the use of black-box algorithms, D3S3real runs on a weekly cycle, utilizing standard engagement thresholds derived from clickstream data to operate. The system leverages the Open University Learning Analytics Dataset (OULAD), which embodies over 32,000 students and a number of VLE interaction records, to simulate real-time monitoring and generate timely alerts for instructors.
The central novel aspect integral to D3S3real is the dual balance of simplicity and effectiveness. The use of a rule-based engine, in which the system is built, is a step toward the provision of transparency and interpretability, which are needed for teachers to gain confidence and understanding in the logic of the system regarding the risk classifications. Simultaneously, its modular architecture ensures a practical road for integration with the already in-place LMS, thus allowing institutions to add student support without overhauling their existing technological facilities [
11,
12].
In addition, D3S3real is well matched with modern modes like adaptive and personalized education, where the learner is the focal point of the decision about the path to follow throughout the intervention process. Even though D3S3real is not yet machine learning-based, its rule-based model serves as an excellent foundation for future hybrid models that marry the two through the concept of making predictions about D3S3real. The paper has found its technical contributions extend beyond educational settings. Apart from being timely, they address problems such as dropout rates, retention, and inequality in education [
13,
14]. Such outcomes are especially vital in the scenario of mass higher education, where the personal touch is often overshadowed, and access to services is usually unequal.
2. Background
The education sector’s rapid digitization has resulted in the collection of huge amounts of student data and the provision of decision-support options based on data in higher education. This change has acted as a catalyst for the creation of LA (learning analytics) and EWSs (early warning systems), which help to spot students who are more likely to fail and deliver the required help on time [
3,
4]. The use of learning analytics systems for the simulation of student interaction data has been shown to be a practical way to help learners in digital contexts, and in this way, it has become a valuable tool for the anticipatory/intrusive levels of teaching [
15]. The value of these systems is even greater for online and hybrid learning settings, where the visual cues to disengagement are mostly missed, as in traditional classroom environments. Learning analytics is the process of gathering, examining, and interpreting data about learners and their specific situations to promote better learning outcomes and environments [
16]. The learning analytics-based decision support systems have been effectively used in the academic world, where modular architectures enhance adaptability and improve academic decision-making [
17].
In this sphere, systems of early warning have come forth as a realizable application that communicates the bad situation of some students through means such as low login frequency, few or no assignment submissions, and non-participation in forums [
5,
6]. The usage of VLE interaction logs, which includes the analysis of different data related to access records to engagement indicators, to monitor their academic performance as well as to offer them with an early warning [
18]. Detecting students who are likely to fail academically has been a well-established method in educational data mining and is particularly beneficial for settings where resources are scarce [
19]. Reports suggest that such systems can lead to an increase in retention and improved academic quality if they are applied in the right manner [
20]. Educational data mining and learning analytics learned frameworks provide the evidence to the educators on charting the right direction strategies and mapping to the individualized learner profiles that lead to more successful educational outcomes [
21]. The targeted decision support systems, implemented through predictive analytics, have shown substantial increases in the graduation rates of participating colleges [
22]. Nonetheless, the majority of functioning EWSs are constrained by their retrospective data analysis approaches, which are sometimes ineffective in reaching too late and targeting at-risk students for instructional interventions [
23].
In addition, the rigid nature of many rule-based systems significantly limits the extent to which they can reflect singular student activity, which is dynamic and personalized. This has engendered more interest in RTLA (real-time learning analytics), which provides continuous monitoring and instant feedback [
11,
12]. The most recent breakthroughs in artificial intelligence (AI) and machine learning (ML) have further multiplied the benefits of educational intelligence systems. AI-based systems are capable of identifying intricate correlations in a student’s behavior and are able to envision the student’s academic performance with high accuracy [
7,
8]. These systems are further built on the expanded functionalities of campus management systems and intelligent tutor systems, which are usually plugged into personalized study and adaptive intervention models [
10,
24]. Regardless of such abilities, the AI-enabled systems still remain opaque and difficult to interpret, which means that the educators and administrators are put off from utilizing them [
9].
Moreover, these systems’ computational professions could be very much an inconvenience for organizations that do not possess a strong technical underpinning. This has given rise to a search for lightweight, rule-based systems that are both easy to build and require less effort and, at the same time, are effective in providing insights into the student’s engagement [
25,
26]. As a solution, the blending of Internet of Things (IoT) technologies and fog computing into educational settings has emerged as a possibility for extending real-time decision-making capabilities and for shortening the time required for data processing [
27,
28]. These technologies, through decentralized data analysis, enable the educational intelligence systems to become more responsive and scalable.
To summarize, research works have highlighted a progression towards proactive, real-time, and personalized educational support systems clearly. Though the devices of AI and ML act as thriving tools for prediction and customization, the imperative need persists in the order of both efficiency and accessibility. The newly planned D3S3real system solves the problem by a transparent, rule-based platform of learning analytics, which is built on earlier work and is designed to integrate smoothly with existing LMS platforms.
3. Methodology
The research is focused on the concept of designing and simulating D3S3real, which is a rule-based decision support system made for real-time monitoring of student engagement and proactively predicting students at risk of academic failure or dropout. The system is based on the principles of data-driven decision-making (DDD) and educational security (SSS) and focuses on effective intervention through ethical data handling. The methodology provided is a stepwise procedure for data preparation, system design, rule definition, real-time simulation, mathematical modeling, and evaluation.
3.1. Dataset Selection and Overview
The main source of the study is the Open University Learning Analytics Dataset (OULAD), an open-source, anonymized dataset that is a good source for comprehensive student interactions, academic progress, and demographic characteristics [
29]. Because of its time-stamped virtual learning environment (VLE) logs and structured modular format, this dataset is perfect for real-time monitoring and simulation.
The Following Six CSV Files Were Used for This Research Work
studentInfo.csv: Student demographics (age_band, education level), course enrollment, and final results.
studentVle.csv: Daily logs of student clicks on specific course content.
studentAssessment.csv: Individual scores and submission dates for each assessment.
assessments.csv: Metadata describing the type, weight, and timing of assessments.
studentRegistration.csv: Registration dates and withdrawal indicators.
vle.csv: Resource type metadata (e.g., quiz, forum, resource) for each VLE site.
3.2. Data Preprocessing and Integration
The data from the six sources were interconnected through the shared keys: id_student, code_module, and code_presentation. Preprocessing entailed various steps.
Time Alignment: The date field in studentVle.csv was transformed into week numbers, which normalized interaction logs in relation to the course start. This allowed the aggregation of student activity on a weekly basis.
Click Aggregation: For each student, total weekly clicks were calculated in order to obtain a time series of engagement throughout the course duration.
Assessment Mapping: Assessment due dates (assessments.csv) were charted to the same weekly timeline. The system evaluated clicking behavior for 7-day pre-assessment windows in order to track the readiness of students.
Cohort Filtering: Students with incomplete records (e.g., less than 3 weeks of data or premature withdrawal) were eliminated in order to maintain strong analysis.
The initial preprocessing step involved filtering out student-course enrollments with a small amount of activity. We excluded 5% of 32,593 original records, keeping 27,223 pairs of students and courses with students participating in an activity for over 3 unique weeks based on the VLE logs. This filtering provided a strong engagement baseline. VLE activity was grouped by week using the formula week = floor (date/7) for smooth temporal analysis.
3.3. Mathematical Modeling of Rule-Based Logic
In order to make the decision system more formal, we create mathematical models that indicate the behavior and logic of each rule utilized in the D3S3real system. Such a method yields a clear and replicable basis for the implementation of rule-based real-time monitoring. Let us define:
: The number of clicks that were recorded by student i during the specific period of time t.
T: The overall instructional weeks covered by the course.
: The total number of days for the assessment j.
The complete log of engagements for student
i in the course is as follows:
The definitions of each rule will now be given.
3.3.1. Rule 1: Low Weekly Engagement
The rule assigns a student a flag if their weekly engagement drops to a level below a specified threshold (
). In this research, we adjusted it to
= 5 clicks.
3.3.2. Rule 2: Consecutive Inactivity
The rule marks the individuals who have demonstrated below-average engagement for two continuous weeks. The student is considered to be the flagged one if both
and
are less than
.
3.3.3. Rule 3: Pre-Assessment Inactivity
This rule applies to students who have not been active for seven consecutive days before a scheduled assessment. The student is counted this way only if the clicks during this period were all 0 (zero). Let
Aj be the due day of assessment
j. Then:
3.3.4. Rule 1: Drop in Engagement
This rule is able to sense a sudden drop in activity when compared to the preceding week. If the number of clicks for this week goes down by 50% or even more, a flag is activated.
3.3.5. Threshold Determination Logic
The rule-based framework relied on threshold values (e.g., fewer than 5 VLE clicks per week or a 50% drop in engagement) that were set through a heuristic and exploratory data-driven process. The initial thresholds were based on the patterns reported in earlier learning analytics literature, where the very low engagement rates were mostly associated with negative academic performance. These values were then modified and improved by performing exploratory data analysis (EDA) on the OULAD. For example, the cutoff of less than 5 clicks per week was found to be correct through histograms and boxplots, which illustrated that this level of activity was typical of the students who failed or withdrew. The 50% decrease rule was also adjusted, considering the week-over-week engagement declines that were seen in the at-risk cohorts that were under observation. The key point is that the machine learning tools were not utilized for threshold optimization, but solely for their interpretability, application simplicity, and cross-institutional uniformity. Such a model reinforces the rationality and replicability of science while at the same time maintaining the relevance that comes with feasibility in real-time use.
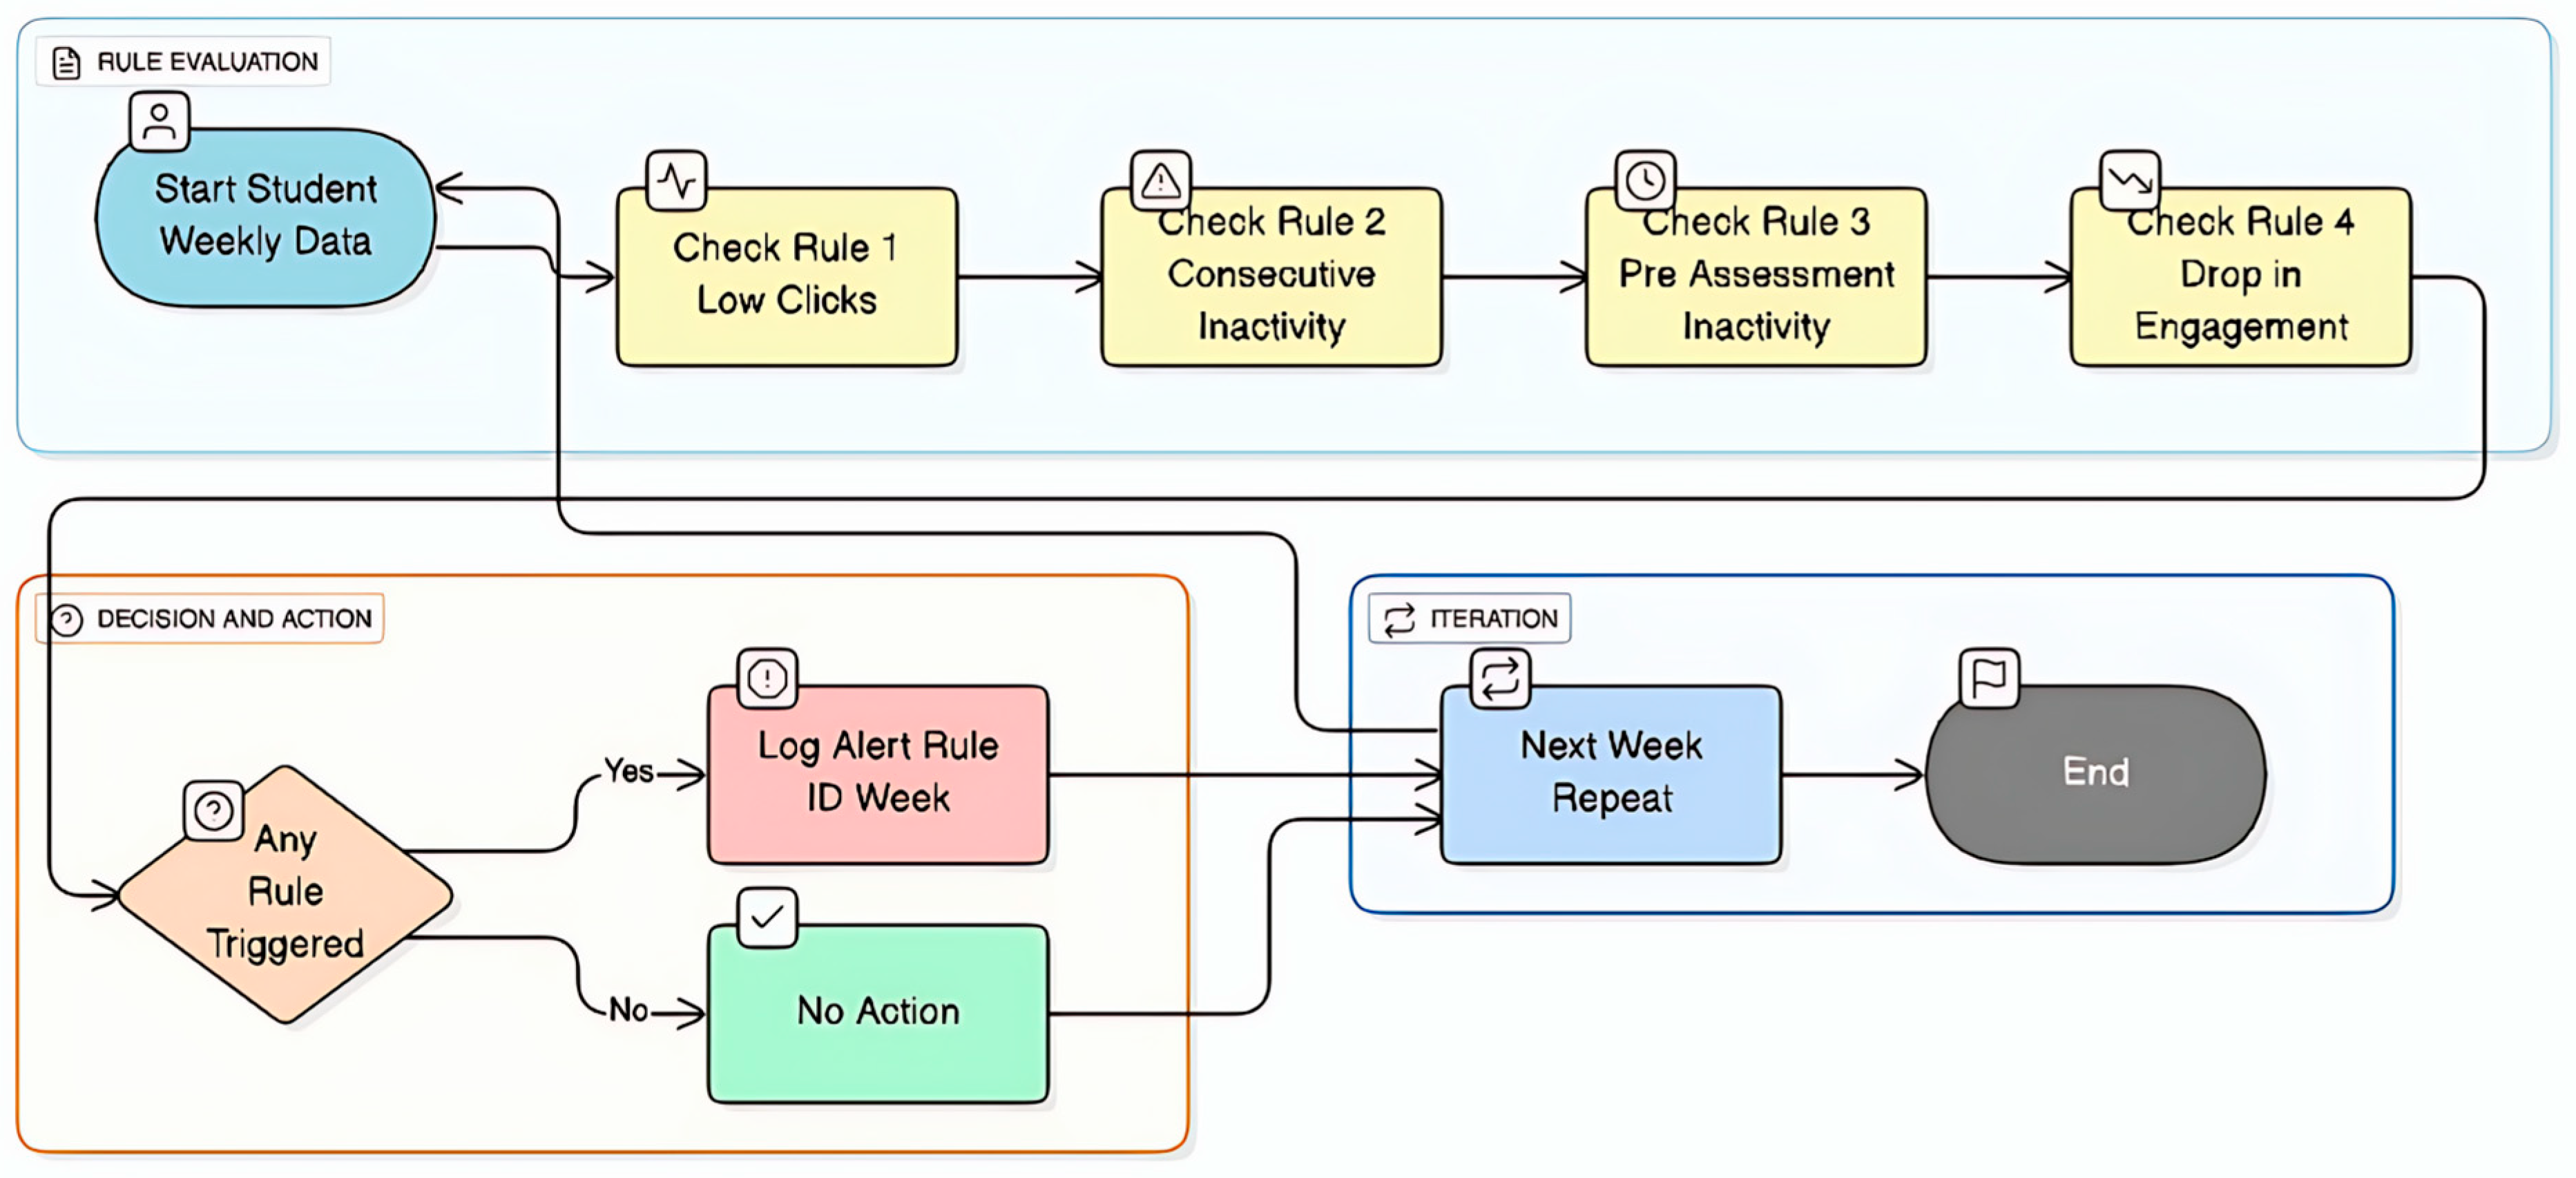
This flowchart (
Figure 1) illustrates the weekly operation of the D3S3real rule-based early warning system, which processes student activity data from the virtual learning environment. It sequentially applies four predefined rules: low clicks, consecutive inactivity, pre-assessment inactivity, and a drop in engagement to identify signs of academic risk. If any rule is triggered, an alert is logged specifying the rule and week; otherwise, no action is taken. This cycle repeats each week, allowing for timely, transparent detection of disengaged students.
3.4. Data Integration and Analysis
The total_flags value for each student-course pair was computed by aggregating the alert matrices from all the rules. This was achieved by merging the column final_result with the studentInfo.csv file to study the correlation between the rules-based alerts and the academic performance outcomes (Pass, Fail, Withdrawn, Distinction). Using Pandas’ .describe() method and quantile functions, we computed descriptive statistics, such as the mean, standard deviation, and the first (Q1) and third (Q3) quartiles of weekly alert counts. These statistics enabled us to examine patterns and variability in student engagement behaviors across different academic outcome groups (e.g., Pass, Fail, Withdrawn), highlighting how consistently or inconsistently students triggered alerts over time.
3.5. Real-Time Simulation and Alert Mechanism
To mimic a real-world scenario, the system was made to progress engagement data week by week in the same manner as an LMS plugin would work. At the end of each week, engagement data encompassing up to that week were analyzed (Week 1 → Week N). The entire process of all four rules being applied was carried out incrementally, not having the ability to see the future weeks, just like in a real-life situation. Alerts were triggered based on the conditions described earlier.
Using Python 3 (version 3.10.1) (Pandas 2.3.1, NumPy 1.26.4, Seaborn 0.13.2, Scikit-learn 1.6.1), we developed visual dashboards to graph alert timelines, engagement curves, and the number of alerts per rule. These include:
Figure 2: Histogram of total alerts per student-course enrollment, highlighting a right-skewed distribution with a long tail of high-alert cases.
Figure 2.
Distribution of total alerts generated by all four rules across student-course enrollments. The distribution is right-skewed, with a long tail of students receiving high alert counts.
Figure 2.
Distribution of total alerts generated by all four rules across student-course enrollments. The distribution is right-skewed, with a long tail of students receiving high alert counts.
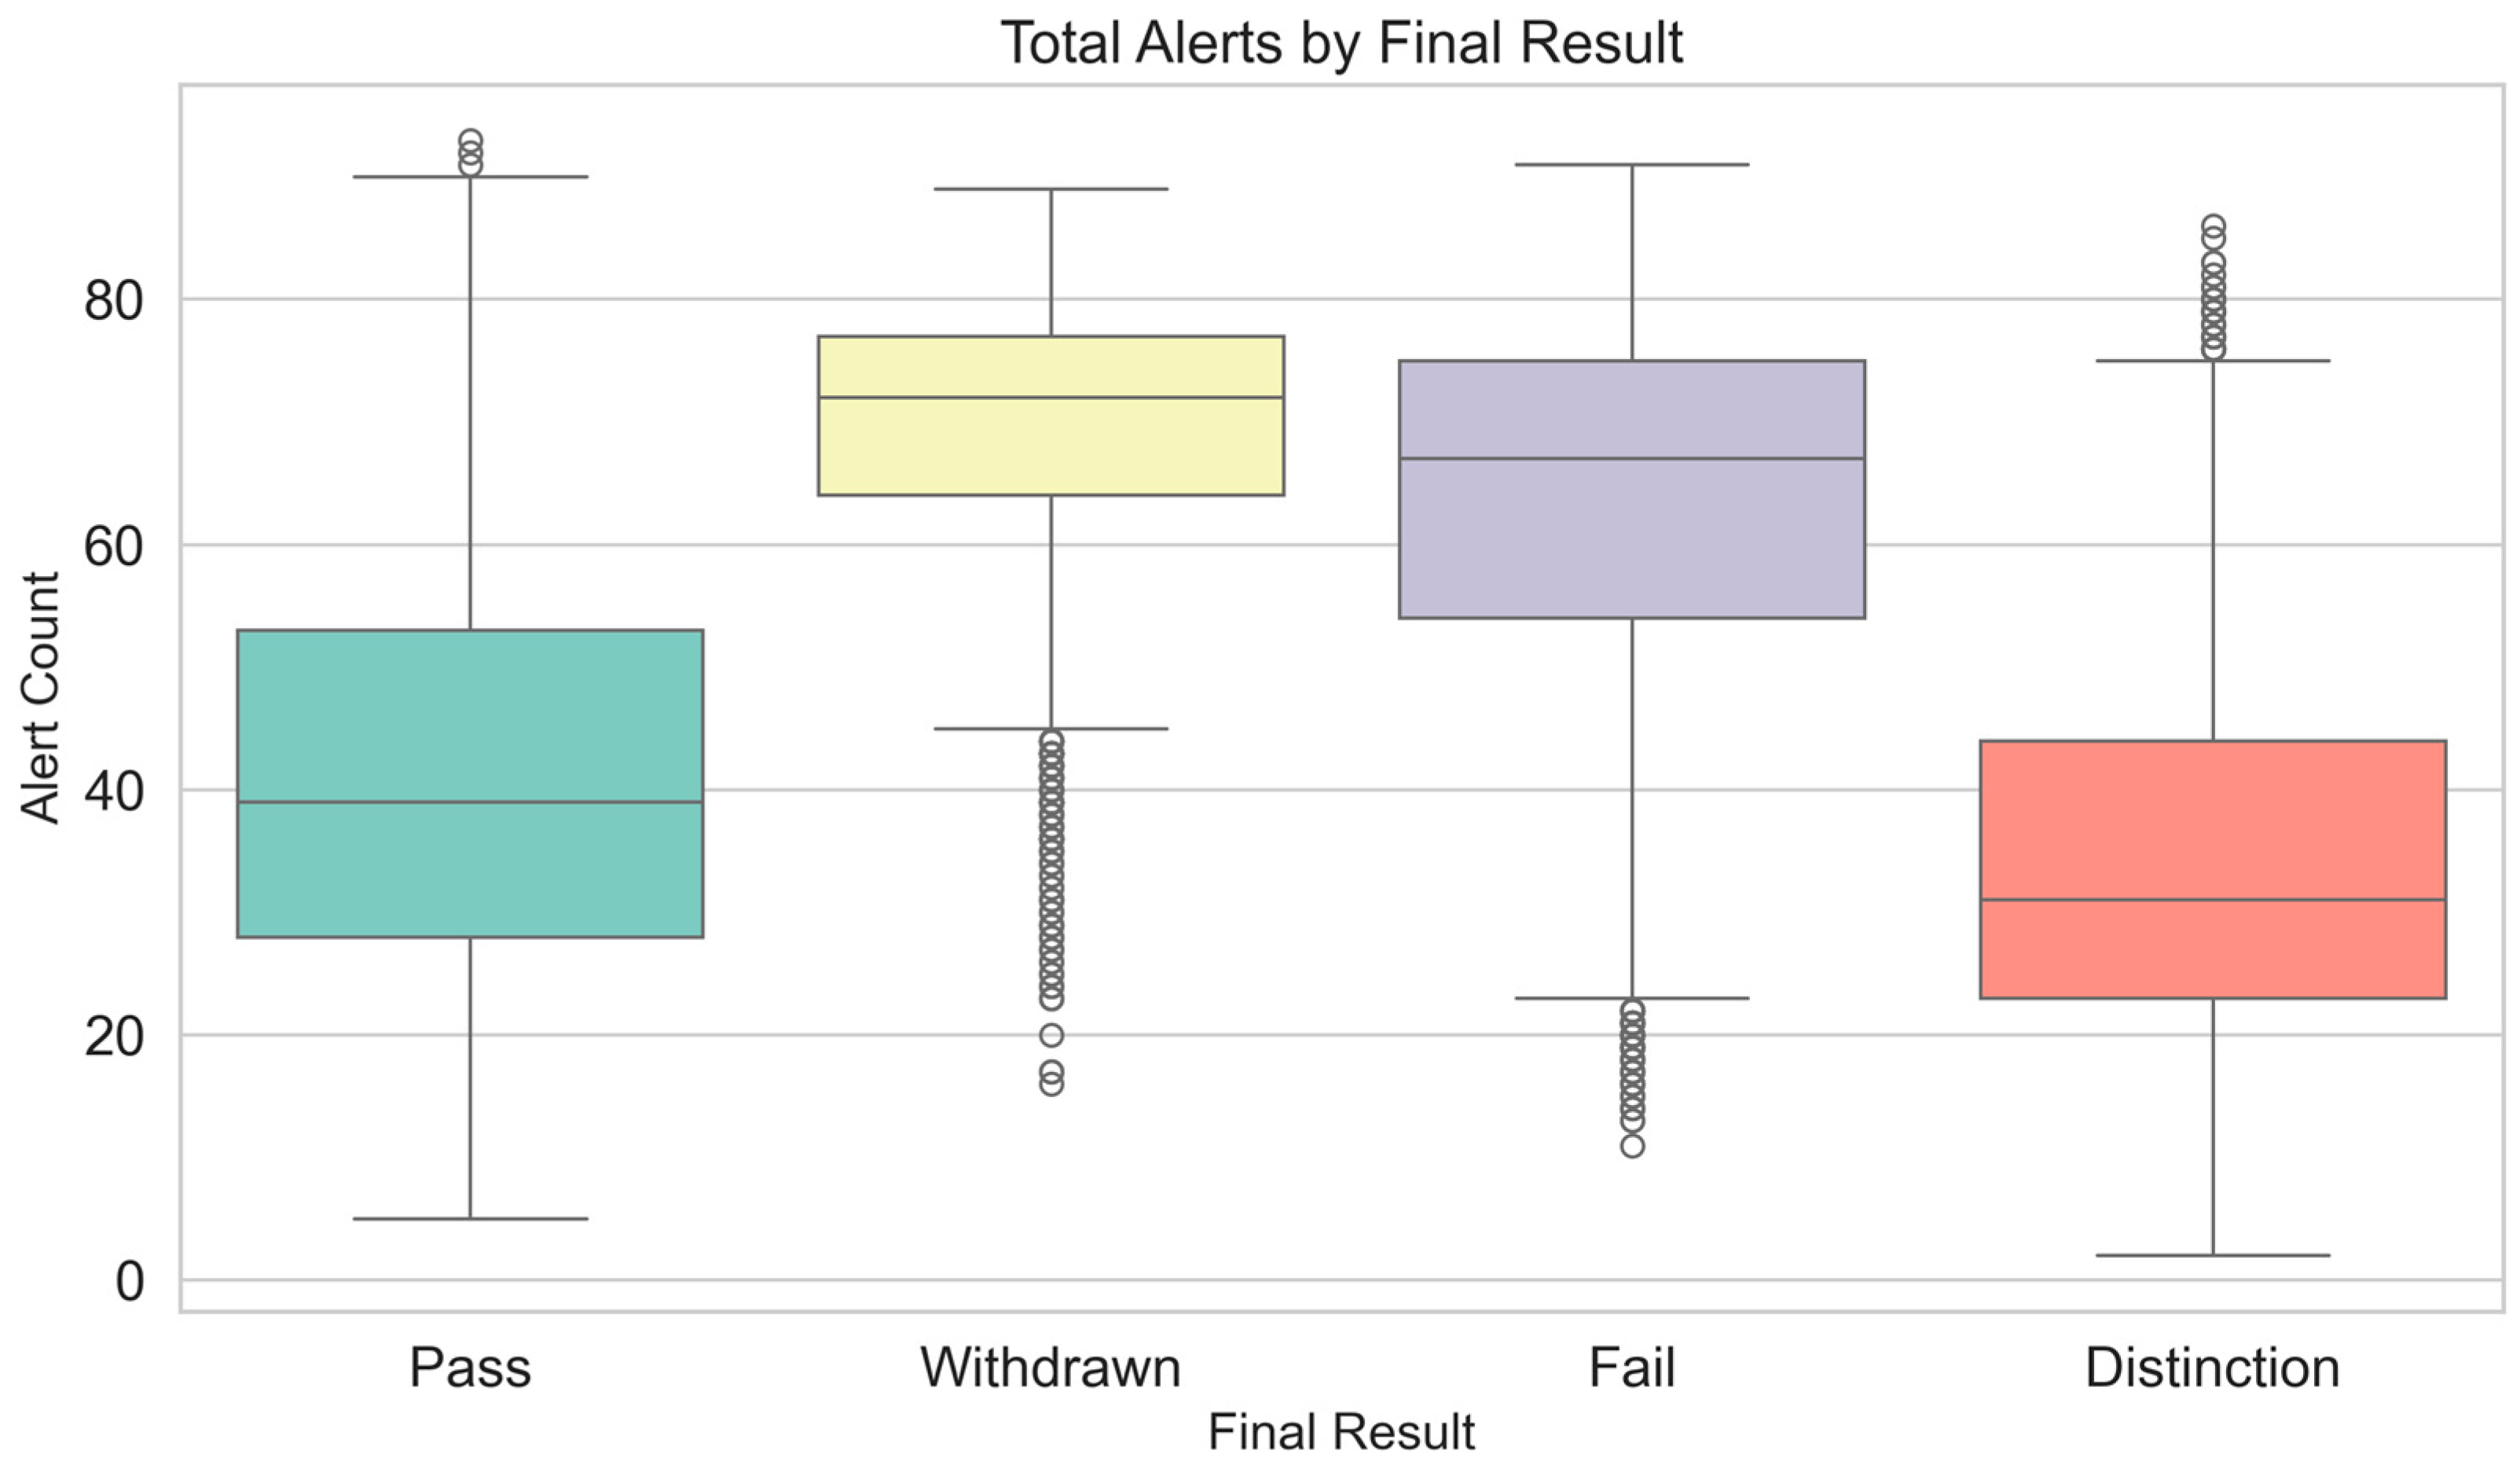
Table 1: Summary statistics of alert distributions across academic outcomes (Pass, Fail, Withdrawn, Distinction).
Table 1.
Alert Distribution by Final Result.
Table 1.
Alert Distribution by Final Result.
| Final Result | Count | Mean Alerts | Std Dev | Min | Q1 | Median | Q3 | Max |
|---|
| Distinction | 3024 | 34.17 | 15.24 | 2 | 23 | 31 | 44 | 86 |
| Pass | 12,351 | 40.78 | 16.43 | 5 | 28 | 39 | 53 | 93 |
| Fail | 6083 | 62.86 | 15.48 | 11 | 54 | 67 | 75 | 91 |
| Withdrawn | 5765 | 68.97 | 10.69 | 16 | 64 | 72 | 77 | 89 |
Figure 3: Boxplot illustrating total alert counts grouped by final result, showing higher alert volumes among students who failed or withdrew.
Figure 3.
Boxplot showing total alerts grouped by final result categories. Students who failed or withdrew consistently had higher alert counts than those who passed or earned distinctions.
Figure 3.
Boxplot showing total alerts grouped by final result categories. Students who failed or withdrew consistently had higher alert counts than those who passed or earned distinctions.
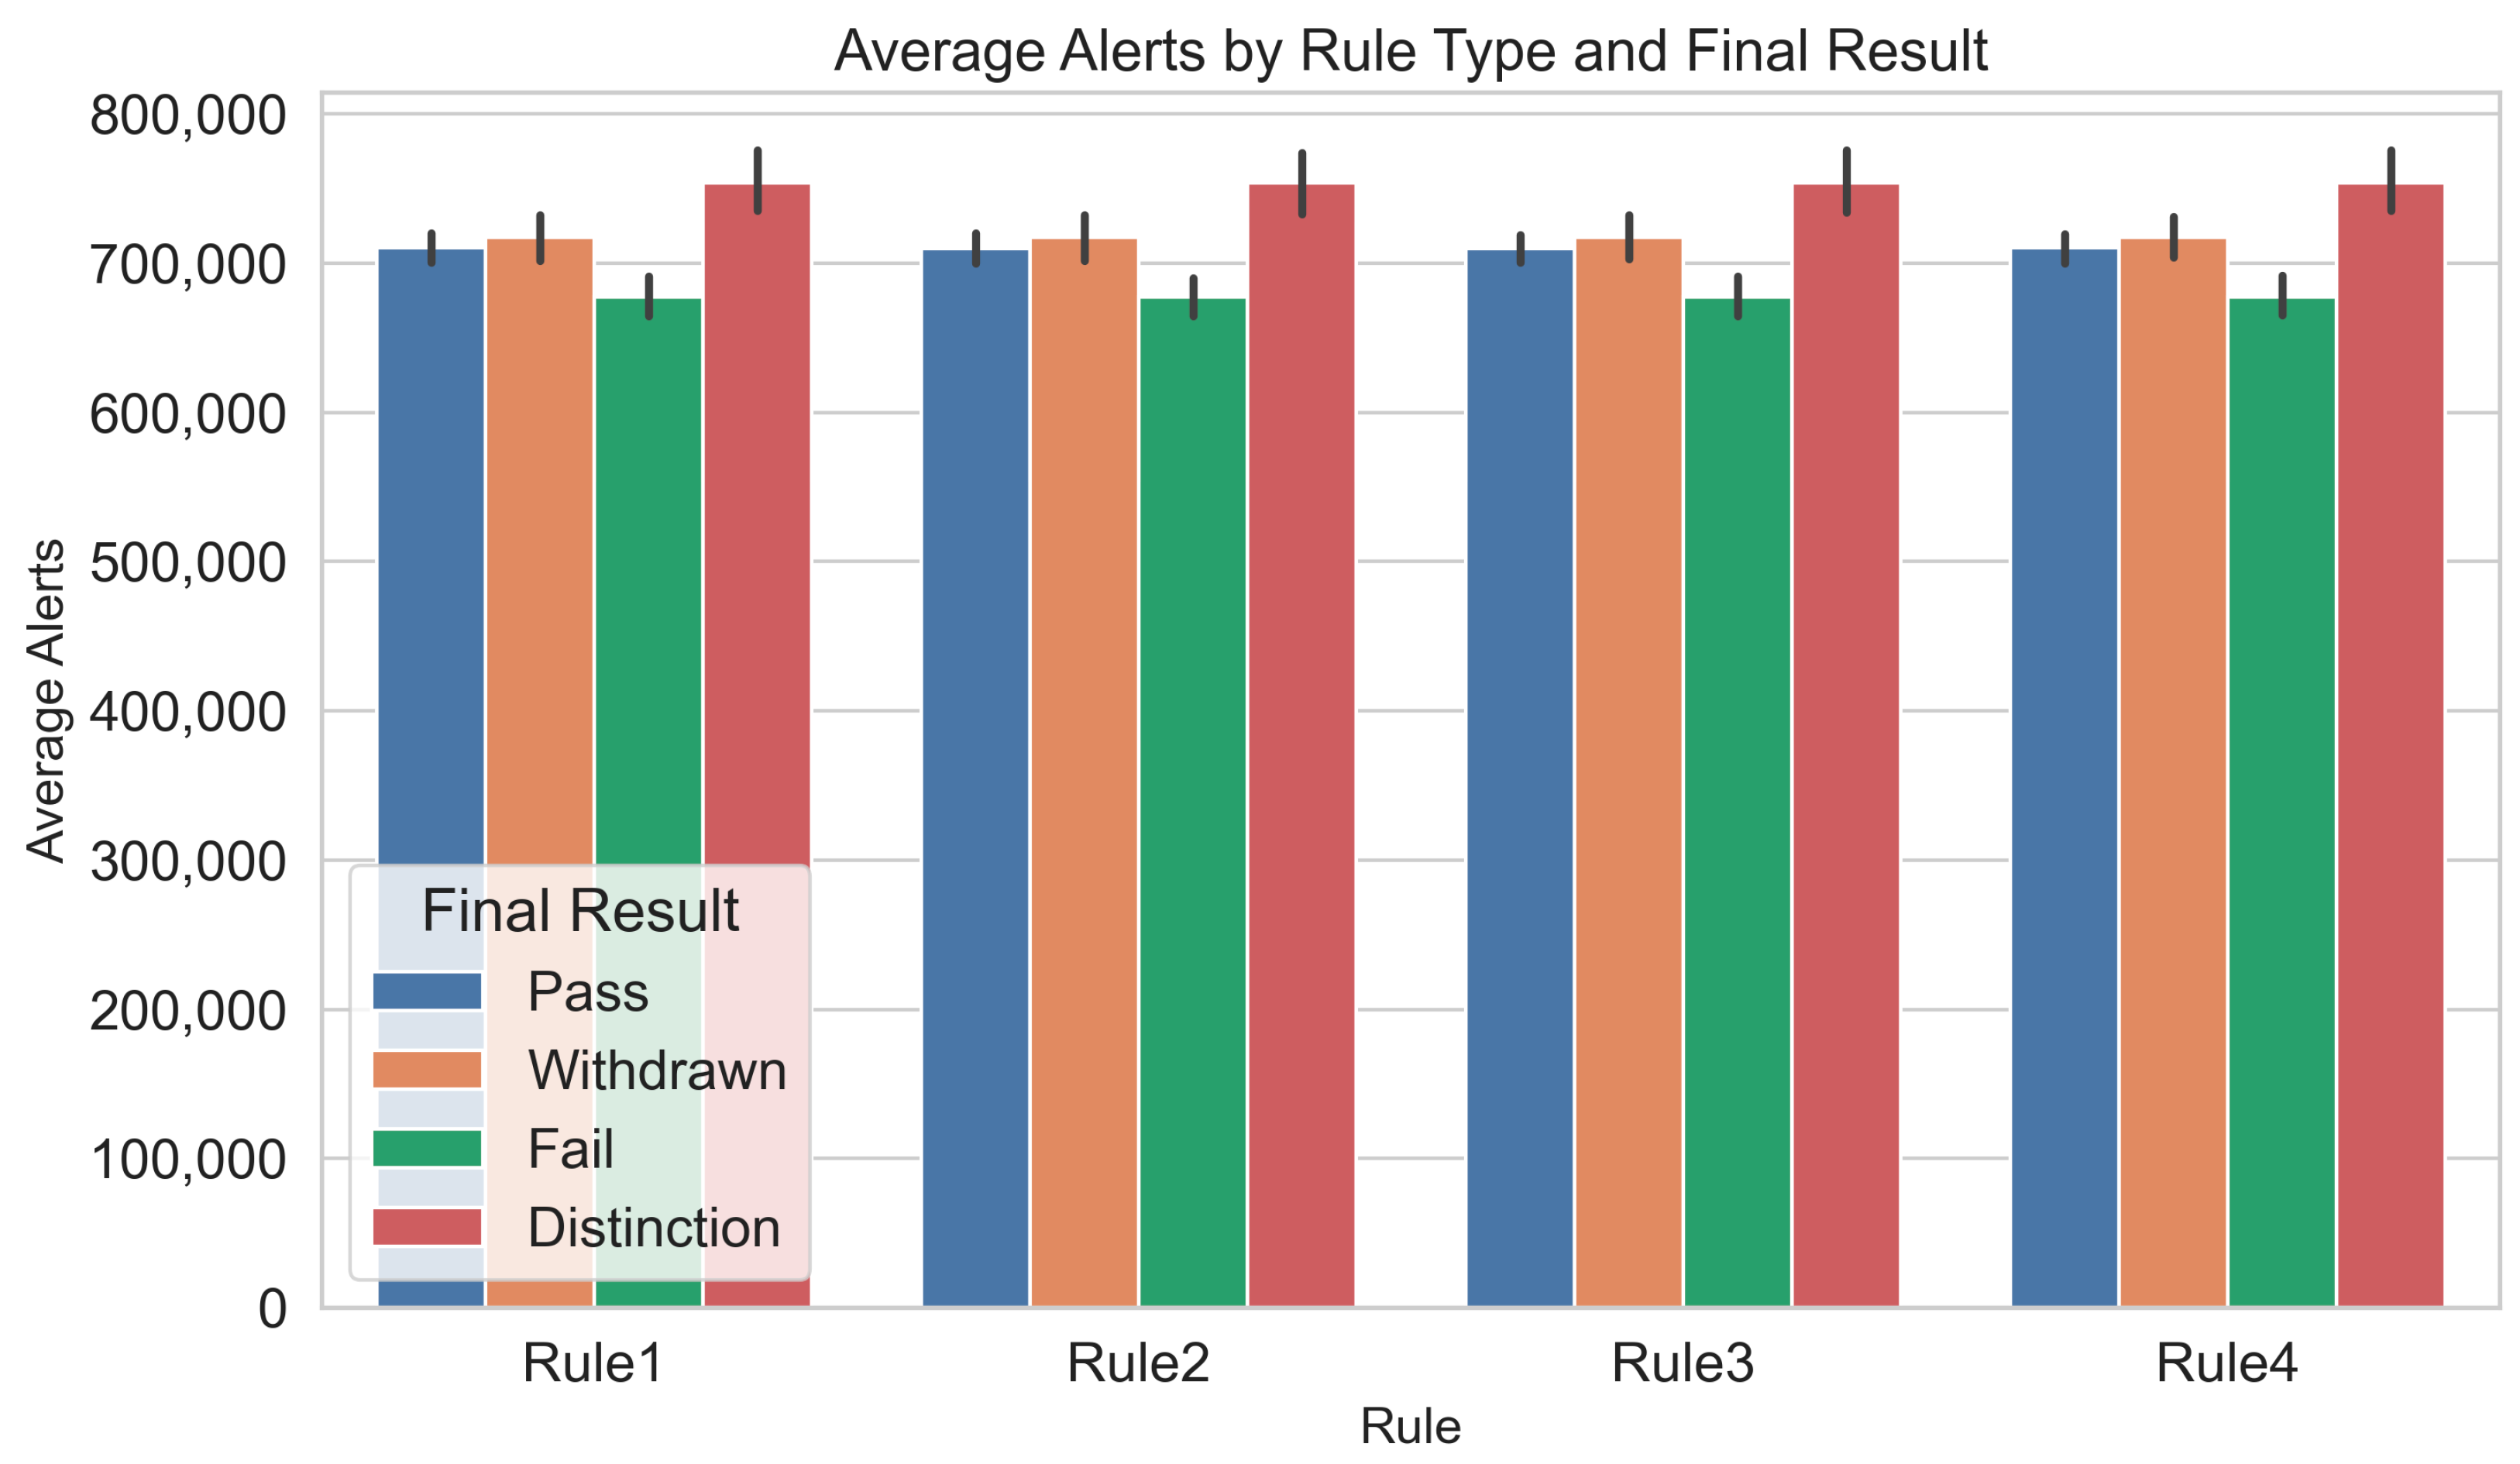
Figure 4: Bar chart comparing average alerts per rule by final result, identifying Rule 1 and Rule 2 as key indicators for at-risk students.
Figure 4.
Bar chart of average alert counts per rule type, segmented by final result. Rule 1 and Rule 2 dominate alert generation for failing and withdrawn students.
Figure 4.
Bar chart of average alert counts per rule type, segmented by final result. Rule 1 and Rule 2 dominate alert generation for failing and withdrawn students.
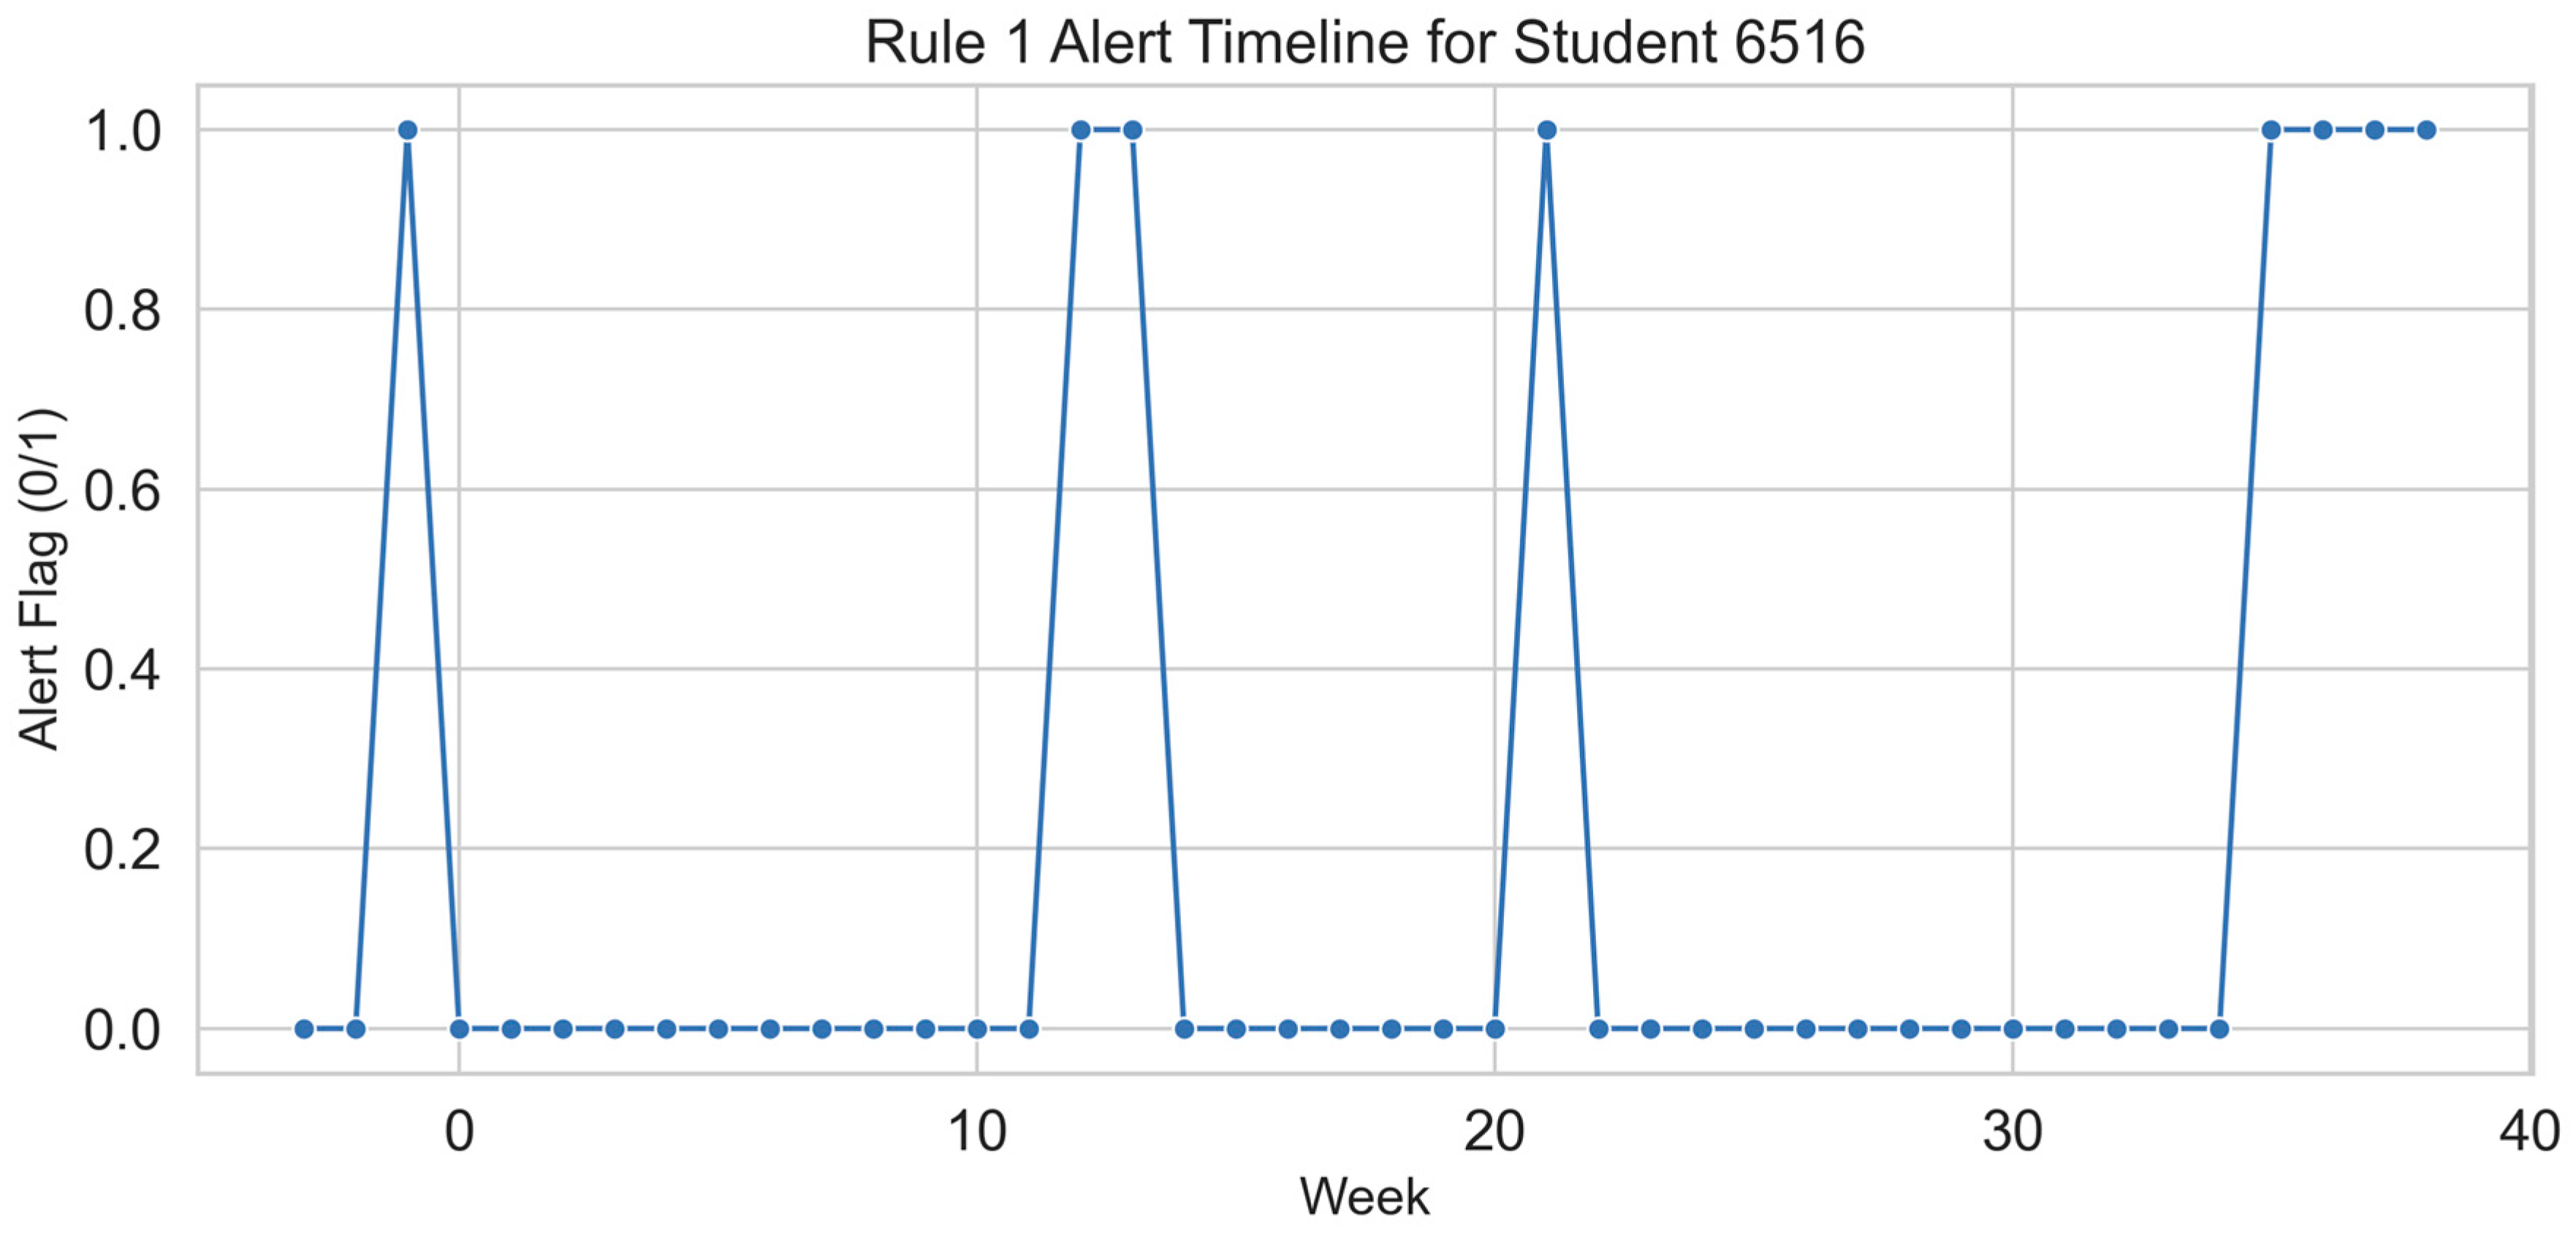
Figure 5: Weekly alert timeline for a sample student under Rule 1, revealing chronic disengagement patterns.
Figure 5.
Weekly Rule 1 alert timeline for a sample student. Flags appear consistently across the early and middle stages of the course, indicating chronic disengagement.
Figure 5.
Weekly Rule 1 alert timeline for a sample student. Flags appear consistently across the early and middle stages of the course, indicating chronic disengagement.
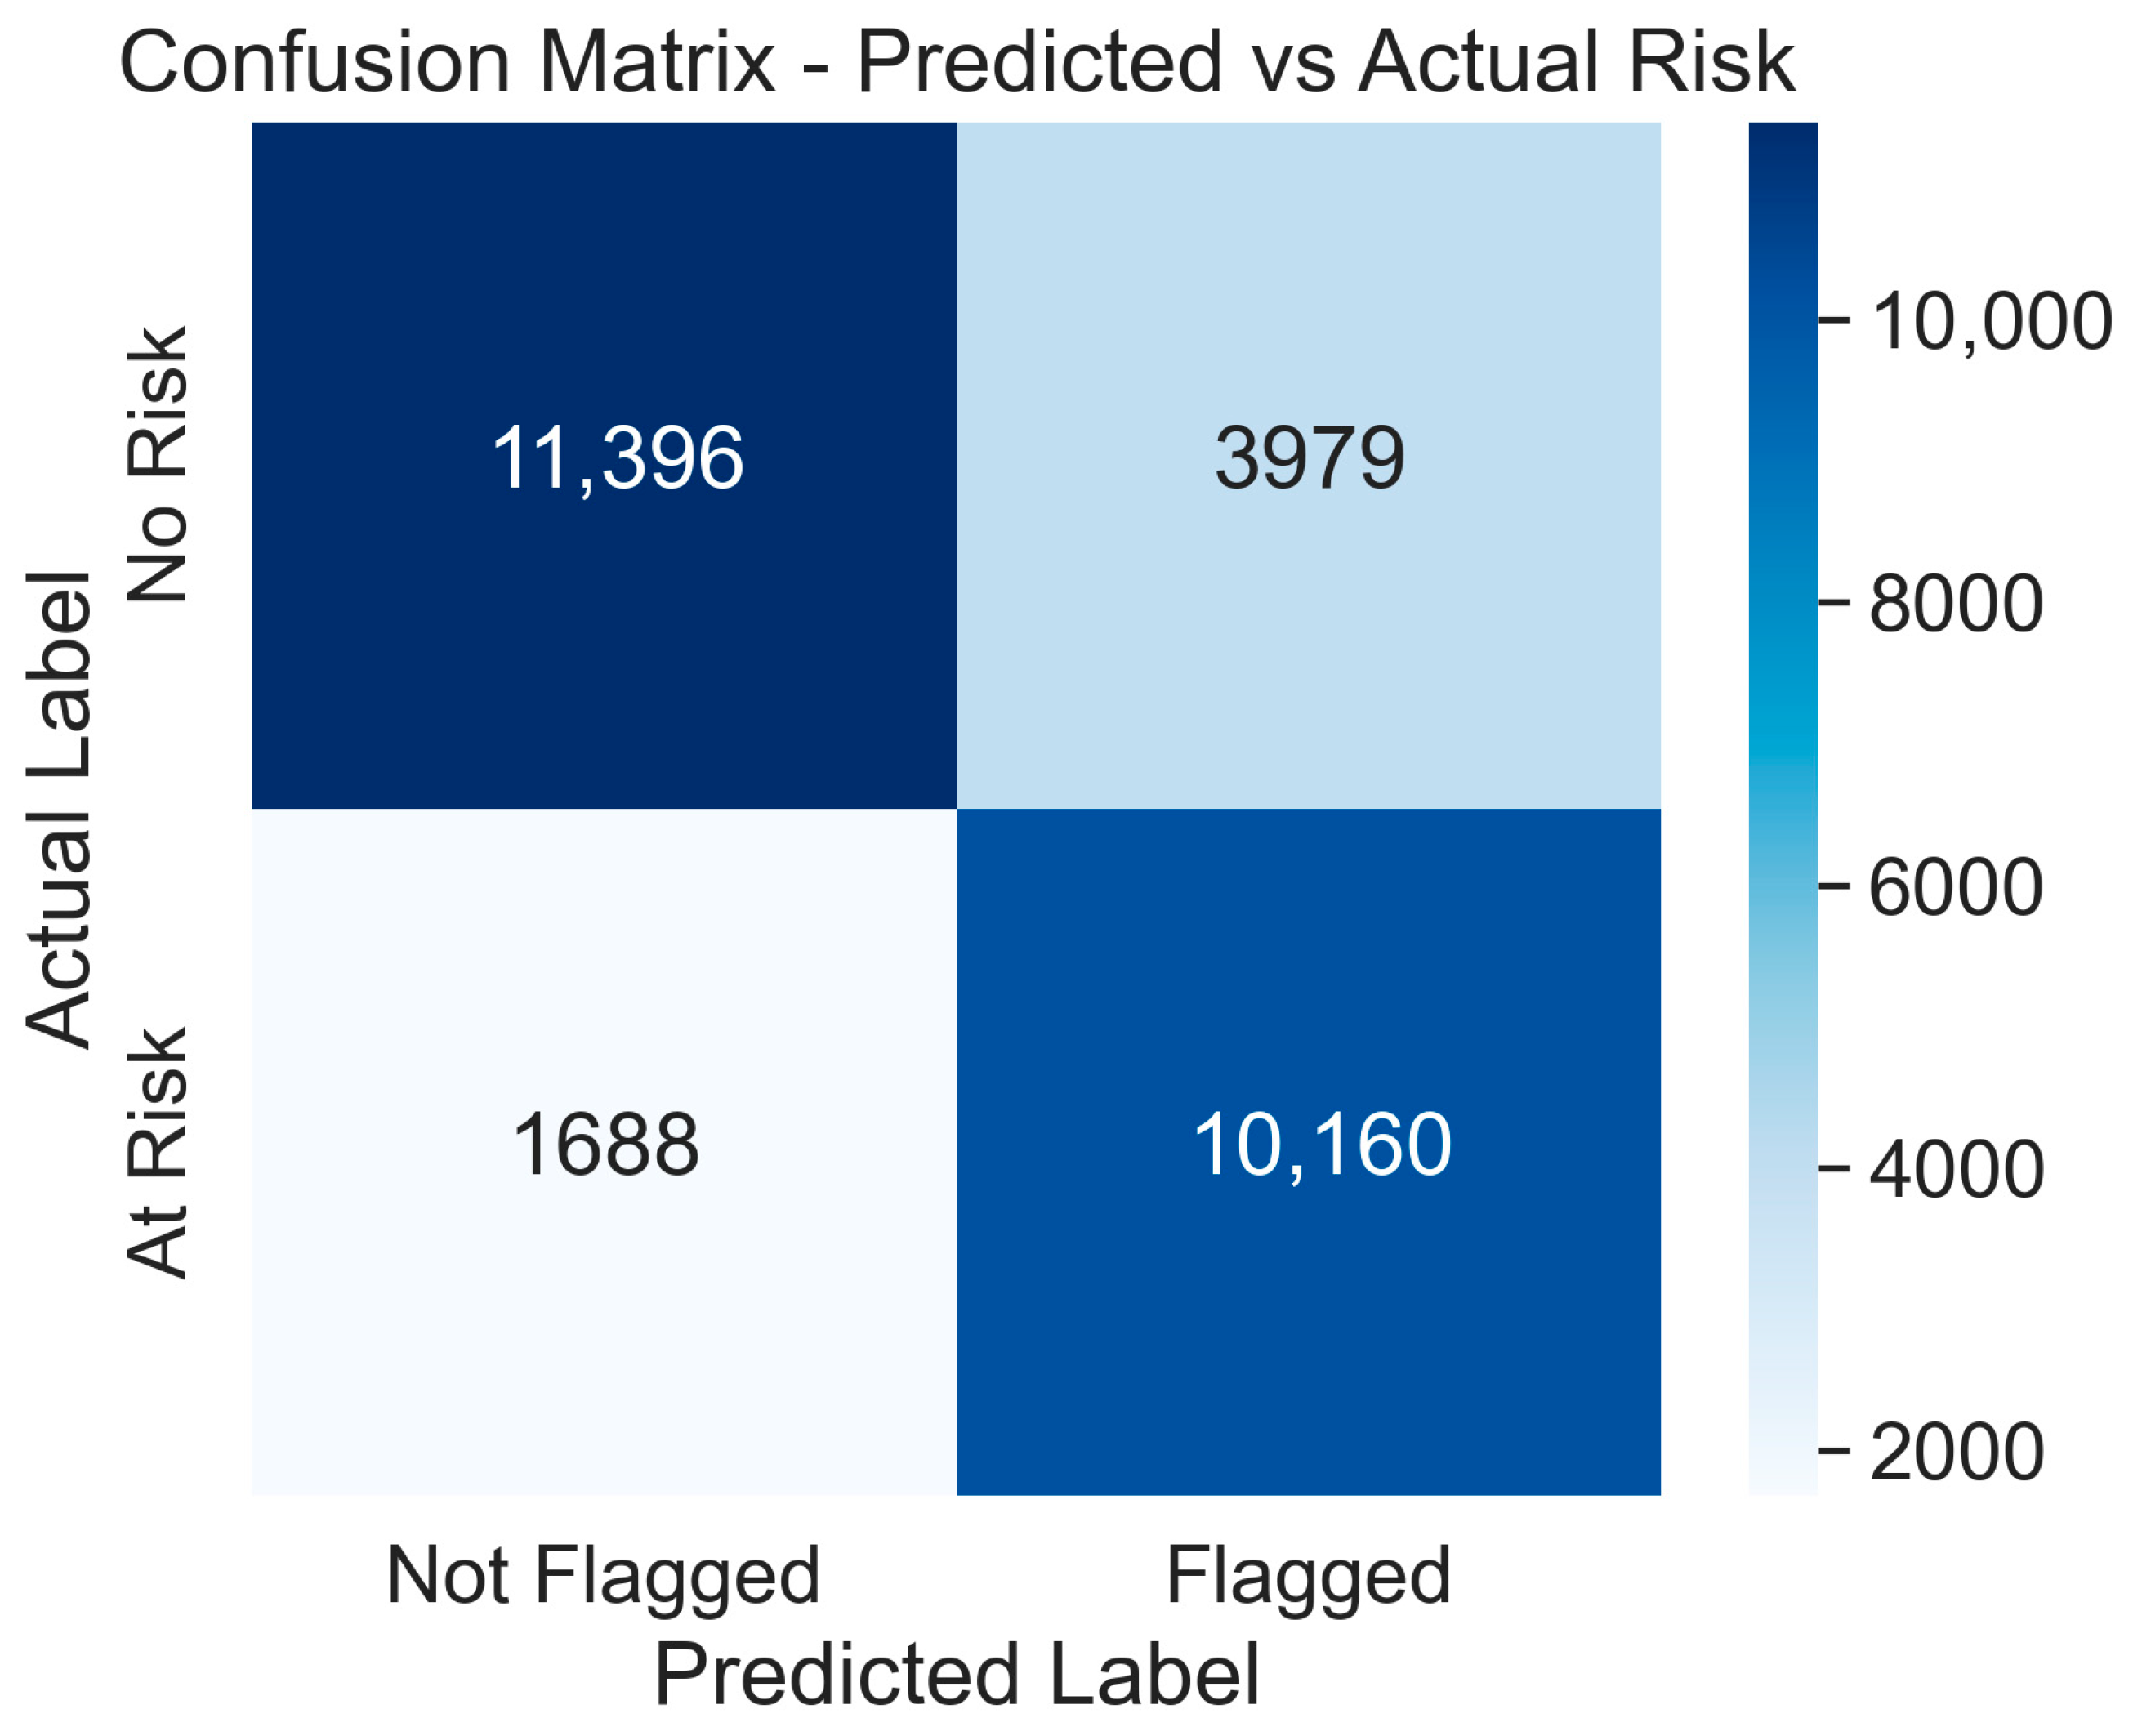
Figure 6: Confusion matrix visualization comparing D3S3real’s alert predictions with actual student outcomes, using a 50-alert threshold to assess classification accuracy.
Figure 6.
Confusion matrix visualization. D3S3real predictive classification using a 50-alert threshold. The matrix compares predicted alerts (flagged vs. not flagged) with actual academic outcomes (at-risk vs. non-risk).
Figure 6.
Confusion matrix visualization. D3S3real predictive classification using a 50-alert threshold. The matrix compares predicted alerts (flagged vs. not flagged) with actual academic outcomes (at-risk vs. non-risk).
These visual outputs serve as functional prototypes for instructor dashboards within existing LMS platforms (e.g., Moodle or Canvas), enabling early identification of at-risk students based on interpretable engagement metrics. The inclusion of both statistical summaries and diagnostic visualizations ensures that intervention decisions are both data-driven and transparent.
3.6. Outcome Mapping and Evaluation
The final scores of each student (Pass, Fail, Withdrawn, Distinction) were utilized to assess the credibility and forecasting accuracy of the alarms produced. We used the following classifications:
True Positive (TP): Student was flagged and ultimately failed or withdrew.
False Positive (FP): Student was flagged but passed.
False Negative (FN): Student was not flagged but failed or withdrew.
True Negative (TN): Student was not flagged and passed.
Based on these classifications, we computed:
Rule effectiveness comparisons through confusion matrices and ROC-style analysis were utilized to adjust and sharpen the threshold of flags. This quantitative framework provided support for visual insights in measurable predictive validity.
3.7. Ethical Considerations and Data Security
While the OULAD is anonymized and publicly licensed, we strictly followed the data governance and ethical standards our study has established:
Data Minimization: Only anonymized engagement and academic data were utilized.
Role-Based Design: D3S3real alerts are visible to instructors/advisors only, not students.
Anonymity Preservation: None of the identification attempts were made; all reporting was made in aggregate.
Security Architecture: The system design allows implementation within secure LMS environments using encrypted storage and role-based access control.
These measures ensure that both FERPA (U.S.) and GDPR (EU) are fulfilled, preserving the privacy of individuals and enhancing the educational utility [
30,
31]. For better interpretability, different visualizations were designed:
Histogram of total alerts;
Boxplot of alerts by outcome;
Bar chart of average alerts per rule and outcome;
Individual timeline for sample student;
Correlation heatmap among rules.
These tools help educators and analysts observe patterns, compare rule contributions, and plan actions. The approach focuses on real-time alerting, understandability, and multiplicity across courses and institutions.
4. DDD (Data-Driven Decision) Systems for SSS (Student Success and Security)
The D3S3real framework is based on the dual priority of enhancing student outcomes while upholding data ethics. As schools and universities introduce new digital platforms and data analytics tools, it becomes inevitable to integrate real-time monitoring systems with the ability of these features to generate data. However, this must be carried out while keeping in mind the issues of transparency, security, and student empowerment. A system known as DDD for SSS represents a completely new mode of implementation that puts into practice such data-driven decision-making (DDD) within a layout that consists of student success (SS) and student security (SS) equally. This part includes all the descriptions of the framework system concerning the structure, decision-making logic, and sound design principles.
4.1. Architecture and Operational Components
D3S3real has been constructed as a modular, logic-based framework, which processes information related to the behavioral engagement of the students, identifies the potential risk factors, and, through the security alerting systems, provides tips and actions to be taken. The design pattern contains five essential components:
4.1.1. Data Ingestion Layer
This layer is the one that pulls, transforms, and loads (ETL) clickstream data, assessment timelines, and student registration records from institutional Learning Management Systems (LMSs). This enables post hoc reviews to evaluate the fairness and accuracy of decisions [
25].
4.1.2. Behavioral Analytics Engine
The engine runs human-readable, mathematically defined rules for weekly engagement metrics. For time-series data, the engine continuously measures student behavior, i.e., drops in activity, inactivity around assessment deadlines, and signs of consecutive under-engagement, to cite risk patterns. The axial machine learning models, which are not interpretable, add the value of knowledge for rule-based logic; this fact supports stakeholder trust [
23,
32].
4.1.3. Alert Generation Module
The system generates an alert when specific, predefined conditions are fulfilled. The rule triggered, the week of detection, and the corresponding course context are stored in the alert log. Such alerts are neither delivered to the students directly nor sent to them, but instead are combined into professional review advisor-facing dashboards.
4.1.4. Advisor Interface and Visualization
Advisor Interface and Data Display: Mentors (e.g., academic mentors or educators) can see the alerts through a secure interface. By means of time series plots and tables, such as engagement trends, rule triggers, and intervention histories, it is easy to understand the situation and provide personalized support on the basis of prediction.
4.1.5. Audit and Compliance Layer
Every interaction of the user with the system, like rule execution, alert viewing, or manual annotation, is recorded. This audit trail ensures reliability, is the basis for institutional reporting, and is also a way to conduct post hoc evaluations on the fairness and accuracy of decisions [
25].
4.2. Enabling Student Success Through Proactive Intelligence
D3S3real’s main impact on student success is its impact on the predictive intervention model. The system acts as a behavioral early warning tool that flags students through the processing of weekly engagement data. Those students who may end up failing or being disengaged before the summative assessments take place can therefore be identified. There have been positive reports of the benefits of offering prompt, data-driven interventions in preventing dropouts and increasing retention levels, as shown from the research conducted [
7,
10,
33].
All alerts are actionable. For instance, if a rule is triggered showing that the pre-assessment is not active (Rule 3), the instructor can be given the option of emailing the student with study resources or office hours. Gradually, this kind of intervention creates a supportive and personalized climate, leading to better learning outcomes [
31]. Additionally, such a model is helpful in just-in-time advising, whereby advisors give the limited time and resources available to the students with the most pressing problems [
20].
4.3. Prioritizing Student Security Through Responsible Analytics
While boosting performance at the same time, D3S3real has been designed to strictly adhere to an ethical framework to address the issues of student surveillance, data misuse, and algorithmic bias. The literature review has pointed out the requirement of learning analytics systems’ ethics that will maintain the student agent and refrain from widening the educational gap [
9,
32]. The security architecture of the system consists of:
Anonymization and data minimization: Only behavioral click data, summarized every week, is processed; personal sensitive or demographic identifiers that are not necessary for the analysis of the risks are not sought.
Role-based access control: Dashboards and alerts are disclosed only to the confirmed institutional roles. The students receive support through the advisor’s review instead of being labeled or scored directly.
Explainability: The alert generation rules are clear and documented. The advisors can revise and clarify the system’s decisions, preventing reliance on the “black box” decisions [
23].
Auditability: A comprehensive record of data flows, user access, and alerts generated is kept. It will promote both the institutional audits and the students’ right to transparency, which is in accordance with the GDPR [
34].
4.4. Scalability and Institutional Integration
D3S3real has been developed to be as lightweight as possible and free from platform dependency. Its connection possibilities for any LMS (e.g., Moodle, Canvas, Blackboard) and the use of low infrastructure, like scheduled Python 3 scripts and API-connected dashboards, are the requisites to run it. This allows the system to be set up not only in top-ranking research universities but also in community colleges and open-access institutions that offer it, fostering equity in innovation [
35].
Depending on the adjustment of institutional goals, course types, or cultural contexts, the rule logic can be easily changed, providing deployment flexibility without the need for substantial machine learning infrastructure [
5,
7]. The D3S3real framework shows how real-time analytics with full respect to the student’s privacy can be used by educational establishments. The DDD Systems for SSS Section explains how the rule-based engagement monitoring, secure alerting, and advisor dashboards can be combined into a proactive, ethical, and scalable system. Through open communication, broad understanding, and ease of use, D3S3real has become the go-to model for other institutions that are interested in applying data in the pursuit of both measuring and changing results.
5. Results and Findings
The performance of the rule-based alert system designed by D3S3real was evaluated using fully performed real-time simulation experiments on a filtered dataset of 27,223 student-course enrollments and over 10.6 million VLE interaction logs. The students were subjected to four behavioral rules (low weekly engagement, consecutive inactivity, pre-assessment silence, and drop in engagement), which were set weekly for the students over the period of the study. The section is about the numerical information obtained from the alerts that were produced and the alerts that were related to the final academic outcomes.
5.1. Alert Distribution Overview
Figure 2 presents the overall distribution of alerts triggered per student-course pair. The histogram reveals a right-skewed distribution, indicating that while many students received a moderate number of alerts (between 20 and 50), a substantial number received significantly higher counts, with some approaching 90 alerts. These students represent cases of prolonged disengagement or repeated rule violations.
5.2. Alerts and Academic Outcomes
In the table above, the descriptive statistics related to the number of alerts are shown, categorized by final academic outcomes. The data clearly reveal a steep rise in alert percentages from the distinction category to the failure, as well as withdrawal. The mean alert of 34.17 was reported for the students who received distinctions, which was the lowest, while the highest (68.97) was recorded for the withdrawn students, who had almost similar standard deviations, indicating their consistent disengagement patterns. On the contrary, failing students had slight variations in their performance, whereas successful students demonstrated average results.
The quartiles, Q1 (25th percentile) and Q3 (75th percentile), define the limits in which the middle 50% of the alert values are found for each of the outcome categories. A broader interquartile range (IQR = Q3 − Q1) usually suggests a greater variability in engagement behavior, while a narrower IQR implies more consistent behavior patterns among students. For instance, the withdrawn students (64 to 77) had an IQR which is stricter in comparison to that of passing students (28 to 53), reinforcing the fact that the withdrawn group was consistently high on disengagement. This progression serves to underscore the relationship between alert numbers and academic risk, thereby affirming the system’s application as an early detection tool.
The boxplot in
Figure 3 shows alerts grouped by final academic outcomes. Students who had failed or withdrawn received significantly more alerts than their counterparts, who passed or earned distinctions. The boxplot reveals an obvious division, as it shows the withdrawn students with a high alert count are tightly clustered, while the distinction students have a low and narrow distribution. This indicates that the D3S3real system is effective in detecting identifying at-risk behavioral trends.
5.3. Rule-Level Behavioral Patterns
In the visual example of
Figure 4, the total alert burden is divided according to the rule types and academic outcomes. The major rules among the withdrawn and failing students are Rule 1 (low engagement) and Rule 2 (consecutive inactivity). Poor outcomes are also associated with Rule 3 (pre-assessment inactivity), whereas other forms are absent in Rule 4 (drop-off in engagement). The chart vividly states the need for multi-dimensional monitoring in early intervention systems, as they are essential.
5.4. Temporal Risk Signals
Figure 5 shows a weekly Rule 1 alert timeline for a sample student. The consistent triggering of Rule 1 across the early and middle stages of the course suggests a chronic disengagement pattern. This type of timeline provides instructors with early, actionable insights that could be used to trigger personalized outreach or counseling.
5.5. Predictive Evaluation of Alert Outcomes
The predictive evaluation of D3S3real was tested by assigning students to binary risk categories depending on their final scores: the pupils who failed or withdrew were classified as “at-risk,” and those who passed or earned a distinction were seen as “non-risk.” A total of 50 alerts was used as the threshold for the system to flag a student.
According to this classification:
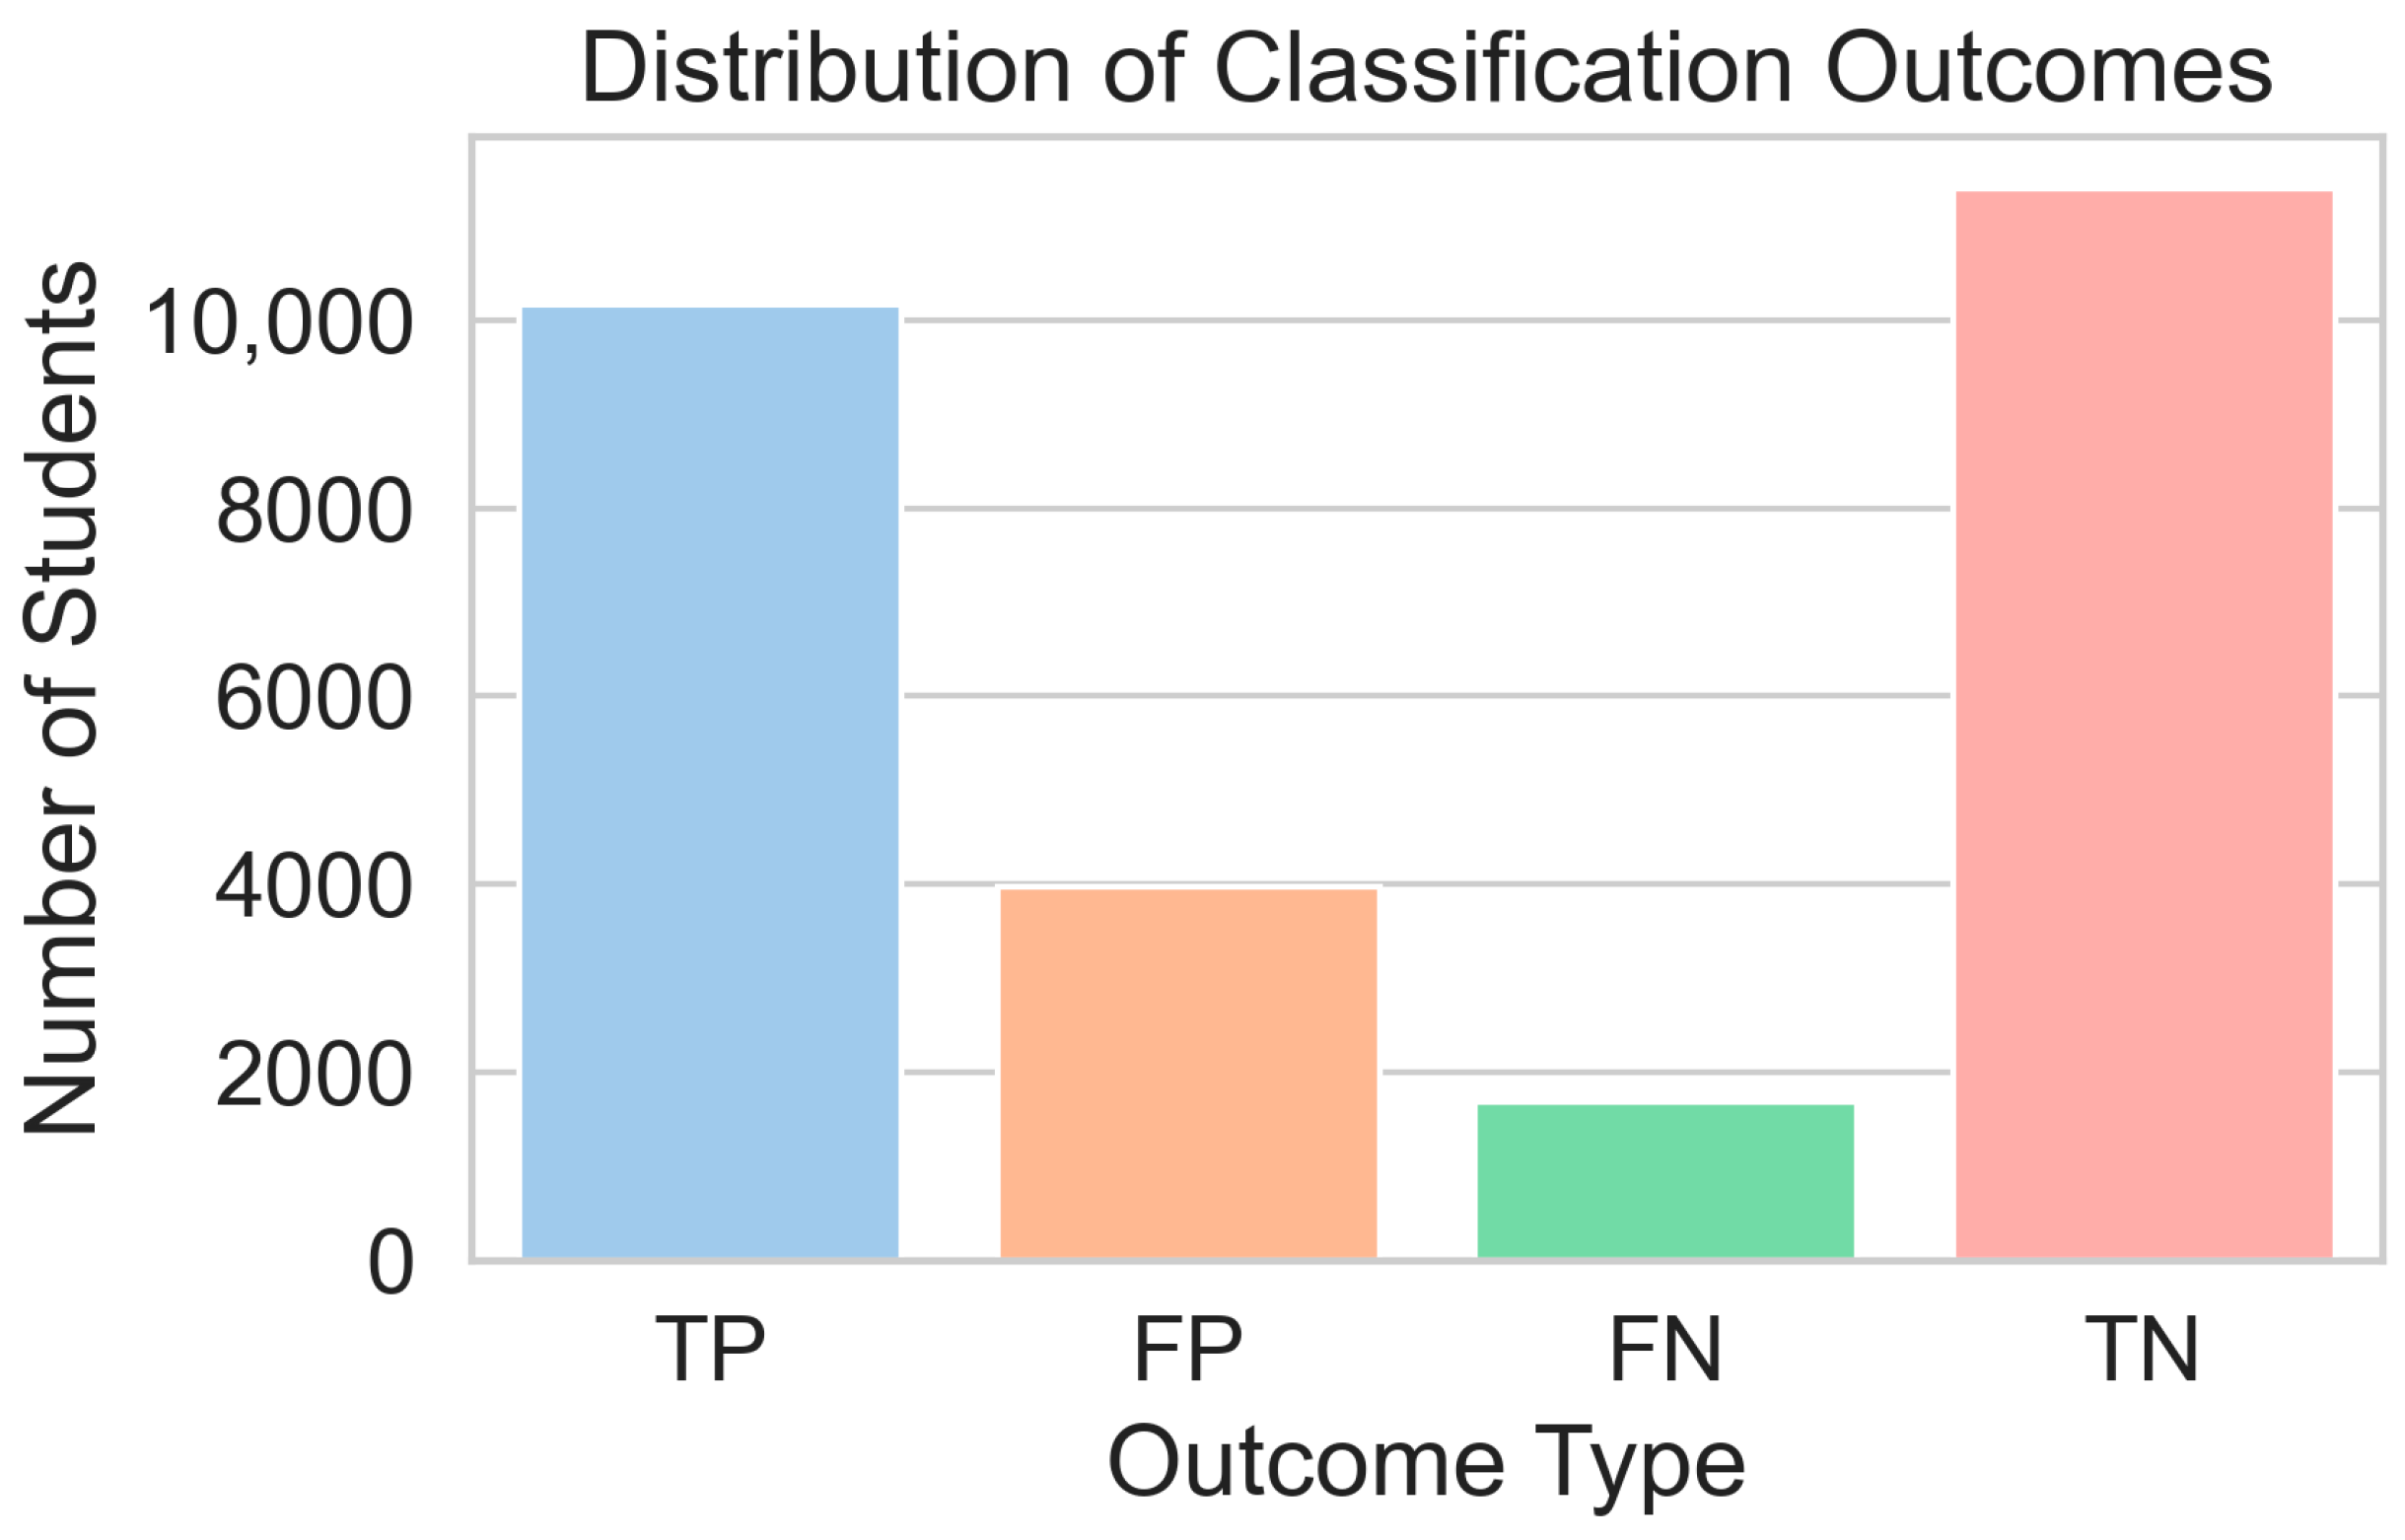
True Positives (TP): 10,160 students were flagged correctly as at risk;
False Positives (FP): 3979 students were flagged, but they succeeded in the end;
False Negatives (FN): 1688 at-risk students who were not flagged by the system;
True Negatives (TN): 11,396 students who succeeded and were not flagged correctly.
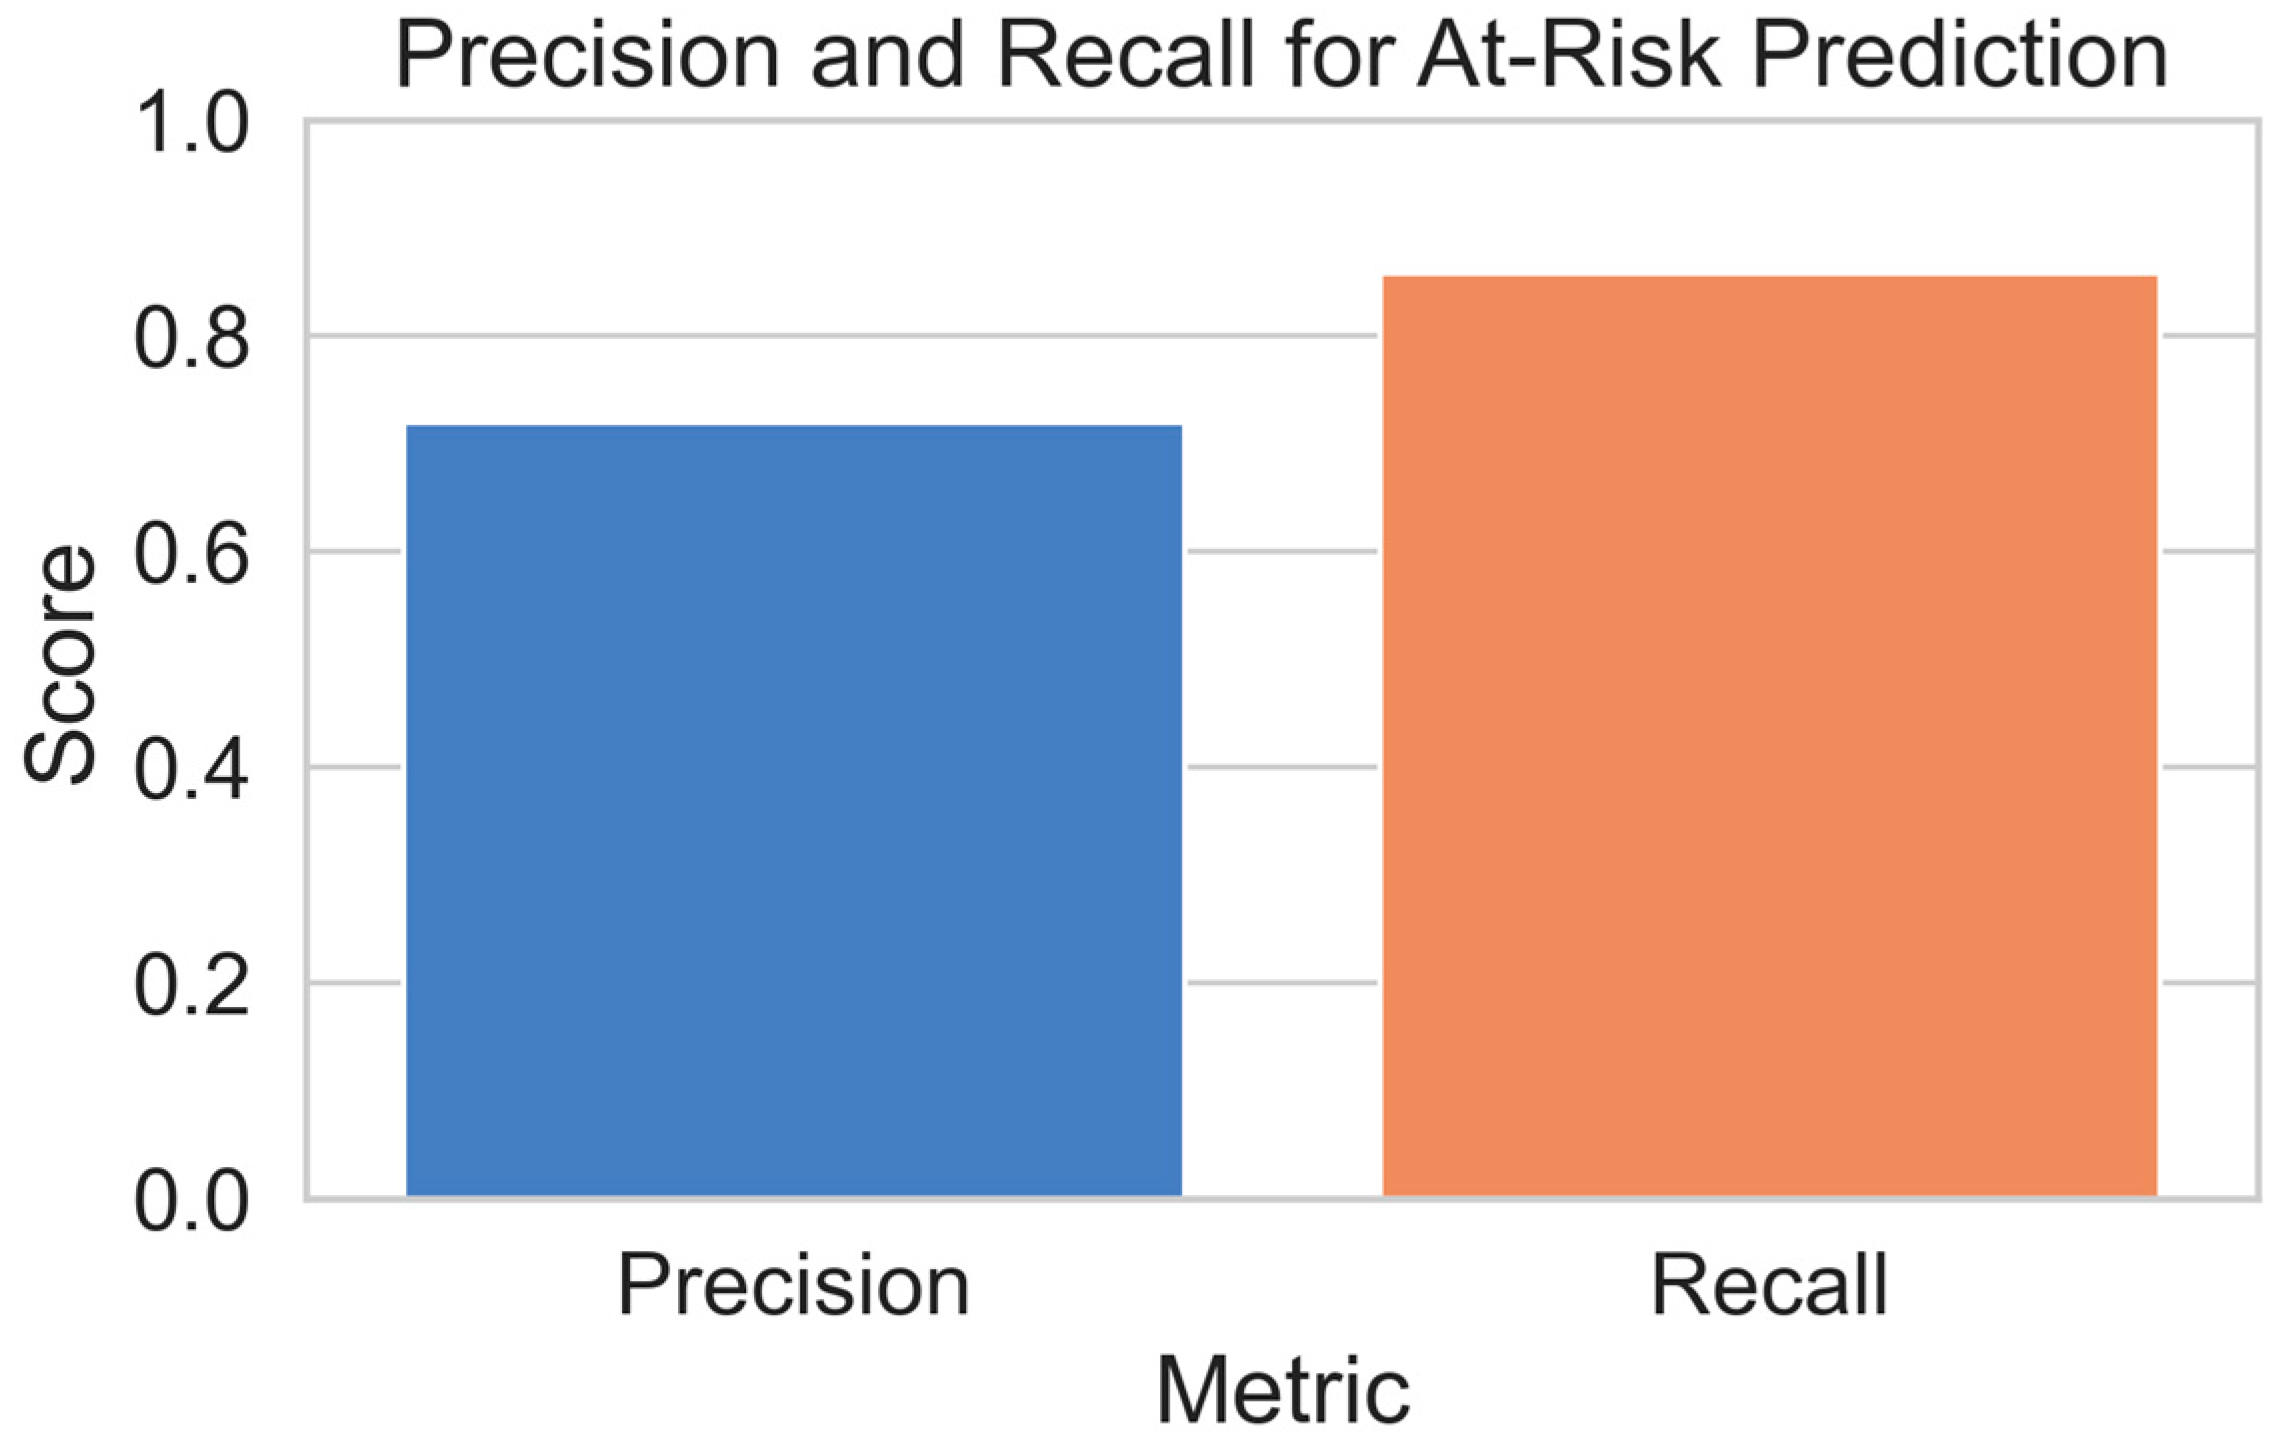
The results resulted in a precision of 72% and a recall of 86% with a support count of 11,848 at-risk and 15,375 non-risk students. These figures reflect the fact that D3S3real has excellent capability in identifying students who are at risk, which is the most important feature of early-intervention use cases. Even if a minor number of false positives were flagged, this is acceptable most of the time in educational environments, where proactive outreach takes precedence over the loss of intervention opportunities.
The confusion matrix outlining the alert system’s performance based on the actual academic outcomes is displayed in
Figure 6. The model was successful in identifying 10,160 at-risk students (True Positives) and, at the same time, made no erroneous alarms for 11,396 non-risk students (True Negatives). A total of 3979 False Positives were present, which are the cases in which students were flagged but achieved success, and there were 1688 False Negatives, meaning the system identified at-risk students who were missed. The matrix (
Figure 7) thus demonstrates the system’s applicability: with a recall rate of 86%, most at-risk students are identified, and the precision rate of 72%, which is reasonable, keeps the number of over-alerts down.
In
Figure 8, most of the groups are TN and TP, showing that the system is very strong in the identification of both successful and at-risk students rightly. The False Positives, i.e., students who were mistakenly flagged at-risk are much less, while the False Negatives, who were missed by the system but failed or withdrew, constitute the smallest group. The mentioned distribution points out the extent to which D3S3real is accurate and dependable in the detection of academic risk students by a very low level of error.
This bar chart (
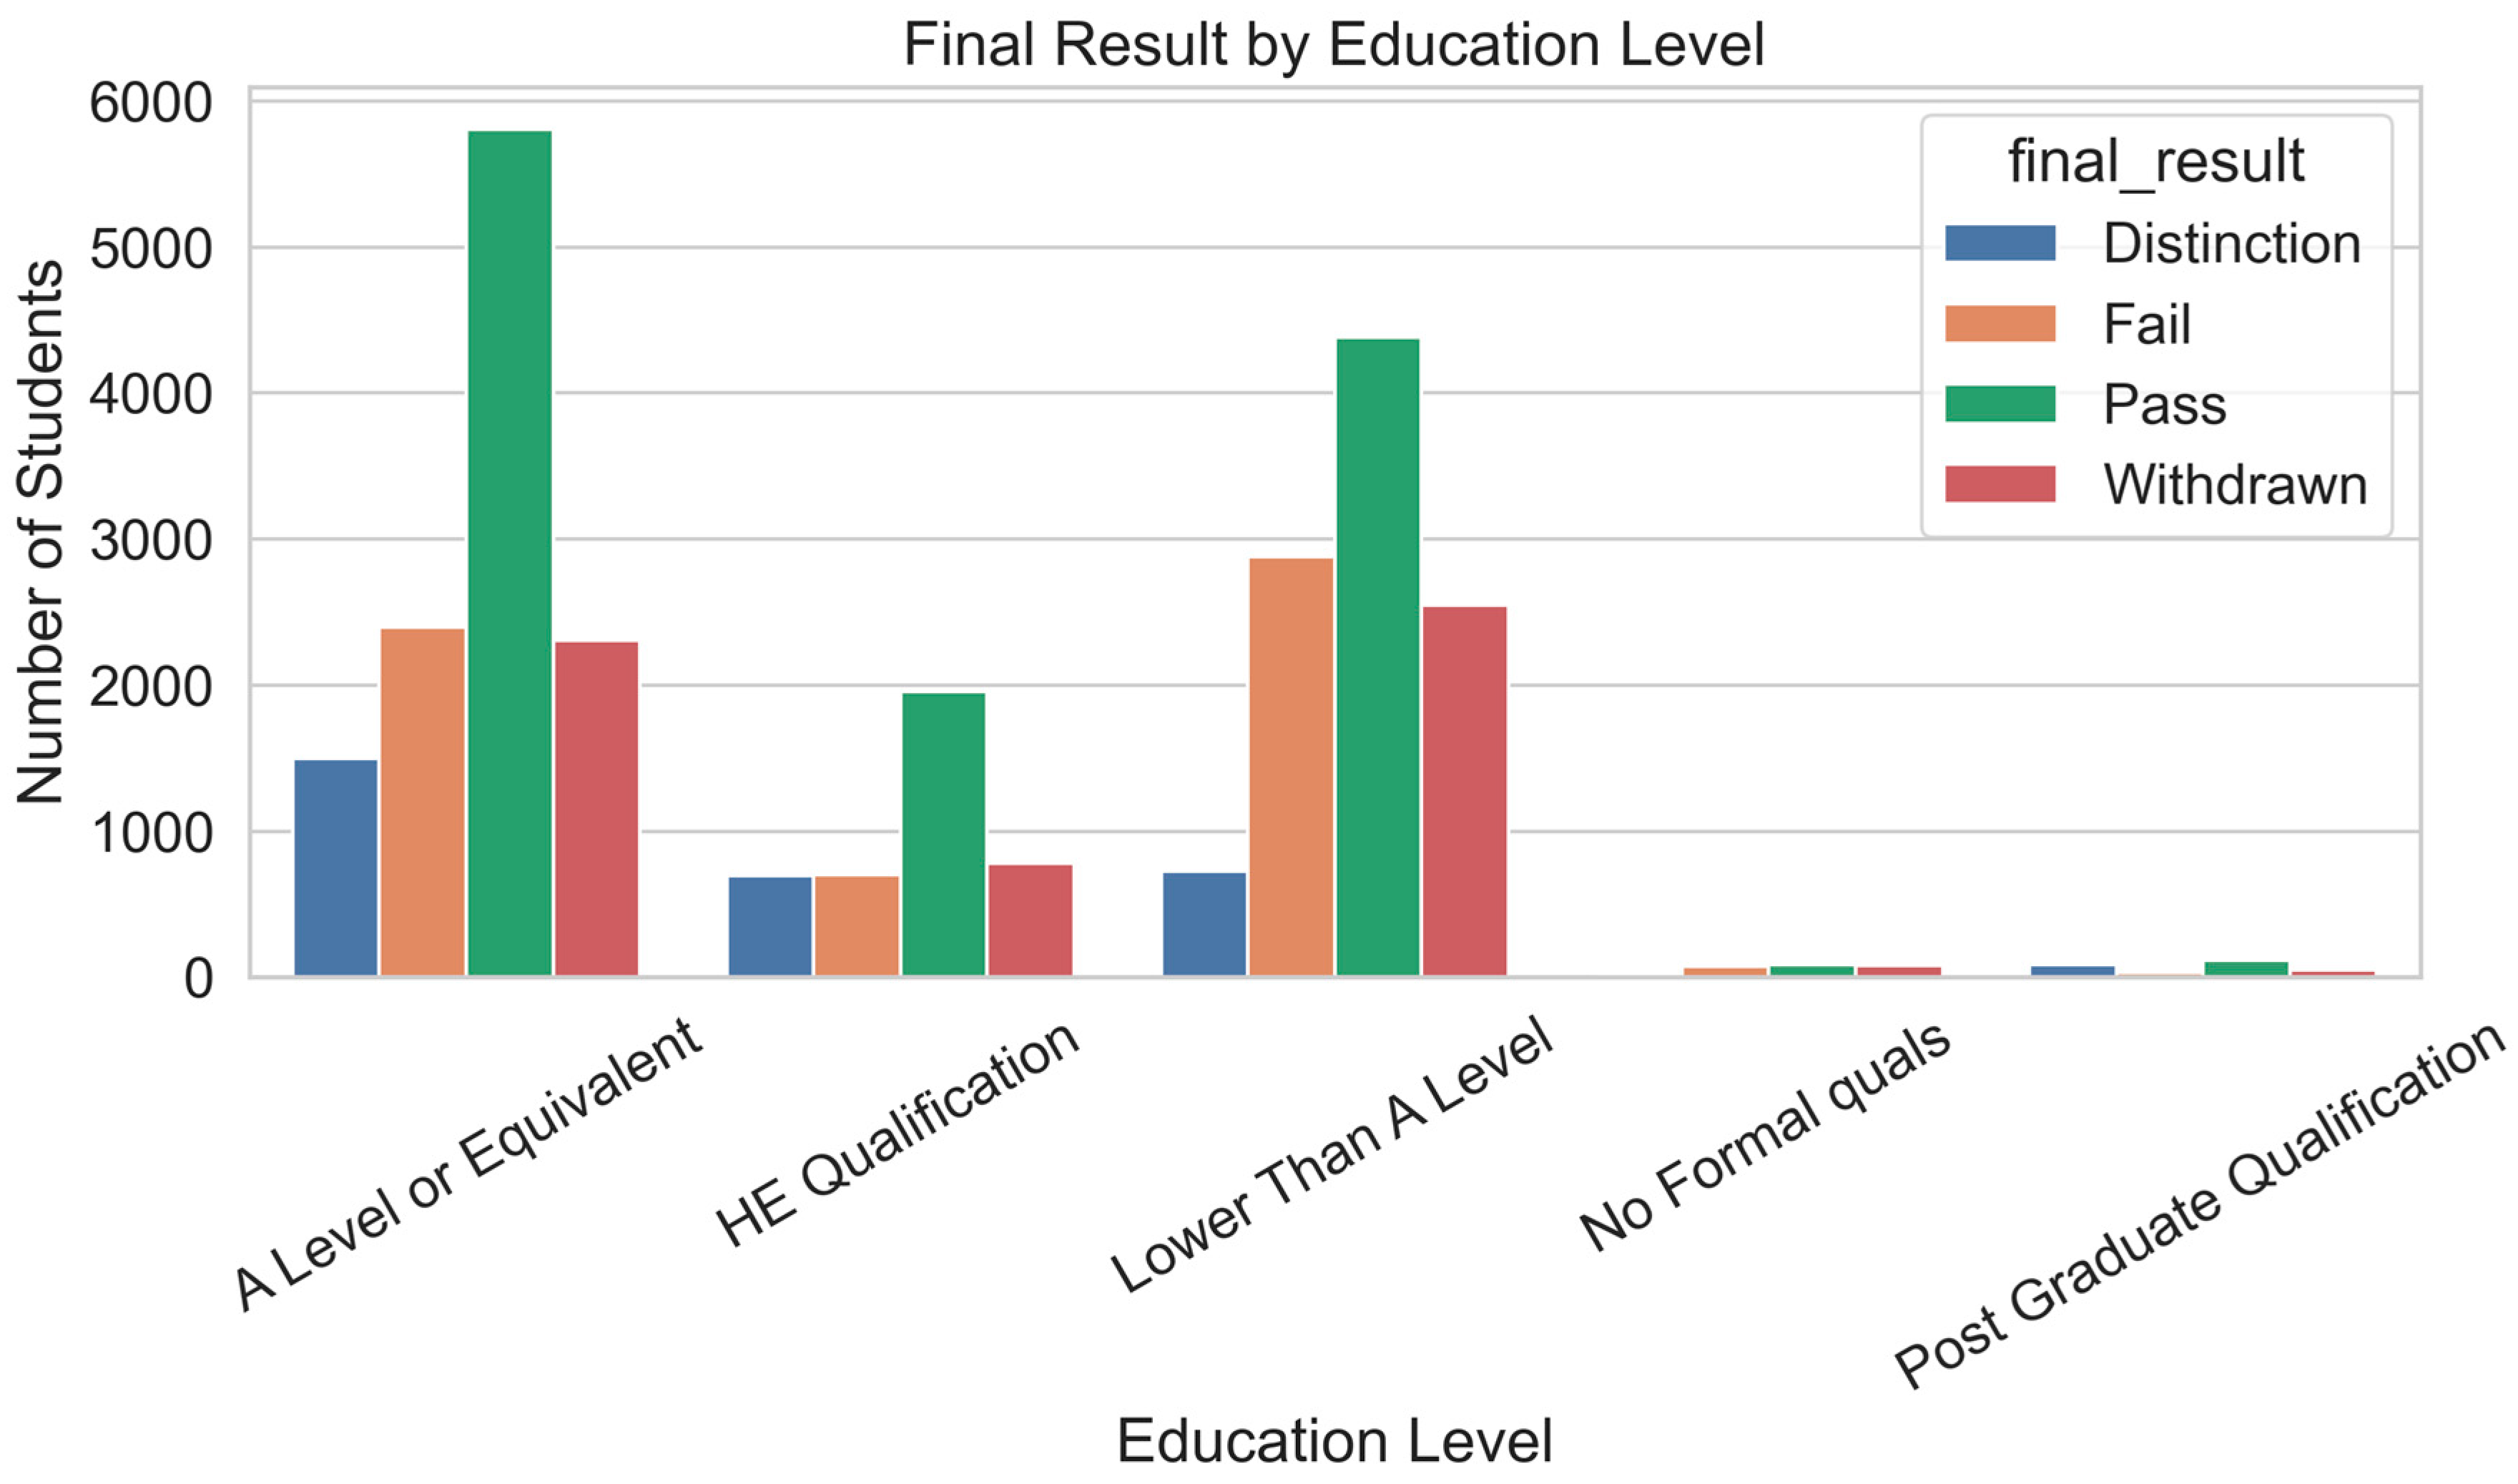
Figure 9) shows the distribution of final academic outcomes (Distinction, Pass, Fail, Withdrawn) across different student education levels. Students with “A Level or Equivalent” and “Lower Than A Level” make up the largest proportions and exhibit higher numbers of Fail and Withdrawn results compared to those with “HE Qualification” or “Post Graduate Qualification.” This suggests that prior education level is a strong indicator of student risk level in online learning environments.
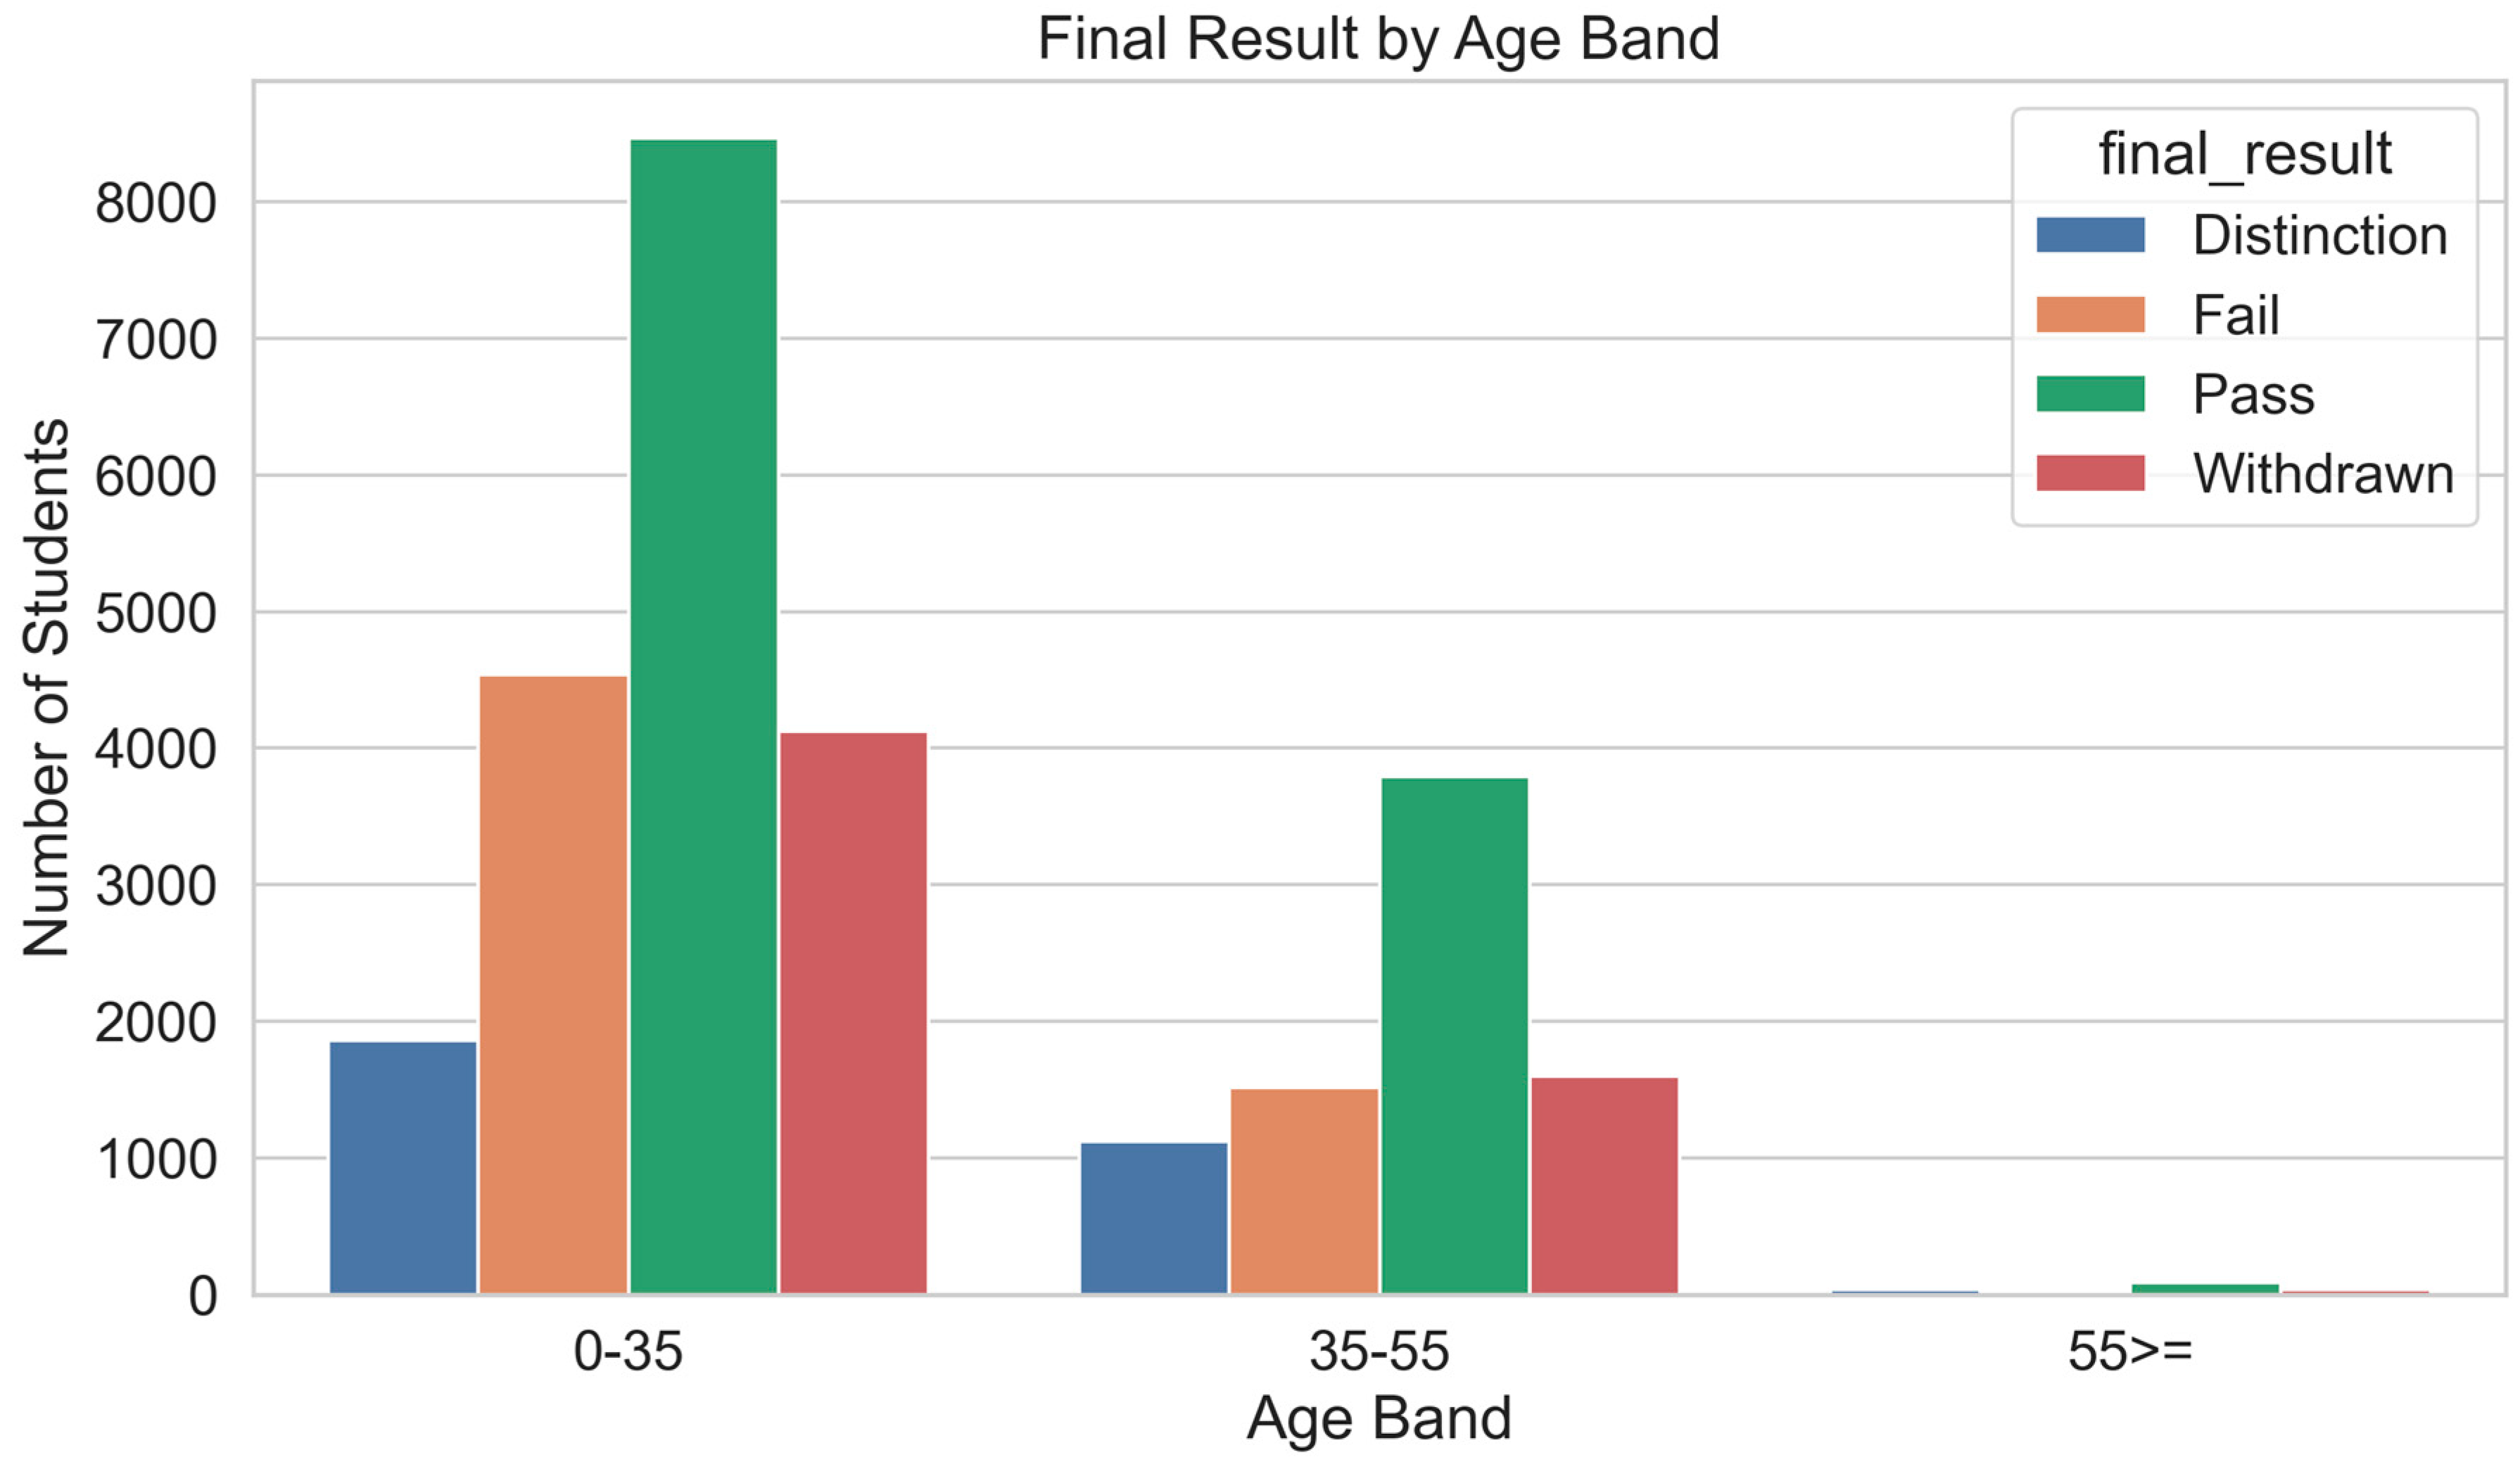
Figure 10 illustrates the final academic results across three age bands: 0–35, 35–55, and 55>=. The majority of the students are in the 0–35 age group, which also shows a high number of fails and withdrawals. However, the 35–55 group has a better performance distribution relative to its size, while the 55>= group is the smallest and shows very low overall participation.
6. Conclusions
D3S3real is the name of the study that effectively introduced it as a real-time, rule-based decision support system that helps student success and security through the early, proactive identification of at-risk learners. Utilizing the OULAD and based on an analysis of behavioral engagement, D3S3real employs four interpretable rules to warn students showing signs of concern on a monthly basis within the virtual learning environment (VLE). These rules, through visual dashboards and alert summaries, combine to present actionable intelligence for educators to intervene in a timely manner. The system was continuously tested using filtering, simulation, and evaluation, and found to be effective with a high recall rate of 86% and predictive validity for 27,223 distinct student course enrollments. Statistical examinations proved that withdrawal and failure students were constantly linked to a higher number of triggers they generated compared to their successful counterparts. Visualization tools that included a weekly timeline, rule contribution breakdown, and confusion matrix chart enhanced the system transparency and interpretability more, which were crucial for adoption by practitioners. In addition, the system was validated quantitatively and qualitatively through precision (72%) and recall (86%) metrics and also through confusion matrices, ROC-style comparisons that led to the improvement of rule thresholds. Even though a complete ROC curve was missing, these examinations consolidated the alerting framework as the credibility was proved through the high level of balance between sensitivity and specificity. Instead of confusing machine learning models, the system is implemented through easy-to-follow rules, which means D3S3real retains its transparency and effectiveness in real-world scenarios across various organizations. D3Sreal’s rule-based design architecture includes several important benefits: the straightforwardness of incorporating it into running learning management systems (e.g., Moodle, Canvas), the transparency of the alert metrics, and the small dependence on elaborate black-box models. Further, the system is based on ethical standards and privacy-preserving considerations, hence achieving compliance with the FERPA and GDPR frameworks. To summarize, D3S3real proves that real-time, data-based vigilance can significantly improve the early flagging of at-risk students, thus allowing the schools to move from a reactive to a proactive approach in academic support. These so-called alerts, when integrated with visible and statistical diagnostics, come as a scaling tool for learning analytics, academic advising, and institutional retention strategies.
6.1. Practical and Managerial Implications
The usefulness of D3S3real is due to its straightforwardness, transparency, and real-time responsiveness. These features make it easy to implement in the existing infrastructures of institutions like Moodle or Canvas. The system for teachers includes an early warning mechanism that draws out effective measures from visual dashboards that can be understood easily, thus making it possible for teachers to contact learners at risk of missing important milestones in time. The academic advisors and learning support staff who depend on the alerts triggered by the rules can give priority to their interventions, arrange tutoring resources more effectively, and attentively personalize interactions with students. D3S3real is a managerial solution with superior capacity for retention rate improvement, along with the ability to present evidence-based accountability in student success efforts. Its architecture is lightweight and rule-based, which makes it easily customizable to suit different types of pedagogical contexts. This adaptability does not require any machine learning expertise. The use of this system can markedly change the way institutions deal with student issues by moving them from reactive remediation to proactive student support. While this study focused on system design and simulation, future work will include user-centered evaluations to assess trust, perceived usefulness, and intervention effectiveness from the perspectives of educators and learners.
6.2. Limitations of the Study
Although D3S3real shows a high level of performance, it has its drawbacks as it has not yet been tested in real-life classroom environments with instructors and students. It mainly depends on the rigid, predefined thresholds, which may overlook the subtleties in different courses and subjects that must be applied. The model also does not consider emotional or textual data, that is, sources of data that would enhance prediction accuracy. The use of binary alerts is another area of concern here, as the model does not make urgency ranking, which is a possible improvement in the future. Another issue is that even though it is evaluated on the OULAD, it is still unknown if it can be used in other institutions or LMS environments. The lack of live deployment also means that the current assessment is based purely on simulation evaluation and necessarily leads to recommendations for further pilot studies to check the real impact, usage, and user feedback. Though the system is based on static thresholds derived through data-driven heuristics, we recognize that non-adaptive rules may result in classification errors in varied learning contexts. In future iterations, we plan to incorporate adaptive thresholds and personalized baselines to improve contextual responsiveness. The current implementation of D3S3real does not analyze affective indicators such as forum posts, sentiment, or message activity. Future enhancements could integrate NLP-based emotional analysis to expand the scope of behavioral risk detection. Additionally, the system currently does not model the relationship between a student’s prior education and the subject level of the VLE course, which may influence engagement and performance. Future work may incorporate regression or clustering techniques to explore this alignment and its impact on risk detection.
6.3. Ethical and Pedagogical Considerations
D3S3real adheres to responsible data practices aligned with institutional data governance policies, including FERPA and GDPR. While the system avoids intrusive data sources such as sentiment or private communications, we recognize the importance of ensuring transparency, securing informed consent, and preventing over-surveillance of learners. Moreover, ethical deployment must be balanced with pedagogical alignment, ensuring that alerts guide supportive interventions rather than punitive measures. Future deployment should involve stakeholder consultation, including students and educators, to validate fairness, trust, and educational relevance.
7. Future Scope
D3S3real is a rule-based modeling tool that excels in real-time risk detection. However, some improvements are possible that could extend its functionality and widen its impact in subsequent research and practical applications. To begin with, the system might include adaptive thresholds that change with the course difficulty, student history, or institutional norms. This would make the alerting engine more context-sensitive and could bring down false positives in varied academic settings. In addition, the use of natural language processing (NLP) to analyze forum discussions, chat transcripts, or submitted assignments can improve the behavioral signal space. Sentiment analysis and topical tracking may provide further markers of engagement, confusion, or motivation loss. In addition, D3S3real could become a hybrid decision model through the employment of machine learning algorithms (for instance, logistic regression, random forest) along with the existing rule logic. Such algorithms can administer optimal rule weights or offer a secondary check for cases that are set to be flagged while they are still interpretable. Another promising avenue is the incorporation of urgency levels (e.g., escalating alerts based on compound rule triggers) and risk profiling (e.g., age, educational background) to better tailor interventions. Alongside this, future deployments should be designed as institutional pilots, in which teachers will be the ones who shall act directly on the live alerts. This approach will allow the real-world assessment of the impact of the alerts on the timing of the interventions, the quality of the academic advisors, and the overall student outcomes over time. Thus, the validation of cross-institutional datasets from other regions, languages, and educational systems will mainly measure the generalizability of D3S3real. Such research could also look at the system’s cultural or pedagogical alignment, thus making it more ingrained and customizable. The combination of these developments is expected to make D3S3real not only an early-warning solution but also the primary layer for such intelligent, ethical, and scalable educational analytics platforms.
Author Contributions
Conceptualization, A.A.E., A.R. and N.K.; methodology, A.A.E., A.R. and N.K.; software, A.A.E., A.R. and N.K.; validation, A.A.E., A.R. and N.K.; formal analysis, A.A.E., A.R. and N.K.; investigation, A.R. and N.K.; resources, A.A.E., A.R. and N.K.; data curation, A.A.E., A.R. and N.K.; writing—original draft preparation, A.A.E., A.R. and N.K.; writing—review and editing, A.R. and N.K.; visualization, A.A.E., A.R. and N.K.; supervision, N.K.; project administration, N.K. All authors have read and agreed to the published version of the manuscript.
Funding
This research received no external funding.
Data Availability Statement
The original contributions presented in the study are included in the article. Further inquiries can be directed to the corresponding author.
Acknowledgments
We acknowledge all contributors who supported this study.
Conflicts of Interest
The authors declare no conflicts of interest.
References
- Mutanov, G.; Mamykova, Z.; Kopnova, O.; Bolatkhan, M. Applied Research of Data Management in the Education System for Decision-Making on the Example of Al-Farabi Kazakh National University. E3S Web Conf. 2020, 159, 09003. [Google Scholar] [CrossRef]
- Halkiopoulos, C.; Gkintoni, E. Leveraging AI in E-Learning: Personalized Learning and Adaptive Assessment through Cognitive Neuropsychology—A Systematic Analysis. Electronics 2024, 13, 3762. [Google Scholar] [CrossRef]
- Gaftandzhieva, S.; Hussain, S.; Hilcenko, S.; Doneva, R.; Boykova, K. Data-Driven Decision Making in Higher Education Institutions: State-of-Play. Int. J. Adv. Comput. Sci. Appl. 2023, 14, 6. [Google Scholar] [CrossRef]
- Cele, N. Big Data-Driven Early Alert Systems as Means of Enhancing University Student Retention and Success. S. Afr. J. High. Educ. 2021, 35, 56–72. [Google Scholar] [CrossRef]
- Hafzan, M.Y.; Safaai, D.; Asiah, M.; Saberi, M.M.; Syuhaida, S.S. Review on Predictive Modelling Techniques for Identifying Students at Risk in University Environment. MATEC Web Conf. 2019, 255, 03002. [Google Scholar] [CrossRef]
- Shafiq, D.A.; Marjani, M.; Habeeb, R.A.A.; Asirvatham, D. Student Retention Using Educational Data Mining and Predictive Analytics: A Systematic Literature Review. IEEE Access 2022, 10, 72480–72503. [Google Scholar] [CrossRef]
- Shoaib, M.; Sayed, N.; Singh, J.; Shafi, J.; Khan, S.; Ali, F. AI Student Success Predictor: Enhancing Personalized Learning in Campus Management Systems. Comput. Hum. Behav. 2024, 158, 108301. [Google Scholar] [CrossRef]
- Khan, I.; Ahmad, A.R.; Jabeur, N.; Mahdi, M.N. An Artificial Intelligence Approach to Monitor Student Performance and Devise Preventive Measures. Smart Learn. Environ. 2021, 8, 17. [Google Scholar] [CrossRef]
- Beridze, N.; Janelidze, G. Organizing Decision-Making Support System Based on Multi-Dimensional Analysis of the Educational Process Data. J. ICT Des. Eng. Technol. Sci. 2020, 4, 1–5. [Google Scholar] [CrossRef]
- Alyahyan, E.; Düştegör, D. Predicting Academic Success in Higher Education: Literature Review and Best Practices. Int. J. Educ. Technol. High Educ. 2020, 17, 3. [Google Scholar] [CrossRef]
- Du, Y. Application of the Data-Driven Educational Decision-Making System to Curriculum Optimization of Higher Education. Wirel. Commun. Mob. Comput. 2022, 2022, 5823515. [Google Scholar] [CrossRef]
- Chawla, S.; Tomar, P.; Gambhir, S. Smart Education: A Proposed IoT-Based Interoperable Architecture to Make Real-Time Decisions in Higher Education. Rev. Geintec-Gest. Inov. Tecnol. 2021, 11, 5643–5658. Available online: https://revistageintec.net/old/wp-content/uploads/2022/03/2589.pdf (accessed on 21 May 2025). [CrossRef]
- Krishnan, R.; Nair, S.; Saamuel, B.S.; Justin, S.; Iwendi, C.; Biamba, C.; Ibeke, E. Smart Analysis of Learners Performance Using Learning Analytics for Improving Academic Progression: A Case Study Model. Sustainability 2022, 14, 3378. [Google Scholar] [CrossRef]
- Byrd, M.A.; Woodward, L.S.; Yan, S.; Simon, N. Analytical Collaboration for Student Graduation Success: Relevance of Analytics to Student Success in Higher Education. Mid-West. Educ. Res. 2018, 30, 5. Available online: https://scholarworks.bgsu.edu/mwer/vol30/iss4/5 (accessed on 25 April 2025).
- Khor, E.T.; Looi, C.K. A Learning Analytics Approach to Model and Predict Learners’ Success in Digital Learning. ASCILITE Conf. Proc. 2019, 2019, 315. [Google Scholar] [CrossRef]
- Hernández-de-Menéndez, M.; Morales-Menendez, R.; Escobar, C.A.; Acevedo-González, R. Learning Analytics: State of the Art. Int. J. Interact. Des. Manuf. 2022, 16, 1209–1230. [Google Scholar] [CrossRef]
- Buldaev, A.A.; Naykhanova, L.V.; Evdokimova, I.S. Model of Decision Support System in Educational Process of a University on the Basis of Learning Analytics. Softw. Syst. Comput. Methods 2020, 4, 42–52. [Google Scholar] [CrossRef]
- Barile, L.; Elliott, C.; McCann, M.; Pantea, Z.P. Students’ Use of Virtual Learning Environment Resources and Their Impact on Student Performance in an Econometrics Module. Teach. Math. Its Appl. 2024, 43, 356–371. [Google Scholar] [CrossRef]
- Yağcı, M. Educational Data Mining: Prediction of Students’ Academic Performance Using Machine Learning Algorithms. Smart Learn. Environ. 2022, 9, 11. [Google Scholar] [CrossRef]
- Baer, L.L.; Norris, D.M. A Call to Action for Student Success Analytics. Plan. High. Educ. 2016, 44, 1. Available online: https://link.gale.com/apps/doc/A471001697/AONE?u=anon~94c9e034&sid=googleScholar&xid=79e6d537 (accessed on 24 August 2025).
- Kavitha, G.; Raj, L. Educational Data Mining and Learning Analytics—Educational Assistance for Teaching and Learning. Int. J. Comput. Organ. Trends 2017, 7, 21–24. [Google Scholar] [CrossRef]
- Wang, X.; Schneider, H.; Walsh, K.R. A Predictive Analytics Approach to Building a Decision Support System for Improving Graduation Rates at a Four-Year College. J. Organ. End User Comput. 2020, 32, 43–62. [Google Scholar] [CrossRef]
- Zhu, Y. A Data Driven Educational Decision Support System. Int. J. Emerg. Technol. Learn. 2018, 13, 4–16. [Google Scholar] [CrossRef]
- Atalla, S.; Daradkeh, M.; Gawanmeh, A.; Khalil, H.; Mansoor, W.; Miniaoui, S.; Himeur, Y. An Intelligent Recommendation System for Automating Academic Advising Based on Curriculum Analysis and Performance Modeling. Mathematics 2023, 11, 1098. [Google Scholar] [CrossRef]
- Domínguez Figaredo, D. Data-Driven Educational Algorithms: Pedagogical Framing. RIED Rev. Iberoam. Educ. Distancia 2020, 23, 75–90. Available online: https://www.redalyc.org/articulo.oa?id=331463171004 (accessed on 24 April 2025). [CrossRef]
- Bohomazova, V. Innovative Technologies in Education: National Foresight. Univ. Sci. Notes 2022, 1–2, 138–159. [Google Scholar] [CrossRef]
- Machii, J.; Murumba, J.; Micheni, E. Educational Data Analytics and Fog Computing in Education 4.0. Open J. Inf. Technol. 2023, 6, 47–58. [Google Scholar] [CrossRef]
- Wei, W.; Jin, Y. A Novel Internet of Things-Supported Intelligent Education Management System Implemented via Collaboration of Knowledge and Data. Math. Biosci. Eng. 2023, 20, 13457–13473. [Google Scholar] [CrossRef]
- Kuzilek, J.; Hlosta, M.; Zdrahal, Z. Open University Learning Analytics Dataset. Sci. Data 2017, 4, 170171. [Google Scholar] [CrossRef] [PubMed]
- Blumenstein, M.; Liu, D.Y.T.; Richards, D.; Leichtweis, S.; Stephens, J.M. Data-Informed Nudges for Student Engagement and Success. In Learning Analytics in the Classroom: Translating Learning Analytics Research for Teachers; Lodge, J., Horvath, J.C., Corrin, L., Eds.; Routledge: London, UK, 2018; pp. 185–207. [Google Scholar]
- Slade, S.; Prinsloo, P. Learning Analytics: Ethical Issues and Dilemmas. Am. Behav. Sci. 2013, 57, 1510–1529. [Google Scholar] [CrossRef]
- Holstein, K.; Hong, G.; Tegene, M.; McLaren, B.M.; Aleven, V. The Classroom as a Dashboard: Co-Designing Wearable Cognitive Augmentation for K-12 Teachers. In Proceedings of the 8th International Conference on Learning Analytics and Knowledge (LAK’18), Sydney, Australia, 7 March 2018; pp. 79–88. [Google Scholar] [CrossRef]
- Calvert, C.E. Developing a Model and Applications for Probabilities of Student Success: A Case Study of Predictive Analytics. Open Learn. J. Open Distance e-Learn. 2014, 29, 160–173. [Google Scholar] [CrossRef]
- Rukhiran, M.; Wong-In, S.; Netinant, P. IoT-Based Biometric Recognition Systems in Education for Identity Verification Services: Quality Assessment Approach. IEEE Access 2023, 11, 22767–22787. [Google Scholar] [CrossRef]
- Nguyen, A.; Gardner, L.; Sheridan, D. Data Analytics in Higher Education: An Integrated View. J. Inf. Syst. Educ. 2020, 31, 61–71. [Google Scholar]
| Disclaimer/Publisher’s Note: The statements, opinions and data contained in all publications are solely those of the individual author(s) and contributor(s) and not of MDPI and/or the editor(s). MDPI and/or the editor(s) disclaim responsibility for any injury to people or property resulting from any ideas, methods, instructions or products referred to in the content. |
© 2025 by the authors. Licensee MDPI, Basel, Switzerland. This article is an open access article distributed under the terms and conditions of the Creative Commons Attribution (CC BY) license (https://creativecommons.org/licenses/by/4.0/).

