Article

I Can’t Get No Satisfaction? From Reviews to Actionable Insights: Text Data Analytics for Utilizing Online Feedback

by
Ioannis C. Drivas
,
Eftichia Vraimaki
* and
Nikolaos Lazaridis
Department of Archival, Library and Information Studies, University of West Attica, 12243 Egaleo, Greece
*
Author to whom correspondence should be addressed.
Digital 2025, 5(3), 35; https://doi.org/10.3390/digital5030035
Submission received: 28 May 2025 / Revised: 6 August 2025 / Accepted: 14 August 2025 / Published: 19 August 2025
(This article belongs to the Special Issue Advances in Data Management)

Abstract

Cultural heritage institutions, such as museums and galleries, today face the challenge of managing an increasing volume of unsolicited visitor feedback generated across online platforms. This study offers a practical and scalable methodology that transforms 5856 multilingual Google reviews from 59 globally ranked museums and galleries into actionable insights through sentiment analysis, correlation diagnostics, and guided Latent Dirichlet Allocation. By addressing the limitations of prior research, such as outdated datasets, monolingual bias, and narrow geographical focus, the authors analyze a current and diverse set of recent reviews to capture a timely and globally relevant perspective on visitor experiences. The adopted guided LDA model identifies 12 key topics, reflecting both operational issues and emotional responses. The results indicate that while visitors generally express overwhelmingly positive sentiments, dissatisfaction tends to be concentrated in specific service areas. Correlation analysis reveals that longer, emotionally rich reviews are more likely to convey stronger sentiment and receive peer endorsement, highlighting their diagnostic significance. From a practical perspective, the methodology empowers professionals to prioritize improvements based on data-driven insights. By integrating quantitative metrics with qualitative topics, this study supports operational decision-making and cultivates a more empathetic and responsive data management mindset for museums. The reproducible and adaptable nature of the pipeline makes it suitable for cultural institutions of various sizes and resources. Ultimately, this work contributes to the field of cultural informatics by bridging computational precision with humanistic inquiry. That is, it illustrates how intelligent analysis of visitor reviews can lead to a more personalized, inclusive, and strategic museum experience.

1. Introduction

In the contemporary digital landscape, cultural heritage institutions (CHIs) have transitioned from passive public opinion recipients to active participants in a dynamic feedback ecosystem. Platforms such as Google Maps, TripAdvisor, and social media enable users to freely share their experiences, generating a wealth of unsolicited feedback that is rich in sentiment and storytelling [1]. This feedback presents cultural institutions with invaluable insights into visitor engagement and [dis]satisfaction. Yet, despite the abundance of data, museums and galleries have only recently begun to systematically analyze these digital footprints to improve service design, enhance audience engagement, and guide strategic planning [2].
While previous research has acknowledged the potential inherent in visitor reviews, many studies are constrained by limitations such as reliance on outdated datasets, monolingual bias, and analyses restricted to specific regions or types of museums, e.g., [1,3,4]. Consequently, the applicability and relevance of these findings are diminished in today’s rapidly evolving museum context. Furthermore, existing methodologies disproportionately focus on star ratings and word frequencies, neglecting the deeper emotional tones and topic structures embedded in the textual feedback. This issue has resulted in a critical gap in understanding how museums can effectively transform large-scale, multilingual review data into practical, actionable knowledge.
To address this gap, the present study introduces a hybrid analytical framework that captures both the thematic depth and emotional nuance of user-generated content. The current approach integrates sentiment analysis, correlation diagnostics, and guided Latent Dirichlet Allocation (LDA) topic modeling. Drawing on a dataset of 5856 reviews from 59 top-ranked museums worldwide, the authors aim to identify prevailing visitor concerns, such as accessibility, ambiance, and quality, while also analyzing the associated sentiment strength and satisfaction ratings. By correlating thematic elements with metrics such as review length and sentiment polarity, this research aims to illustrate how user feedback can inform resource allocation, prioritize improvements, and foster a more nuanced understanding of visitor experiences.
In doing so, the study contributes significantly to the broader shift toward intelligent cultural heritage management. Computational methodologies, such as topic modeling and sentiment scoring, serve as computational tools and innovative interpretive frameworks. These frameworks enable CHIs to cultivate empathy and responsiveness in their operational strategies, thereby increasing both pre- and post-visit visitor satisfaction. Furthermore, this effort demonstrates how such advanced technologies can enhance both curatorial and operational approaches, effectively bridging the humanistic aspirations of cultural institutions with analytical precision characteristics.
The structure of the paper is as follows: Section 2 reviews the pertinent literature and identifies critical research gaps. Section 3 delineates the dataset and methodologies employed, encompassing text pre-processing, sentiment analysis, and topic modeling. Section 4 presents the empirical results, while Section 5 discusses their theoretical and practical implications. Finally, the concluding section outlines the study’s limitations and potential directions for future research.

2. Related Background

2.1. Visitor Reviews for Museum Management

Visitors’ online reviews are essential in museum management, providing valuable insights into their experiences, preferences, and expectations. According to Alexander et al. [5], the systematic analysis of these reviews allows museum professionals to accurately identify the strengths of exhibits, popular amenities, and key attractions while highlighting areas needing improvement, such as wait times, navigation challenges, or inadequate signage. This targeted feedback enables CHI management to enhance the overall visitor experience, prioritize service updates, and address operational deficiencies effectively, ensuring that refinements respond directly to genuine visitor concerns rather than relying on internal assumptions or anecdotal evidence [6].
Visitor reviews also offer insights into audience sentiment, which are vital for protecting and improving a museum’s reputation. Regular monitoring enables museum administrators to promptly address negative feedback, thereby minimizing reputational risks [7]. On the other hand, positive visitor feedback can inform effective marketing campaigns, strengthen community engagement, and further highlight the museum’s contribution to society.
In addition, visitor reviews can contribute to competitive benchmarking within the cultural sector. Through the analysis of comparative reviews, museums can assess their performance relative to peer institutions, gaining insights into strengths and weaknesses [8]. This benchmarking process enables museums to remain responsive to the changing expectations of their visitors, ensuring they maintain a competitive edge. Additionally, actively managing online feedback enhances museums’ digital visibility and appeal, improving search engine findability and expanding social media outreach [1,8,9]. Finally, evidence-based datasets gathered from platforms such as TripAdvisor and Google Maps can significantly enrich academic understanding of visitor behavior and museum experiences.

2.2. Prior Research on Visitor Reviews

Scholars have investigated various methods for analyzing visitor-generated reviews to better understand museum audiences. Among the earlier contributions, Su and Teng [1] analyzed negative TripAdvisor reviews to identify common service failures in museums and suggest ways to improve visitor experiences. Using content and document analysis, they extracted 12 service quality dimensions (such as assurance, reliability, and responsiveness), which were later validated through surveys. Key issues included long queues, poor communication, and inadequate facilities, particularly staff responsiveness and accessibility. However, the study was limited to a specific group of museums.
Alexander and colleagues [5] analyzed 22,940 TripAdvisor reviews for 88 London museums, aiming to uncover visitor concerns and preferences. Utilizing topic modeling, which is a technique from computational social science, the authors identified key themes, such as waiting times, costs, and family-friendly activities. The findings highlighted both cultural and logistical concerns, like queues and food availability, and emphasized the emotional impact of museum visits. However, the dataset from 2014 may not reflect current visitor expectations, and the focus on London also limits generalizability.
Chauhan and Shah [10] applied sentiment analysis, keyword co-occurrence, and topic modeling to ~200,000 TripAdvisor reviews from eight globally prominent museums. Using Python 3.10 for data processing and LDA for topic modeling, they achieved 81% accuracy in sentiment classification of English reviews. Key topics included historical artifacts and personal experiences. Still, the study’s focus on large, well-known museums excludes insights from smaller or local institutions.
Lei et al. [3] compared 8243 visitor reviews from the Palace Museum and the China Science Museum, collected via Ctrip.com between 2012 and 2023. Using keyword extraction, semantic network analysis, and LDA topic modeling, the study found distinct thematic focuses: history and ambiance for the former; interactivity and education for the latter. Temporal shifts in satisfaction aligned with changing exhibits, but the lack of quantitative sentiment metrics limits the depth of analysis.
Wan and Forey [4] analyzed 207 English-language reviews of the Overseas Chinese Museum from 2012–2023 to explore expressions of collective identity. Through linguistic analysis, they observed a shift toward more cohesive narratives over time, linked to enhanced visitor satisfaction and exhibit improvements. While valuable, the single-museum focus restricts generalization across different museum types or cultural contexts.
Agostino et al. [11] analyzed 14,250 TripAdvisor reviews of Italian museums using a bottom-up approach and LDA topic modeling to identify key themes. Museum heritage (46%) and personal experiences (31%) dominated the discussion, with services receiving less focus (23%). Notable latent topics included “Museum’s History and Tradition” and “Emotional Visits.” However, the exclusive use of Italian-language reviews may omit perspectives from international visitors.

2.3. Research Gap and Scope

While prior research has significantly enhanced the understanding of visitor perceptions and experiences through online reviews analysis, several notable limitations persist. Notably, previous studies have often been constrained by the temporal limits of their datasets, with many relying on data from earlier periods. Furthermore, existing works commonly focus on a narrow selection of museums or specific geographical regions, thereby restricting the generalizability of findings. Another critical gap lies in the limited attention to multilingual data. Most studies analyze only English-language reviews or a single local language, overlooking valuable insights from international visitors. For instance, research on Italian museums often excludes perspectives from non-Italian speakers.
This study addresses these limitations by analyzing a contemporary dataset, predominantly comprising reviews from 2024, ensuring relevance to current visitor expectations and perceptions. The study also encompasses a diverse collection of 59 museums across 19 countries, significantly enhancing the generalizability and global application of the findings. Importantly, this work incorporates a substantial multilingual dataset: 3080 out of 5856 non-English reviews were translated and included, enabling a more inclusive and representative analysis of global visitor perspectives.
Moreover, the study’s methodology integrates quantitative metrics, such as textual character length, numerical ratings (5-star reviews), and review likes, with qualitative content analysis employing advanced topic modeling techniques. This dual methodological framework facilitates a comprehensive evaluation of visitor experiences by merging measurable attributes of visitor feedback with rich qualitative insights. In the next table (Table 1), research gaps are presented along with how these are tackled through the current study.
In this context, the primary aim of this study is to offer an up-to-date, globally inclusive, and methodologically robust analysis of visitor experiences across a wide range of museums and galleries from all over the world. The goal is to uncover both broad global trends and more localized visitor expectations, supporting managers in enhancing service quality and visitor satisfaction. By combining quantitative metrics with qualitative insights, this approach provides actionable guidance, helping managers allocate resources more effectively, address key service shortcomings, and design strategies that align with actual visitor needs.

3. Materials and Methods

To begin with, the study initiates a systematic four-step methodology to convert online visitor reviews into actionable insights. This approach encompasses data collection, data pre-processing, analysis methods, and a visualization of the results. A visual representation of the entire methodological workflow is illustrated in Figure 1, offering a comprehensive overview of the implemented processes. The subsequent subsections will elaborate on each of these steps, detailing the specific techniques and models utilized throughout the analysis.

3.1. Data Collection

The data collection process was carried out in three sequential steps. First, museum cases were selected based on The Art Newspaper’s March 2024 list, which ranks the world’s most-visited art museums according to their annual visitor numbers [12]. In the second step, the Google Maps profiles of these selected museums were located and documented to create a reliable source of visitor reviews. While this list served as a starting point, the final sample was reduced to 59 museums. This selective inclusion was influenced by practical challenges encountered during data collection. More specifically, not all listed museums had active or accessible Google Maps profiles, and in some instances, the quantity or quality of available reviews was insufficient for meaningful analysis. To ensure consistency, data integrity, and analytical relevance, only those museums with a reliable volume of accessible, textual user reviews were retained in the final dataset. Although this approach resulted in a more limited scope, it prioritized the quality and comparability of the data across cases. Finally, in the third step, reviews were gathered using the web-scraping tool OutScraper, yielding an initial dataset of 12,000 reviews, encompassing both textual and non-textual entries. During the first pre-processing phase, non-textual reviews were excluded from the main corpus of potential analysis, resulting in a refined dataset of 5856 textual reviews. The following section will detail the subsequent pre-processing steps and outline the characteristics of the final dataset.

3.2. Data Pre-Processing

The scraping tool utilized in this study generated a variety of metrics that describe the characteristics of the extracted reviews. To complement these, additional custom metrics were developed to provide a deeper understanding of the dataset’s characteristics. Table 2 presents an overview of these metrics, including their names, definitions, and examples drawn from actual retrieved data.
To ensure accuracy and reliability in the subsequent text analysis, a systematic data cleaning and pre-processing procedure was applied. These steps were crucial in enhancing textual data quality, reducing noise, and ensuring consistency. At this point, it is important to clarify that the comprehensive pre-processing steps described earlier were applied solely to the dataset used for the guided LDA topic modeling. In contrast, the text reviews for the VADER sentiment analysis were intentionally left in their original form. This choice was made due to the design of VADER as a lexicon and rule-based model specifically calibrated to capture the nuances of sentiment from elements such as emojis, capitalization, and punctuation [5,13]. Removing these features would have compromised the model’s ability to accurately assess sentiment, as its effectiveness relies on the presence of such elements.
Therefore, to standardize and refine the text reviews data for topic modeling, a range of cleaning and pre-processing techniques was implemented:
  • Lowercasing: All textual data was transformed to lowercase to ensure uniformity and eliminate discrepancies arising from case sensitivity [13].
  • Removal of punctuation and special characters: Punctuation marks and extraneous symbols (e.g., !, ?) were removed, as they do not contribute substantively to the analysis and may introduce unnecessary variance [14].
  • Tokenization: The text was segmented into individual words (tokens) to facilitate subsequent processing and analysis [15].
  • Stopword removal: Common stop words, such as “the,” “is,” and “and,” were removed because they offer minimal informational value and could introduce noise into the analysis [16].
  • Lemmatization/Stemming: Words were reduced to their root forms to treat variations of the same lexeme as a single entity. For instance, “painter” and “painting” were standardized to their base form, “paint.” This mitigated redundancy and enhanced consistency in text representation [17].
All these techniques ensured the dataset was optimized for analysis, making the corpus more structured and conducive to the topic modeling process. Table 3 presents examples of both unprocessed and processed reviews, followed by a detailed description of the analyses conducted on the cleaned dataset.
Lastly, it is noted that in terms of data pre-processing, to ensure consistency in the analysis and accurately capture the diverse range of visitor feedback, all non-English reviews were translated into English using the GOOGLETRANSLATE function. Recognizing that machine translation can introduce semantic inaccuracies, we established a quality control process to enhance the integrity of the multilingual analysis. A random sample of 5% of the translated reviews (~300 reviews) was manually spot-checked by the authors to confirm that the essential meaning of the original text was preserved. For this verification, the authors employed two different online translators, Translate.com and DeepL, to test the similarity of GOOGLETRANSLATE function output. The initial translated text was sequentially transferred to both tools to assess whether their meaning remains the same. This approach helped mitigate potential errors and ensured the semantic accuracy of the translated corpus. It is noteworthy to mention that the translated texts were applied to both sentiment and topic modeling processes.

3.3. Analysis Methods

3.3.1. Descriptive Statistics

In the initial diagnostic phase, the authors analyzed four key quantitative metrics: number of characters, review sentiment score, review rating, and review likes. Descriptive statistics (mean, median, standard deviation, skewness, minimum, and maximum) were used to understand the distribution and central tendencies of these metrics. The Shapiro–Wilk test was applied to assess normality assumptions. This diagnostic phase provides museum managers with a foundational understanding of visitor feedback metrics.

3.3.2. Sentiment Analysis

To analyze sentiment, a systematic approach was followed for model selection and score calculation:
  • Sentiment model selection: The VADER (Valence Aware Dictionary and sEntiment Reasoner) model was selected, owing to its proven efficacy in processing short texts and user-generated content [18,19]. VADER is particularly advantageous for sentiment analysis within social media and review-oriented datasets, as it adeptly accounts for both lexical features and the intensity of words through a rule-based approach [5].
  • Calculation of scores: The sentiment analysis was systematically executed in two primary phases. First, polarity calculation, where each review was analyzed to ascertain its sentiment polarity, categorizing it as positive, neutral, or negative based on predefined thresholds established within the VADER model. It is noted that sentiment analysis was performed on the original, unfiltered text corpus employing the VADER tool. This methodological approach effectively incorporates various linguistic features, such as stop words, punctuation, emoticons, and additional syntactic cues, to enhance the precision of the computed compound sentiment score [20]. Second, aggregation was followed to provide a holistic view of sentiment scores. The aggregation included individual sentiment scores for each review as well as overall sentiment distribution for the entire corpus. For Darraz et al. [21], this approach facilitated the identification of dominant sentiment trends and yielded both a micro- and macro-level overview of audience perceptions.
  • Visualization: To enhance the interpretability of the findings, various visualization techniques were employed to elucidate the sentiment distribution across the dataset. Scatter plots and bar graphs were generated to clearly represent the proportions of positive, neutral, and negative sentiments. These visualizations not only fostered a more intuitive comprehension of sentiment trends of the current corpus but also contributed to the identification of potential patterns within the data.

3.3.3. Correlation Analysis

Correlation analysis is crucial for discerning patterns among sentiment analysis scores, reviews, character length, and ratings. Specifically, exploring the relationship between sentiment scores and review length can help determine whether emotionally charged feedback, whether positive or negative, correlates with more detailed reviews. Research indicates that longer reviews tend to be more emotionally expressive, as visitors with strong opinions are more inclined to elaborate [22]. By investigating these correlations, museum managers can gain valuable insights into visitor satisfaction and dissatisfaction, allowing them to pinpoint areas that require improvement, based on the depth of feedback received.
Furthermore, examining the connection between review length and ratings can reveal trends in visitor satisfaction. Studies have shown that longer reviews are frequently linked to higher ratings, as satisfied visitors are more likely to provide comprehensive feedback [23]. In contrast, shorter reviews may indicate lower ratings and less detailed expressions of dissatisfaction [22]. By understanding these dynamics, museum managers can identify the factors contributing to detailed praise or criticism, enabling more targeted actions, encouraging longer reviews from satisfied visitors, or addressing concerns highlighted in brief negative feedback. By comprehending the relationships among sentiment, review length, and ratings, museums can refine their strategies to encourage more detailed feedback and more effectively address areas of dissatisfaction.
Spearman correlation coefficient was employed to examine the potential intercorrelations among sentiment analysis scores, review length, and ratings. As sentiment scores, review length, and ratings may not exhibit a linear relationship and could involve ranked data, Spearman’s rank correlation offers a robust approach to identifying monotonic relationships [24]. This enables us to gain more precise insights into how these metrics are inter-related and influence one another.

3.3.4. Topic Modeling

Given the high volume and unstructured nature of these reviews, topic modeling presents an effective method for systematically uncovering museum visitors’ underlying topics and concerns. By utilizing topic modeling, museums can efficiently categorize extensive amounts of textual feedback into meaningful topics, facilitating the identification of areas of strength and aspects that require improvement [25]. This supports targeted strategic decisions aimed at enhancing visitor engagement and satisfaction.
In this study, the authors selected a guided LDA approach. Guided LDA is an enhancement of the traditional LDA topic modeling technique. It enables researchers to “guide” the topic discovery process by integrating prior knowledge through pre-selected “seed words”. These seed words significantly influence the algorithm, directing it toward uncovering more specific and interpretable topics that are pertinent to the research context [26]. This choice was influenced by prior research efforts identifying several relevant thematic categories commonly found in museum reviews, such as exhibition quality, staff interactions, facilities, accessibility, visitor services, etc. In the next table (Table 4), the topics used in prior studies are presented.
In the context of the computational methodology employed for the implementation of LDA, the authors utilized an already established algorithm, specifically Gensim (version 4.3.3), to load the comprehensive dataset comprising visitor reviews [27]. Then, we vectorized the cleaned corpus into a document–term matrix with CountVectorizer, filtering out extremely rare and overly familiar terms to stabilize model estimation. To steer the LDA towards semantically meaningful topics, a list of “seed” words was curated based on prior topic categorizations in the literature (for example, visitor services, accessibility, crowding, etc.), and their corresponding columns in the document–term matrix were amplified by a tunable factor (in this refinement, the authors used a factor of ×10). This amplification effectively enhances the prior probability of these words during topic inference, thereby anchoring the model toward the predefined categories without imposing strict constraints [28]. This heuristic approach, although not a native feature of Gensim, is a recognized technique for implementing a guided LDA model and is based on the principles of semi-supervised learning. By intentionally amplifying the counts of words identified as relevant to a topic, this method subtly steers the model’s posterior distributions toward these predefined themes [29]. This allows researchers to leverage the statistical power of the LDA model to mine latent relationships within the data [30] while simultaneously ensuring that the resulting topics are directly relevant and interpretable in the context of museum visitor feedback.
With the enhanced matrix ready, the study proceeded to fit a 12-component LDA model, utilizing a batch variational Bayes solver. Twelve topics were selected to align with the number of guided dimensions identified in earlier research efforts of Table 4, and we set enough iterations (20 in number) to ensure convergence. After fitting the model, the authors extracted the top 10 words for each topic by sorting the learned topic-word distributions. Subsequently, each topic was labeled based on its highest-probability terms, resulting in interpretable topics such as “Servicescape & Ambience,” “Convenience & Access,” and “Communication & Guiding.” This LDA approach effectively combines the statistical rigor of a generative Bayesian framework with the practical interpretability provided by the authors’ seed-word guidance [31].
After fitting the boosted LDA model, the posterior topic distribution for each review was calculated by applying variational inference through the model’s transform method, resulting in a K-dimensional probability vector for each document. Each review was assigned to the topic with the highest posterior probability, effectively highlighting its most prominent topic pattern. This approach takes full advantage of the generative framework of LDA, which models each document as a mixture of latent topics with words emerging from topic-specific distributions, thereby providing a clear document-level topic label for further analysis [32,33]. Using this sequential computational methodology and considering the already established topics as a guiding framework, the current effort aims to achieve a more accurate, relevant, and interpretable categorization of visitor-generated content.

4. Results

4.1. Dataset Characteristics

After completing the pre-processing procedures, the primary characteristics of the final dataset were analyzed, including an example of how the dataset is articulated, the distribution of star ratings, the linguistic composition of reviews, and the temporal patterns related to review volume and visitor satisfaction. These characteristics provide valuable context for understanding visitor behavior and feedback trends. Table 5 presents an example of how three museums of the current dataset fulfill the text analytics metrics of Table 2. Moreover, in Appendix A, a table of museums details is taking place including their name, country, address, and number of reviews collected per museum (Table A1).
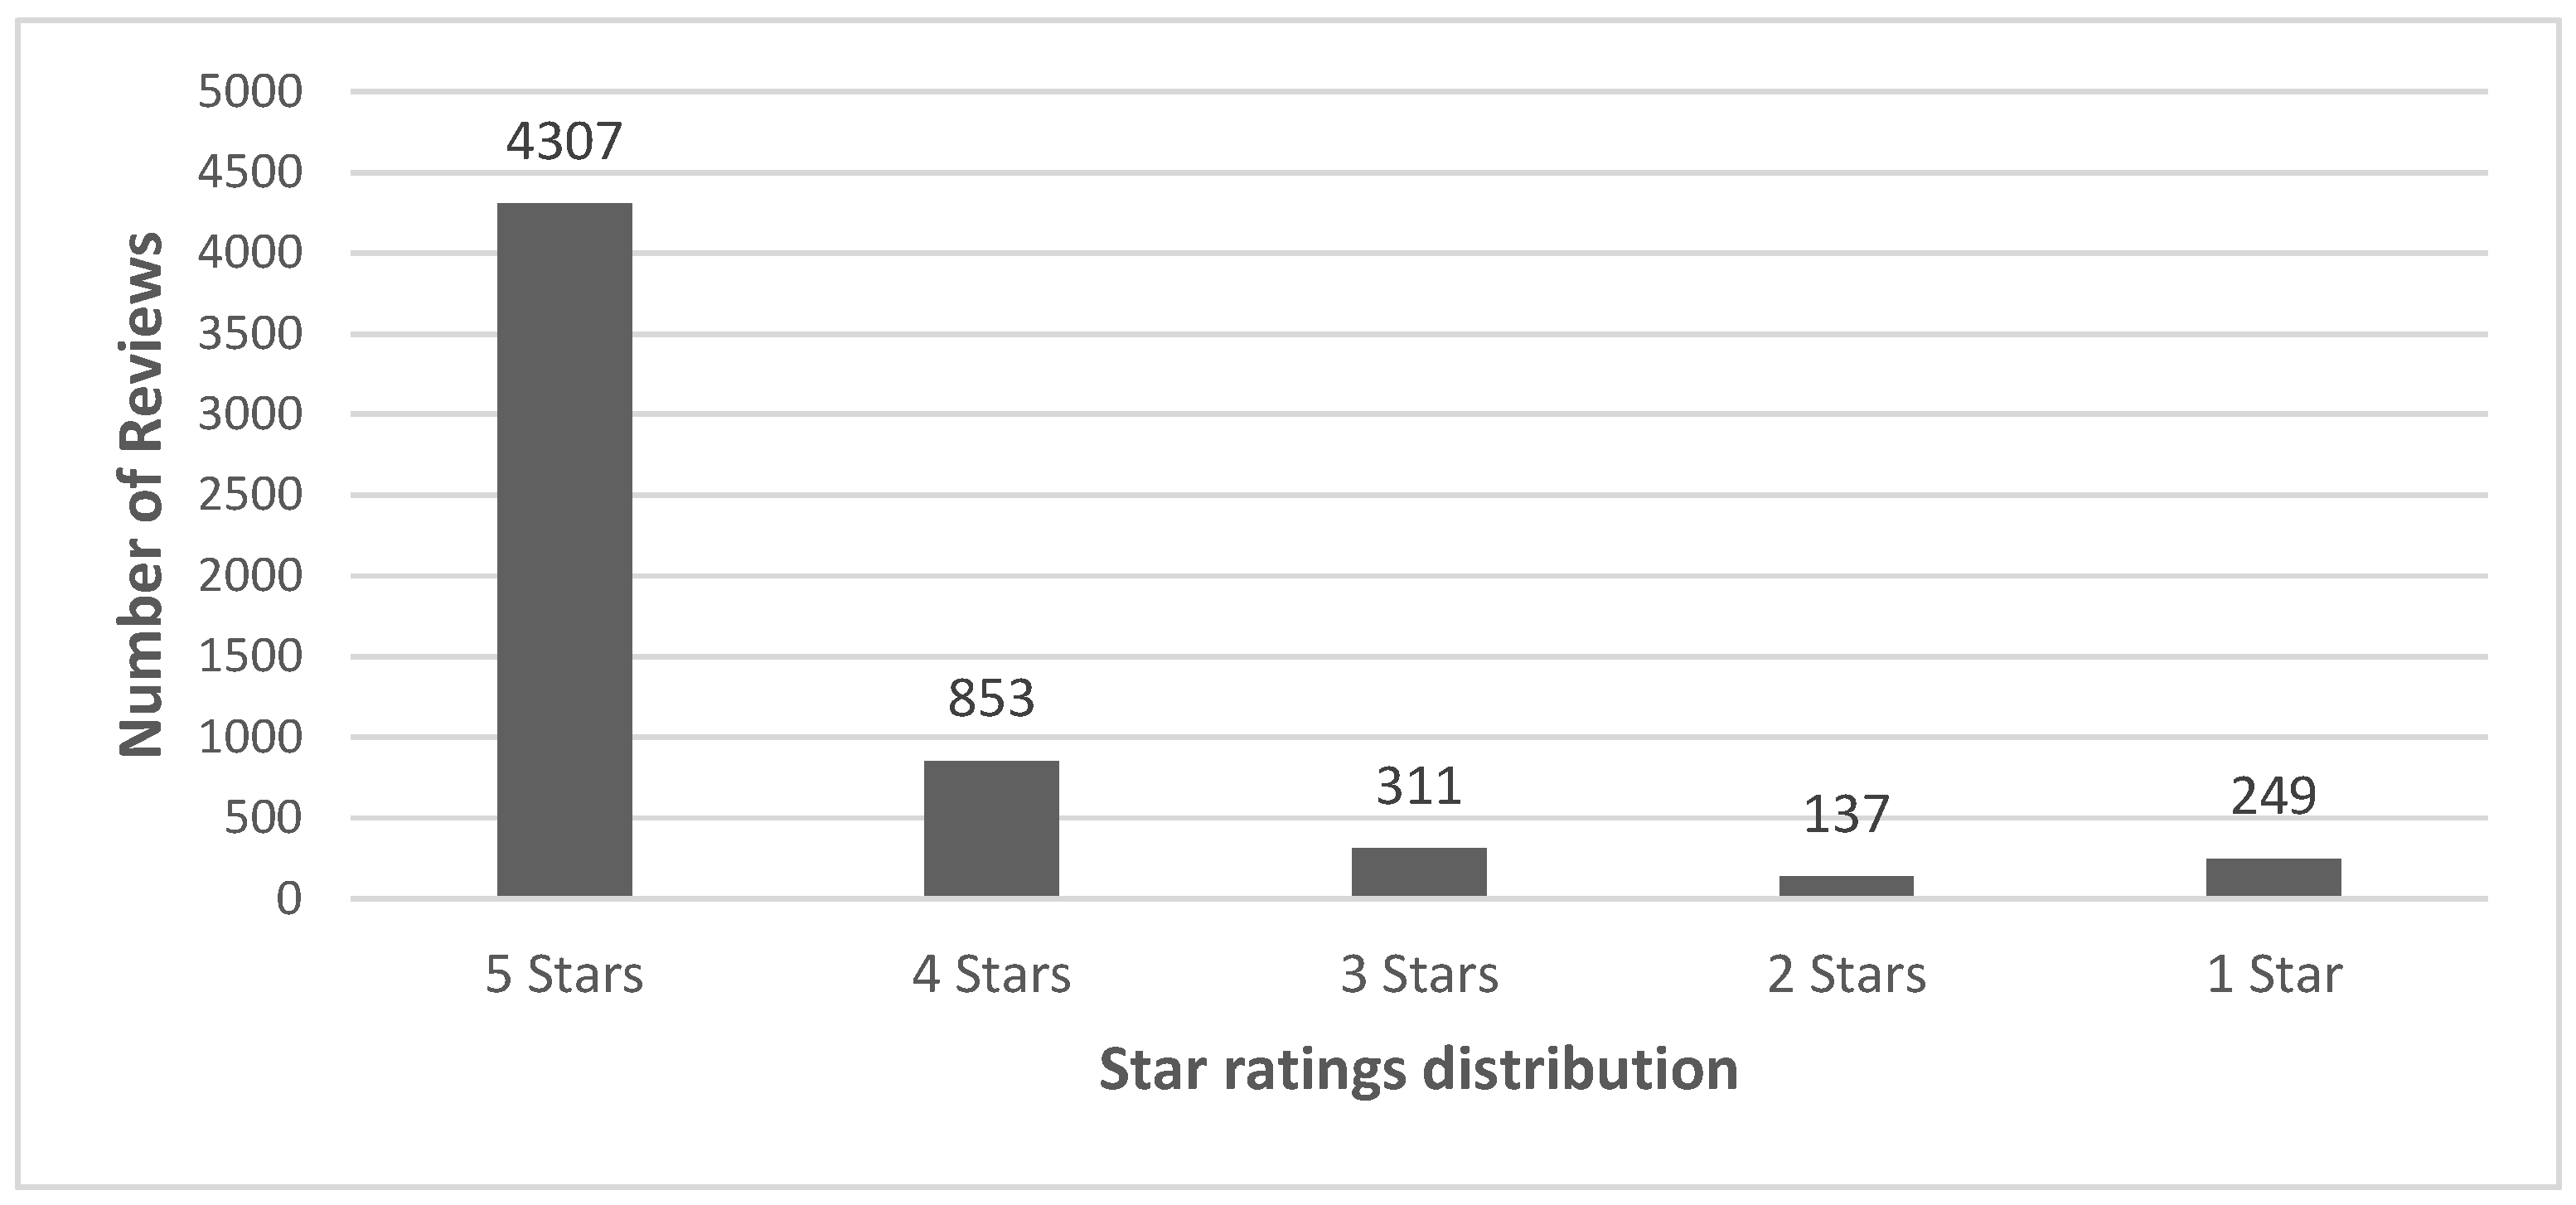
Regarding the distribution of Google reviews (Figure 2), it reveals a clear preference for excellence: 4307 five-star ratings (approximately 70%), 853 four-star ratings (14%), and 311 three-star ratings (5%). In contrast, there are only 137 two-star ratings (2%) and 249 one-star ratings (4%). This trend indicates that most visitors view the museum experience as exceptional. However, the notably higher count of one-star feedback, nearly double that of two-star ratings, highlights specific operational or interpretive shortcomings that require immediate attention.
To address these results in a practical context, museum managers should formalize and replicate the practices that contribute to five-star satisfaction, such as effective exhibit curation, engaging staff interactions, and smooth visitor flow, while systematically reviewing one-star and two-star comments to identify and resolve recurrent issues like inadequate signage or service delays.
Understanding the language distribution of the reviews is also crucial in drawing meaningful conclusions from this dataset. Of the 5856 total reviews, 2776 were originally written in English, while 3080 were in other languages.
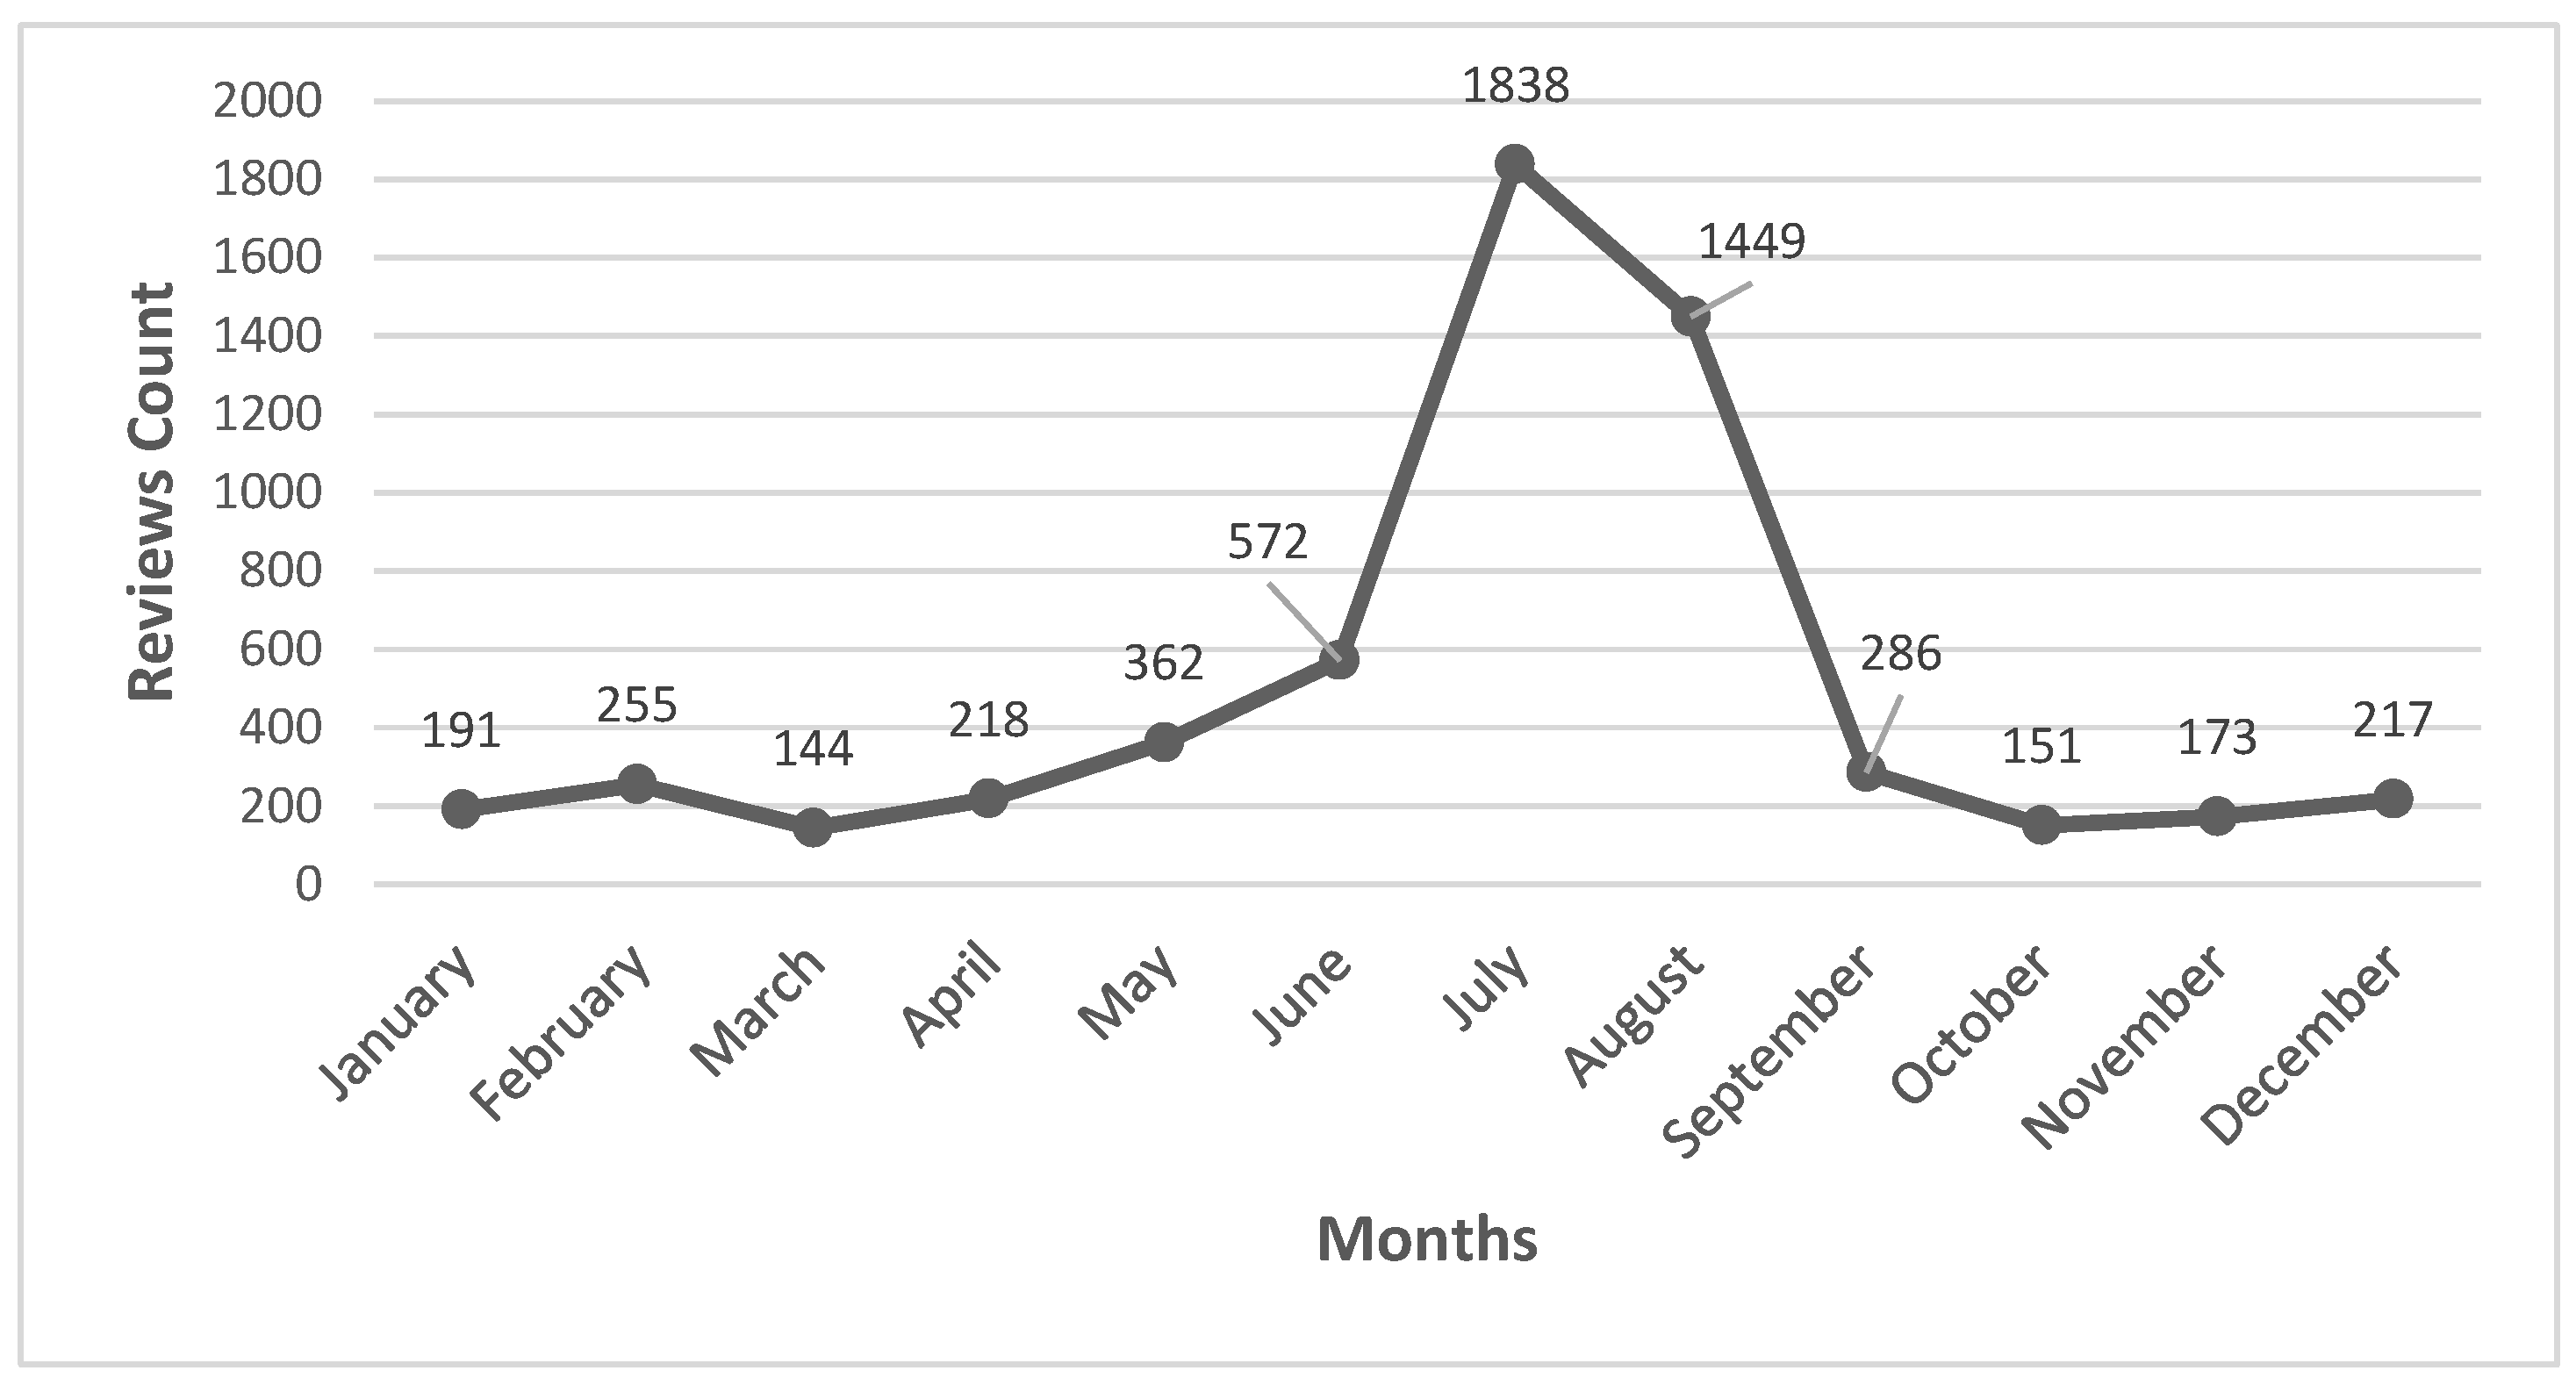
In terms of review volume over time (Figure 3), the data reveals a distinct seasonal pattern. From January to June, the average number of reviews remains below 600 per month. However, the number of reviews peaks in July (1838) and August (1449) before dropping back to under 300 from September onward.
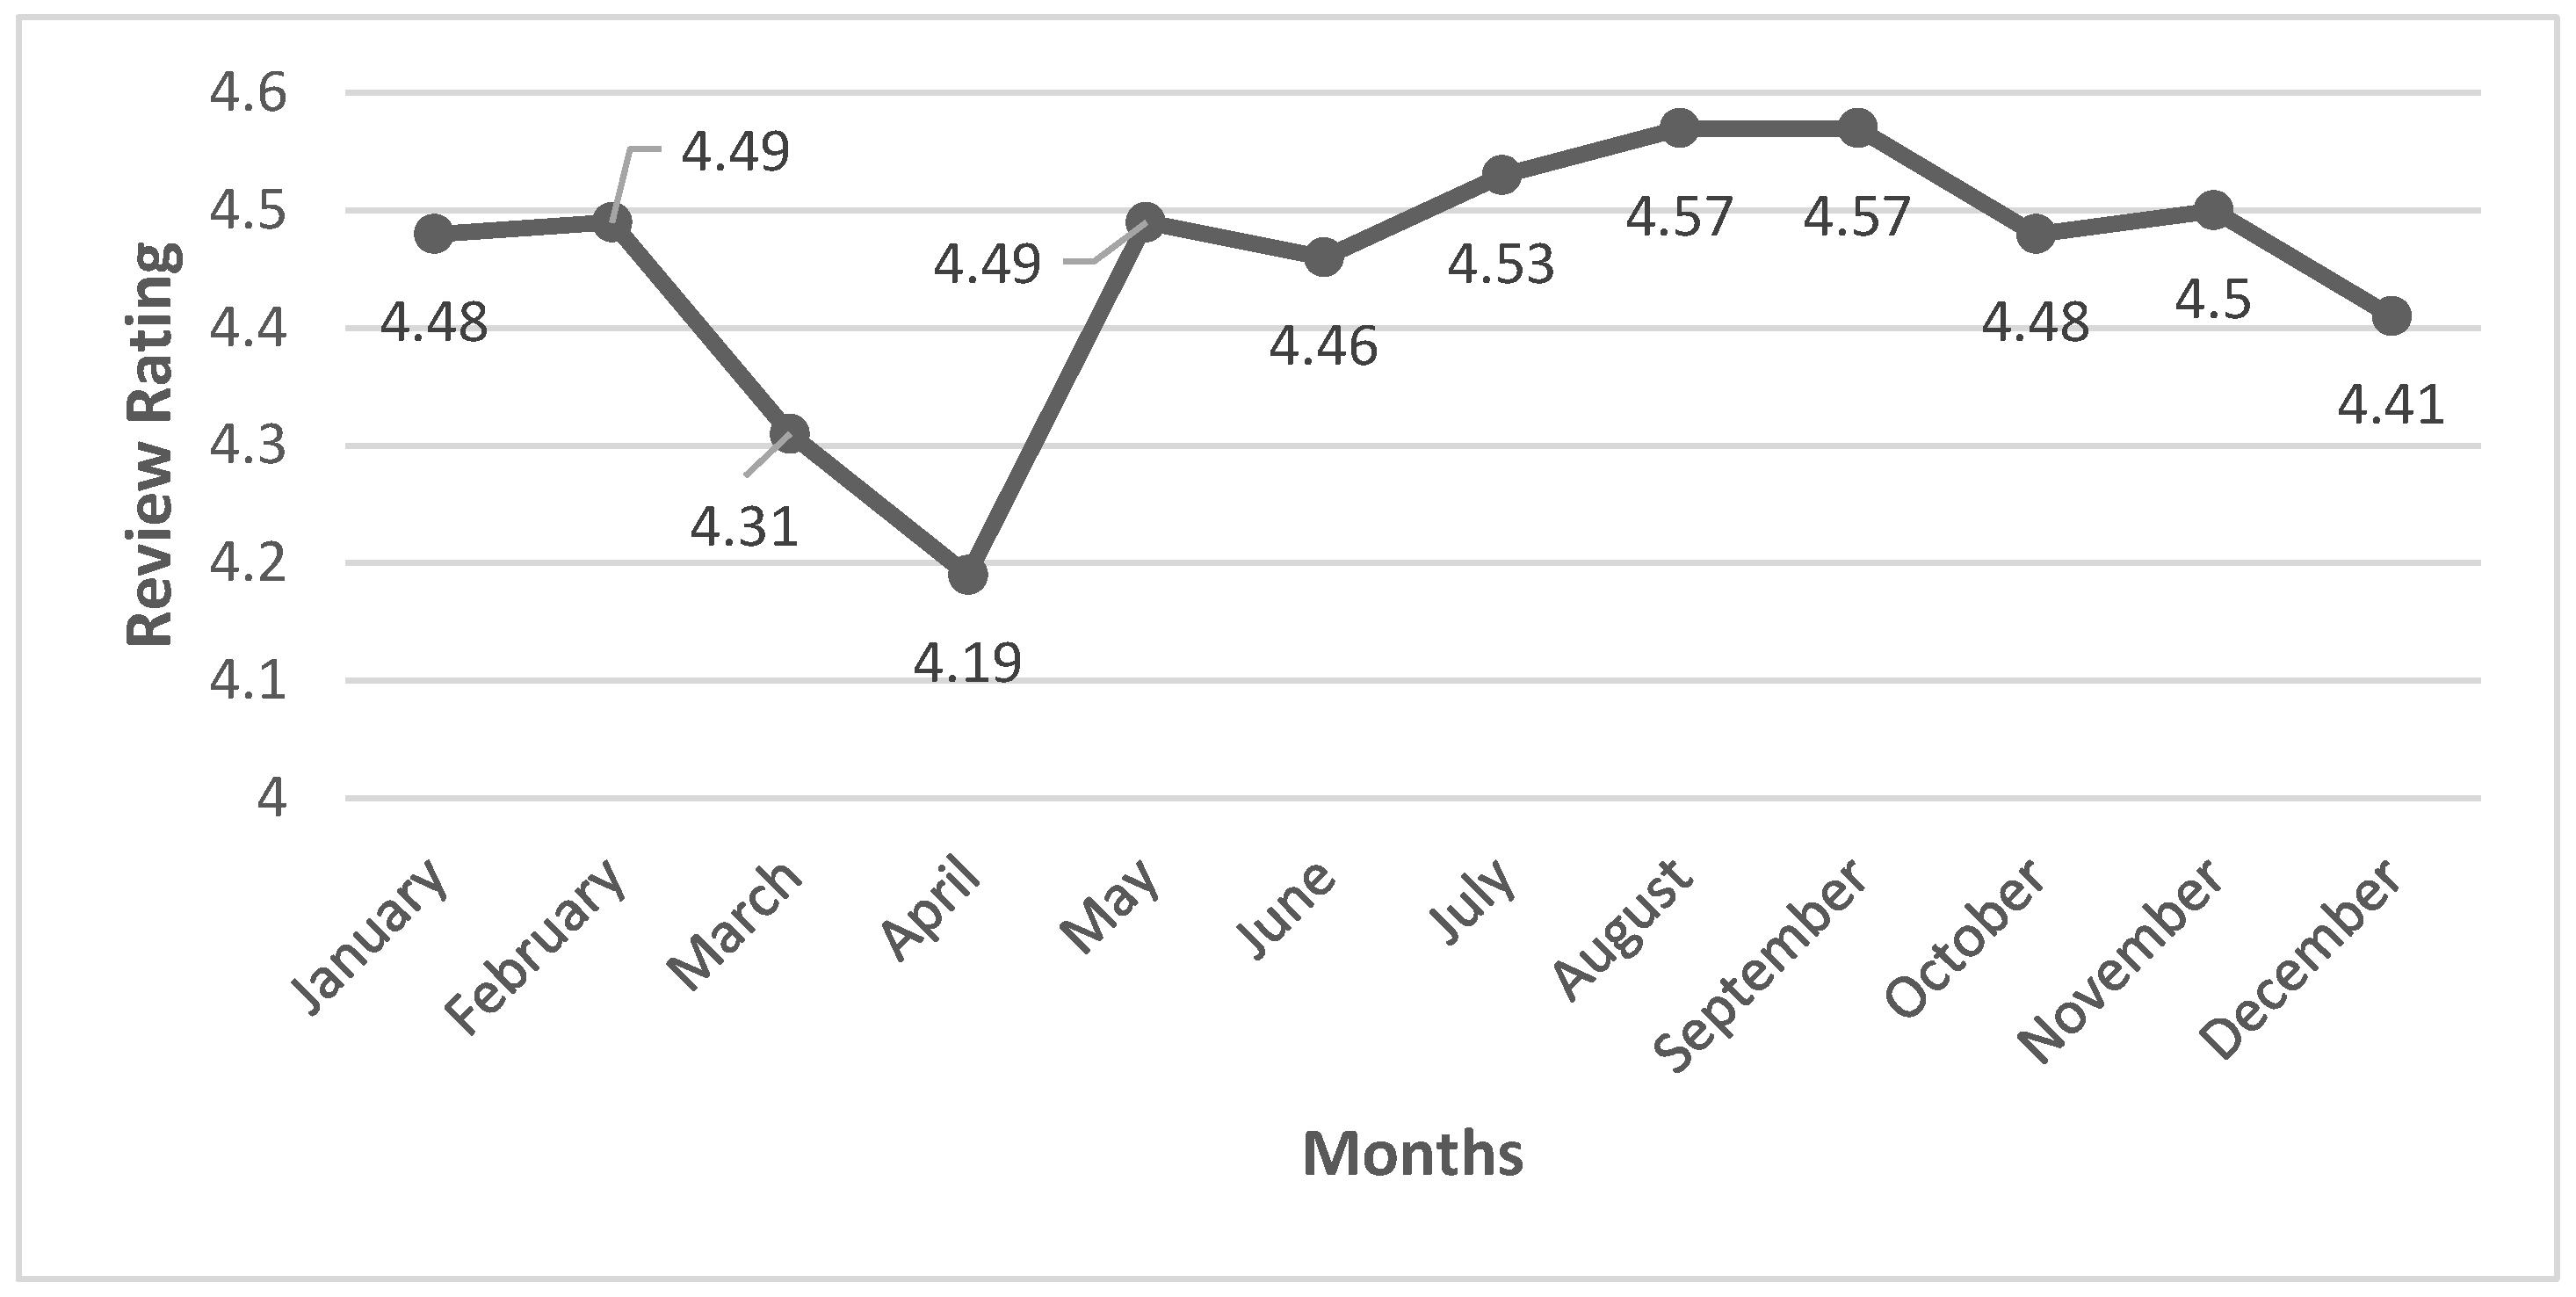
Average star ratings also vary throughout the year, reaching a low of 4.19 in April and peaking at 4.57 in August and September while consistently staying above 4.4 across all months (Figure 4).
For museum managers, these insights are crucial for adequate staffing and resource allocation during peak periods. Moreover, ongoing monitoring of rating fluctuations can help identify underperforming months and establish best practices that enhance visitor satisfaction.

4.2. Descriptive Statistics Results

To begin with, Table 6 presents the initial diagnostic phase, where specific quantitative metrics are analyzed using descriptive statistics. The sample of visitor reviews exhibits considerable variability and asymmetry across all four evaluated metrics. The review length, measured in the number of characters, demonstrates a median of 91 and a mean of 168.4, accompanied by a notably significant standard deviation of 240.1 and a positive skewness of 4.364. This indicates that, while most reviews are comparatively brief, a minority of exceptionally lengthy comments exert a rightward influence on the distribution (range: 1–3401 characters).
Sentiment scores present a median of 0.637 and a mean of 0.555, with moderate dispersion (SD = 0.387) and a negative skewness of −1.320, reflecting a propensity towards positive sentiment values (range: −0.977 to 0.999). Star ratings are predominantly clustered at the higher end of the scale, exhibiting a median of 5.0, a mean of 4.508, a standard deviation of 1.003, and a skewness of −2.297 (range: 1–5). In contrast, the “review likes” metric appears exceedingly sparse, with a median of 0, a mean of 0.231, a standard deviation of 1.528, and an extreme skewness of 18.172 (range: 0–52). This distribution suggests that most reviews garner no likes, with only a small number receiving substantial peer endorsements. Tests of normality further corroborate the non-Gaussian nature of these metrics. The Shapiro–Wilk W statistics for character count (W = 0.599), sentiment score (W = 0.867), and star rating (W = 0.551) yielded p-values of less than 0.001, thus rejecting normality for each metric. Furthermore, the “review likes” assessment via the Shapiro–Wilk test was not feasible due to a predominance of identical values (Not a Number—NaN); however, its extreme skewness clearly signifies a deviation from a normal distribution.
At this stage of diagnostic analysis, the insights derived furnish museum managers with a robust empirical foundation, clarifying which feedback channels, such as detailed comments versus straightforward star ratings, provide richer information and identifying which metrics require non-parametric analytical approaches [24]. Equipped with this understanding, managers are empowered to optimize their data collection and analysis strategies—such as encouraging more detailed reviews or prioritizing sentiment analysis—thereby extracting actionable insights that enhance exhibition planning and visitor engagement initiatives [34,35].

4.3. Sentiment Analysis Results

The scatter plot in Figure 5 illustrates individual sentiment scores (top), revealing a dense concentration of highly positive reviews in the upper half of the y-axis, with scores ranging from 0.500 to 0.999. Neutral reviews are clustered around the 0.0 mark, forming a narrower horizontal band in the center.
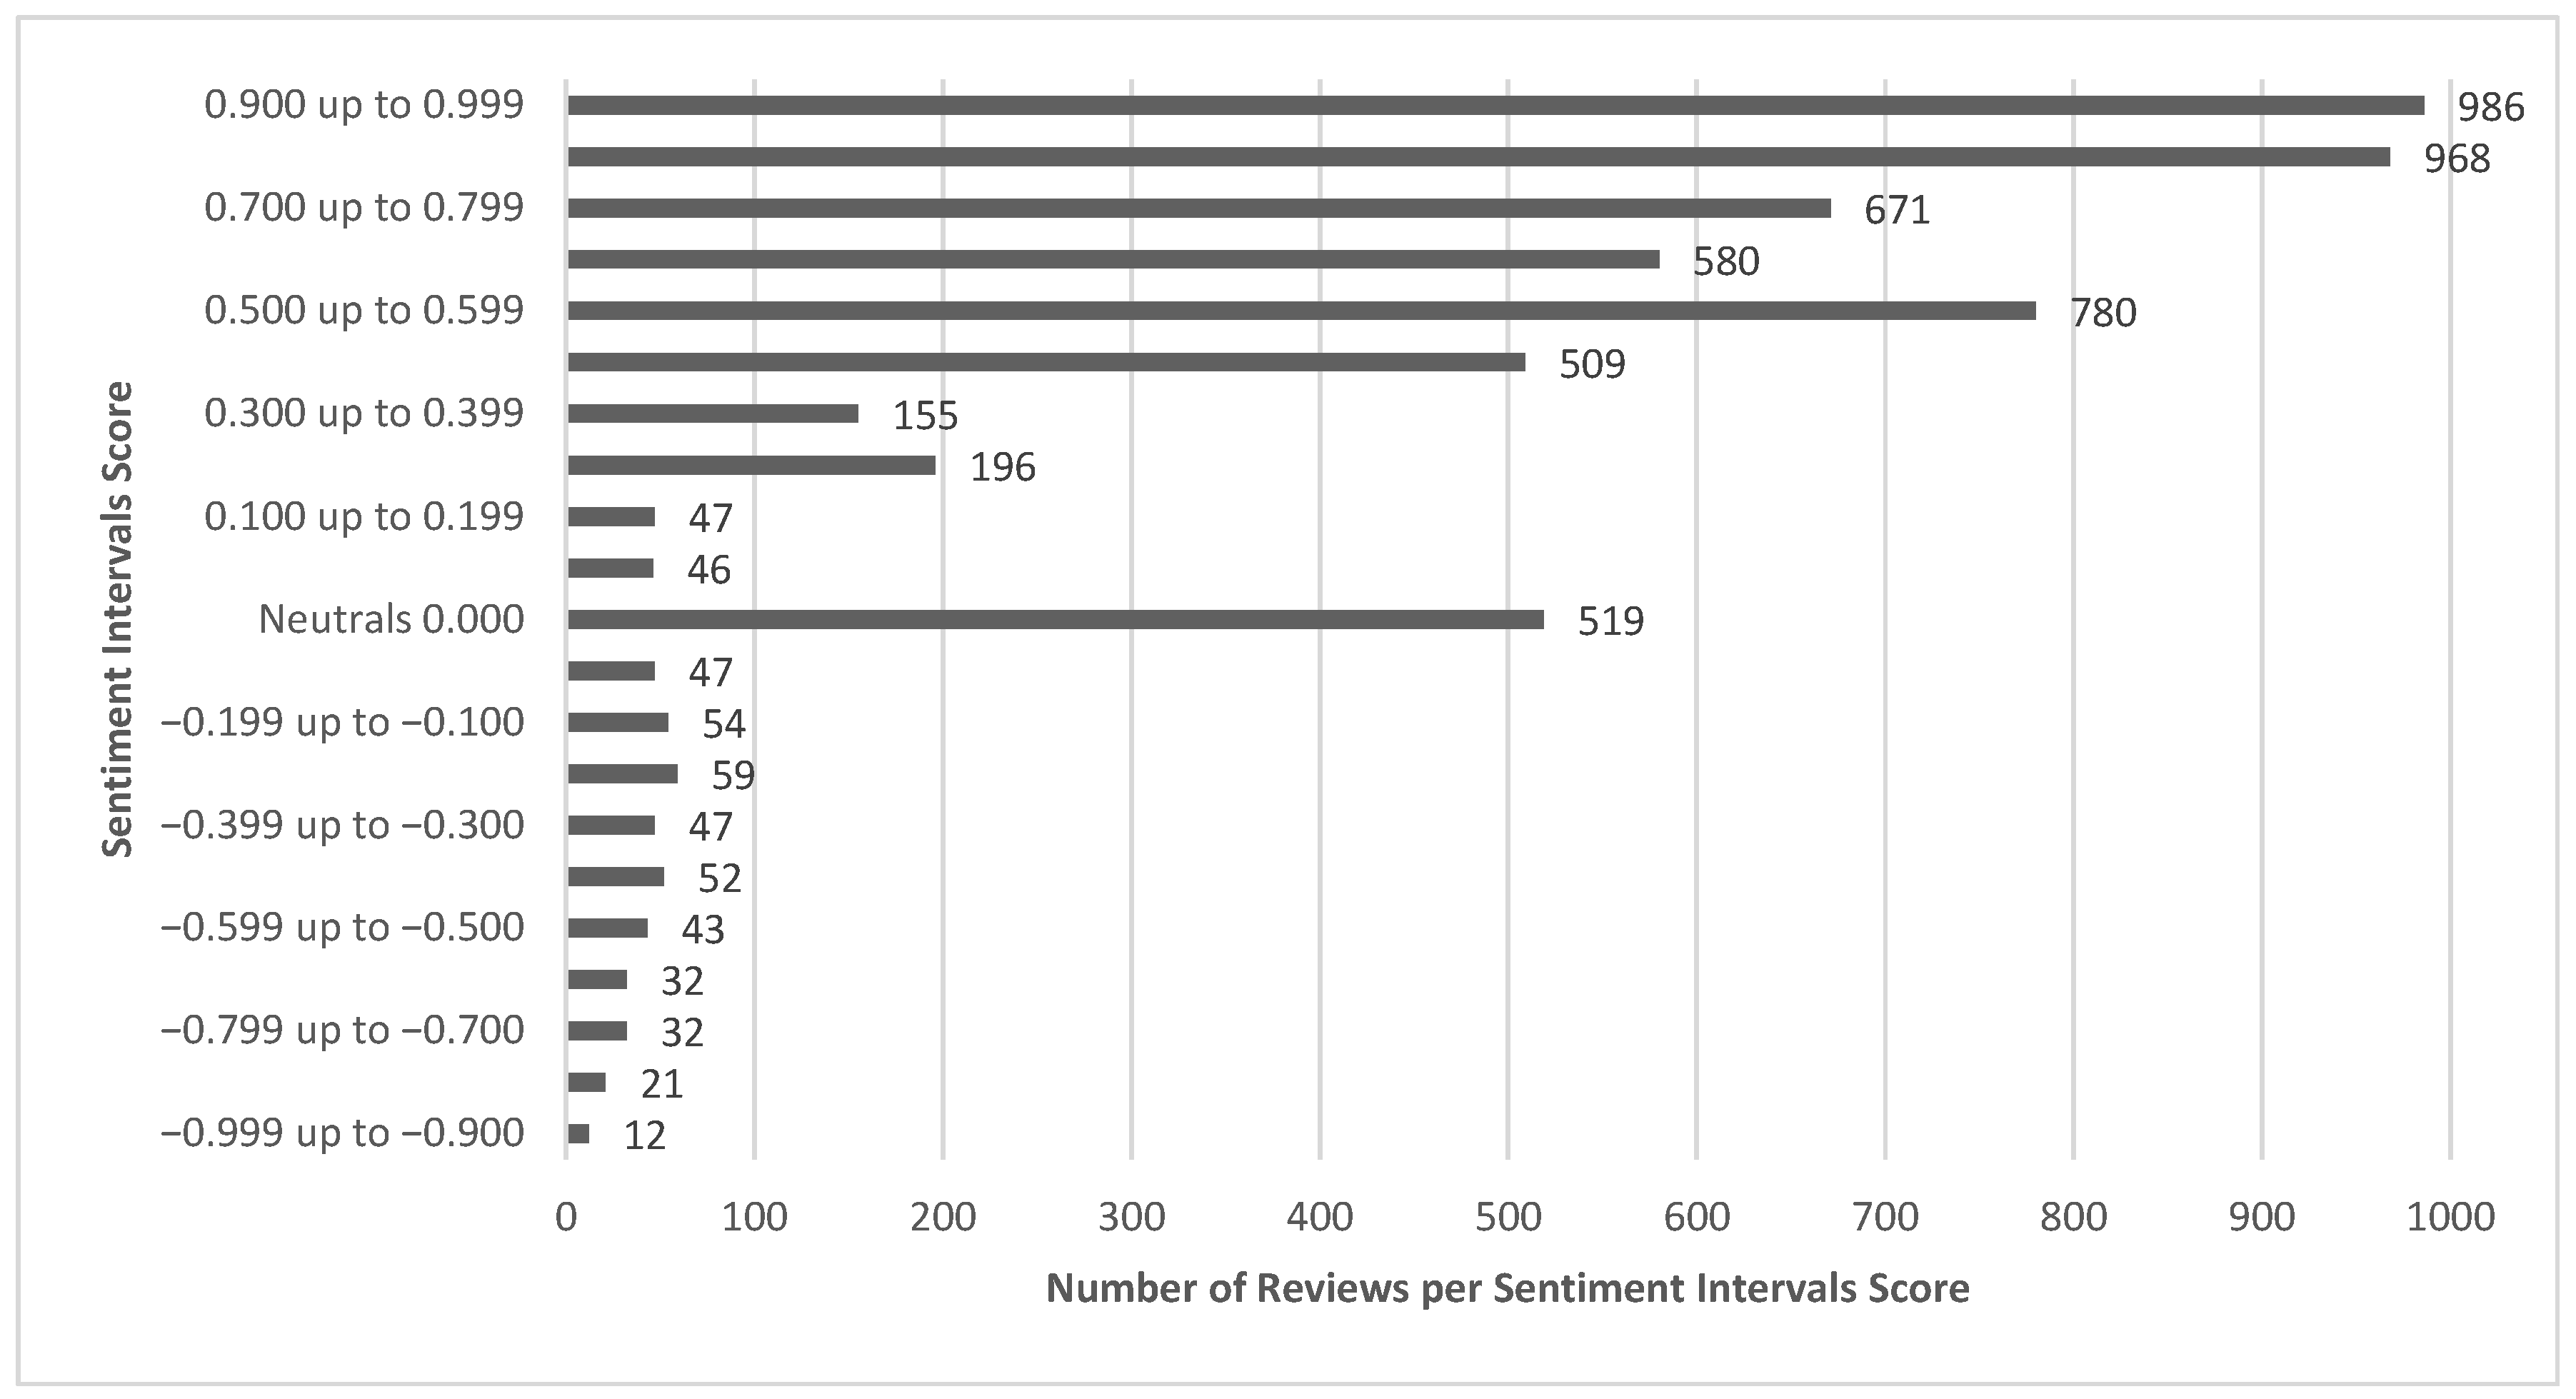
In contrast, negative reviews are more dispersed below, with only a handful reaching the extreme negative end of the spectrum (−0.999). No discernible trend is evident throughout the sequence of reviews; positive and negative comments are intermingled. Nonetheless, overwhelmingly positive language dominates. This visualization underscores that while some critical feedback exists, it remains relatively rare and scattered among a substantial number of enthusiastic appraisals. The horizontal bar chart (Figure 6) organizes the same VADER sentiment scores into 21 intervals, revealing that nearly two-thirds of all reviews fall into the two highest positive intervals (0.900–0.999 and 0.700–0.799, comprising 986 and 968 reviews, respectively).
The subsequent two positive intervals (0.500–0.599 and 0.300–0.399) collectively represent an additional 1289 reviews, further emphasizing the overall predominance of positive sentiment. Neutral reviews, scoring exactly 0.000, total 519, while genuinely negative reviews are relatively scarce, only 47 to 59 reviews appear in each of the four mild-negative intervals (−0.100 to −0.399), with very few in the more extreme negative categories. Based on the VADER model’s polarity scoring and aggregation, both the scatter and binned bar charts confirm that visitors’ sentiment is predominantly positive, with over one-third of reviews scoring above 0.7, with very few dipping into the negative territory. For museum managers, these insights suggest that while star ratings already reflect high satisfaction, encouraging guests to provide more detailed narrative feedback can uncover subtle areas for critique and facilitate targeted improvements without diverting resources from the overwhelmingly positive sentiment expressed.

4.4. Correlations Results

This section examines the inter-relationships among critical visitor feedback metrics, explicitly focusing on review length, sentiment score, review rating, and review likes. Table 7 presents Spearman’s ρ for all pairwise associations among the four visitor-feedback metrics.
A strong correlation is observed between review length and sentiment score (ρ = 0.450, p < 0.001), indicating that longer reviews tend to convey stronger positive or negative sentiment. Additionally, a moderate positive correlation exists between sentiment score and review rating (ρ = 0.272, p < 0.001), suggesting that reviews characterized by a more favorable linguistic tone generally receive higher star ratings. Although the correlations involving sentiment score are weaker, they remain statistically significant, including a slightly positive association with review likes (ρ = 0.040, p = 0.002).
In contrast, review rating exhibits a small negative correlation with both review length (ρ = −0.147, p < 0.001) and review likes (ρ = −0.110, p < 0.001). This indicates that shorter, highly positive reviews (i.e., high-rating) may attract fewer likes, possibly due to the limited detail in brief “5-star” comments, which may not engage other visitors. Conversely, longer or more nuanced reviews, regardless of being critical, can garner more peer endorsements.
Collectively, these findings emphasize the importance of looking beyond mere star ratings to gain insight into museum visitor engagement; both review length and linguistic sentiment provide unique information about how reviews resonate with the museum audience. From a practical point of view, prior studies suggest that museum managers might consider encouraging and incentivizing visitors to provide more detailed, sentiment-rich reviews by prompting them with targeted questions or offering small rewards [36,37]. This approach can help generate feedback that yields more profound insights and fosters greater peer engagement with the museum audience.

4.5. Topic Modeling Results

This section provides a comprehensive analysis of museum visitor feedback, utilizing guided topic modeling, sentiment analysis, and evaluation of star ratings. The authors aim to elucidate overarching patterns in visitor experiences, emotional responses, and satisfaction levels by systematically categorizing the reviews into 12 distinct thematic dimensions. This methodological approach facilitates a deeper understanding of the topics influencing visitor perceptions and engagement with museum exhibits. To begin with, in the following table (Table 8), the assigned topics, their description, and the top keywords included in each one are presented after the LDA implementation.
Moreover, as illustrated in Figure 7, the distribution of visitor reviews across the 12 designated topic categories reveals notable variability in the aspects of the museum experience that resonate with or concern visitors the most. The topics that emerged most frequently include Contemplation & Crowding (1154 reviews), Visitor Experience & Impressions (1085 reviews), and Servicescape & Ambience (996 reviews). These findings suggest that the environmental and emotional dimensions of the museum visit, such as atmosphere, crowd levels, and overall impressions, play a significant role in shaping visitor narratives. Conversely, categories like Purposiveness & Strategy (133 reviews) and Responsiveness & Staff (182 reviews) are less represented, indicating that visitors may not prioritize comments on the institution’s mission or their interactions with staff as frequently in their unsolicited feedback.
For museum professionals, these insights provide a data-informed approach to prioritize improvement initiatives and communication strategies. By acknowledging that visitors are susceptible to the physical comfort, crowding, and the immersive qualities of the space, managers can implement targeted interventions, such as enhancing layout flow or adjusting ticketing policies during peak times, to elevate perceived quality [38]. Moreover, the limited focus on strategic or institutional narratives in visitor feedback presents a valuable opportunity: museums could enhance their communication of mission and values throughout the physical and digital visitor journey to foster deeper engagement and loyalty.
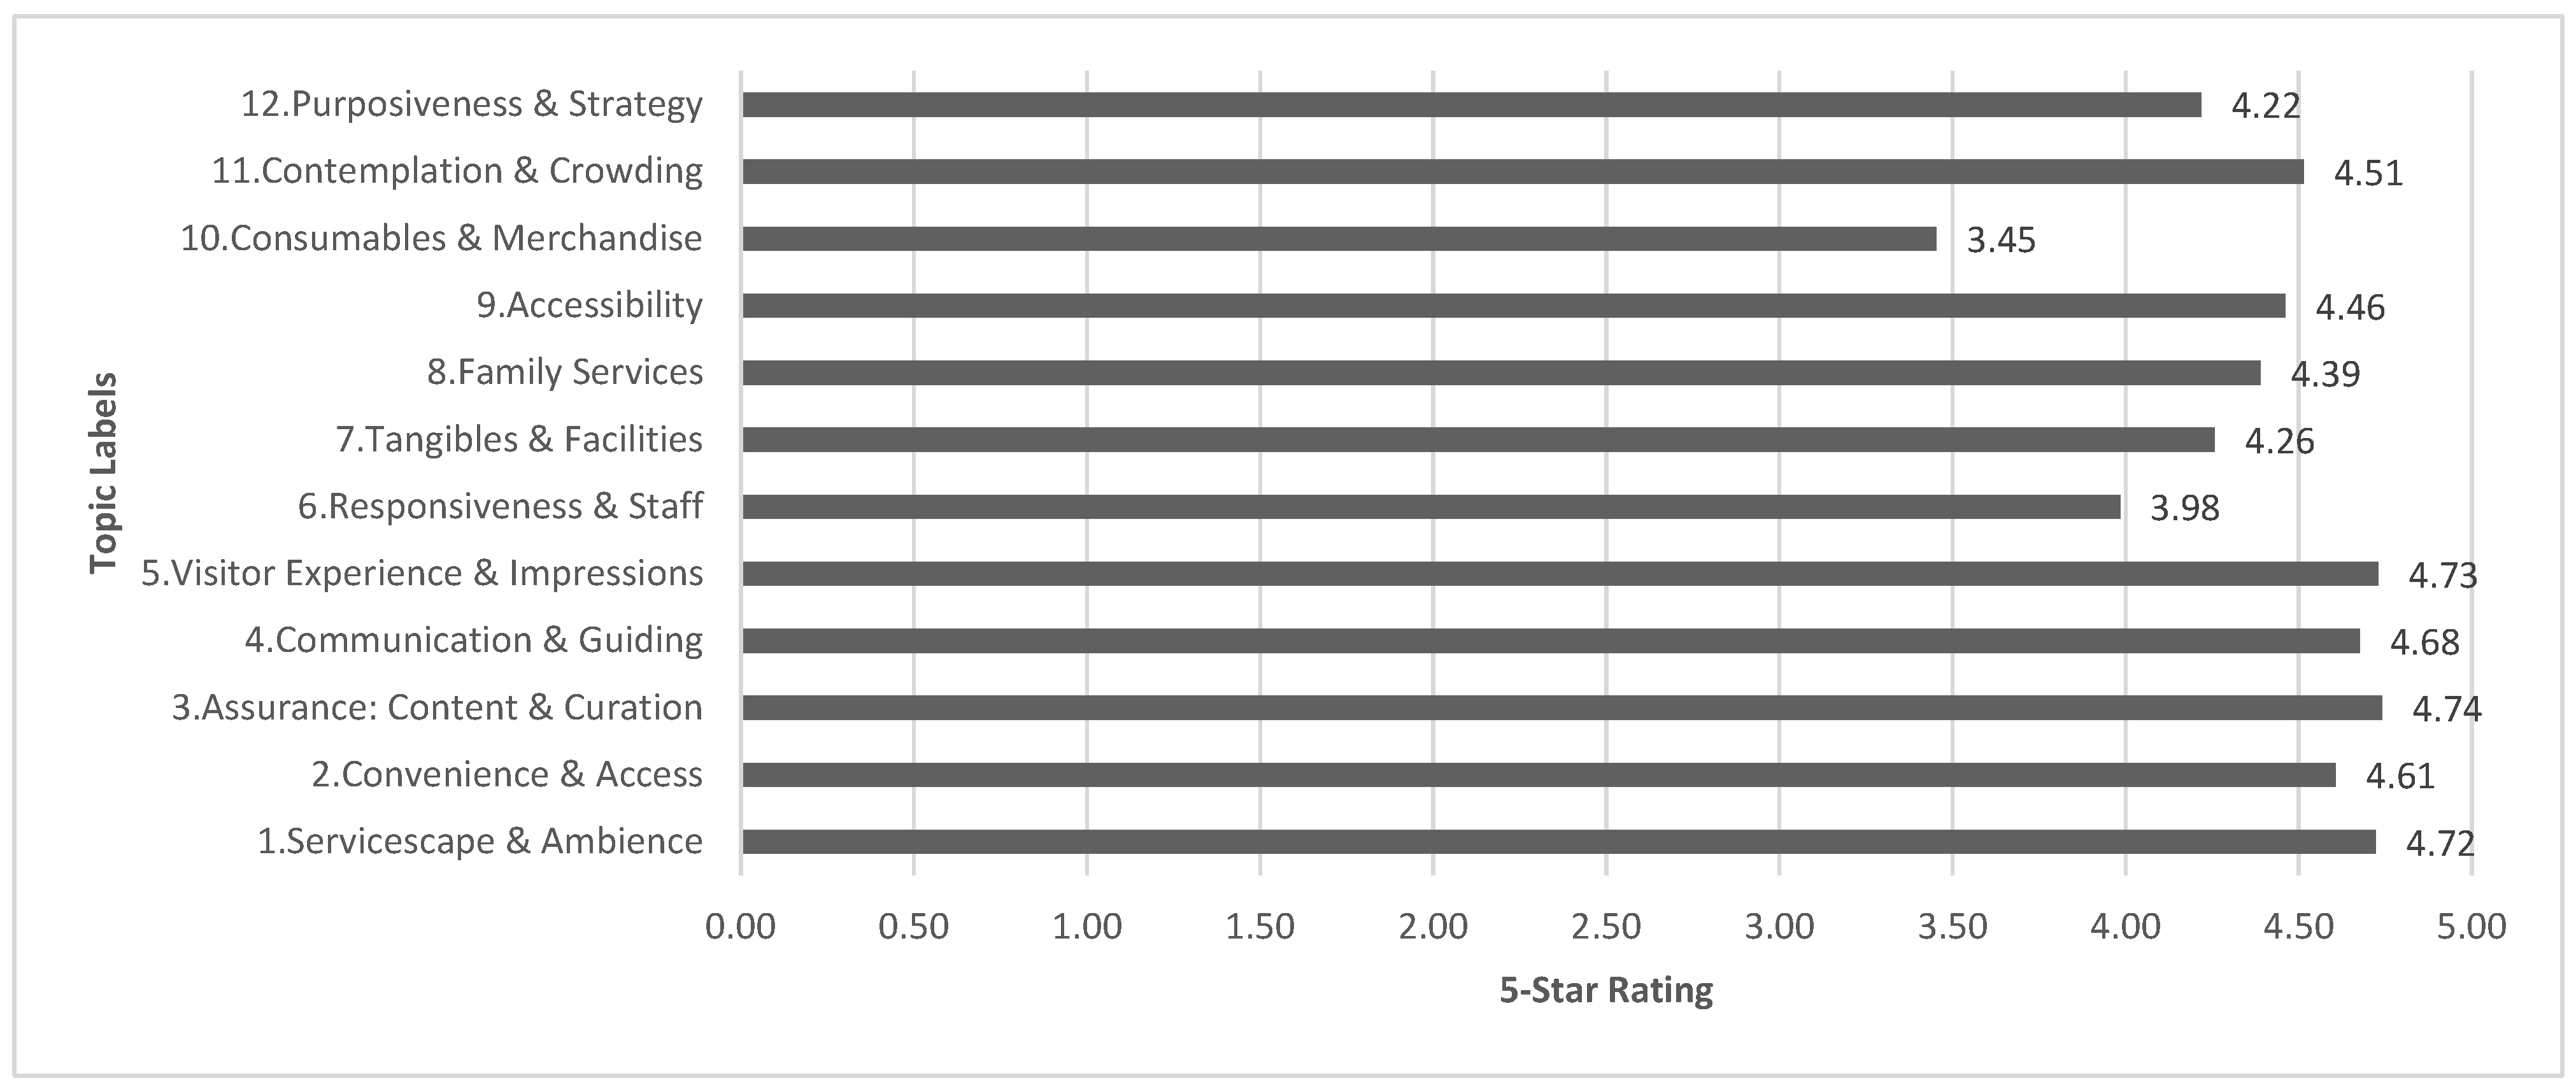
Furthermore, the average 5-star ratings assigned to visitor reviews across various topic categories reveal significant variations in perceived satisfaction (Figure 8). Reviews classified under Assurance: Content & Curation (4.74), Visitor Experience & Impressions (4.73), and Servicescape & Ambience (4.72) received the highest ratings, highlighting the important roles of exhibition quality, emotional connection, and environmental atmosphere in fostering highly positive visitor assessments.
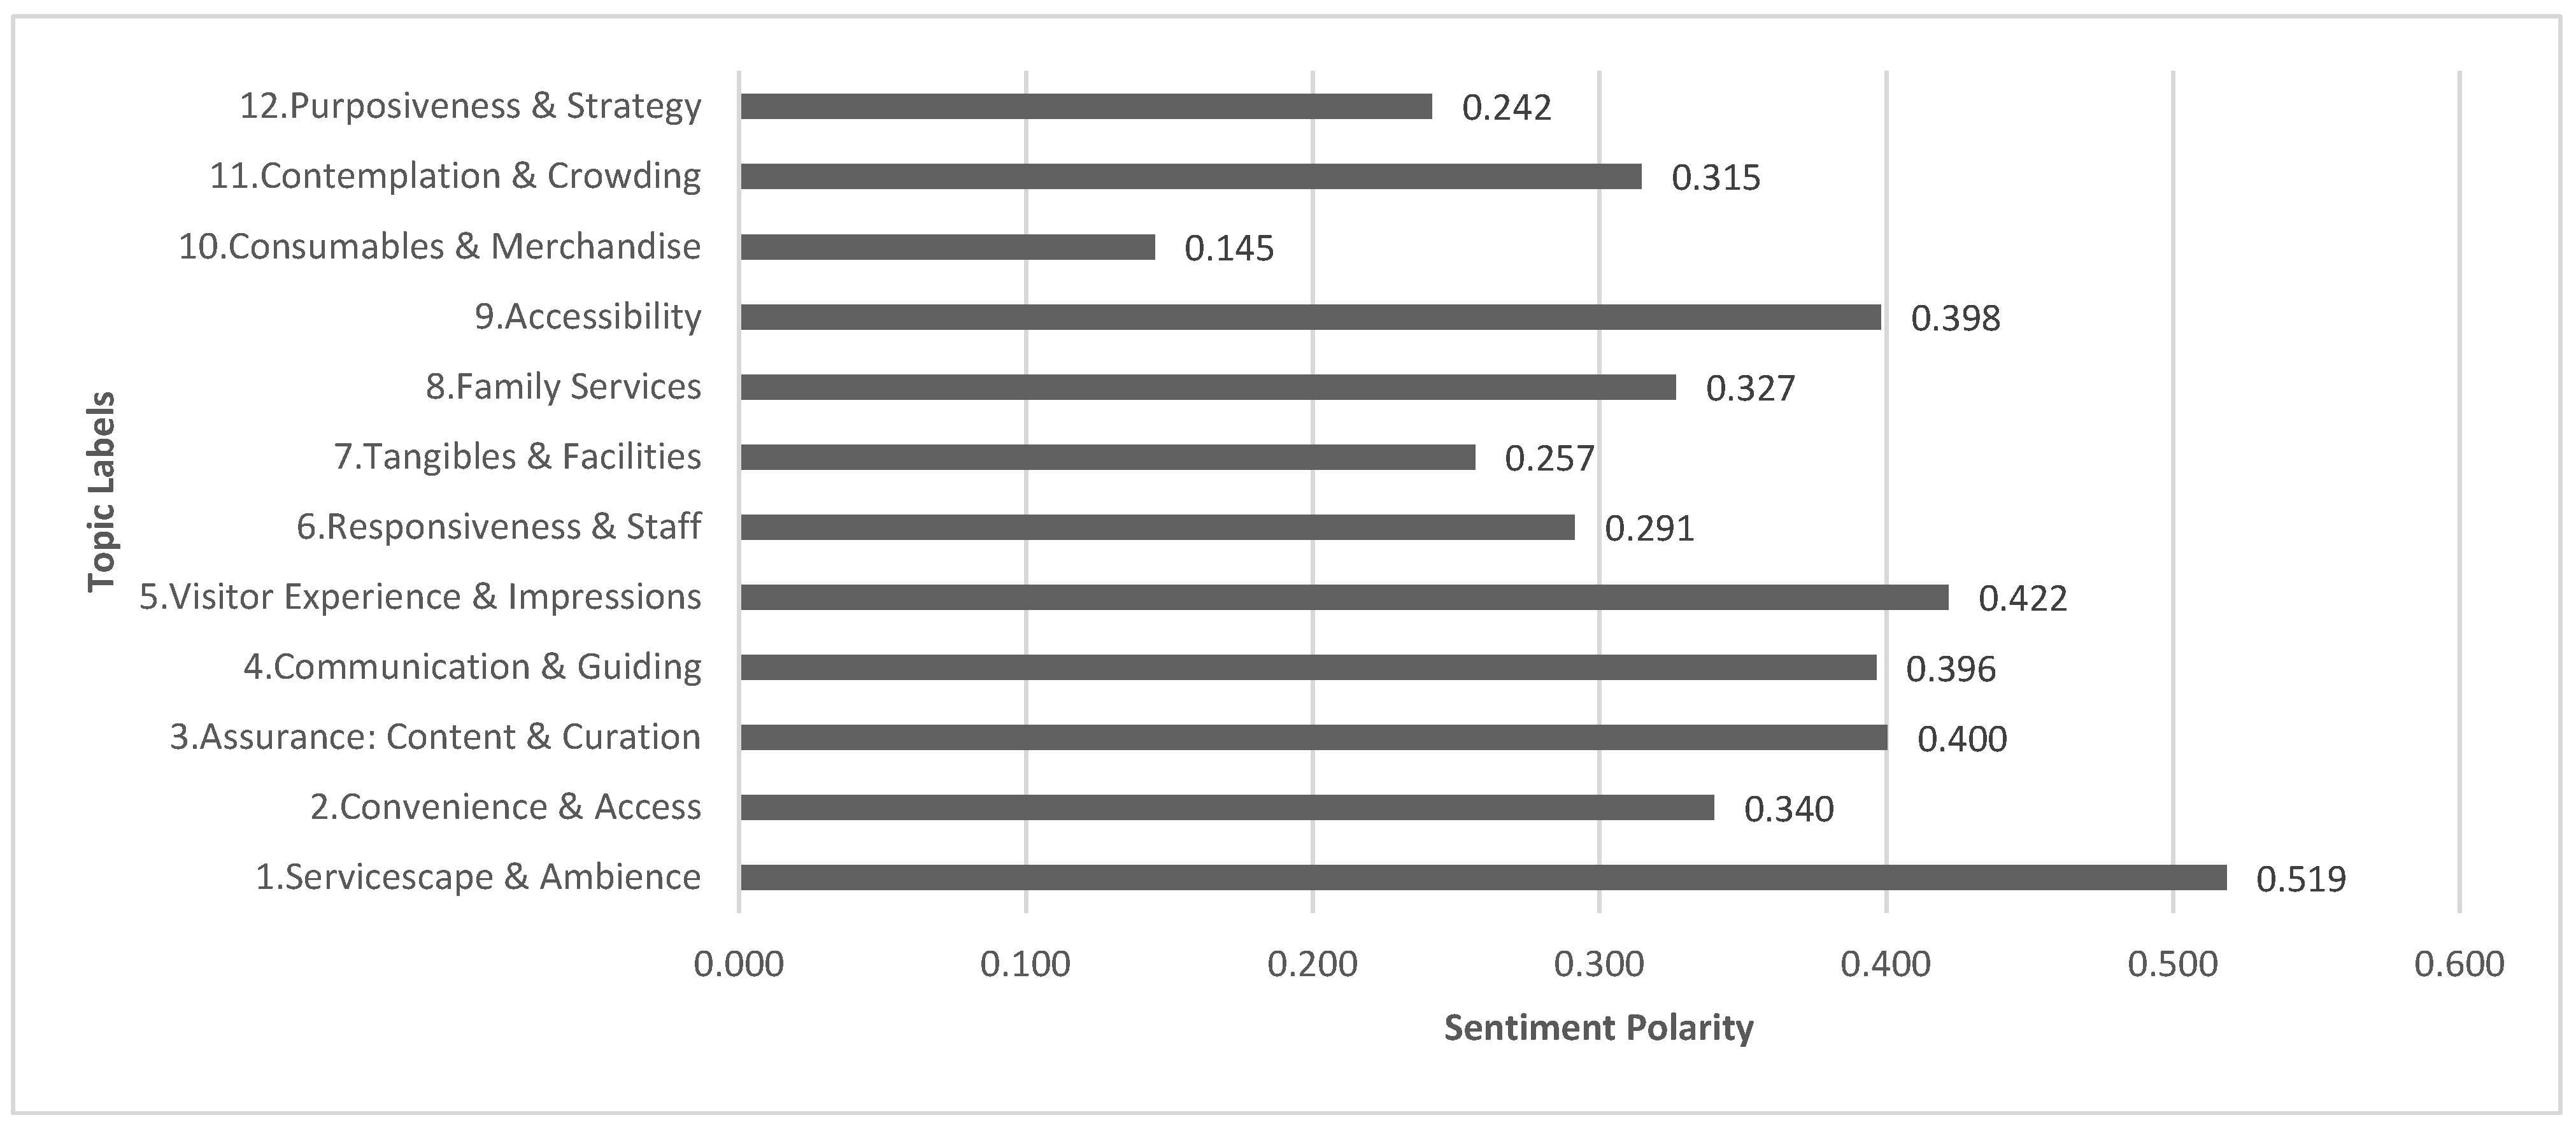
In contrast, Consumables & Merchandise displays a markedly lower average rating (3.45), indicating persistent visitor dissatisfaction with aspects such as food services and retail offerings. Therefore, while ongoing investment in collection curation and the enhancement of emotional and spatial visitor experiences remains essential, there is a clear opportunity to reassess and upgrade food, beverage, and retail services, areas that, while secondary, significantly contribute to the overall visitor experience. By strengthening these peripheral touchpoints, museums could transform previously lacking features of a visit into complementary sources of visitor delight and additional revenue [39]. Lastly, sentiment polarity scores across various topic categories reveal significant differences in the emotional tone of visitor feedback (Figure 9).
The reviews with the most positive sentiment are linked to Servicescape & Ambience (0.519), Visitor Experience & Impressions (0.422), and Assurance: Content & Curation (0.400). These findings suggest that immersive environments, emotional resonance, and high-quality curation elicit favorable expressions from visitors. In contrast, categories such as Consumables & Retail (0.145), Purposiveness & Strategy (0.242), and Contemplation & Crowding (0.315) demonstrate lower sentiment scores, indicating that visitor experiences in these areas are often more critical or emotionally neutral. From a practical perspective, for museum managers, tracking sentiment polarity offers a deeper understanding of visitor perceptions beyond simple star ratings. Recognizing which topics elicit emotionally rich feedback can inform communication strategies and help prioritize resource allocation [40]. By improving emotionally weaker areas, such as dining experiences or space management, museums can enhance overall visitor satisfaction and foster positive word-of-mouth, ultimately bolstering the institution’s reputation.

5. Discussion

5.1. Major Findings

The primary objective of this study was to conduct a rigorous and contemporary analysis of visitor experiences by utilizing a substantial corpus of Google reviews. We employed a multi-faceted methodological framework that integrates descriptive statistics, sentiment analysis, correlation analysis, and guided LDA topic modeling; the investigation successfully delineated key patterns in visitor feedback across 59 museums and galleries of global significance.
The 12 topic categories identified offer a solid empirical foundation for interpreting the museum visitor experience in line with well-established service quality frameworks, such as SERVQUAL [41,42] and the extended 7Ps of services marketing [43]. Key themes like Visitor Experience & Impressions, Contemplation & Crowding, and Servicescape & Ambience reflect the increasing importance of experiential elements and emotional engagement in shaping the museum visit. These align with the empathy, responsiveness, and tangibles dimensions of SERVQUAL, as well as the ‘Physical Evidence’, ‘Process’, and ‘People’ components of the 7Ps framework, demonstrating the central role of spatial and affective design in shaping visitor satisfaction.
On the other hand, categories such as Assurance: Content & Curation are strongly linked to the museum’s institutional credibility, the quality of its collections, and its interpretive strategies, elements that correspond to the assurance and reliability dimensions of service quality. This theme also resonates with broader conversations in contemporary museum studies, where the balance between institutional authority and visitor agency is a recurring point of discussion [44]. The high sentiment polarity and star ratings associated with this category reinforce the importance of curatorial excellence in driving visitor satisfaction.
Furthermore, the distinction between Accessibility and Retail & Consumables underlines the different strategic roles operational services play in enhancing the visitor experience. Accessibility serves as a fundamental, baseline expectation, rooted in inclusion and equity, addressing core process quality needs. In contrast, Consumables & Merchandise represents peripheral yet value-enhancing services, linked to the ‘Product’, ‘Place’, and ‘Promotion’ aspects of the 7Ps framework. These elements contribute to the broader visitor journey by supporting value co-creation [45].
This study combines classic service quality frameworks with new ideas in cultural services to create a clear framework for museums and galleries. It helps museums focus on areas for improvement based on visitor feedback and find a balance between providing basic services and offering richer, more engaging experiences that are important in today’s cultural settings.

5.2. Theoretical Contribution

This study advances the understanding of museum visitor feedback in several ways. First, it addresses the issue of temporal relevance, using a 2024 dataset to reflect current visitor behaviors, unlike previous studies that relied on outdated data [5]. Therefore, this work establishes a novel empirical framework for evaluating the longstanding validity of theoretical models posited in previous research. Second, by including reviews from 59 museums across 19 countries, this research offers broader insights into visitor needs across different cultural contexts, unlike past studies limited to specific regions.
Third, a key contribution of this research is its emphasis on multilingualism. Previous studies often focused only on English or local-language reviews, excluding non-translated texts from the analysis [4]. In contrast, this study translates over 3000 non-English reviews, ensuring a broader and more varied representation of visitor viewpoints. This inclusion of multilingual feedback ensures that the perspectives of global audiences, who often constitute the majority in high-traffic institutions, are meaningfully represented [42]. In this respect, the current effort demonstrates a more rigorous and representative basis for the advancement of museum visitor studies theory within a global framework.
Fourth, the study refines thematic classifications using guided LDA modeling, identifying emerging topics like Purposiveness & Strategy and Family Services, which were not consistently highlighted in prior research. This contributes to the development of computational museology [44,46] while enhancing scholarly discussion regarding the categorization and comprehension of user-generated content as being of paramount importance in the evolving landscape of digital transformation within cultural heritage literature. It enriches the ongoing scholarly discussion about how best to categorize and understand user-generated content within cultural heritage contexts.
Lastly, from a methodological perspective, this study integrates quantitative and qualitative techniques, combining numerical indicators (such as character count, star ratings, and sentiment polarity) with topic modeling. This dual-framework approach bridges the gap between content richness and statistical rigor, allowing for a more holistic interpretation of the museum visitor experience. In this way, this integration sets a methodological precedent for developing a more comprehensive theoretical framework concerning the visitor experience in the field of cultural heritage analytics.

5.3. Practical Contribution

From a practical perspective, the findings of this study provide valuable guidance for museum managers, marketing and communications professionals, and IT personnel focused on improving digital engagement and service delivery. Identifying underperforming areas, such as Consumables & Merchandise and Accessibility, provides clear starting points for service improvements. Managers can use these insights to guide decisions on service quality, retail layout design, and investments in inclusive infrastructure, such as elevators and multilingual signage. Additionally, the observed correlation between sentiment strength and review length suggests that more detailed reviews offer deeper insights into visitor satisfaction and dissatisfaction. Museums should consider encouraging longer, more descriptive reviews by prompting visitors with open-ended questions or offering incentives to encourage such feedback. The previous literature suggests that text-based feedback tends to be more diagnostic and actionable compared to simple numerical ratings [47].
Furthermore, applying guided topic modeling equips museum professionals with an adaptable framework for the ongoing analysis of visitor feedback. IT staff can integrate this methodology within digital review monitoring systems, utilizing tools such as Gensim in subsequent iterations to continuously assess emergent concerns or trends. This aligns with prior perspectives, highlighting a broader movement among cultural institutions towards data-driven decision-making, particularly in the contexts of strategic planning, digital communication, and exhibit development [39,48].
Moreover, this study emphasizes the importance of internal cross-departmental collaboration within museums. By organizing visitor feedback into distinct topic categories and correlating these with measurable sentiment and satisfaction indicators, museum teams can coordinate actions more effectively across various departments. For instance, insights derived from reviews categorized under Responsiveness & Staff can inform human resources and training protocols. At the same time, findings related to Communication & Guiding may be utilized by interpretation and education teams to enhance signage or tour content. This structured, data-informed approach transforms anecdotal feedback into a shared institutional resource, fostering a culture of evidence-based planning and ensuring operational improvements align with genuine visitor concerns.
This effort also plays a significant role in enhancing CHI professionals’ digital literacy and analytical skills by clarifying the application of advanced text analytics techniques within a practical, domain-specific framework. By guiding readers through a comprehensive pipeline, from data scraping and text pre-processing to sentiment scoring and topic modeling, the study familiarizes museum managers with a variety of tools and methodologies (such as VADER and Gensim) that can be effectively utilized with limited technical assistance. This kind of exposure not only deepens their understanding of key metrics, like sentiment polarity, review length distributions, and topic prevalence, but also illustrates how these metrics can be strategically applied to inform decision-making. In doing so, the study cultivates a more data-informed management culture within such organizations and strengthens the connection between cultural practices and computational analysis [49,50].
Finally, its replicability and adaptability underscore the study’s practical relevance. Museums of varying sizes and resource levels can implement similar methodologies using publicly available tools and platforms. The topic modeling structure and seed word guidance presented herein can be customized to align with different institutional missions or visitor profiles, thereby rendering the approach both scalable and adaptable to diverse contexts.

5.4. Limitations and Future Steps

The study outlines a step-by-step methodological pipeline that requires multidisciplinary collaboration among museum staff to achieve optimal widespread implementation. The proposed workflow, encompassing data scraping, pre-processing, advanced modeling, and interpretive labeling, represents a significant integration of technical and curatorial expertise. However, it also highlights the considerable efforts necessary to orchestrate collaboration among professionals from diverse domains, including information technology, data science, and museology. Coordinating such interdisciplinary collaboration is inherently complex and demanding, yet it is vital for advancing meaningful digital tools within the cultural sector. In this respect, this study elucidates both the potential and the challenges associated with interdisciplinary endeavors, articulating how the convergence of the humanities and computer science can inform institutional strategies, all while necessitating sustained commitment and mutual understanding among stakeholders.
One limitation of the deployed sentiment analysis is that the VADER model, although well-suited for short texts, may struggle with irony and more nuanced or mixed sentiments [51]. For future research, it would be beneficial to extend this analysis by incorporating more advanced methodologies, such as emotional analysis. This approach would go beyond categorizing feedback only as positive, negative, or neutral, allowing for the identification of specific emotions such as anger, joy, or sadness within visitor comments, providing a more detailed understanding of museum visitors’ feedback. Another limitation relates to the reliance on LDA, which, while effective, assumes that topics are static and based solely on a bag-of-words model. Future research could explore more advanced topic modeling techniques, such as BERTopic, which integrates transformer-based embeddings with clustering algorithms. This approach could provide greater contextual sensitivity and more nuanced topic differentiation [49,52]. A comparative analysis of LDA and BERTopic applied to the same dataset might further bolster the robustness and interpretability of visitor feedback analysis. In this context, a key limitation is also the lack of external validation for the derived topic categories. The authors plan to tackle this as the next research work by applying the methodology in real museum scenarios, where external experts will be engaged to validate the proposed topic categorization.
Lastly, in terms of study limitations, the authors acknowledge that there is a lack of direct engagement with marketing theories, both classic and contemporary, which could provide valuable insights into visitor behavior, engagement strategies, and the impact of museum feedback. While this study focuses primarily on data-driven approaches to visitor analysis, integrating concepts from marketing theory, such as customer experience management, brand loyalty, and experiential marketing, could offer a deeper understanding of the motivations behind visitor reviews and engagement. Classic marketing theories, like the 7Ps, and more recent frameworks, like relationship marketing and customer journey mapping, might further contextualize the findings and improve strategic decision-making within museums. The authors’ next research step is to explore how such marketing models could complement text data analytics in providing a more holistic view of visitors’ experiences and preferences, enhancing both theoretical development and practical applications not only in museums and galleries, but also in closely related organizations such as libraries and archives.
In conclusion, the authors believe that this study contributes to a growing body of work that merges computational methods with humanistic insights to enhance understanding and responsiveness to visitor needs. By establishing a scalable, interpretable, and multilingual analytical framework, the study empowers museums globally to skillfully leverage the strategic potential of their digital feedback ecosystems, while also contributing to ongoing theoretical discussions within the cultural sector.

Author Contributions

Conceptualization, I.C.D., E.V. and N.L.; methodology, I.C.D., E.V. and N.L.; validation, I.C.D., E.V. and N.L.; formal analysis, I.C.D., E.V. and N.L.; investigation, I.C.D., E.V. and N.L.; data curation, I.C.D., E.V. and N.L.; writing—original draft preparation, I.C.D., E.V. and N.L.; writing—review and editing, I.C.D., E.V. and N.L.; visualization, I.C.D., E.V. and N.L.; supervision, E.V.; project administration, I.C.D., E.V. and N.L. All authors have read and agreed to the published version of the manuscript.

Funding

This research received no external funding.

Data Availability Statement

Data are openly available in a public repository. The data that support the findings of this study are openly available in Zenodo at https://doi.org/10.5281/zenodo.16752356. For the sake of blind peer review, the uploaded dataset is anonymized.

Acknowledgments

During the preparation of this work, the authors utilized Grammarly generative AI functionality to proofread the manuscript for improved readability, sentence consistency, proper wording, and native English language correctness. The authors have reviewed and edited the output and take full responsibility for the content of this publication.

Conflicts of Interest

The authors declare no conflicts of interest.

Appendix A. Overview of Museum Cases

Table A1. Details of the museums included in the study, including their name, country, address, and the number of reviews collected per museum.
CasesMuseum NameCountryAddressNumber of Reviews per Museum
1Acropolis MuseumGreeceDionysiou Areopagitou 15, 11742 Athens84
2Art Gallery of New South WalesAustraliaArt Gallery Road, The Domain Sydney NSW 200093
3Art Gallery of South AustraliaAustraliaNorth Terrace, Adelaide, SA 5000110
4Crystal Bridges Museum of American ArtUnited States600 Museum Way, Bentonville, AR 72712110
5Fondation Louis VuittonFrance8 Avenue du Mahatma Gandhi, 75116 Paris96
6Frederik Meijer Gardens & Sculpture ParkUnited States1000 East Beltline Avenue NE, Grand Rapids, MI 49525111
7Guggenheim Museum BilbaoSpainAv. Abandoibarra, 2, 48009 Bilbao76
8Gyeongju National MuseumRepublic of Korea186 Iljeong-ro, Inwang-dong, Gyeongju, Gyeongsangbuk-do93
9Hong Kong Museum of ArtHong Kong10 Salisbury Road, Tsim Sha Tsui, Hong Kong105
10Humboldt Forum im Berliner SchlossGermanySchloßpl. 1, 10178 Berlin125
11Kunsthistorisches Museum WienAustriaMaria-Theresien-Platz, 1010 Vienna101
12Los Angeles County Museum of ArtUnited States5905 Wilshire Blvd, Los Angeles, CA 9003693
13Louvre MuseumFranceRue de Rivoli, 75001 Paris87
14MMCA (National Museum of Modern and Contemporary Art) SeoulRepublic of Korea30 Samcheong-ro, Jongno-gu, Seoul 306296
15Moskovskiy Dom FotografiiRussiaOstozhenka Street, 16, Moscow, 11903484
16Mucem—Museum of Civilizations of Europe and the MediterraneanFrance7 promenade Robert Laffont, 13002 Marseille102
17Musée d’OrsayFranceEsplanade Valéry Giscard d’Estaing, 75007 Paris96
18Musée du quai Branly—Jacques ChiracFrance37 Quai Branly, 75007 Paris99
19Museo Nacional Centro de Arte Reina SofíaSpainCalle de Santa Isabel, 52, 28012 Madrid78
20Museo Nacional del PradoSpainC. de Ruiz de Alarcón, 23, 28014 Madrid87
21Museum of Fine Arts, BostonUnited States465 Huntington Avenue, Boston, MA 0211593
22National Gallery of ArtUnited StatesConstitution Avenue NW, Washington, D.C. 20565103
23National Gallery of AustraliaAustraliaParkes Place, Parkes, ACT 2600125
24National Gallery of VictoriaAustralia180 St Kilda Road, Melbourne, VIC 300698
25National Gallery SingaporeSingapore1 St Andrew’s Road, Singapore 178957103
26National Museum in KrakówPolandal. 3 Maja 1, 30-001 Kraków79
27National Museum of Korean Contemporary HistoryRepublic of Korea198 Sejong-daero, Jongno-gu, Seoul 0314196
28National Museum of ScotlandUnited KingdomChambers Street, Edinburgh EH1 1JF, UK106
29Petit PalaisFranceAvenue Winston-Churchill, 75008 Paris108
30Philadelphia Museum of ArtUnited States2600 Benjamin Franklin Parkway, Philadelphia, PA 1913089
31Queensland Art GalleryAustraliaStanley Pl, South Brisbane, QLD 4101120
32RijksmuseumNetherlandsMuseumstraat 1, 1071 XX Amsterdam101
33Royal Academy of ArtsUnited KingdomBurlington House, Piccadilly, London W1J 0BD116
34Shanghai MuseumChina201 Renmin Avenue, Huangpu District, Shanghai126
35Somerset HouseUnited KingdomStrand, London WC2R 1LA154
36State Hermitage MuseumRussiaPalace Square, 2, St. Petersburg, 190000147
37Tate ModernUnited KingdomBankside, London SE1 9TG159
38Tel Aviv Museum of ArtIsraelSderot Sha’ul HaMelech 27, Tel Aviv-Yafo, 6133201280
39The British MuseumUnited KingdomGreat Russell Street, London WC1B 3DG80
40The Centre PompidouFrancePlace Georges-Pompidou, 75004 Paris121
41The GettyUnited States1200 N Getty Center Dr, Los Angeles, CA 9004996
42The Metropolitan Museum of ArtUnited States1000 Fifth Avenue, New York, NY 1002893
43The Moscow KremlinRussiaMoscow Kremlin, Moscow, 10307373
44The Museum of Fine Arts, HoustonUnited States1001 Bissonnet Street, Houston, TX 7700578
45The Museum of Modern ArtUnited States11 West 53rd Street, New York, NY 1001975
46The National Art Center, TokyoJapan7-22-2 Roppongi, Minato-ku, Tokyo 106-855896
47The National Gallery of LondonUnited KingdomTrafalgar Square, London WC2N 5DN, United Kingdom96
48The Pushkin State Museum of Fine ArtsRussiaVolkhonka Street, 12, Moscow, 11901993
49The Royal Castle in WarsawPolandplac Zamkowy 4, 00-277 Warszawa66
50The State Russian Museum, Mikhailovsky PalaceRussiaInzhenernaya Street, 4, St Petersburg, 191186121
51The State Tretyakov GalleryRussiaLavrushinsky Ln, 10, Moscow, 11901795
52Thyssen-Bornemisza National MuseumSpainPaseo del Prado, 8, 28014 Madrid90
53Tokyo Metropolitan Art MuseumJapan8-36 Ueno-koen, Taito-ku, Tokyo97
54Tokyo National MuseumJapan13-9 Uenokoen, Taito City, Tokyo 110-8712106
55Triennale di MilanoItalyViale Emilio Alemagna, 6, 20121 Milano68
56Uffizi GalleriesItalyPiazzale degli Uffizi, 6, 50122 Florence107
57Vatican MuseumsVatican CityViale Vaticano, 00165 Vatican City88
58Victoria and Albert MuseumUnited KingdomCromwell Road, London SW7 2RL93
59Whitney Museum of American ArtUnited States99 Gansevoort Street, New York, NY 1001493

References

  1. Su, Y.; Teng, W. Contemplating Museums’ Service Failure: Extracting the Service Quality Dimensions of Museums from Negative on-Line Reviews. Tour. Manag. 2018, 69, 214–222. [Google Scholar] [CrossRef]
  2. Xu, Q.; Shih, J.-Y. Applying Text Mining Techniques for Sentiment Analysis of Museum Visitor Reviews. In Proceedings of the 2024 IEEE 4th International Conference on Electronic Communications, Internet of Things and Big Data (ICEIB), Taipei, Taiwan, 19–21 April 2024; pp. 270–274. [Google Scholar]
  3. Hua, L.; Wahid, W.A.; Ali, N.A.M.; Dong, J. Culture and Technology: Visitor Experiences at the Palace Museum and China Science Museum. Environ.-Behav. Proc. J. 2025, 10, 49–55. [Google Scholar] [CrossRef]
  4. Wan, Y.N.; Forey, G. Exploring Collective Identity and Community Connections: An Interpersonal Analysis of Online Visitor Reviews at the Overseas Chinese Museum (2012–2023). Forum Linguist. Stud. 2024, 6, 149–170. [Google Scholar] [CrossRef]
  5. Alexander, V.D.; Blank, G.; Hale, S.A. TripAdvisor Reviews of London Museums: A New Approach to Understanding Visitors. Mus. Int. 2018, 70, 154–165. [Google Scholar] [CrossRef]
  6. Richmond, F.; Uchechukwu, N.C.; Ramos, C.M.Q. Analyses of Visitors’ Experiences in Museums Based on E-Word of Mouth and Tripadvisors Online Reviews: The Case of Kwame Nkrumah Memorial Park, Ghana and the Nike Center for Art and Culture, Nigeria. In Advances in Marketing, Customer Relationship Management, and E-Services; Munna, A.S., Shaikh, M.S.I., Kazi, B.U., Eds.; IGI Global: Hershey, PA, USA, 2023; pp. 192–216. ISBN 978-1-6684-7735-9. [Google Scholar]
  7. Grande-Ramírez, J.R.; Roldán-Reyes, E.; Aguilar-Lasserre, A.A.; Juárez-Martínez, U. Integration of Sentiment Analysis of Social Media in the Strategic Planning Process to Generate the Balanced Scorecard. Appl. Sci. 2022, 12, 12307. [Google Scholar] [CrossRef]
  8. Nicola, S.; Schmitz, S. From Mining to Tourism: Assessing the Destination’s Image, as Revealed by Travel-Oriented Social Networks. Tour. Hosp. 2024, 5, 395–415. [Google Scholar] [CrossRef]
  9. Drivas, I.; Vraimaki, E. Evaluating and Enhancing Museum Websites: Unlocking Insights for Accessibility, Usability, SEO, and Speed. Metrics 2025, 2, 1. [Google Scholar] [CrossRef]
  10. Chauhan, U.; Shah, A. Topic Modeling Using Latent Dirichlet Allocation: A Survey. ACM Comput. Surv. 2022, 54, 1–35. [Google Scholar] [CrossRef]
  11. Agostino, D.; Brambilla, M.; Pavanetto, S.; Riva, P. The Contribution of Online Reviews for Quality Evaluation of Cultural Tourism Offers: The Experience of Italian Museums. Sustainability 2021, 13, 13340. [Google Scholar] [CrossRef]
  12. Cheshire, L.; da Silva, J.; Moller, L.E.; Palk, R. The 100 Most Popular Art Museums in the World—Blockbusters, Bots and Bounce-Backs. Available online: https://www.theartnewspaper.com/2024/03/26/the-100-most-popular-art-museums-in-the-world-2023 (accessed on 28 April 2025).
  13. Dhanalakshmi, P.; Kumar, G.A.; Satwik, B.S.; Sreeranga, K.; Sai, A.T.; Jashwanth, G. Sentiment Analysis Using VADER and Logistic Regression Techniques. In Proceedings of the 2023 International Conference on Intelligent Systems for Communication, IoT and Security (ICISCoIS), Coimbatore, India, 9–11 February 2023; pp. 139–144. [Google Scholar]
  14. Dao, T.A.; Aizawa, A. Evaluating the Effect of Letter Case on Named Entity Recognition Performance. In Natural Language Processing and Information Systems; Métais, E., Meziane, F., Sugumaran, V., Manning, W., Reiff-Marganiec, S., Eds.; Lecture Notes in Computer Science; Springer Nature: Cham, Switzerland, 2023; Volume 13913, pp. 588–598. ISBN 978-3-031-35319-2. [Google Scholar]
  15. Qais, E.; Veena, M.N. TxtPrePro: Text Data Preprocessing Using Streamlit Technique for Text Analytics Process. In Proceedings of the 2023 International Conference on Network, Multimedia and Information Technology (NMITCON), Bengaluru, India, 1–2 September 2023; pp. 1–6. [Google Scholar]
  16. Vayadande, K.; Kale, D.R.; Nalavade, J.; Kumar, R.; Magar, H.D. Text Generation & Classification in NLP: A Review. In How Machine Learning is Innovating Today’s World; Dey, A., Nayak, S., Kumar, R., Mohanty, S.N., Eds.; Wiley: New York, NY, USA, 2024; pp. 25–36. ISBN 978-1-394-21411-2. [Google Scholar]
  17. Sarica, S.; Luo, J. Stopwords in Technical Language Processing. PLoS ONE 2021, 16, e0254937. [Google Scholar] [CrossRef]
  18. Jabbar, A.; Iqbal, S.; Tamimy, M.I.; Rehman, A.; Bahaj, S.A.; Saba, T. An Analytical Analysis of Text Stemming Methodologies in Information Retrieval and Natural Language Processing Systems. IEEE Access 2023, 11, 133681–133702. [Google Scholar] [CrossRef]
  19. Borg, A.; Boldt, M. Using VADER Sentiment and SVM for Predicting Customer Response Sentiment. Expert Syst. Appl. 2020, 162, 113746. [Google Scholar] [CrossRef]
  20. Cruz, C.A.A.; Balahadia, F.F. Analyzing Public Concern Responsesfor Formulating Ordinances and Lawsusing Sentiment Analysis through VADER Application. Int. J. Comput. Sci. Res. 2022, 6, 842–856. [Google Scholar] [CrossRef]
  21. Darraz, N.; Karabila, I.; El-Ansari, A.; Alami, N.; Lazaar, M.; Mallahi, M.E. Using Sentiment Analysis to Spot Trending Products. In Proceedings of the 2023 Sixth International Conference on Vocational Education and Electrical Engineering (ICVEE), Surabaya, Indonesia, 14–15 October 2023; pp. 48–54. [Google Scholar]
  22. Ghasemaghaei, M.; Eslami, S.P.; Deal, K.; Hassanein, K. Reviews’ Length and Sentiment as Correlates of Online Reviews’ Ratings. Internet Res. 2018, 28, 544–563. [Google Scholar] [CrossRef]
  23. Liu, S.; Wright, A.P.; Patterson, B.L.; Wanderer, J.P.; Turer, R.W.; Nelson, S.D.; McCoy, A.B.; Sittig, D.F.; Wright, A. Using AI-Generated Suggestions from ChatGPT to Optimize Clinical Decision Support. J. Am. Med. Inform. Assoc. 2023, 30, 1237–1245. [Google Scholar] [CrossRef]
  24. Sedgwick, P. Spearman’s Rank Correlation Coefficient. BMJ 2014, 349, g7327. [Google Scholar] [CrossRef]
  25. Khaled, E.; Omar, Y.M.K.; Hodhod, R. Towards an Enhanced Model For Contextual Topic Identification. In Proceedings of the 2023 5th Novel Intelligent and Leading Emerging Sciences Conference (NILES), Giza, Egypt, 21–23 October 2023; pp. 188–193. [Google Scholar]
  26. Zhang, Y.; Zhang, Y.; Michalski, M.; Jiang, Y.; Meng, Y.; Han, J. Effective Seed-Guided Topic Discovery by Integrating Multiple Types of Contexts. In Proceedings of the Sixteenth ACM International Conference on Web Search and Data Mining, Singapore, 27 February–3 March 2023; pp. 429–437. [Google Scholar]
  27. Řehůřek, R. What Is Gensim? GENSIM Topic Modelling for Humans. 2024. Available online: https://radimrehurek.com/gensim/intro.html#what-is-gensim (accessed on 18 June 2025).
  28. Srinivasa-Desikan, B. Natural Language Processing and Computational Linguistics: A Practical Guide to Text Analysis with Python, Gensim, spaCy, and Keras, 1st ed.; Packt Publishing: Birmingham, UK, 2018; ISBN 978-1-78883-853-5. [Google Scholar]
  29. Cheng, H.; Liu, S.; Sun, W.; Sun, Q. A Neural Topic Modeling Study Integrating SBERT and Data Augmentation. Appl. Sci. 2023, 13, 4595. [Google Scholar] [CrossRef]
  30. Id, I.D.; Kurniawan, R. Feedback Analysis of Learning Evaluation Applications Using Latent Dirichlet Allocation. In Proceedings of the 2023 Sixth International Conference on Vocational Education and Electrical Engineering (ICVEE), Surabaya, Indonesia, 14–15 October 2023; pp. 335–339. [Google Scholar]
  31. Watanabe, K.; Baturo, A. Seeded Sequential LDA: A Semi-Supervised Algorithm for Topic-Specific Analysis of Sentences. Soc. Sci. Comput. Rev. 2024, 42, 224–248. [Google Scholar] [CrossRef]
  32. Hsu, C.-I.; Chiu, C. A Hybrid Latent Dirichlet Allocation Approach for Topic Classification. In Proceedings of the 2017 IEEE International Conference on Innovations in Intelligent Systems and Applications (INISTA), Gdynia, Poland, 3–5 July 2017; pp. 312–315. [Google Scholar]
  33. Hardiyanti, L.; Anggraini, D.; Kurniawati, A. Identify Reviews of Pedulilindungi Applications Using Topic Modeling with Latent Dirichlet Allocation Method. Indones. J. Comput. Cybern. Syst. 2023, 17, 441. [Google Scholar] [CrossRef]
  34. Yun, J.-Y.; Lee, J.-H. Analysis of Museum Social Media Posts for Effective Social Media Management. In Cultural Space on Metaverse; Lee, J.-H., Ed.; KAIST Research Series; Springer Nature: Singapore, 2024; pp. 175–191. ISBN 978-981-99-2313-7. [Google Scholar]
  35. Drivas, I.C.; Kouis, D.; Kyriaki-Manessi, D.; Giannakopoulou, F. Social Media Analytics and Metrics for Improving Users Engagement. Knowledge 2022, 2, 225–242. [Google Scholar] [CrossRef]
  36. Burkov, I.; Gorgadze, A. From Text to Insights: Understanding Museum Consumer Behavior through Text Mining TripAdvisor Reviews. Int. J. Tour. Cities 2023, 9, 712–728. [Google Scholar] [CrossRef]
  37. Cappa, F.; Rosso, F.; Capaldo, A. Visitor-Sensing: Involving the Crowd in Cultural Heritage Organizations. Sustainability 2020, 12, 1445. [Google Scholar] [CrossRef]
  38. Stemmer, K.; Gjerald, O.; Øgaard, T. Crowding, Emotions, Visitor Satisfaction and Loyalty in a Managed Visitor Attraction. Leis. Sci. 2024, 46, 710–732. [Google Scholar] [CrossRef]
  39. Ma, Y.; Zhu, Y.; Chen, M.; Yang, R. Visitor-Oriented: A Study of the British Museum’s Visitor-Centred Operations Strategy. Int. J. Educ. Humanit. 2023, 11, 128–130. [Google Scholar] [CrossRef]
  40. Lieto, A.; Striani, M.; Gena, C.; Dolza, E.; Marras, A.M.; Pozzato, G.L.; Damiano, R. A Sensemaking System for Grouping and Suggesting Stories from Multiple Affective Viewpoints in Museums. Hum.–Comput. Interact. 2024, 39, 109–143. [Google Scholar] [CrossRef]
  41. Parasuraman, A.; Zeithaml, V.A.; Berry, L.L. SERVQUAL: A Multiple-Item Scale for Measuring Consumer Perceptions of Service Quality. J. Retail. 1988, 64, 12–40. [Google Scholar]
  42. Ladhari, R. A Review of Twenty Years of SERVQUAL Research. Int. J. Qual. Serv. Sci. 2009, 1, 172–198. [Google Scholar] [CrossRef]
  43. Wirtz, J.; Lovelock, C.H. Services Marketing: People, Technology, Strategy, 9th ed.; World Scientific: Singapore, 2022; ISBN 978-1-944659-82-0. [Google Scholar]
  44. Black, G. Transforming Museums in the Twenty-First Century; Routledge: New York, NY, USA, 2012; ISBN 978-0-415-61573-0. [Google Scholar]
  45. Grönroos, C.; Voima, P. Critical Service Logic: Making Sense of Value Creation and Co-Creation. J. Acad. Mark. Sci. 2013, 41, 133–150. [Google Scholar] [CrossRef]
  46. Poulopoulos, V.; Wallace, M. Digital Technologies and the Role of Data in Cultural Heritage: The Past, the Present, and the Future. Big Data Cogn. Comput. 2022, 6, 73. [Google Scholar] [CrossRef]
  47. Zhang, Y.; Xiao, Y.; Wu, J.; Lu, X. Comprehensive World University Ranking Based on Ranking Aggregation. Comput. Stat. 2021, 36, 1139–1152. [Google Scholar] [CrossRef]
  48. Blanco, R.D. First Steps to Create a Data-Driven Culture in Organizations. Case Study in a Financial Institution. In Proceedings of the 2024 IEEE Eighth Ecuador Technical Chapters Meeting (ETCM), Cuenca, Ecuador, 15–18 October 2024; pp. 1–6. [Google Scholar]
  49. Shahbazi, Z.; Byun, Y.-C. LDA Topic Generalization on Museum Collections. In Smart Technologies in Data Science and Communication; Fiaidhi, J., Bhattacharyya, D., Rao, N.T., Eds.; Lecture Notes in Networks and Systems; Springer: Singapore, 2020; Volume 105, pp. 91–98. ISBN 978-981-15-2406-6. [Google Scholar]
  50. Huang, M. Discussion of the Descriptive Metadata Schema for Museum Objects. Sci. Conserv. Archaeol. 2021, 33, 98–104. [Google Scholar]
  51. Meler, A. In The Beginning, Let There Be The Word: Challenges and Insights in Applying Sentiment Analysis to Social Research. In Proceedings of the Companion Proceedings of the ACM Web Conference 2024, Singapore, 13–17 May 2024; pp. 1214–1217. [Google Scholar]
  52. Adeyeye, O.J.; Akanbi, I. A Review of Data-Driven Decision Making in Engineering Management. Eng. Sci. Technol. J. 2024, 5, 1303–1324. [Google Scholar] [CrossRef]
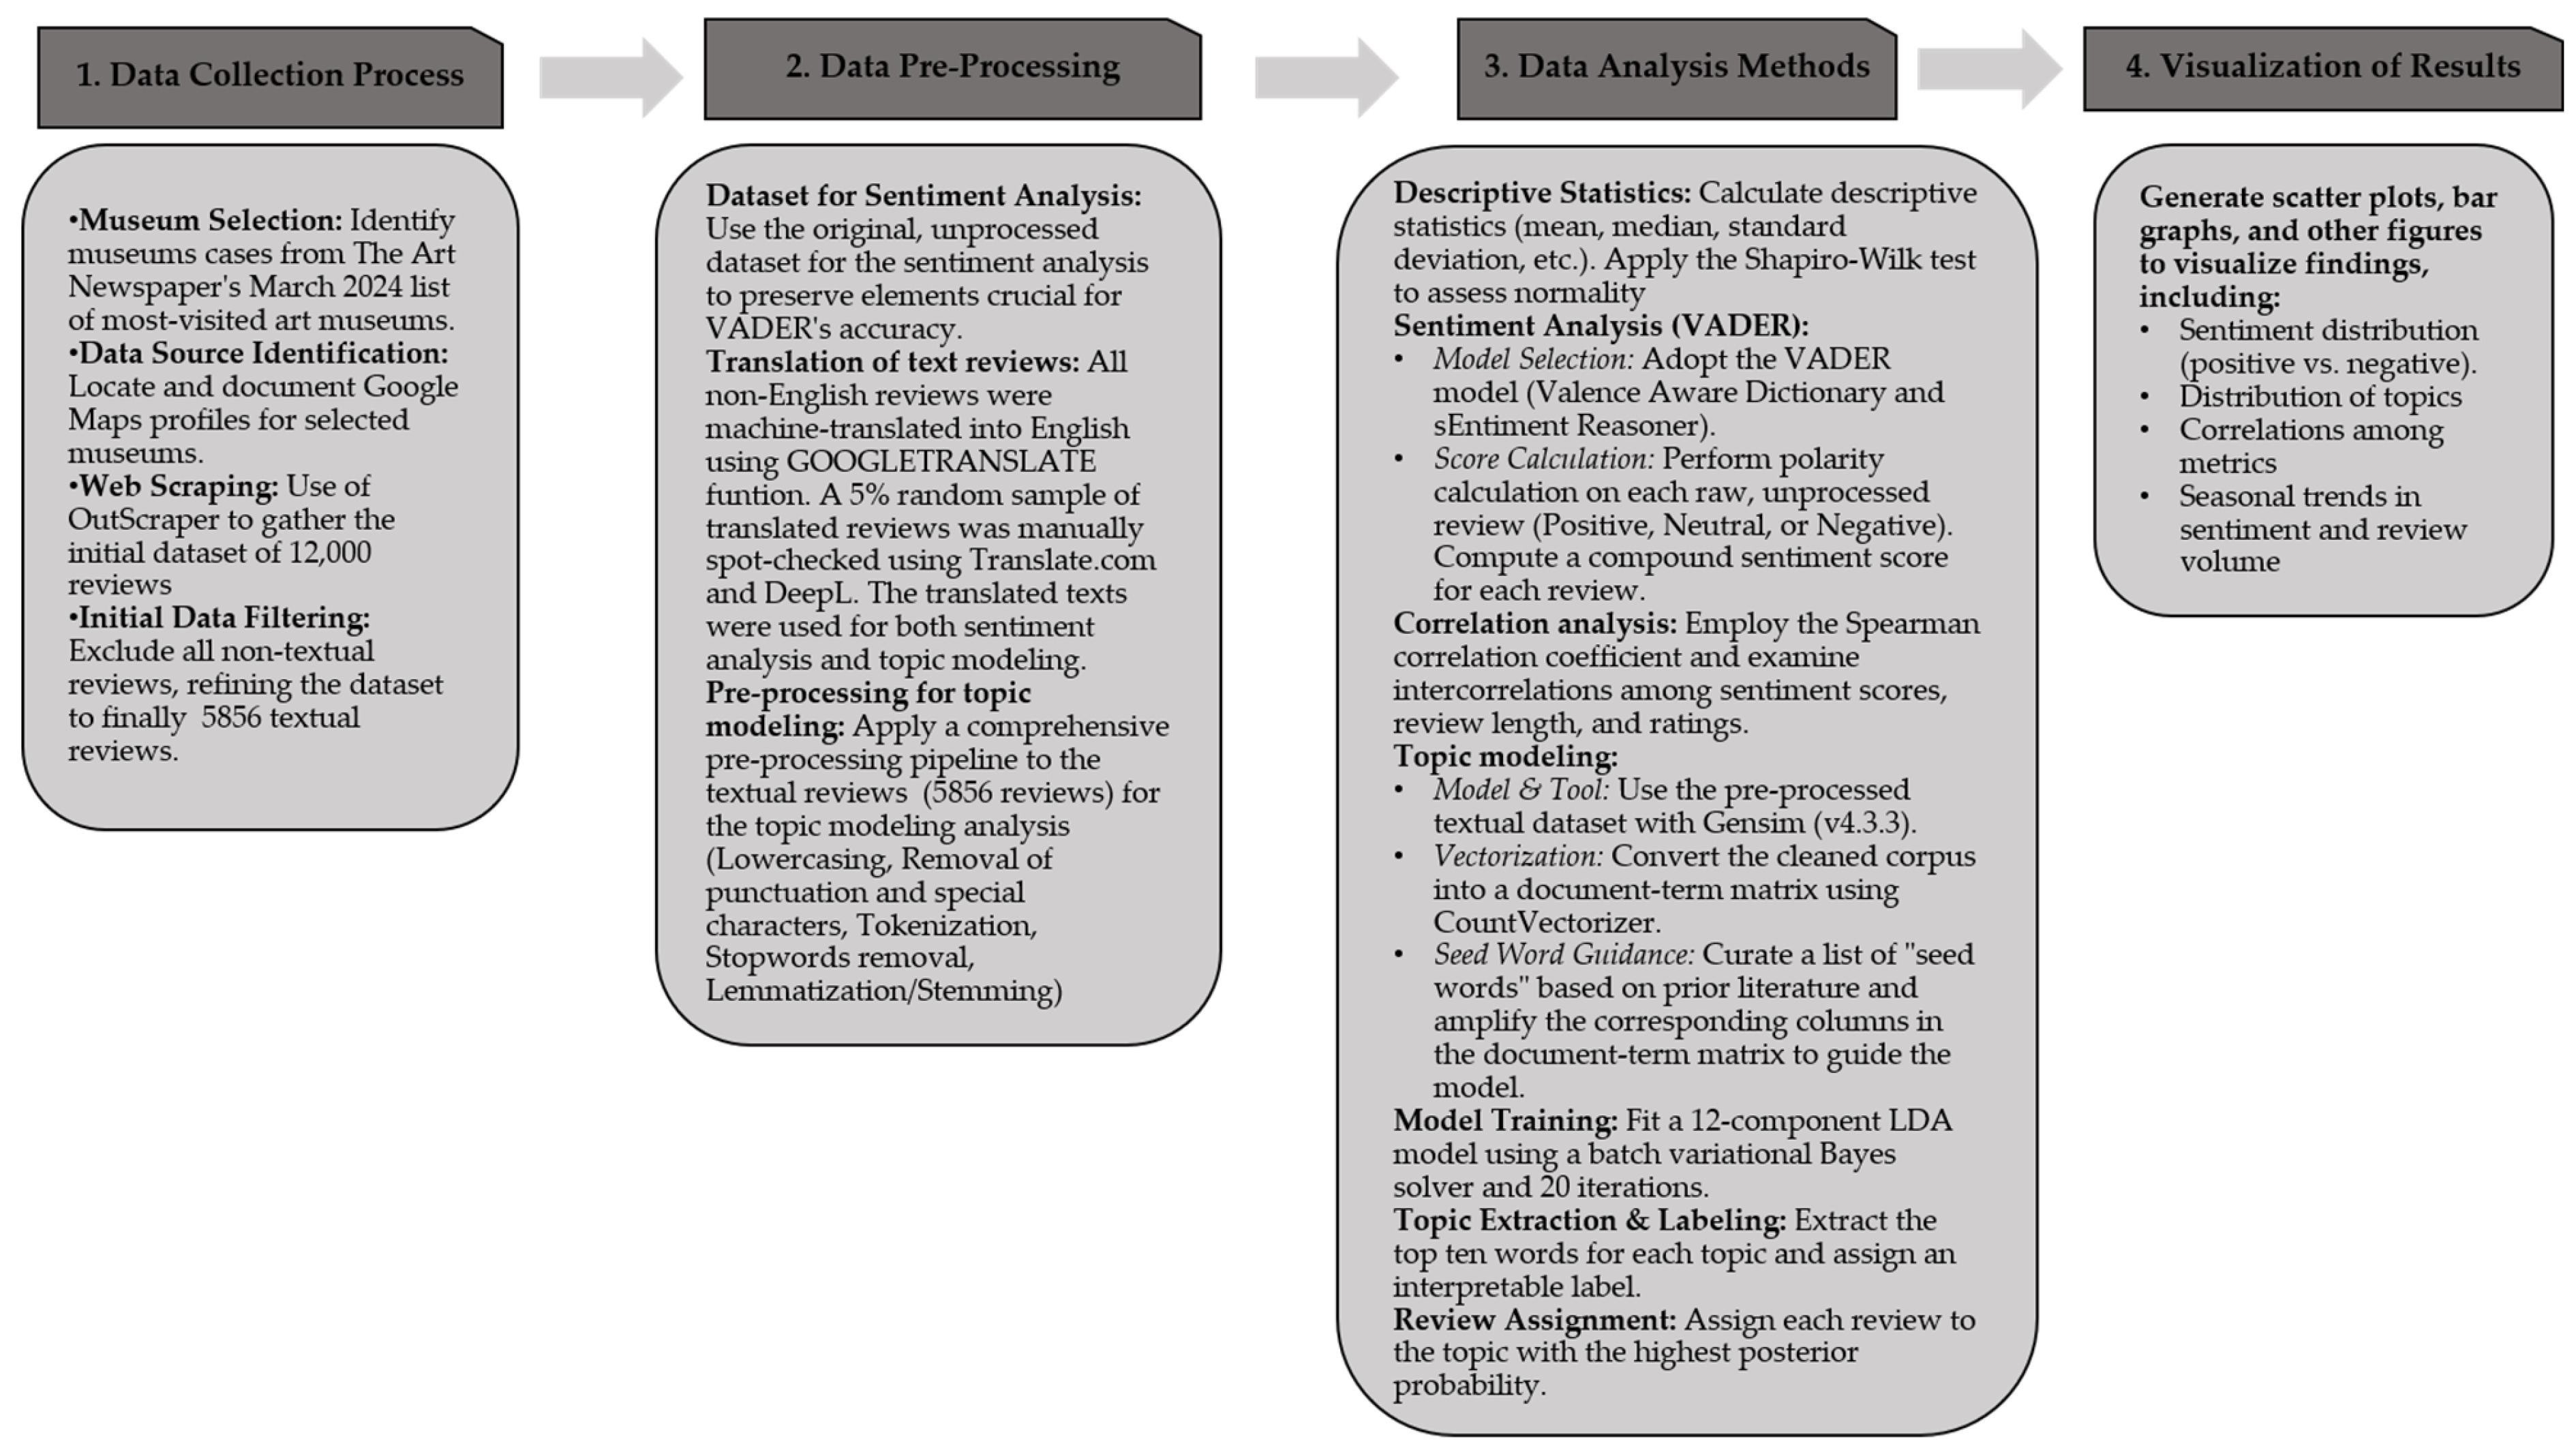
Figure 1. The research scheme, providing an overview of the four-step methodology from data collection and pre-processing to analysis and visualization.
Digital 05 00035 g001
Figure 2. Distribution of star ratings for all visitor reviews, depicting the total number of reviews for each rating level.
Digital 05 00035 g002
Figure 3. Monthly distribution of visitor review volume, showing the total number of reviews posted for each month of the year.
Digital 05 00035 g003
Figure 4. Average monthly review rating, displaying the average star rating of visitor reviews for each month.
Digital 05 00035 g004
Figure 5. Distribution of VADER sentiment scores for each visitor review, highlighting the range of positive, neutral, and negative sentiment scores.
Digital 05 00035 g005
Figure 6. Distribution of visitor reviews by sentiment polarity, showing the total number of reviews classified as positive, neutral, or negative through different intervals.
Digital 05 00035 g006
Figure 7. Distribution of visitor reviews across the 12 LDA-derived topic categories, showing the number of reviews associated with each topic.
Digital 05 00035 g007
Figure 8. Average 5-star rating for each topic category, showing the mean visitor satisfaction level associated with each topic.
Digital 05 00035 g008
Figure 9. Average sentiment polarity for each topic category, presenting the mean sentiment score of reviews associated with each topic.
Digital 05 00035 g009
Table 1. Summary of identified research gaps in previous related studies and how the current research addresses these gaps.
Research Gaps IdentifiedHow This Study Tackles These Gaps
Limited temporal scope: Outdated datasets (e.g., pre-2014).Uses a contemporary dataset, primarily from 2024, capturing recent trends.
Geographical limitations: Studies focused on specific cities or regions.Analyzes data from 59 museums across 19 countries, ensuring global relevance.
Language barriers: Focus on English or local language reviews, missing international perspectives.Over 50% of the dataset consists of non-English reviews (3080 out of 5856), which were translated to ensure global inclusivity.
Limited methodological integration: Either qualitative or quantitative methods used in isolation.Combines quantitative metrics (e.g., ratings and review length) and qualitative topic modeling for a more comprehensive analysis.
Practical applicability: Research lacked actionable insights for museum managers.Provides actionable insights to help museums address service failures and prioritize improvements.
Table 2. Definitions and examples of the key visitor review metrics used in this study, including their data sources.
Metric NameDefinitionExample from the DatasetSource
Museum nameThe official name of the museum, as listed in Google My Business.National Gallery of Australia, Somerset House, Kunsthistorisches Museum Wien, etc.Google Maps
Review textThe content of an individual review. Some reviews only include a star rating without text.Very thorough in regards to contemporary ROK history. Excellent audio guide via QR code. Museum is out of English language printed guides. But you really don’t need it. Unless you collect them as souvenirs. Great view from the 8F roof deck.Google Maps
Number of characters on a unique reviewTotal number of characters in a single review. Calculated using = LEN() in spreadsheets.384Developed
Review sentiment scoreA numerical score ranging from −0.999 (very negative) to 0.999 (very positive), indicating the emotional tone of the review.0.4404 = positive; −0.3495 = negative; 0.000 = neutralDeveloped
Review ratingUser-assigned score on a 1–5 scale reflecting satisfaction, where 1 is poor and 5 is excellent.1, 5, 4, 2, 3, etc.Google Maps
Number of review likesThe number of users who marked the review as helpful or agreeable. Reflects how much the review resonated with others. Google Maps
Review dateThe date the review was posted.31 August 2024, 3 September 2024, 16 June 2024, etc.Google Maps
Table 3. A comparative illustration of the text pre-processing pipeline, showing raw visitor reviews alongside their simplified and tokenized versions for the topic modeling analysis.
Unprocessed ReviewsProcessed Reviews
Must go if you are art lover. Highly recommend to book time ahead of time. Otherwise you will be lining up for a while. Go to website and it’s free of charge to book time a lot and you will have to plan ahead and be there at the time slot. It will be definitely worth doing this if you see the regular line. A lot of art pieces for reviewing but some of the pieces got loan out until fall. Staffs are polite, friendly and knowledgable. Amazing experience and will definitely go back again.must go art lover highly recommend book time ahead time otherwise lining go website free charge book time lot plan ahead time slot definitely worth see regular line lot art piece reviewing piece got loan fall staff polite friendly knowledgable amazing experience definitely go back
“Whitney Museum Free Fridays!
I must recommend checking the Whitney out in the summer! They offer free entry from 5 pm to 10 pm. You can go online and get your tickets. Which I highly recommend so entry is a breeze. This was my first time at the Whitney and it was just amazing. Once you enter there is a security check and a DJ playing music on the First Floors. Gift shop and a Restaurant is also located on the first floor as well as a cafe on one of the upper floors. The museum has several floors of art. They also have lots of outdoor space that overlooks the city. If you’re in the city on a Friday this is a great place to visit. I will surely try my best to check it out again.”
whitney museum free friday must recommend checking whitney summer offer free entry 5 pm 10 pm go online get ticket highly recommend entry breeze first time whitney amazing enter security check dj playing music first floor gift shop restaurant also located first floor well cafe one upper floor museum several floor art also lot outdoor space overlook city youre city friday great place visit surely try best check
There are too many people on weekends. Go for a weekday afternoon. There are so many artifacts. The Rosetta Stone and Moai stone statues were impressive.many people weekend go weekday afternoon many artifact rosetta stone moai stone statue impressive
Table 4. Overview of key thematic topics identified in the related literature for the categorization of museum visitor reviews.
StudyIdentified Topics for Categorizing Museum Visitor Reviews
Lei et al. [3]Historical atmosphere, crowd density, guide services, interactive exhibits, family-friendliness, educational value
Agostino et al. [11]Ticketing and welcoming, space, comfort, activities, communication
museum cultural heritage, personal experience, museum services
Alexander et al. [5]Descriptive: Children, Hours, Queue, Early, Location, Cost, Meal, Staff, Asked, Toilets, Exhibition
Evaluative: Difficult (poor displays), Confusing (poor layout), Surprised (unexpectedly pleasant), Longer (wanted more time), Inspiring (awe-inspiring experiences)
Museum-specific: Beefeaters (guides), Poppies (specific installation), Fashion (special exhibitions)
Su & Teng [1]Convenience: Queuing, online ticketing issues, parking availability, opening times
Contemplation: Overcrowding, visitor behavior, photography and selfie issues
Assurance: Curation/display quality, collection relevance, visitor interest alignment
Responsiveness: Staff behavior, handling of complaints
Reliability: Unexpected closures, exhibit maintenance
Tangibles: Facilities quality, cleanliness, restrooms, Wi-Fi, elevators
Empathy: Services for people with disabilities, elderly, and children
Communication: Multi-language services, signage, exhibit interpretation, audio guides
Servicescape: Museum layout, visitor flow, ambient conditions (temperature, smell)
Consumables: Quality and pricing of food services and shops
Purposiveness: Alignment with museum’s mission, commercialization level
First-hand experience: Interactive elements, proximity and engagement with exhibits
Table 5. An example of the dataset structure, showcasing a sample of visitor reviews and the key metrics extracted for analysis.
Museum NameReview TextNumber of Characters on a Unique ReviewReview Sentiment ScoreReview RatingNumber of Review LikesReview Date
Philadelphia Museum of ArtSo excited to see some of the world’s famous paintings in just one location :).780.340508 December 2024
The National Gallery UKA very good museum with lots of stuff to see. The paintings are loaded with history. Nothing vegan to eat except for an overpriced cookie, 3 cm × 3 cm, 6 GBP (3-4× bigger non-vegan food is 2–4 GBP). I was told to stop eating my vegan roll because it was not bought from there. There is no fairness in this, hence only 3 stars.3220.1783015 August 2024
Somerset HouseIce rink under an inch of water, with no visible drainage. People falling over and getting completely soaked. Staff refusing to give refunds to those who would prefer not to wreck their day in London with a soaking. Take your money elsewhere.243−0.755141 February 2024
Table 6. Descriptive statistics and Shapiro–Wilk normality test results for review length, sentiment score, star rating, and review likes.
MeasuresMetrics
Number of CharactersReview Sentiment ScoreReview RatingReview Likes
Median91.0000.6375.0000.000
Mean168.4330.5554.5080.231
Std. Deviation240.0860.3871.0031.528
Skewness4.364−1.320−2.29718.172
Shapiro–Wilk0.5990.8670.551NaN
p-value of Shapiro–Wilk<0.001<0.001<0.001NaN
Minimum1.000−0.9771.0000.000
Maximum3401.0000.9995.00052.000
Table 7. Spearman’s rank-order correlation coefficients (ρ) and significance levels for pairwise associations. Hyphens (-) indicate a variable correlated with itself, which does not yield a correlation coefficient.
VariablesNumber of CharactersReview Sentiment ScoreReview RatingReview Likes
Number of Characters-
Review Sentiment Score0.450 ***
p < 0.001
-
Review Rating−0.147 ***
p < 0.001
0.272 ***
p < 0.001
-
Review Likes0.198 ***
p < 0.001
0.040 **
p = 0.002
−0.110 ***
p < 0.001
-
** p < 0.01, *** p < 0.001.
Table 8. Overview of assigned topics, thematic descriptions, and representative keywords derived from guided LDA modeling of visitor reviews.
Assigned Topic LabelTopic DescriptionTop Keywords Included
1. Servicescape & AmbienceFocuses on the museum’s environment, including layout, lighting, and atmosphere, and their impact on visitor experience.place, beautiful, flow, great, interesting, nice, see, art, amazing, exhibition
2. Convenience & AccessCovers practical aspects like parking, ticketing, operating hours, and ease of navigation within the museum.display, parking, museum, art, exhibit, free, work, de, lot, chirico
3. Assurance, Content & CurationAddresses the quality, relevance, and presentation of the museum’s collections and exhibitions.collection, art, museum, painting, building, visit, beautiful, gallery, piece, rich
4. Communication & GuidingEvaluates the effectiveness of visitor support services, such as guides, signage, and multilingual support.audio, guide, tour, museum, excellent, well, history, language, guided, multiple
5. Visitor Experience & ImpressionsReflects visitors’ emotional reactions and overall impressions of their visit.art, museum, exhibition, work, building, great, visit, beautiful, modern, photography
6. Responsiveness & StaffReviews staff friendliness, professionalism, and how they handle visitor inquiries or issues.staff, friendly, museum, helpful, experience, rude, great, ice, nice, lovely
7. Tangibles & FacilitiesCovers the condition of the museum’s physical amenities, like restrooms, seating, and Wi-Fi.free, ticket, museum, exhibition, see, entrance, admission, went, day, get
8. Family ServicesFocuses on family-friendly features, including children’s areas and services for young visitors.interactive, exhibition, smell, museum, child, floor, well, exhibit, time, see
9. AccessibilityAddresses accommodations for visitors with disabilities or the elderly, such as wheelchair access and assistive devices.wheelchair, good, cafe, great, also, button, access, lovely, gallery, elevator
10. Consumables & MerchandiseReviews food, beverage, and merchandise at the museum shops, including variety and quality.signage, people, get, food, exhibition, souvenirs, restaurant, first, security, wifi
11. Contemplation & CrowdingDiscusses issues like overcrowding, noise, and behaviors affecting the visitor’s experience of exhibits.museum, time, people, visit, day, place, many, one, hour, lot
12. Purposiveness & StrategyReflects on the museum’s mission, the balance between commercial and cultural goals, and strategic direction.layout, opening, museum, behavior, gallery, mission, exhibition, van, gogh, work
Disclaimer/Publisher’s Note: The statements, opinions and data contained in all publications are solely those of the individual author(s) and contributor(s) and not of MDPI and/or the editor(s). MDPI and/or the editor(s) disclaim responsibility for any injury to people or property resulting from any ideas, methods, instructions or products referred to in the content.