Article

Performance Validation of CEPH_2D, a Novel Artificial Intelligence Tool for Automatic Cephalometric and Obstructive Sleep Apnea Syndrome Analyses


by
Marco Colombo
1,*,
Gaetano Scaramozzino
2,
Giuseppe Cota
2,
Maurizio Pascadopoli
1,
Giacomo Budelli
1,
Simonemaria Domenico Gatti
1 and
Andrea Scribante
1,*
1
Section of Dentistry, Department of Clinical, Surgical, Diagnostic and Pediatric Sciences, University of Pavia, 27100 Pavia, PV, Italy
2
Scaramozzino Dental Practice, 45020 Villanova del Ghebbo, RO, Italy
*
Authors to whom correspondence should be addressed.
Submission received: 15 April 2026 / Revised: 29 May 2026 / Accepted: 4 June 2026 / Published: 9 June 2026
(This article belongs to the Special Issue Advances in Digital Orthodontics)

Highlights

What are the main findings?
  • CEPH_2D showed promising performance for automatic cephalometric landmark detection and pharyngeal airway segmentation on lateral cephalograms.
  • The system achieved a rapid processing time and showed stable performance across the examined age and sex subgroups.
What are the implications of the main findings?
  • CEPH_2D may represent a useful adjunctive tool to support orthodontic and obstructive sleep apnea syndrome-related radiographic assessment.
  • Clinician supervision remains advisable, particularly for landmarks showing higher detection errors, and larger externally validated studies are required.

Abstract

Background/Objectives: Cephalometric analysis is essential in orthodontics and for studying conditions such as obstructive sleep apnea syndrome (OSAS). However, manually identifying anatomical landmarks and segmenting the pharyngeal airway on lateral cephalograms can be time-consuming and prone to errors. This study evaluates the CEPH_2D system, an AI-based tool designed to automate cephalometric landmark detection and pharyngeal airway segmentation from 2D lateral cephalometric radiographs. Methods: The system was evaluated on 35 anonymized lateral cephalograms obtained from patients aged 6–65 years, including mixed and permanent dentition cases. Two experienced clinicians generated and reviewed the ground truth annotations for cephalometric landmark localization and pharyngeal airway segmentation. System performance was assessed using mean radial error (MRE), successful detection rate (SDR), mean average precision (mAP), Dice similarity coefficient (DSC), precision, recall, and inference time. Results were compared with manual methods and existing automated tools. Results: The system reached a mean radial error (MRE) of 0.740 ± 0.793 mm for the key point detection task and a mean Dice Score (mDSC) of 0.935 ± 0.040 with an average processing time of 2.557 ± 0.504 s. Conclusions: CEPH_2D appears to be a promising adjunctive tool for automatic cephalometric landmark detection and pharyngeal airway segmentation on lateral cephalograms, although clinician verification remains advisable before clinical interpretation or treatment planning, particularly for landmarks showing higher detection errors.

1. Introduction

Cephalometric analysis is an important tool in orthodontics and craniofacial studies. It involves identifying anatomical landmarks on lateral cephalograms to measure distances and angles, helping to diagnose craniofacial conditions and plan treatments [1,2,3]. However, this process is often done manually, which can be time-consuming and prone to errors influenced by the examiner’s experience, focus, and fatigue [1,2,3].
In addition to orthodontic uses, lateral cephalograms are valuable for studying obstructive sleep apnea syndrome (OSAS), a condition where the airway becomes partially or fully blocked during sleep. This requires analyzing anatomical landmarks and assessing the pharyngeal airway space. Manual analysis can be challenging, particularly for complex cases, which has led to the development of automated systems to streamline the process [4,5].
However, a true three-dimensional assessment of the upper airway remains challenging. Volumetric evaluation generally requires CBCT imaging, which may provide more detailed anatomical information but is not always justified in routine assessment because of radiation exposure considerations [4,5].
Automated cephalometric landmark detection has been a significant focus of research in recent years. Early approaches, such as those employing edge detection and knowledge-based tracking, were followed by machine learning techniques, including regression-voting approaches, and later by deep learning methods [6,7]. Deep learning methods, including Convolutional Neural Networks (CNNs), have shown remarkable success in accurately and reliably identifying cephalometric landmarks [8,9,10], also benefiting from advances in training and data augmentation strategies [11]. For instance, Park et al. [12] compared YOLOv3 and SSD for landmark detection, finding that YOLOv3 outperformed SSD in terms of both accuracy and speed. Qian et al. [13] introduced a multi-head attention neural network for improved performance.
While many studies have focused on patients with permanent dentition, fewer have considered the unique challenges posed by mixed dentition. Popova et al. [14] explored performance differences between these two groups, aligning with our work’s investigation into this distinction.
Multiple commercially available AI-based solutions for automatic cephalometry are offered by various companies. These include WebCeph by AssembleCircle Corp. (Seongnam, Republic of Korea), OneCeph by NXS Corp. (Hyderabad, India), AudaxCeph by Audax d.o.o. (Ljubljana, Slovenia), DentaliQ.ortho by CellmatiQ GmbH (Hamburg, Germany), NemoCeph by Nemotec S.L. (Madrid, Spain), and CephX by Orca Dental AI Ltd. (Dover, DE, USA) [1,2,3,15].
Regarding pharyngeal airway segmentation, Sin et al. [4] proposed a deep learning-based system for CBCT images, while Meng et al. [5] developed a method for segmenting the nasopharynx, oropharynx, and hypopharynx from lateral cephalograms, similar to our approach.
Recent studies have extended AI-based cephalometric analysis to CBCT imaging, unsupervised landmark localization, and cervical vertebral assessment on lateral cephalograms [16,17,18,19,20].
Automated cephalometric superimposition and vertical dimension assessment have also recently been investigated using AI-based approaches [21,22,23].
Beyond landmark analysis, AI has been applied to panoramic radiograph interpretation, dental structure and tooth segmentation, detection of impacted or missing teeth, agenesis and supernumerary teeth, automated caries classification, and the creation of annotated dental radiographic datasets to support machine learning development [24,25,26,27,28,29,30,31,32,33,34].
In this context, CEPH_2D is a deep learning-based artificial intelligence (AI) system, integrated into the Neowise software (version 1.5, Cefla S.C., Imola, Italy), that automates two key tasks: detecting and classifying anatomical landmarks used in cephalometric and OSAS analysis and segmenting the pharyngeal airway. By automating these steps, CEPH_2D aims to save time and improve accuracy compared to manual methods.
This study aims to validate the performance of CEPH_2D, evaluating its accuracy and reliability in detecting landmarks and segmenting the pharynx. The system’s ability to handle different patient categories, such as mixed and permanent dentition, and distinguish between regions of the pharynx is also assessed. The findings may help determine the potential role of CEPH_2D as an adjunctive tool in craniofacial and sleep apnea-related radiographic assessment.

2. Materials and Methods

2.1. Dataset

A total of 35 lateral cephalograms were collected from patients aged 6 to 65 years, representing a broad spectrum of European patients, including various ethnicities and both sexes. To analyze the impact of dental development, patients were categorized into two groups: mixed dentition (6–12 years) and permanent dentition (13–65 years). The distribution of these images is summarized in Table 1.
All lateral cephalograms were acquired using a Hyperion X9 Pro MyRay device (Cefla S.C., Imola, Italy) under routine clinical operating conditions. Although all radiographs were obtained using the same imaging platform, minor variability in acquisition conditions and image characteristics representative of routine clinical workflows was present across the dataset.
All radiographs were anonymized before analysis and included cases with various conditions, such as missing teeth, fillings, and root canal treatments, as well as metallic elements such as splints and crowns. Table 2 shows the distribution of clinical conditions across all images. Patients with maxillofacial syndromes, previous reconstructive surgery, or a history of maxillofacial trauma were excluded from this study. Radiographs considered unsuitable for diagnostic evaluation because of insufficient image quality were also excluded during the annotation and review workflow.
The present study constitutes an independent external performance validation study of CEPH_2D that was conducted without access to training data or implementation details.
As CEPH_2D is a commercially developed AI system integrated into Neowise software, detailed information regarding the original training dataset, including its size, source, diversity, and annotation workflow, was not available to the investigators because it is proprietary to the manufacturer. Therefore, the present study focuses exclusively on the independent external validation of the system on a dedicated testing dataset.

2.2. Ground Truth Definition for System Validation

The validation dataset was prepared with particular care in order to provide a reliable reference for evaluating the system’s performance. Two experienced clinicians, each with at least five years of clinical practice, were involved in the preparation of the dataset and worked with complementary roles, namely annotation and review. This workflow was intended to improve the consistency of the ground truth data and reduce potential annotation-related bias.
The Computer Vision Annotation Tool (CVAT, version 2.21.0, CVAT.ai, Wilmington, DE, USA), a self-hosted web application, was used to manually classify and annotate the radiographic images. The use of a self-hosted system also allowed the annotation platform to be installed on a server physically located in the European Union, in compliance with GDPR requirements.
The annotation process was organized into two phases:
  • Initial Annotation: The annotator performed manual annotations of the keypoints and pharynx segmentation on each radiograph using the annotation tool and assessed image quality to exclude radiographs unsuitable for diagnostic use.
  • Review and Quality Assurance: The reviewer meticulously examined the initial annotations to ensure their accuracy and adherence to established anatomical guidelines. Using cross-referencing techniques and visual validation, the reviewer corrected any discrepancies identified in the annotations. This phase also involved quality control checks to address any issues related to image quality and resolution, segmentation consistency, or potential operator errors.
The test dataset served as ground truth for evaluating the algorithm’s performance. By incorporating an annotation and review protocol, this process aimed to improve the consistency of the reference annotations and provide a clinically relevant benchmark for performance evaluation.
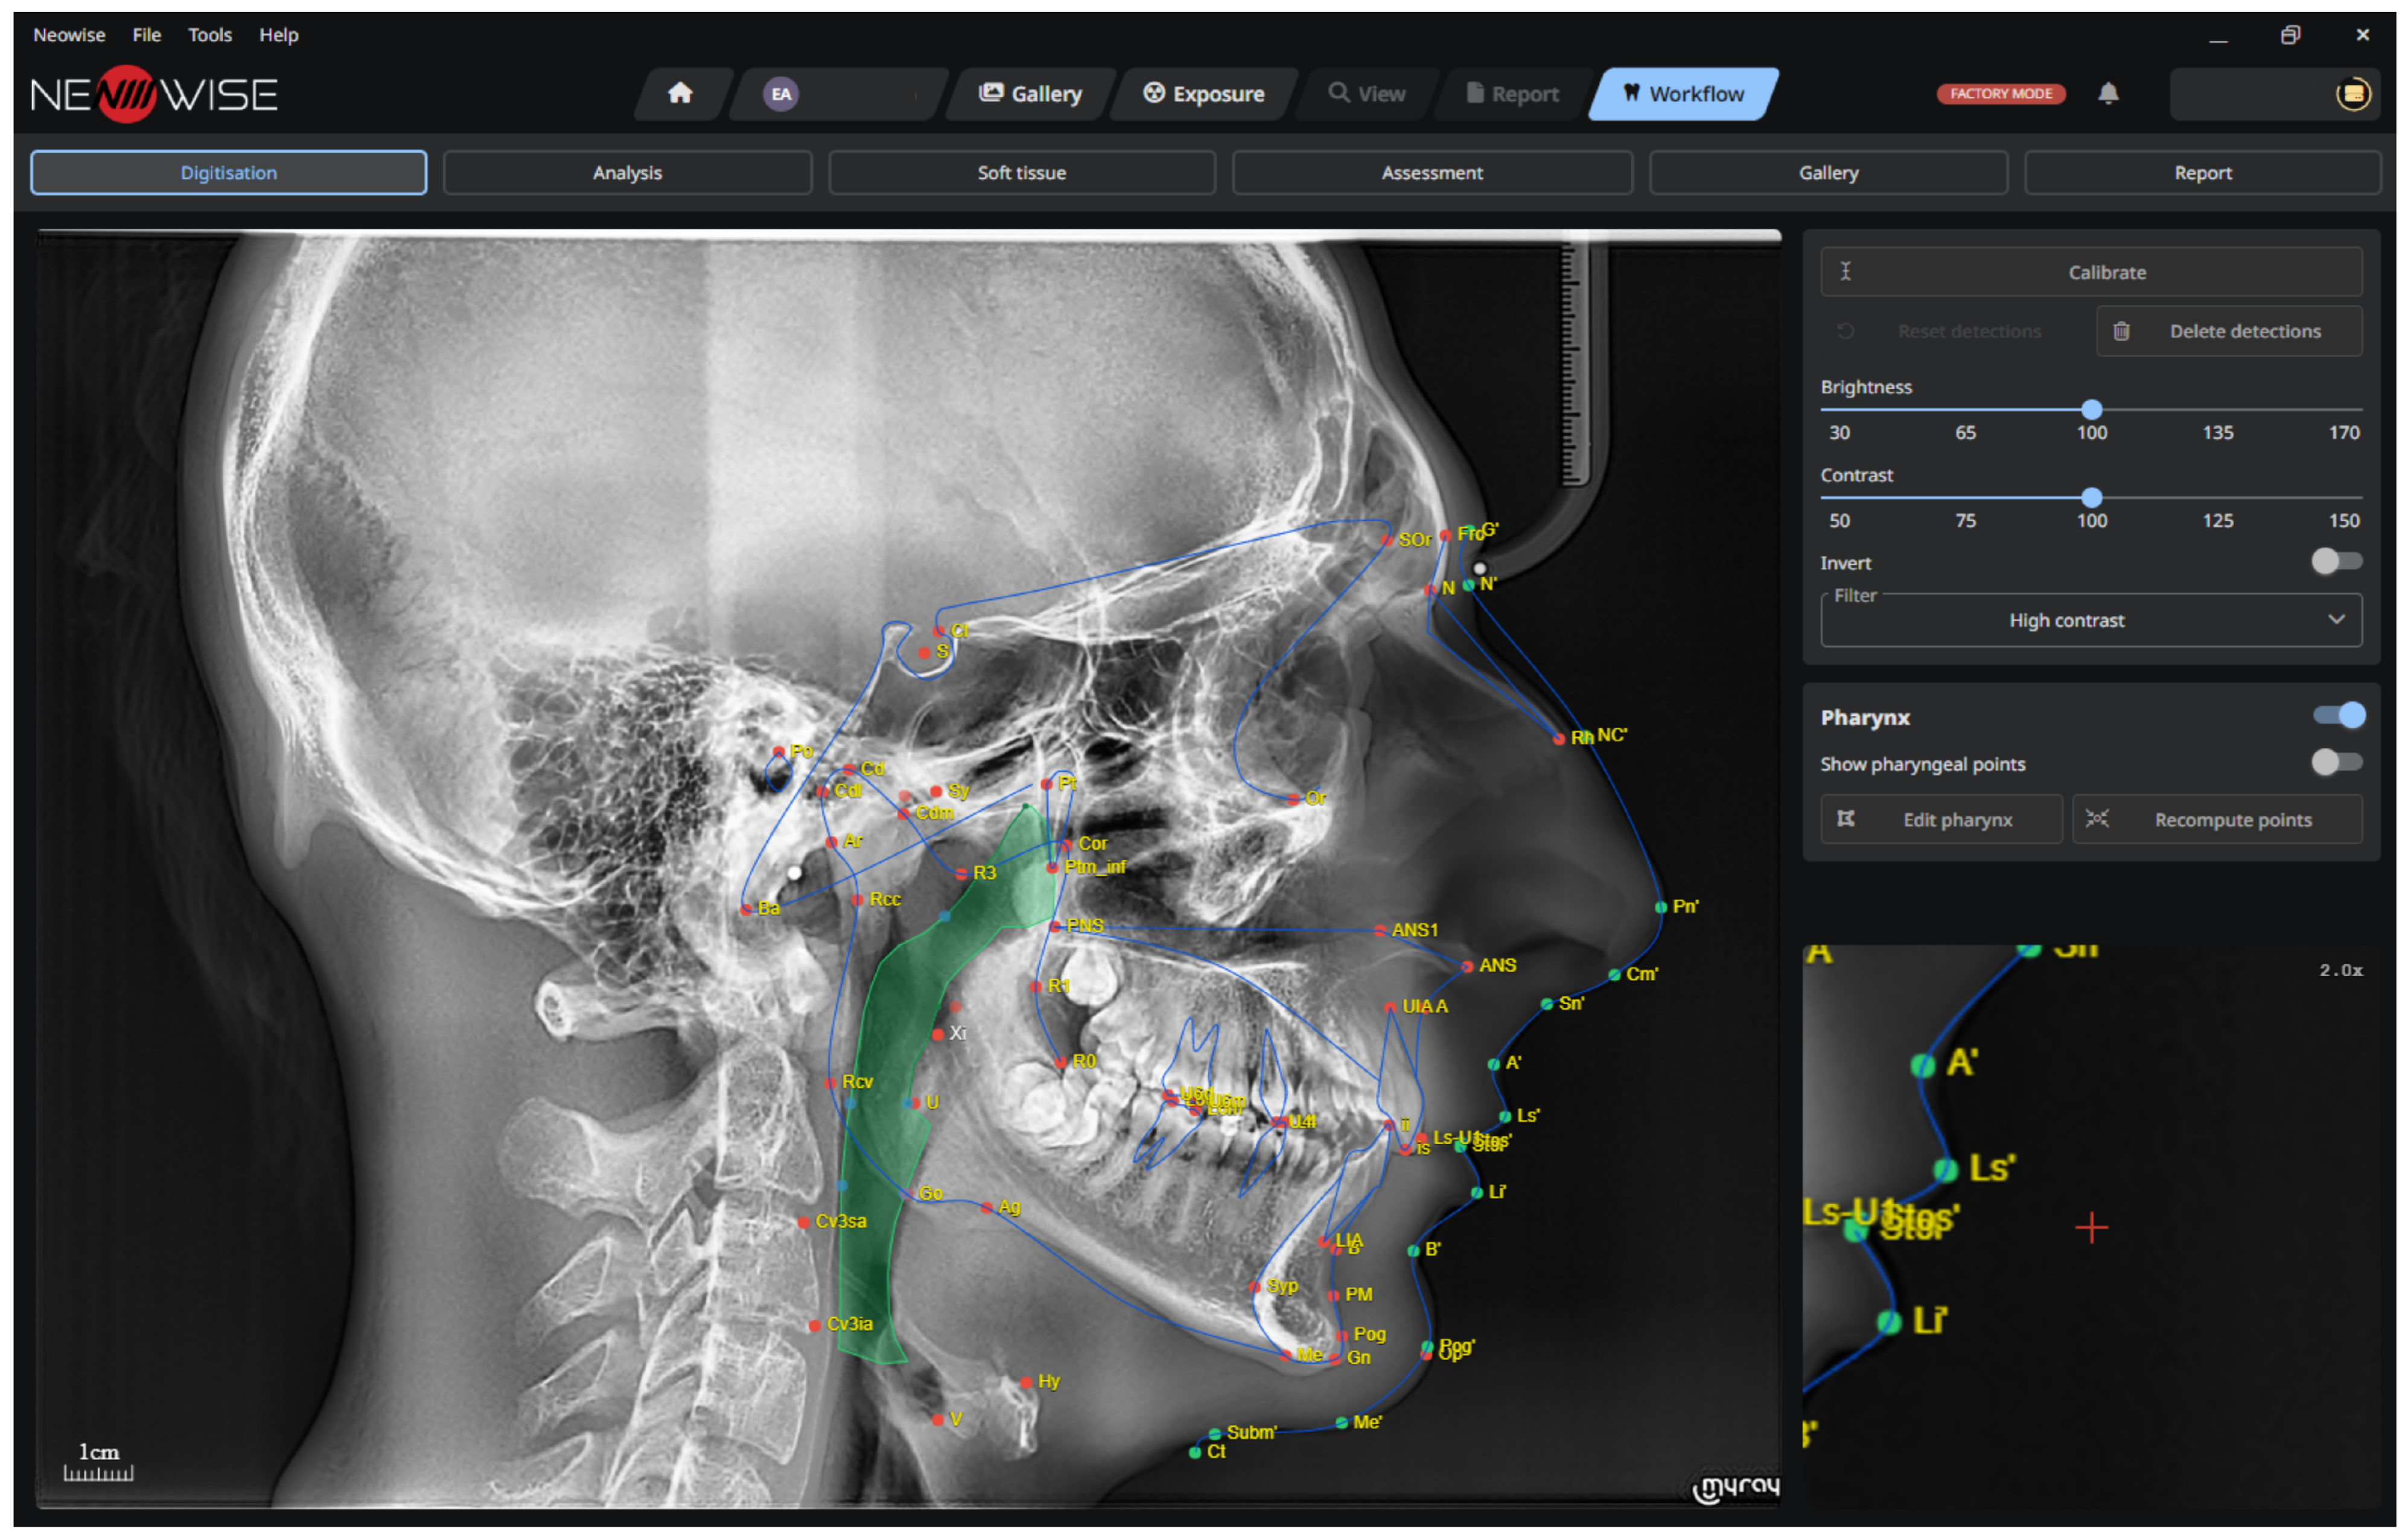
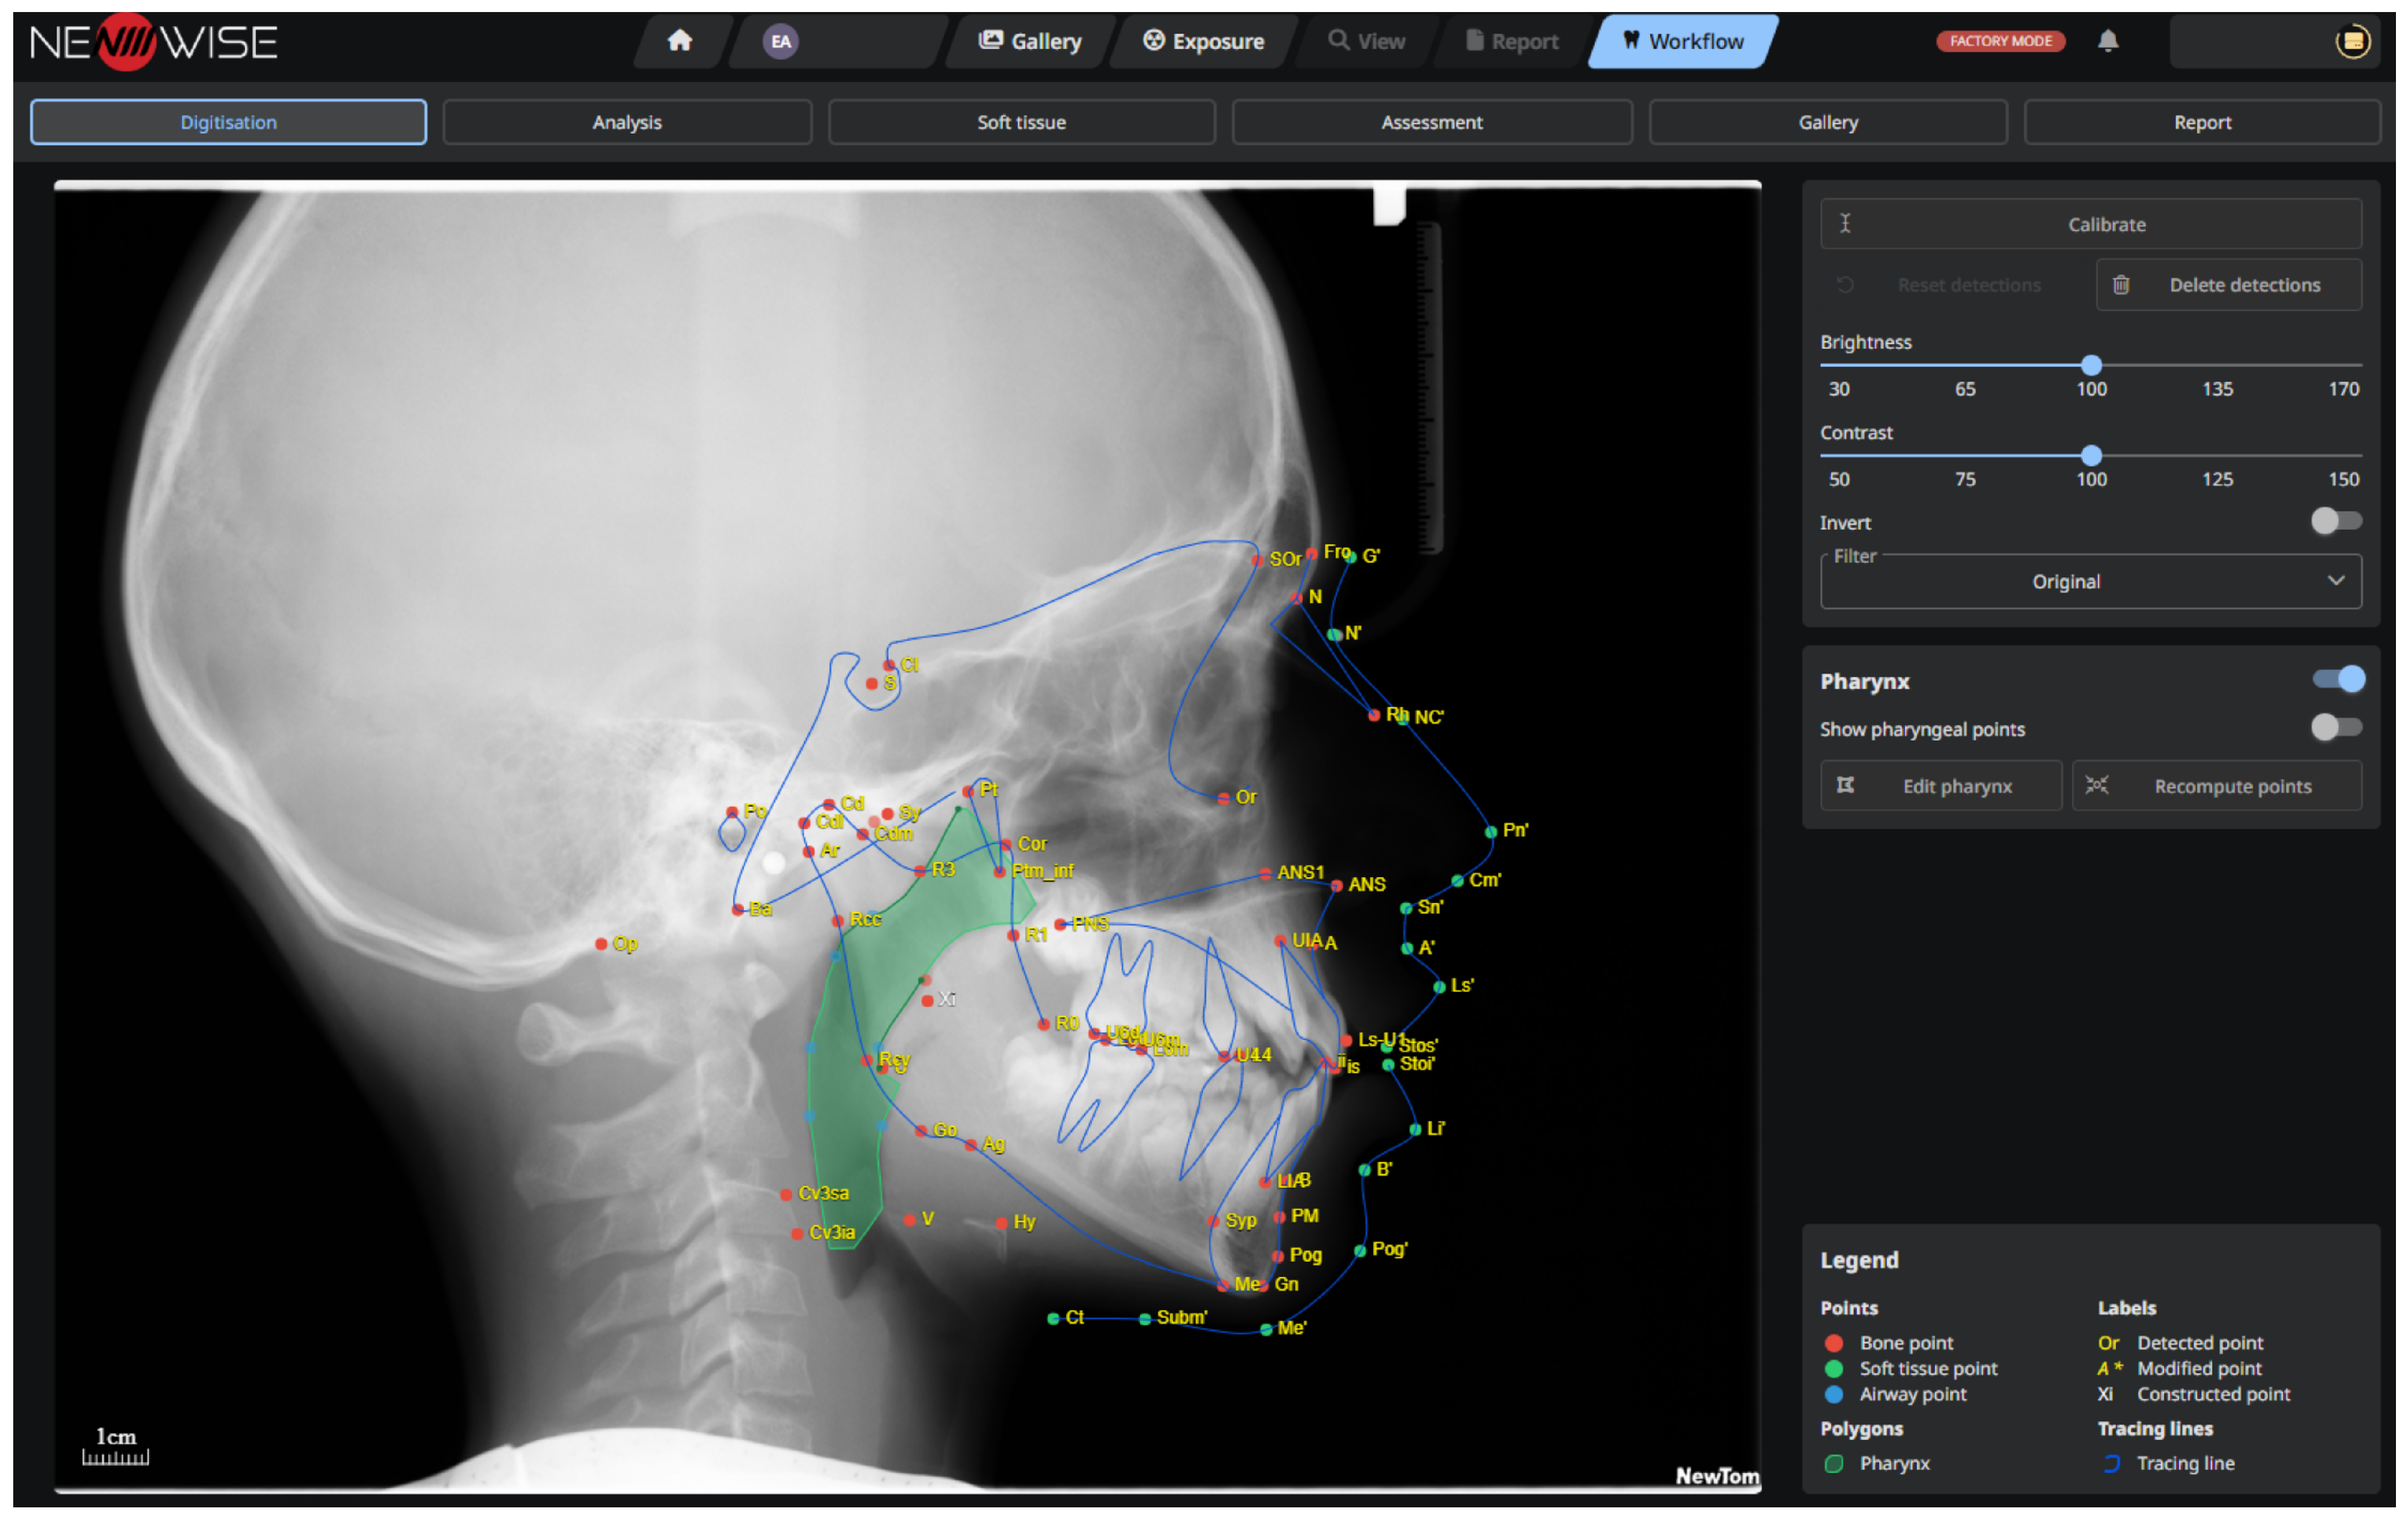
Representative examples of CEPH_2D outputs are shown in Figure 1 and Figure 2. These figures illustrate the automatic detection of cephalometric landmarks and pharyngeal airway segmentation on lateral cephalograms from patients with permanent and mixed dentition, respectively.

2.3. Metrics

As mentioned before, validation involves comparing the model’s predictions against the ground truth manual annotations using a range of established metrics commonly used:
  • Keypoint detection metrics assess the accuracy of the detected landmarks.
  • Segmentation metrics assess the accuracy of the detected pharynx segmentation.

2.3.1. Keypoint Detection Metrics

Mean Radial Error (MRE)
The mean radial error (MRE) measures the average Euclidean distance (radial error) in millimeters between the predicted points and the ground truth points. The radial error (R) of a point detected on the input image is as follows:
R = x p x 2 + y p y 2
where
  • xp, yp are the predicted coordinates;
  • x, y are the ground truth coordinates.
The MRE, along with the (corrected) standard deviation (std) for each landmark, is defined as follows:
M R E = I = 1 N R i N
s t d = I = 1 N R i M R E 2 N 1
where
  • N is the number of images;
  • Ri is the radial error on the i-th image.
COCO-mAP for Keypoints
COCO (Common Objects in Context) measures for keypoint detection are widely used to evaluate pose and keypoint detection algorithms [35]. MS-COCO proposed Object Keypoint Similarity (OKS) as a measure of similarity between two sets of keypoints.
Mathematically, the keypoint similarity (KSi) for keypoint i is given as
K S i = d i 2 2 s 2 k i 2
where
  • di is the Euclidean distance between the ground truth and predicted keypoint i;
  • k is the constant for keypoint i; in our tests, we set k = 0.001;
  • s is the scale of the ground truth object. s2 hence becomes the object’s segmented area.
Each ground truth annotated keypoint should have a visibility flag, which can take one of three values:
  • 0: unlabeled keypoint;
  • 1: labeled but not visible keypoint;
  • 2: labeled and visible keypoint.
The mathematical notation for OKS is given by
O K S = i K S i δ v i > 0 i δ v i > 0
where
  • KSi is the keypoint similarity for keypoint i;
  • vi is the ground truth visibility flag for keypoint i;
  • δ v i > 0 is the Dirac-delta function, which is computed as 1 if keypoint i is labeled, otherwise 0.
The primary COCO metric for keypoint detection is the mean Average Precision (mAP) for keypoints. This calculates the area under the precision-recall curve, averaged across different levels of OKS, which is a metric that evaluates the similarity between predicted keypoints and ground truth keypoints, normalized by object scale. COCO mAP for keypoints uses 10 OKS thresholds, ranging from 0.5 to 0.95 in steps of 0.05, providing a more detailed evaluation compared to the standard threshold of 0.5. A COCO mAP closer to 1.0 indicates better performance.
The COCO mAP for keypoints thus provides a comprehensive measure of performance in keypoints detection, considering not only accuracy but also the ability to detect keypoints across various similarity thresholds, object categories, and sizes.
Successful Detection Rate (SDR)
The SDR is a metric that measures the percentage of correctly identified points within a predefined error tolerance z. For each landmark, it is defined as
S D R z = N u m b e r   o f   c o r r e c t   i d e n t i f i c a t i o n s N u m b e r   o f   t o t a l   i d e n t i f i c a t i o n s 100  
Here, we consider three error tolerances: z = 1 mm, 2 mm, 3 mm, and 4 mm.

2.3.2. Segmentation Metrics

Mean Intersection over Union (IoU)
Intersection over Union (IoU) measures the degree of overlap between the predicted object and the corresponding ground truth object. It is calculated as the ratio between the area shared by the prediction and the reference annotation and the total area covered by their union. The IoU is defined as follows:
I o U = A r e a   o f   O v e r l a p A r e a   o f   U n i o n
Higher IoU values indicate a greater overlap between the prediction and the ground truth.
The mean Intersection over Union (mIoU) calculates the average IoU across all categories. The mIoU is defined as follows:
m I o U = 1 C i = 1 C T P i T P i + F P i + F N i
where
  • C is the number of categories.
  • TPi (true positive) indicates the pixels correctly assigned to class i, according to ground truth segmentation.
  • FPi (false positive) is the number of pixels incorrectly detected as belonging to category i, although they do not belong to that category in the ground truth segmentation.
  • TNi (true negative) is the number of pixels correctly detected as not belonging to class i, according to the ground truth segmentation.
  • FNi (false negative) is the number of pixels that belong to category i in the ground truth segmentation but were not detected by the system.
An IoU value of 1 indicates complete agreement between the predicted and ground truth segmentations. However, this value should be interpreted carefully when a category is absent from both the prediction and the ground truth, because this condition may also produce an IoU of 1 and therefore overestimate segmentation performance.
COCO mAP for Segmentation
COCO (Common Objects in Context) measures for segmentation are widely used to evaluate object detection and segmentation algorithms [35]. The key metrics include:
  • mean Average Precision (mAP): it is the area under the precision-recall curve averaged across different Intersection over Union (IoU) thresholds and across all categories. COCO mAP uses 10 IoU thresholds (from 0.5 to 0.95 in steps of 0.05) to provide a more detailed evaluation compared to the standard IoU threshold of 0.5.
The COCO mAP provides a robust measure of how well a segmentation system performs, taking into account not just the accuracy of object detection but also the precision at different recall levels and across multiple object classes and sizes.
Mean Dice
The Dice coefficient, also known as the Dice Similarity Coefficient (DSC) or F1-score, is used to evaluate the agreement between a predicted segmentation and the corresponding ground truth segmentation. It ranges from 0 to 1, where values closer to 1 indicate higher agreement between the two segmentations.
The DSC is defined as
D S C i = 2 T P i 2 T P i + F P i + F N i
The Mean Dice Score (mDSC) is calculated as the average of the Dice scores obtained across all categories. If C represents the number of categories, the formula is:
m D S C = 1 C i = 1 C D S C i
The mDSC provides an overall measure of segmentation performance across multiple categories. It reflects the balance between false-positive and false-negative pixels, with values closer to 1 indicating better segmentation quality.
Mean Precision
Mean precision (mPrecision) measures the proportion of pixels predicted as positive that actually belong to the corresponding category in the ground truth segmentation. It is defined as:
Mean Recall
Recall (mRecall, also known as sensitivity or true positive rate) measures how many of the actual positive pixels were correctly predicted. It focuses on the completeness of the predictions made by the model. The mRecall is defined as follows:
m R e c a l l = 1 C i = 1 C T P i T P i + F N i

3. Results

The model was evaluated on a dataset of 35 lateral cephalograms. The system’s average inference time was 2.557 ± 0.504 s. For the keypoint detection task, it achieved an MRE of 0.740 ± 0.793 mm. Additionally, the results show an SDR of 75.0%, 88.0%, 93.9%, and 96.5% for tolerance radii of 1, 2, 3, and 4 mm, respectively, indicating favorable performance within the present validation dataset. For pharynx segmentation, the mAP was 0.740 ± 0.040, and the mDSC was 0.935 ± 0.040, indicating favorable segmentation performance within the present validation dataset.
A detailed analysis of the keypoint detection and segmentation performance is presented in the subsequent subsections.

3.1. Keypoint Detection Results

Table 3 presents the MRE, mAP, and SDR (for 1, 2, 3, and 4 mm accuracy ranges) for keypoint detection. For each metric, values were computed per landmark across all images in the respective subgroup and then averaged across landmarks. The results show that the system achieved an MRE of 0.740 ± 0.793 mm. Moreover, it reached an SDR of 75.0%, 88.0%, 93.9%, and 96.5% for tolerance radii of 1, 2, 3, and 4 mm, respectively.
To assess the potential impact of age and sex on system performance, evaluation metrics were computed separately for age and sex subgroups. Table 4 and Table 5 show these results. Prior to group comparisons, normality was assessed using the Shapiro–Wilk test and homogeneity of variance using Levene’s test. Per-landmark MRE and SDR distributions were markedly non-normal in all subgroups (Shapiro–Wilk p < 0.05 for all); accordingly, Mann–Whitney U was applied for all these metrics in both the sex and age comparisons. For mAP, which is computed per image, normality was also violated in both groups; Mann–Whitney U was applied consistently throughout. The null hypothesis for each test was that there is no significant difference between the distributions of the respective subgroup performance metrics. The results indicate that there are no statistically significant performance differences between children (6–12 years) and individuals older than 13 years, or between males and females.
Additionally, Table 6 provides the mean radial error for each detected landmark, offering a detailed breakdown of the system’s accuracy at specific points. The most challenging landmarks to detect are Ba, Me, PNS, PSAS, and Rcc, with MRE values exceeding 2 mm, suggesting that these landmarks require careful clinical review to ensure accurate measurements.

3.2. Pharynx Segmentation Results

Table 7 presents the results for pharynx segmentation, with a mAP of 0.740 ± 0.040 and a mDSC of 0.935 ± 0.040.
To assess potential biases due to age and sex, evaluation metrics were computed for age and sex subgroups. Table 8 and Table 9 show these results. Prior to group comparisons, normality was assessed using the Shapiro–Wilk test and homogeneity of variance using Levene’s test. For the sex comparison (Table 8), the mAP, mDSC, mPrecision, and mRecall distributions violated normality in at least one group; Mann–Whitney U was applied for those metrics. For mIoU, all assumptions were satisfied, and a standard independent t-test was used. For the age comparison (Table 9), normality was violated in at least one group for all metrics; Mann–Whitney U was applied throughout.

4. Discussion

The null hypothesis for each test was that there is no significant difference between the distributions of the respective subgroup performance metrics.
The results indicate that there are no statistically significant differences in the performance of cephalometric landmarks between children (6–12 years) and individuals older than 13 years, or between males and females. These findings suggest that the CEPH_2D system maintains stable performance across the examined demographic groups.
Overall, the present study showed that CEPH_2D achieved good performance in both cephalometric landmark detection and pharyngeal airway segmentation on lateral cephalograms. In relation to landmark detection, the results appear to be consistent with those reported in previous studies on AI-assisted cephalometric analysis. Although direct comparisons among studies should be interpreted with caution because of differences in datasets, annotation protocols, number and definition of landmarks, and evaluation methods, CEPH_2D demonstrated a level of accuracy that is in line with the current literature. Kunz et al. [10] evaluated a fully automated cephalometric analysis based on a customized convolutional neural network and reported that CNN-based approaches may provide reliable support for automated landmark identification. Park et al. [12] compared two deep learning object detection models, YOLOv3 and SSD, for automated cephalometric landmark detection, showing that YOLOv3 achieved better performance in terms of both accuracy and processing speed. This is relevant to the present study because CEPH_2D was also designed to combine diagnostic accuracy with a rapid processing time suitable for clinical workflow integration. Qian et al. [13] proposed CephANN, a multi-head attention neural network developed to improve the localization of cephalometric landmarks, highlighting the role of increasingly specialized neural network architectures in this field. Popova et al. [14] investigated the influence of growth-related anatomical structures and fixed orthodontic appliances on automated landmark recognition using a customized convolutional neural network. Their study is particularly relevant to the present validation because CEPH_2D was assessed in both mixed and permanent dentition, allowing the evaluation of system performance across different developmental stages. Taken together, these studies support the growing evidence that AI-based systems may provide useful support for cephalometric analysis, although clinician supervision remains necessary, especially for landmarks showing higher detection errors.
A similar consideration applies to pharyngeal airway segmentation. CEPH_2D showed high agreement with the reference annotations, suggesting that it may represent a useful support tool for the automated analysis of the nasopharynx, oropharynx, and hypopharynx on lateral cephalograms. This is particularly relevant in OSAS-related assessment, where the evaluation of upper airway morphology on lateral cephalograms may contribute to a more standardized radiographic analysis. Although two-dimensional imaging does not replace volumetric assessment when this is clinically indicated, the present findings suggest that CEPH_2D may have potential applicability as an adjunctive tool in OSAS-oriented airway evaluation.
The present study was conducted with a structured validation process, particularly in the construction of the testing dataset. The dataset was prepared with careful attention to detail, involving two experienced clinicians who fulfilled complementary roles as annotator and reviewer. This dual-review protocol helped minimize bias and improve the consistency of the ground truth data, which served as the benchmark for evaluating the system’s performance. Manual annotations, performed using CVAT, were systematically reviewed and cross-validated for adherence to established anatomical guidelines. Quality control checks addressed issues related to image resolution and segmentation consistency, helping to ensure that the dataset was comprehensive and reflective of real-world clinical scenarios. The performance validation was conducted on standard clinic-grade hardware, demonstrating its potential suitability for routine use without requiring specialized equipment. This suggests that CEPH_2D may be integrated into typical clinical workflows, supporting its potential practicality in everyday settings.
CEPH_2D demonstrated consistent accuracy across various demographic subgroups, with no statistically significant differences in performance observed based on age or sex. These findings suggest potential applicability across diverse patient profiles, including children with mixed dentition, a category that may be more challenging for automated systems. The computational efficiency of CEPH_2D may also support its integration into clinical workflows. With an average processing time of 2.557 ± 0.504 s, the system showed rapid performance compatible with routine clinical settings. Its compatibility with standard imaging hardware may further facilitate its use in diagnostic and treatment planning processes, saving time and reducing the clinician’s workload.
These results suggest that CEPH_2D may help address some limitations of manual and semi-automated methods, such as variability in accuracy and the time required for analysis. By providing automated support, CEPH_2D may contribute to the level of precision required for orthodontic and obstructive sleep apnea syndrome evaluations. Considering that AI is increasingly being implemented in dental protocols, in areas such as smartphone-based tools, tooth shade assessment, brushing monitoring, pediatric behavior support, orthognathic outcome prediction, and AI-enhanced CBCT image analysis for nano-orthodontic diagnosis and treatment [36,37,38,39,40,41,42,43,44], further research is warranted to better define and expand its clinical applications.
Some limitations should also be acknowledged. First, the present validation was performed on a relatively limited testing dataset of 35 lateral cephalograms from a single center, which limits statistical power and may reduce the generalizability of the findings to broader and more diverse clinical populations. Although the dataset included both sexes, a broad age range, mixed and permanent dentition, and different clinical conditions, external validation on larger, multicenter, and geographically diverse cohorts is required to confirm these results.
Second, certain landmarks, including Ba, Me, PNS, PSAS, and Rcc, exhibited MRE values above 2 mm, indicating that clinician verification remains advisable for these points before final clinical interpretation or treatment planning. These errors are probably related to anatomical complexity, landmark definition, image acquisition variability, model-related limitations, and the intrinsic limitations of two-dimensional projection imaging. Ba is located in an area affected by complex bony superimposition from the petrous portions of the temporal bones. Me may be influenced by individual variations in chin morphology. PNS is a small and variable bony projection at the posterior limit of the hard palate and may overlap with adjacent palatal and nasal structures, developing teeth, and palatal arch anatomy. PSAS is a soft-tissue landmark related to the soft palate and lacks a discrete osseous reference; its localization may therefore be affected by soft-tissue contrast variability and by the reproducibility of manual landmark definition. Rcc is located along the posterior border of the mandibular ramus and may be influenced by patient positioning during acquisition because misalignment can generate overlapping right and left mandibular ramus outlines on lateral cephalograms. These factors may explain the higher localization variability observed for these landmarks.
Third, formal inter-observer and intra-observer reliability metrics were not computed for the ground truth annotations. Although the annotation and review workflow was designed to improve consistency, future studies should quantify annotation reliability using dedicated agreement metrics. In addition, because this independent validation was conducted without access to the original training dataset or full implementation details, the size, source, diversity, and annotation process of the training data could not be evaluated.
Fourth, although all radiographs were acquired using the same imaging platform under routine clinical conditions, minor variability in acquisition conditions and image characteristics representative of routine clinical workflows was present across the dataset. Detailed exposure parameters, image resolution, and calibration information were not available for all radiographs; however, this reflects the retrospective and real-world nature of the validation dataset. Future studies should include more standardized acquisition metadata to further assess the influence of imaging parameters on AI performance.
Fifth, although the age stratification was based on dental development stage, the permanent dentition group included a broad age range from 13 to 65 years. This may have masked age-related anatomical or imaging differences among adolescents, young adults, and older adults. Future studies with larger samples should consider more detailed age stratification.
Finally, because the analysis was based on two-dimensional lateral cephalograms, the results should be interpreted within the intrinsic limitations of 2D imaging, especially for OSAS-oriented airway assessment.
Further studies are warranted to validate these findings in broader clinical settings and to better define the potential applications of CEPH_2D in routine practice.

5. Conclusions

Within the limitations of the present study, CEPH_2D showed promising performance in automatic cephalometric landmark detection and pharyngeal airway segmentation on lateral cephalograms. The system demonstrated rapid processing time and stable performance across the examined age and sex subgroups, suggesting potential usefulness as an adjunctive tool in orthodontic and obstructive sleep apnea syndrome-related radiographic assessment. However, clinician verification remains necessary before automated outputs are used for clinical interpretation or treatment planning, particularly for landmarks showing higher detection errors. Larger, multicenter, externally validated studies are required to confirm these findings and to compare CEPH_2D with other available AI-based systems.

Author Contributions

Conceptualization, G.C., G.S. and M.C.; methodology, G.C., M.P. and A.S.; software, G.C. and G.S.; validation, G.C. and A.S.; formal analysis, A.S., G.C. and M.C.; investigation, G.C. and M.C.; resources, G.S. and M.C.; data curation, G.C., G.B. and A.S.; writing—original draft preparation, G.C., S.D.G. and M.P.; writing—review and editing, S.D.G., M.P. and A.S.; visualization, G.C., G.B. and A.S.; supervision, G.C., M.C. and A.S.; project administration, G.C., G.S. and M.C.; funding acquisition, G.S. and M.C. All authors have read and agreed to the published version of the manuscript.

Funding

This research received no external funding.

Institutional Review Board Statement

The study was conducted in accordance with the Declaration of Helsinki and approved by the Unit Internal Review Board (approval number: 2025-1029, approval date: 20 October 2025).

Informed Consent Statement

Informed consent was obtained from all subjects involved in the study. Written informed consent has been obtained from the patients to publish this paper.

Data Availability Statement

Data are contained within the article.

Conflicts of Interest

Authors Gaetano Scaramozzino and Giuseppe Cota are employed in Scaramozzino Dental Practice. The remaining authors declare that the research was conducted in the absence of any commercial or financial relationships that could be construed as a potential conflict of interest.

Abbreviations

The following abbreviations are used in this manuscript:
OSASObstructive Sleep Apnea Syndrome
AIArtificial Intelligence
CNNConvolutional Neural Network
MREMean Radial Error
RRadial Error
StdStandard Deviation
COCOCommon Objects in Context
OKSObject Keypoint Similarity
KSKeypoint Similarity
mAPmean Average Precision
SDRSuccessful Detection Rate
IoUIntersection over Union
mIoUmean Intersection over Union
DSCDice Similarity Coefficient
mDSCmean Dice Score

References

  1. Ristau, B.; Coreil, M.; Chapple, A.; Armbruster, P.; Ballard, R. Comparison of AudaxCeph®’s fully automated cephalometric tracing technology to a semi-automated approach by human examiners. Int. Orthod. 2022, 20, 100691. [Google Scholar] [CrossRef]
  2. Kılınç, D.D.; Kırcelli, B.H.; Sadry, S.; Karaman, A. Evaluation and comparison of smartphone application tracing, web based artificial intelligence tracing and conventional hand tracing methods. J. Stomatol. Oral Maxillofac. Surg. 2022, 123, e906–e915. [Google Scholar] [CrossRef]
  3. Çoban, G.; Öztürk, T.; Hashimli, N.; Yağci, A. Comparison between cephalometric measurements using digital manual and web-based artificial intelligence cephalometric tracing software. Dent. Press J. Orthod. 2022, 27, e222112. [Google Scholar] [CrossRef]
  4. Sin, Ç.; Akkaya, N.; Aksoy, S.; Orhan, K.; Öz, U. A deep learning algorithm proposal to automatic pharyngeal airway detection and segmentation on CBCT images. Orthod. Craniofac. Res. 2021, 24, 117–123. [Google Scholar] [CrossRef]
  5. Meng, X.; Mao, F.; Mao, Z.; Xue, Q.; Jia, J.; Hu, M. Multi-stage Unet segmentation and automatic measurement of pharyngeal airway based on lateral cephalograms. J. Dent. 2023, 136, 104637. [Google Scholar] [CrossRef]
  6. Cota, G.; Scaramozzino, G.; Chiesa, M.; Gennaro, L.; Pascadopoli, M.; Scribante, A.; Colombo, M. Performance Validation of ORTHOSEG, a Novel Artificial Intelligence Tool for the Segmentation of Orthopantomographs and Intra-Oral X-Rays. Clin. Pract. 2026, 16, 54. [Google Scholar] [CrossRef]
  7. Lindner, C.; Cootes, T.F. Fully automatic cephalometric evaluation using random forest regression-voting. In Proceedings of the IEEE International Symposium on Biomedical Imaging (ISBI), Brooklyn, NY, USA, 16–19 April 2015. [Google Scholar]
  8. Qian, J.; Cheng, M.; Tao, Y.; Lin, J.; Lin, H. CephaNet: An improved faster R-CNN for cephalometric landmark detection. In Proceedings of the 2019 IEEE 16th International Symposium on Biomedical Imaging (ISBI 2019), Venice, Italy, 8–11 April 2019; IEEE: New York, NY, USA, 2019; pp. 868–871. [Google Scholar] [CrossRef]
  9. Song, Y.; Qiao, X.; Iwamoto, Y.; Chen, Y. Automatic cephalometric landmark detection on X-ray images using a deep-learning method. Appl. Sci. 2020, 10, 2547. [Google Scholar] [CrossRef]
  10. Kunz, F.; Stellzig-Eisenhauer, A.; Zeman, F.; Boldt, J. Artificial intelligence in orthodontics: Evaluation of a fully automated cephalometric analysis using a customized convolutional neural network. J. Orofac. Orthop. 2020, 81, 52–68. [Google Scholar] [CrossRef]
  11. Cubuk, E.D.; Zoph, B.; Shlens, J.; Le, Q.V. RandAugment: Practical automated data augmentation with a reduced search space. In Proceedings of the 2020 IEEE/CVF Conference on Computer Vision and Pattern Recognition Workshops (CVPRW), Seattle, WA, USA, 14–19 June 2020; IEEE: New York, NY, USA, 2020; pp. 3008–3017. [Google Scholar] [CrossRef]
  12. Park, J.H.; Hwang, H.W.; Moon, J.H.; Yu, Y.; Kim, H.; Her, S.B.; Srinivasan, G.; Aljanabi, M.N.A.; Donatelli, R.E.; Lee, S.J. Automated identification of cephalometric landmarks: Part 1-Comparisons between the latest deep-learning methods YOLOv3 and SSD. Angle Orthod. 2019, 89, 903–909. [Google Scholar] [CrossRef] [PubMed]
  13. Qian, J.; Luo, W.; Cheng, M.; Tao, Y.; Lin, J.; Lin, H. CephANN: A multi-head attention network for cephalometric landmark detection. IEEE Access 2020, 8, 112633–112641. [Google Scholar] [CrossRef]
  14. Popova, T.; Stocker, T.; Khazaei, Y.; Malenova, Y.; Wichelhaus, A.; Sabbagh, H. Influence of growth structures and fixed appliances on automated cephalometric landmark recognition with a customized convolutional neural network. BMC Oral Health 2023, 23, 274. [Google Scholar] [CrossRef]
  15. Mohan, A.; Sivakumar, A.; Nalabothu, P. Evaluation of accuracy and reliability of OneCeph digital cephalometric analysis in comparison with manual cephalometric analysis-a cross-sectional study. BDJ Open 2021, 7, 22. [Google Scholar] [CrossRef]
  16. Jiang, Y.; Al-Mohana, R.A.A.M.; Jiang, C.; Zhang, X.; Shi, B.; Wu, Y.; Wang, X.; Huang, J.; Huang, X.; Lin, L.; et al. Clinical accuracy of cephalometric analysis using deep learning-based automated landmark identification on CBCT in class I and class II malocclusions. Sci. Rep. 2026, 16, 10283. [Google Scholar] [CrossRef]
  17. Lu, G.; Wang, X.; Xie, M.; Lin, X.; Zhu, B.; Wei, Y.; Zhang, B.; Du, J.; Wu, F.; Shu, H. Bi-level alignment with super-resolution head for unsupervised cephalometric landmark localization. Phys. Med. Biol. 2026, 71, 025007. [Google Scholar] [CrossRef] [PubMed]
  18. Zhang, Z.; Liu, N.; Hu, Z.; Guo, Z.; Jin, W.; Yan, C. Age estimation of the cervical vertebrae region using deep learning. Bioengineering 2025, 13, 7. [Google Scholar] [CrossRef] [PubMed]
  19. Bk, R.; P, S.; Patil, P.; Krishnamurthy, A.; Dr, M.; S, D. Development and validation of an artificial intelligence algorithm for cervical vertebral maturation staging using lateral cephalograms. Med. J. Armed Forces India 2025, 81, 672–679. [Google Scholar] [CrossRef]
  20. Kim, S.; Shin, J.; Lee, E.; Park, S.; Jeong, T.; Hwang, J.; Seo, H. Comparative analysis of deep-learning-based bone age estimation between whole lateral cephalometric and the cervical vertebral region in children. J. Clin. Pediatr. Dent. 2024, 48, 191–199. [Google Scholar] [CrossRef] [PubMed]
  21. Alam, M.K.; Hajeer, M.Y.; Abahussain, R.N.; Algadri, R.A.; Alamri, D.M.; Rashid, M.E. Comparative evaluation of craniofacial growth patterns using AI-driven longitudinal cephalometric superimpositions in adolescents. J. Pharm. Bioallied Sci. 2025, 17, S3280–S3282. [Google Scholar] [CrossRef] [PubMed]
  22. Zhao, L.; Huang, J.; Tang, M.; Zhang, X.; Xiao, L.; Tao, R. Evaluation of an automatic cephalometric superimposition method based on feature matching. J. Imaging Inform. Med. 2025, 38, 4138–4147. [Google Scholar] [CrossRef]
  23. Özel, M.B.; Kartbak, S.B.A.; Çakmak, M. Classification performance of deep learning models for the assessment of vertical dimension on lateral cephalometric radiographs. Diagnostics 2025, 15, 2240. [Google Scholar] [CrossRef]
  24. Tarce, M.; Zhou, Y.; Antonelli, A.; Becker, K. The application of artificial intelligence for tooth segmentation in CBCT images: A systematic review. Appl. Sci. 2024, 14, 6298. [Google Scholar] [CrossRef]
  25. Bayrakdar, I.S.; Bilgir, E.; Kuran, A.; Celik, O.; Orhan, K. Artificial intelligence in panoramic radiography interpretation: A glimpse into the state-of-the-art radiologic examination method. Int. J. Comput. Dent. 2025, 28, 309–321. [Google Scholar] [CrossRef] [PubMed]
  26. Esmaeili, M.; Dalili, Z.; Sadr, H.; Mousavie, A.; Faghihi, A.; Saei, R.; Nazari, M. Hierarchical attention mechanism combined with deep neural networks for accurate semantic segmentation of dental structures in panoramic radiographs. Sci. Rep. 2025, 15, 38725. [Google Scholar] [CrossRef]
  27. Kim, E.; Hwang, J.J.; Cho, B.H.; Lee, E.; Shin, J. Classification of presence of missing teeth in each quadrant using deep learning artificial intelligence on panoramic radiographs of pediatric patients. J. Clin. Pediatr. Dent. 2024, 48, 76–85. [Google Scholar] [CrossRef]
  28. Uzel, İ.; Ghabchi, B.; Çoğulu, D. Deep learning-based automated detection of supernumerary teeth in pediatric panoramic radiographs. PLoS ONE 2025, 20, e0335845. [Google Scholar] [CrossRef]
  29. Zhong, T.; Ning, Y.; Wu, X.; Ye, L.; Li, C.; Zhang, Y.; Du, Y. TIPs: Tooth instance and pulp segmentation based on hierarchical extraction and fusion of anatomical priors from cone-beam CT. Artif. Intell. Med. 2025, 169, 103247. [Google Scholar] [CrossRef]
  30. Kim, H.; Song, J.S.; Shin, T.J.; Kim, Y.J.; Kim, J.W.; Jang, K.T.; Hyun, H.K. Image segmentation of impacted mesiodens using deep learning. J. Clin. Pediatr. Dent. 2024, 48, 52–58. [Google Scholar] [CrossRef]
  31. Tunç, H.; Akkaya, N.; Aykanat, B.; Ünsal, G. U-Net-based deep learning for simultaneous segmentation and agenesis detection of primary and permanent teeth in panoramic radiographs. Diagnostics 2025, 15, 2577. [Google Scholar] [CrossRef]
  32. Salehizeinabadi, M.; Neghab, S.; Ameli, N.; Baghi, K.K.; Pacheco-Pereira, C. Automated classification of dental caries in bitewing radiographs using machine learning and the ICCMS framework. Int. J. Dent. 2025, 2025, 6644310. [Google Scholar] [CrossRef]
  33. Rasnayaka, S.; Leuke Bandara, D.; Jayasundara, A.; Jayasinghe, R.; Wimalasiri, C.; Rathnayake, P.; Wijerathne, S.; Ragel, R.; Thambawita, V.; Nawinne, I. DenPAR: Annotated intra-oral periapical radiographs dataset for machine learning. Sci. Data 2025, 12, 1615. [Google Scholar] [CrossRef]
  34. Assiri, H.A.; Alsaanah, B.K.; Alshahrani, B.; Alassiri, S.; Almubarak, H.; Alqarni, A.; Hameed, M.S.; Assiri, Z.; Assiri, B. Artificial intelligence performance in maxillary canine impaction: A systematic review. Eur. J. Med. Res. 2026, 31, 276. [Google Scholar] [CrossRef] [PubMed]
  35. COCO—Common Objects in Context. Available online: https://cocodataset.org/#detection-eval (accessed on 15 November 2024).
  36. Pascadopoli, M.; Zampetti, P.; Nardi, M.G.; Pellegrini, M.; Scribante, A. Smartphone applications in dentistry: A scoping review. Dent. J. 2023, 11, 243. [Google Scholar] [CrossRef]
  37. Zilpilwar, N.; Nimonkar, S.; Godbole, S.; Belkhode, V. Efficacy of artificial intelligence-assisted appliances in the selection of tooth shade: Protocol for an observational study. JMIR Res. Protoc. 2025, 14, e68160. [Google Scholar] [CrossRef]
  38. Wang, T.; Chen, H.; Song, G.; Han, B. Traditional and artificial intelligent methods in predicting maxillofacial soft tissue morphology after orthognathic surgery: A narrative review. Int. J. Dent. 2025, 2025, 6268492. [Google Scholar] [CrossRef] [PubMed]
  39. Jeong, J.S.; Kim, K.S.; Gu, Y.; Yang, L.Y.; Yoon, D.H.; Wang, L.; Zhang, M.; Kim, J.H. Evaluation of VITA shade-based tooth color categories using deep learning. Sci. Rep. 2025, 15, 40098. [Google Scholar] [CrossRef]
  40. Vitale, M.C.; Pascadopoli, M.; Zampetti, P.; Balbi, A.; Scribante, A. Reducing dental anxiety in children through tell-show-do technique vs. additional instructions with an artificial intelligence-based animated video: Randomized clinical trial. J. Clin. Pediatr. Dent. 2025, 49, 38–46. [Google Scholar] [CrossRef]
  41. Acharya, S.; Godhi, B.S.; Saxena, V.; Assiry, A.A.; Alessa, N.A.; Dawasaz, A.A.; Alqarni, A.; Karobari, M.I. Role of artificial intelligence in behavior management of pediatric dental patients: A mini review. J. Clin. Pediatr. Dent. 2024, 48, 24–30. [Google Scholar] [CrossRef]
  42. Wang, H.C.; Li, J.H.; Lin, Y.C.; Lin, C.Y.; Liu, C.P.; Lin, T.H.; Chan, C.T.; Hsieh, C.Y. Machine learning-based toothbrushing region recognition using smart toothbrush holder and wearable sensors. Biosensors 2025, 15, 798. [Google Scholar] [CrossRef]
  43. Efitli, E.; Karcioglu, A.A.; Ozdogan, A.; Karatas, F.; Senocak, T. Tooth color prediction in intraoral images under different clinical lights using ML algorithms and CLAHE technique: An in vivo study. Lasers Med. Sci. 2025, 40, 411. [Google Scholar] [CrossRef]
  44. Tavazozadeh, E.; Shakour, N.; Mohajerani, R.; Farhadtouski, K.; Jamilian, A.; Nasiri, K. Revolutionizing Nano-Orthodontic Diagnosis and Treatment through AI-Enhanced CBCT Image Analysis: New Frontiers in Deep Learning. Nanomed. Res. J. 2025, 10, 243–249. [Google Scholar] [CrossRef]
Figure 1. Anatomical landmarks and the pharynx area detected by CEPH_2D on a patient with permanent dentition as they are rendered in the Neowise software.
Oral 06 00071 g001
Figure 2. Anatomical landmarks and the pharynx area detected by CEPH_2D on a patient with mixed dentition as they are rendered in the Neowise software.
Oral 06 00071 g002
Table 1. Distribution of lateral cephalograms for system evaluation (testing dataset) by age and sex.
PopulationSystem Evaluation (Test) Dataset-NSystem Evaluation (Test) Dataset-%
SexMale1851.43%
Female1748.57%
Age6–12 (mixed dentition)1440.00%
13–65 (permanent dentition)2160.00%
Table 2. Distribution of lateral cephalograms for system evaluation (testing dataset) by finding.
ConditionSystem Evaluation (Test) Dataset-NSystem Evaluation (Test) Dataset-%
Splint514.29%
Filling617.14%
Crown25.71%
Canal treatment25.71%
Missing or extracted teeth38.57%
Table 3. Evaluation results for keypoint detection from lateral cephalograms.
MetricMeanStd
MRE0.740.79
mAP0.790.09
SDR % 1 mm74.9926.55
SDR % 2 mm87.9916.93
SDR % 3 mm93.9110.25
SDR % 4 mm96.487.09
Table 4. Evaluation results for keypoint detection from lateral cephalograms grouped by sex.
MetricMaleFemaleTestp-Value
MeanStdMeanStd
MRE0.780.800.700.83Mann–Whitney0.418
mAP0.780.080.810.10Mann–Whitney0.303
SDR % 1 mm73.9827.3576.0426.96Mann–Whitney0.838
SDR % 2 mm87.1817.8888.8317.71Mann–Whitney0.553
SDR % 3 mm93.2310.9894.6311.04Mann–Whitney0.261
SDR % 4 mm95.817.9497.197.03Mann–Whitney0.093
Table 5. Evaluation results for keypoint detection from lateral cephalograms grouped by age.
MetricAge 6–12Age 13–65Testp-Value
MeanStdMeanStd
MRE0.720.870.750.77Mann–Whitney0.692
mAP0.790.070.790.10Mann–Whitney0.859
SDR % 1 mm75.5728.6374.6026.00Mann–Whitney0.653
SDR % 2 mm87.9918.9687.9916.65Mann–Whitney0.498
SDR % 3 mm94.1012.3193.799.98Mann–Whitney0.268
SDR % 4 mm96.798.5396.276.88Mann–Whitney0.079
Table 6. Evaluation results for each keypoint detected from lateral cephalograms.
PointsRadial Error
Mean
Radial Error
Std
Metric SDR %
1 mm
Metric
SDR %
2 mm
Metric
SDR %
3 mm
Metric
SDR %
4 mm
A0.980.6960.0091.40100.00100.00
A’0.200.3794.30100.00100.00100.00
Ar1.571.3940.0074.3088.6091.40
B0.910.6854.3097.10100.00100.00
Ba2.521.9025.7045.7065.7074.30
Cv3sa0.520.4188.6097.10100.00100.00
Cv3ia0.853.2994.3094.3094.3094.30
Cl0.140.2697.10100.00100.00100.00
Cm’0.150.2297.10100.00100.00100.00
Cd0.541.0380.0085.7097.10100.00
Cdl0.490.9780.0091.4094.30100.00
Cdm0.631.0974.3091.4094.3097.10
Cor0.471.1082.9085.7094.3097.10
Ag0.150.4594.3097.10100.00100.00
Ct0.321.3397.1097.10100.00100.00
NC’0.010.02100.00100.00100.00100.00
Fro1.302.7571.4085.7088.6088.60
G’0.120.3394.30100.00100.00100.00
Gn0.710.3677.10100.00100.00100.00
Go1.350.9542.9074.3094.30100.00
Hy1.491.2642.9080.0091.4091.40
ii0.730.4868.60100.00100.00100.00
is0.700.4271.40100.00100.00100.00
Li’0.050.10100.00100.00100.00100.00
Me’0.140.55100.00100.00100.00100.00
Me2.381.1811.4034.3071.4094.30
L6d0.130.5194.3097.10100.00100.00
L6m0.110.3494.30100.00100.00100.00
U6d0.441.3688.6091.4091.4094.30
U6m1.852.3831.4085.7085.7088.60
N1.000.8360.0091.4097.1097.10
Rh0.060.3497.1097.10100.00100.00
N’0.220.4794.30100.00100.00100.00
Op0.020.10100.00100.00100.00100.00
Or1.821.8134.3068.6085.7091.40
SOr1.601.1537.1062.9085.7097.10
U1.521.2731.4082.9094.3094.30
Pog’0.070.08100.00100.00100.00100.00
Pog0.080.13100.00100.00100.00100.00
PM0.100.2897.10100.00100.00100.00
Pn’1.351.2142.9068.6094.3097.10
Po1.941.4631.4045.7088.6094.30
Rcv0.691.4074.3088.6091.4097.10
L41.021.7065.7080.0091.4094.30
U40.481.5191.4097.1097.1097.10
PSAS3.362.6317.1040.0051.4062.90
Pt0.370.7582.9094.3097.10100.00
Ptm_inf0.120.3494.30100.00100.00100.00
R00.210.9194.3097.1097.1097.10
R10.080.4997.1097.10100.00100.00
R30.080.4497.1097.10100.00100.00
Rcc2.242.7754.3054.3062.9071.40
LIA0.030.2097.10100.00100.00100.00
UIA0.090.4094.3097.10100.00100.00
S0.490.3885.70100.00100.00100.00
Syp0.110.4897.1097.10100.00100.00
B’0.040.18100.00100.00100.00100.00
Subm’0.150.5594.3097.10100.00100.00
Sn’0.200.3597.10100.00100.00100.00
ANS1.020.8260.0088.6097.10100.00
ANS10.430.9982.9088.6094.30100.00
PNS2.682.4837.1048.6065.7077.10
Stoi’0.090.2697.10100.00100.00100.00
Stos’0.030.13100.00100.00100.00100.00
Sy2.131.3017.1057.1077.1091.40
Sy21.741.4128.6068.6077.1094.30
Ls’0.090.4197.1097.10100.00100.00
Ls-U10.120.3894.30100.00100.00100.00
V1.251.1857.1077.1088.6094.30
Table 7. Evaluation results for pharynx segmentation from lateral cephalograms.
MetricMeanStd
mAP0.740.04
mIoU0.880.07
mDSC0.940.04
mPrecision0.950.03
mRecall0.920.07
Table 8. Evaluation results for pharynx segmentation from lateral cephalograms grouped by sex.
MetricMaleFemaleTestp-Value
MeanStdMeanStd
mAP0.750.030.730.04Mann-Whitney0.255
mIoU0.890.060.870.08t-test0.359
mDSC0.940.030.930.05Mann-Whitney0.541
mPrecision0.940.020.950.04Mann-Whitney0.067
mRecall0.940.050.910.08Mann-Whitney0.347
Table 9. Evaluation results for pharynx segmentation from lateral cephalograms grouped by age.
MetricAge 6–12Age 13–65Testp-Value
MeanStdMeanStd
mAP0.730.040.750.03Mann-Whitney0.490
mIoU0.890.070.870.07Mann-Whitney0.354
mDSC0.940.040.930.04Mann-Whitney0.354
mPrecision0.960.030.940.03Mann-Whitney0.066
mRecall0.930.070.920.06Mann-Whitney0.449
Disclaimer/Publisher’s Note: The statements, opinions and data contained in all publications are solely those of the individual author(s) and contributor(s) and not of MDPI and/or the editor(s). MDPI and/or the editor(s) disclaim responsibility for any injury to people or property resulting from any ideas, methods, instructions or products referred to in the content.