Article

Finite Element Analysis of Stress Distribution in Monolithic High-Translucency Zirconia Dental Prostheses

by
Fernando Araújo da Costa Ward
1,
Luciano Pessanha Moreira
1,
Pedro Araújo da Costa Ward
1,
Paula Cipriano da Silva
1,
Manuel Fellipe Rodrigues Pais Alves
2,* and
Claudinei Santos
2
1
Escola de Engenharia Industrial Metalúrgica de Volta Redonda, Universidade Federal Fluminense, UFF/EEIMVR, Volta Redonda 27.255-125, RJ, Brazil
2
Faculdade de Tecnologia de Resende UERJ/FAT, Universidade do Estado do Rio de Janeiro, Resende 27.537-000, RJ, Brazil
*
Author to whom correspondence should be addressed.
Submission received: 1 December 2024 / Revised: 2 January 2025 / Accepted: 5 February 2025 / Published: 3 March 2025

Abstract

:
Background/Objectives: High-translucency zirconia is a dental ceramic offering excellent aesthetic results but with mechanical limitations restricting its applications. This study aimed to simulate the mechanical behavior of anatomical dental prostheses made from high-translucency zirconia using the finite element method (FEM) to assess the material’s reliability. Methods: Samples of high-translucency zirconia were compacted, sintered, and characterized for relative density. Structural and microstructural analyses were performed using X-ray diffraction (XRD) and scanning electron microscopy (SEM). Its mechanical properties, including hardness, fracture toughness, and flexural strength, were measured. Additionally, elastic parameters such as Young’s modulus and Poisson’s ratio were determined using the impulse excitation technique and subsequently employed in numerical simulations under various masticatory loads (50 to 500 N). These simulations modeled an anatomical molar (tooth 26) using the HyperMesh and ABAQUS codes, applying loads from three directions: vertical, angular (45°), and horizontal, at different points on the prosthesis. Results: The sintered zirconia ceramics exhibited excellent densification and a microstructure composed of cubic and tetragonal grains (c-ZrO2 and t-ZrO2). The measured properties included a hardness of 1315 ± 48 HV, fracture toughness of 3.7 ± 0.2 MPam1/2, and flexural strength of 434 ± 67 MPa. Elastic parameters were determined as a Young’s modulus of 192.2 ± 4.8 GPa and a Poisson’s ratio of 0.31. Numerical simulations demonstrated that vertically applied loads of 500 N resulted in a maximum stress of approximately 299.2 MPa, horizontal stress reached 320.8 MPa at a 200 N load, and angular stress peaked at 447.3 MPa under a 350 N load. These findings indicate that the material can safely withstand these conditions without failure. Conclusions: Within the limits of this investigation, the methodology proved to be an effective tool for predicting the mechanical behavior of new dental ceramics. For high-translucency zirconia, the material demonstrated high reliability under masticatory vertical loads up to 500 N, angular loads up to 350 N, and horizontal loads up to 200 N.

1. Introduction

In restorative dentistry, advancements in manufacturing technologies, particularly those involving digital systems, have revolutionized the design and production of customized dental prostheses. Techniques such as Computer-Aided Design/Computer-Aided Machining (CAD/CAM) and additive manufacturing (AM) enable high precision and dimensional accuracy in creating prosthetic components with complex geometries [1,2]. These innovations are pivotal in producing dental prostheses that closely mimic natural tooth structures and improve patient outcomes [3].
Among the materials used in dental restorations, zirconia ceramics have emerged as a gold standard because of their superior mechanical properties, biocompatibility, and aesthetic quality [4,5,6]. Yttria-stabilized tetragonal zirconia polycrystals (Y-TZP) are particularly notable for their high strength and transformation toughening mechanism [7,8,9,10]. However, limitations such as susceptibility to hydrothermal degradation and moderate translucency have led to the development of partially yttria-stabilized zirconia (Y-PSZ), which offers enhanced optical properties and satisfactory mechanical strength [11,12,13,14,15].
In restorative dentistry, ceramic materials used specifically as dental prostheses are classified by their mechanical properties according to the ISO 6872-15 standard [16]. According to their mechanical resistance, they can be used in different clinical cases, such as veneering ceramics, single prostheses, fixed prostheses with three or more elements, etc. Therefore, knowing the mechanical behavior of dental ceramics and simulating their biomechanical response in anatomical geometries of natural teeth can indicate their viability for application in different clinical cases.
Despite these advancements, a critical challenge in dental prosthetics remains concerning the understanding and mitigation of the mechanical stresses that occur during mastication, especially in posterior dental restorations. Improper stress distribution can lead to material failure, compromising the longevity and performance of the prostheses. Numerical simulations, particularly those based on the finite element method (FEM), provide a robust framework for analyzing stress distribution in complex structures such as dental restorations. The FEM offers detailed insights into how varying load conditions affect the prosthesis, facilitating the design of more reliable and durable dental solutions [17,18,19].
This study aims to address the existing gap in understanding of the mechanical behavior of zirconia-based dental ceramics under masticatory loads. Specifically, this research focuses on 5 mol.% yttria partially stabilized zirconia (5Y-PSZ)—a material renowned for its enhanced translucency and adequate mechanical performance. By employing the FEM, this study evaluates the stress distribution in a monolithic high-translucency zirconia prosthesis modeled on the anatomy of a human molar. The findings aim to guide optimal prosthesis design and enhance understanding of the material’s performance under real-world conditions. While zirconia ceramics are widely recognized for their strength and aesthetic properties, the lack of comprehensive data on stress distribution in monolithic high-translucency zirconia prostheses remains a significant limitation. Existing studies often focus on materials with standard translucency or lack accurate simulations of realistic masticatory conditions. This knowledge gap necessitates a detailed investigation into the stress behaviors of high-translucency zirconia under varying load conditions to ensure the safety and reliability of these materials in clinical applications.

2. Materials and Methods

2.1. Processing

This study used commercial pre-sintered blocks of 5Y-PSZ (Ø 98.5 mm × 22 mm thick), Prettau Anterior Zirkonzhan®GmbH (LOT 0ZY302112B, Gais, Italy), containing ZrO2 with 5 mol.% Y2O3, 0.5% Al2O3, and <0.5% Fe2O3. Twenty discs (n = 20, Ø 14 mm, 1.3 mm thick) and ten bars (n = 10, 20 × 4.5 × 1.6 mm) were cut from the pre-sintered zirconia blocks using the CAD/CAM system (VHF®-K4, VHF Inc., Ammerbuch, Germany).
The milled discs were cleaned using compressed air (2 bar pressure) for 30 s to remove residual ceramic particles from the milling process. They were then sintered at 1500 °C for 2 h, at a heating rate of 5 °C/min, using a MoSi2 furnace (MAITEC® F1650, São Carlos, SP, Brazil). This process strictly followed the manufacturer’s instructions for pre-sintered blocks to eliminate porosity and maximize the mechanical and optical properties of the material.

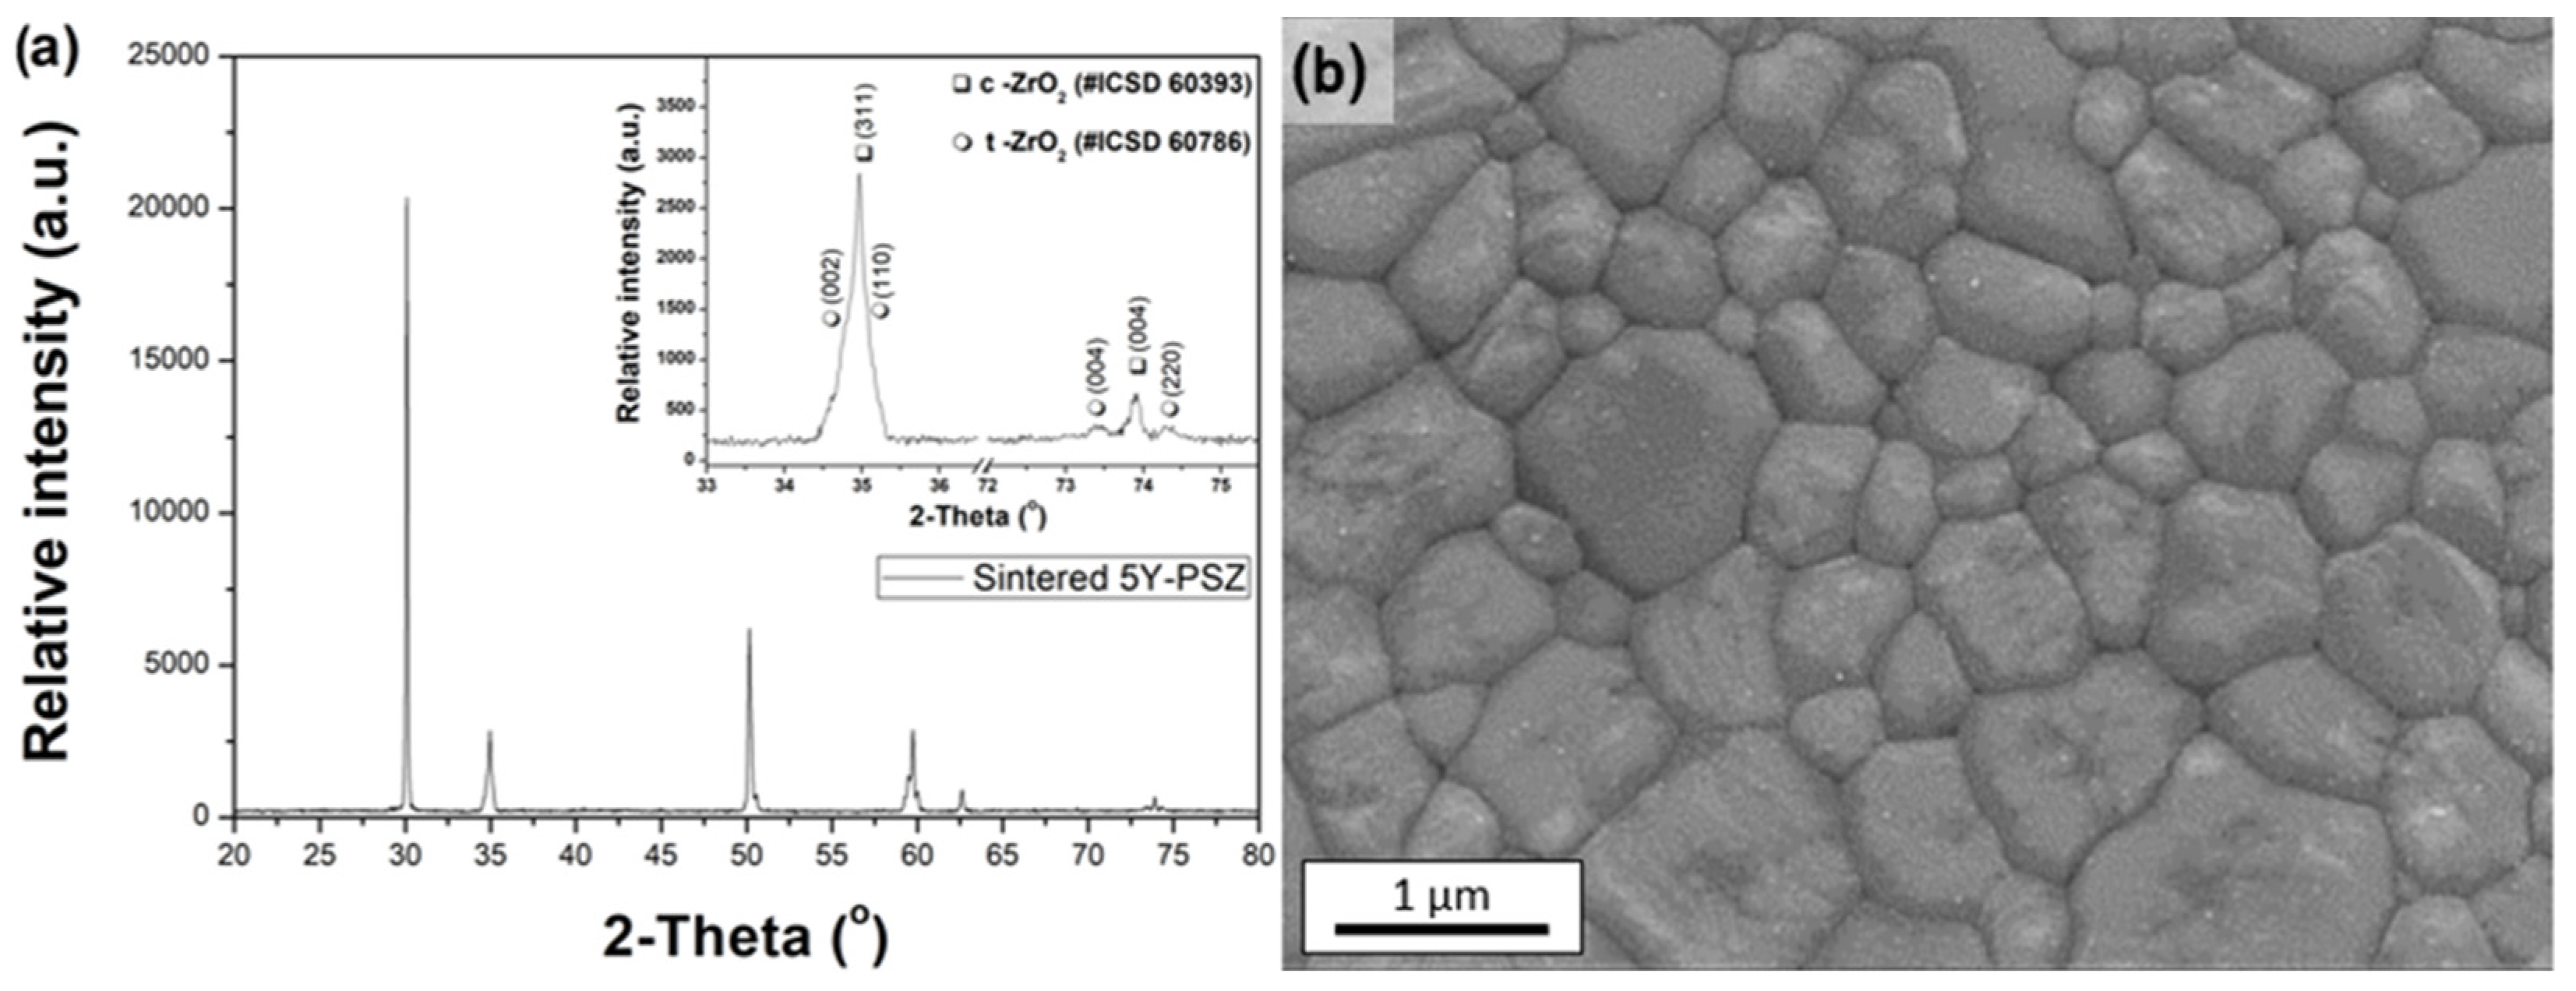
2.2. Characterizations

The apparent density of the twenty (n = 20) sintered samples was determined using the Archimedes method and correlated with the theoretical density provided by the manufacturer. The crystalline phases present in the sintered samples were identified through X-ray diffraction analysis using an XRD-6000 diffractometer (SHIMADZU, Kyoto, Japan) with Cu-Kα radiation. The analysis was conducted over a 2θ range of 10° to 80°, with an angular step width of 0.02°, and an exposure time of 5 s per position. The crystalline phases were identified by comparing the diffraction patterns with ICSD powder diffraction files (Inorganic Crystal Structure Database). Rietveld refinement was performed using FullProf Suite 3.0 software.
The surfaces of the 5Y-PSZ sintered samples were manually polished using an EcoMet 250® Pro/AutoMet polishing machine (Buehler, Leinfelden-Echterdingen, Germany). A sequence of diamond sandpapers with grit sizes of 45 µm → 15 µm → 9 µm → 6 µm → 3 µm → 1 µm was employed, spending 3 min per sandpaper. Two samples were thermally etched at 1400 °C for 15 min to reveal their microstructure and subsequently coated with gold for scanning electron microscopy (SEM) observation using a JEOL JSM-6490 microscope (3-1-2 Musashino, Akishima City, Tokyo, Japan). Grain size measurements were performed using the IMAGE J software version 1.54k.

2.3. Mechanical Properties

The elastic properties, including Poisson’s ratio and Young’s modulus, were determined using the non-destructive impulse excitation technique (IET) with Sonelastic® test equipment (ATCP-Araraquara, SP, Brazil). Fifteen cylindrical discs (n = 15) and ten bars (18 × 4 × 1.4 mm) were tested according to the recommendations of the ASTM E1876-15 standard [20]. The mean values and standard deviations of the sample groups were obtained. Young’s modulus (E) was calculated using Equations (1) to (3):
E 1 = 37.6991 f 1 2 D 2 m 1 ν 2 K 1 2 t 3
E 2 = 37.6991 f 2 2 D 2 m 1 ν 2 K 2 2 t 3
E = E 1 + E 2 2
where E1 and E2 = the first and second natural calculations of the dynamic modulus of elasticity, f1 and f2 = the first and second natural resonance frequencies (Hz), D = diameter (mm), m = mass (g), ν = Poisson’s ratio, K1 and K2 = geometric factors, and t = thickness (mm) of the sample.
Vickers hardness and fracture toughness were measured using the Vickers indentation method, following the ASTM C1327-15 standard [21]. Measurements were performed on a durometer (TIME, Beijing, China) under a load of 1 kgf (9.81 N) for 30 s. Five samples (n = 5) were tested for each property, with at least 10 indentations per sample, resulting in 50 total Vickers indentation measurements. Mean values and standard deviations were calculated. The crack length followed the Palmqvist crack system, and the fracture toughness was determined using Niihara’s equation [22].
Biaxial flexural strength was evaluated using the piston-on-three-ball (P-3B) test method following the ISO-6872-15 standard [16]. Testing was conducted in a universal testing machine (EMIC DL10000, Instron Group, Curitiba, Brazil) at a constant loading rate of 0.5 mm/min. Fifteen ceramic discs (n = 15) were tested during this characterization phase. The flexural strength (σf) was calculated using Equations (4) to (6):
σ f = 0.2387   P X Y b 2 ( MPa )
X = 1 + ν   l n r 2 r 3 2 + 1 ν 2   r 2 r 3 2 ,
Y = 1 ν 1 + ln r 1 r 3 2 + 1 ν r 1 r 3 2 ,
where P is the maximum load supported by the specimen (N), b is the specimen thickness (mm), ν is Poisson’s ratio, r 1 is the radius of the supporting circle (mm), r 2 is the radius of the loaded area (mm), and r 3 is the specimen radius (mm).

2.4. Finite Element Modeling

Finite element models were created using HyperMesh software version 2019.1, and the simulations were conducted with ABAQUS software version 6.9 employing implicit static analysis. Hooke’s law was applied in all FEMs to define linear isotropic elasticity, using the experimentally determined values for Young’s modulus (E) and Poisson’s ratio.

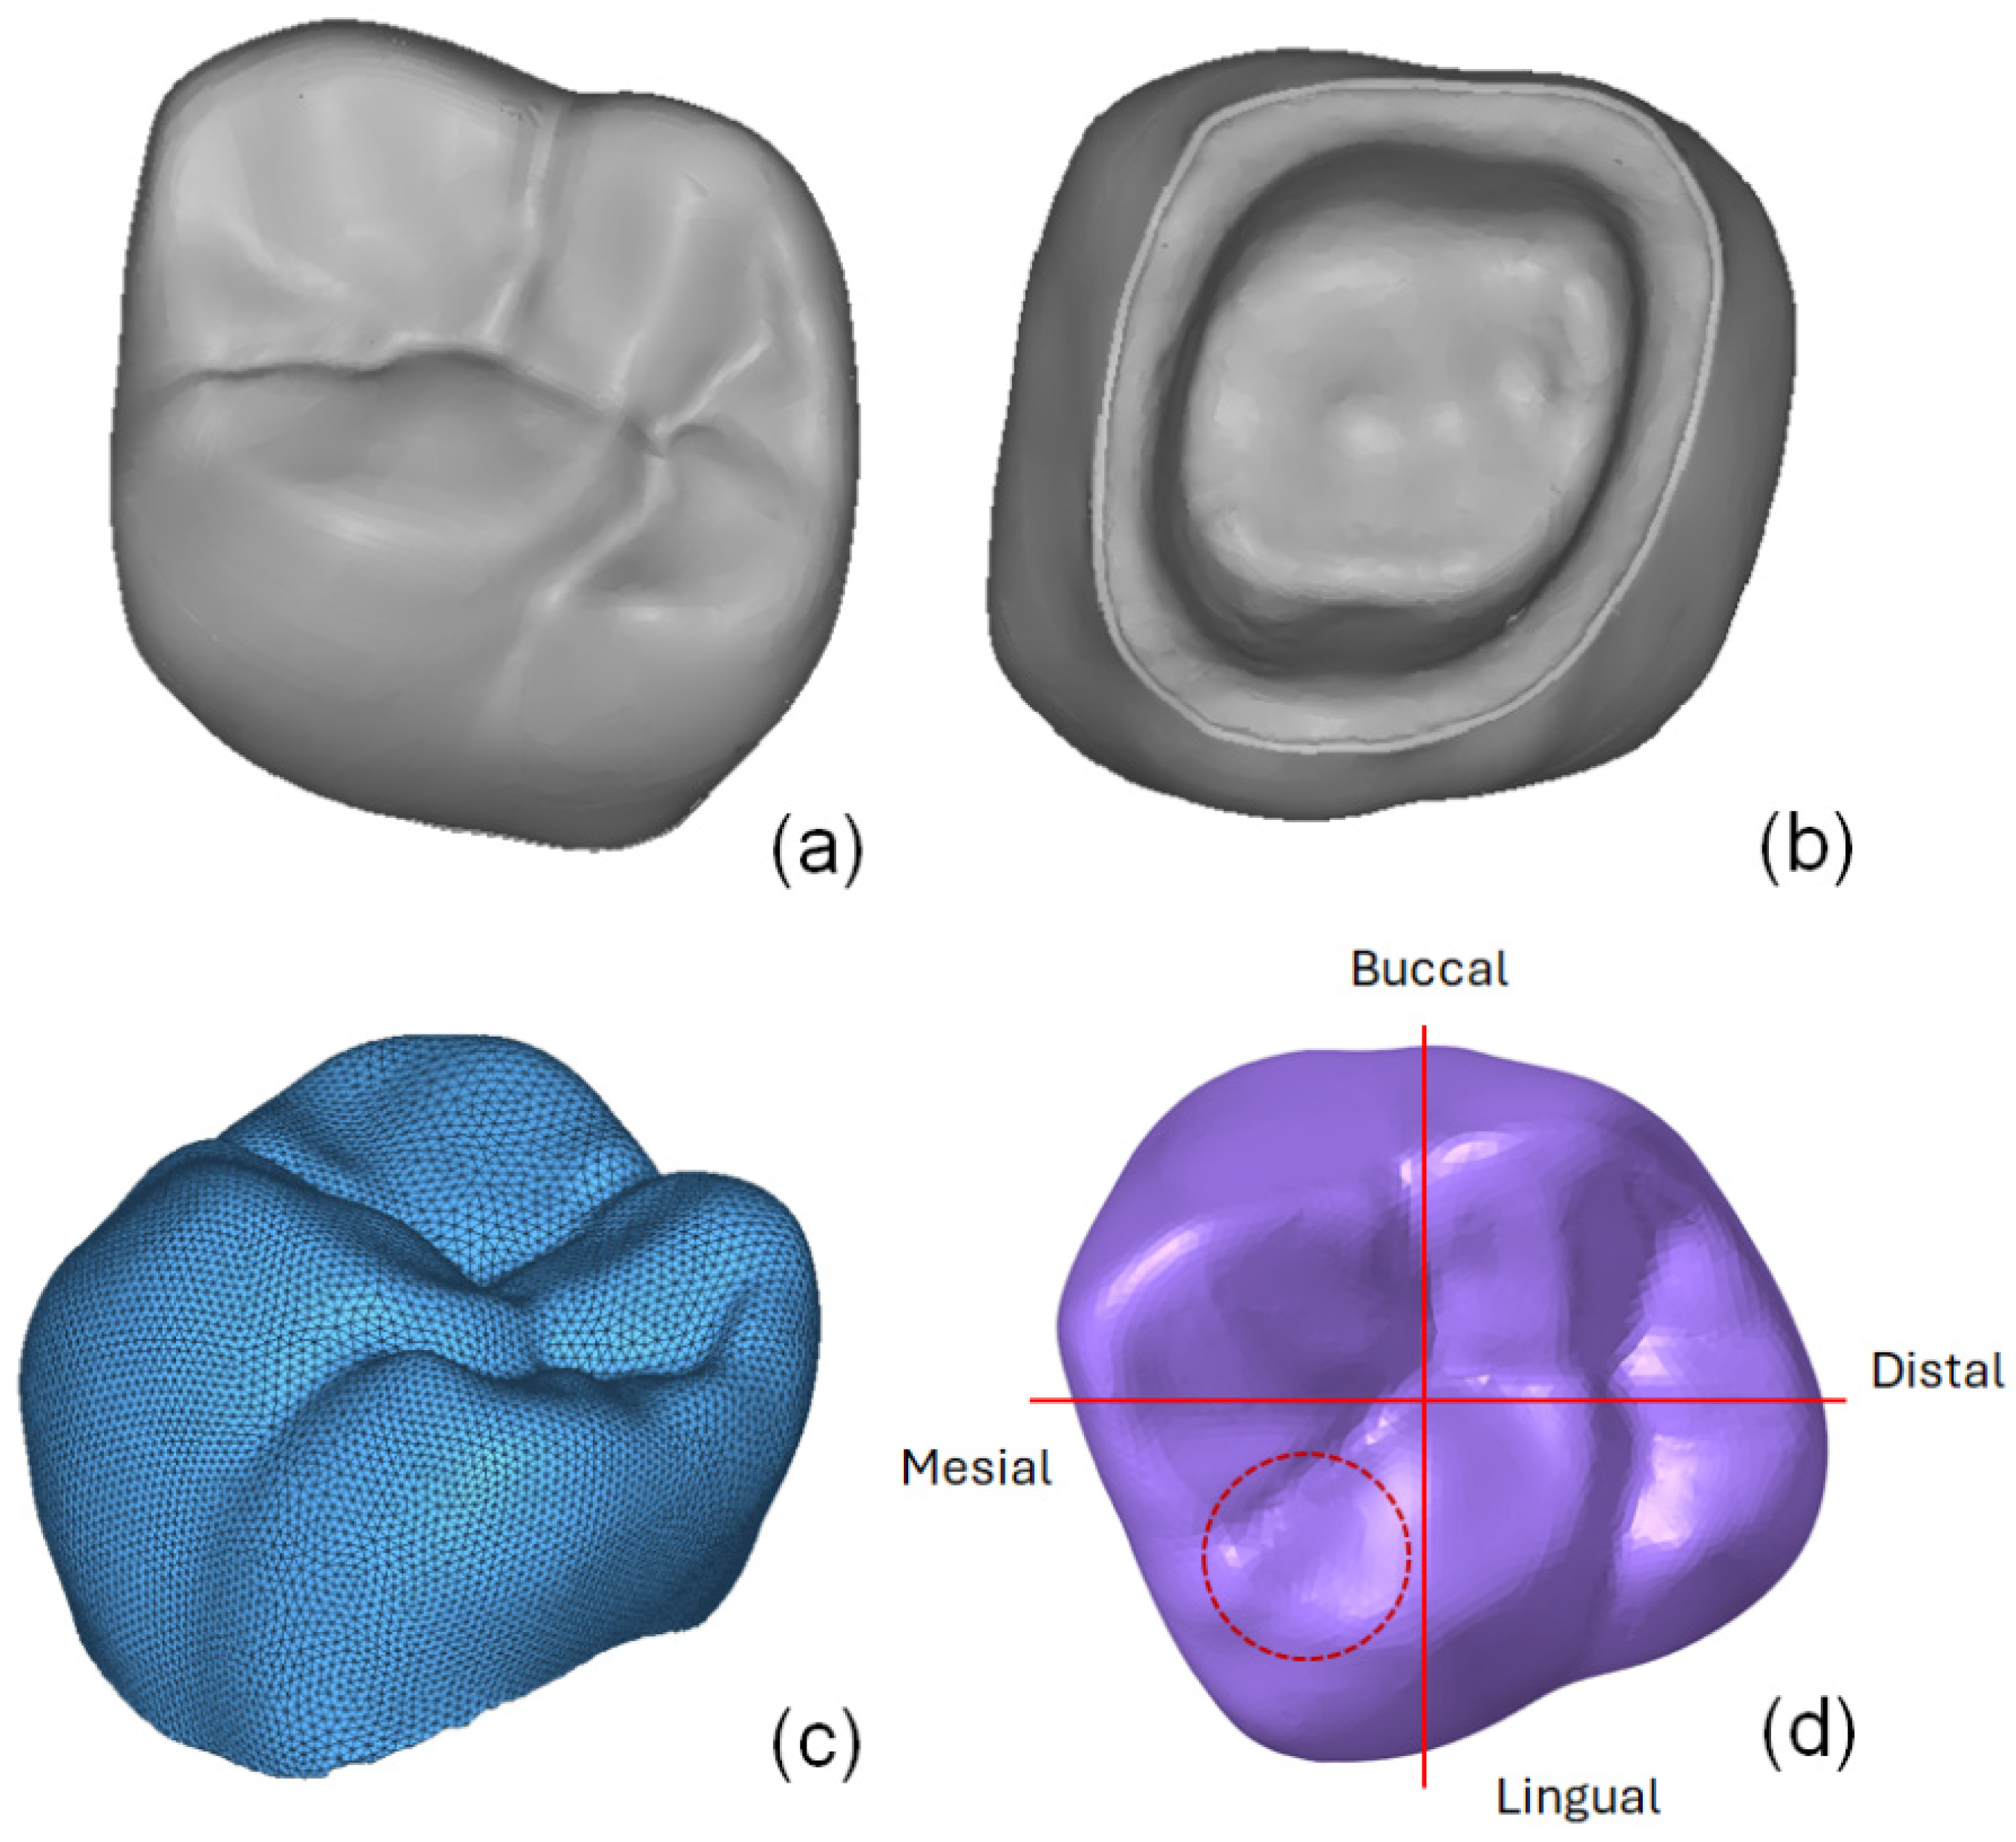
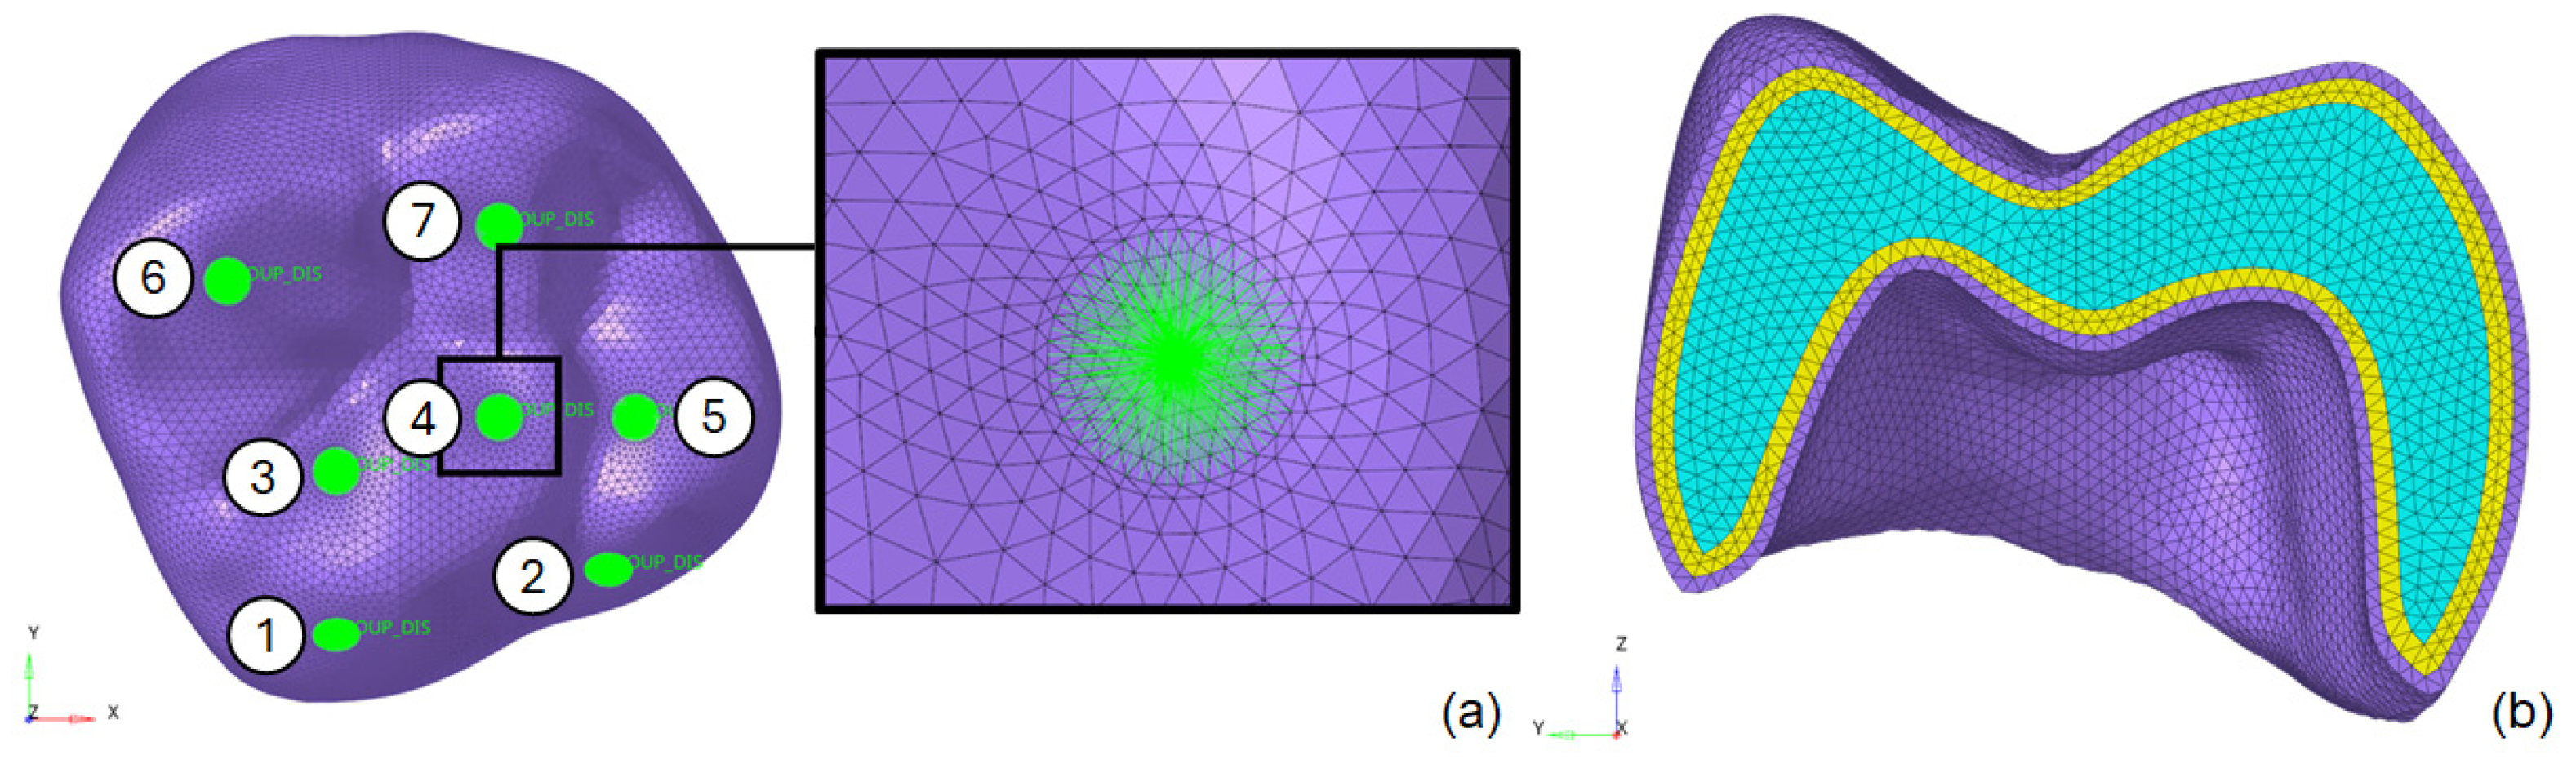
2.4.1. Geometrical Model and Meshing Generation

The geometrical model of an adult male’s first molar on the upper left (tooth 26) used in this study was obtained from an image bank designed for CAD/CAM software training purposes. The geometry is shown in Figure 1. From the superior (occlusal) view of the tooth, the anatomy’s four faces are defined, as depicted in Figure 1d.
The lingual face refers to the region facing the inside of the mouth, while the buccal face is located on the opposite side. The remaining faces, mesial and distal, are referred to as contact faces because of their contact with adjacent teeth [23].
Load applications were performed on the internal and external slopes of the cusps, following the procedure proposed by Seung-Ryong et al. [24], which is based on typical load application conditions. The upper, pyramid-shaped sharp regions define the cusps, with their nomenclature determined by the areas in which they are located.
The finite element mesh for the geometry of the first molar (tooth 26) was generated using second-order tetrahedral elements (C3D10), following the ABAQUS FE code terminology. Because of the small dimensions of the tooth, the FEM was refined with an average element size of 0.15 mm to accurately represent the curves and natural imperfections of the tooth shape. The initial mesh for this first simulation consisted of 195,695 elements and 287,946 nodes, as shown in Figure 1c. The boundary conditions were defined based on Seung-Ryong et al. [24]. To simulate tooth fixation, a crimping condition was applied, locking all degrees of freedom of the internal face cavity of the model’s geometry. This initial calculation aimed to evaluate the behavior of the geometry and guide the development of a more standardized mesh for comprehensive analysis.
After evaluating the results obtained from the mesh in Figure 1c, adjustments were made to define the final model to facilitate this and future analyses. Load application regions were modeled using “distributing coupling” elements, which allow for load and relative displacement transfer between nodes instead of treating the load regions as fully rigid. Observations from the test model and reference studies indicated that critical stresses concentrate near to the load application regions. To standardize the model and simplify future analyses, the mesh generation and preparation process was conducted in the following steps:
(1) Definition of load application regions: Circular regions with a 0.5 mm radius, numbered 1 to 7 (Figure 2a), were designated for load application. The total load was distributed among these seven points, following the procedure described in a previous study [24];
(2) Mesh refinement near load regions: Elements with a size of 0.1 mm were used near the 0.5 mm radius load regions. The element size gradually increased up to 0.5 mm as the distance from these regions grew. This approach optimized the model by balancing accuracy and computational efficiency, reducing CPU time. The final mesh consisted of 288,009 C3D10 elements and 405,936 nodes;
(3) Layered division of the tooth: The tooth was divided into layers to prevent distorted elements on the evaluated surface and enable an analysis of stress distribution across the material thickness. The detailed mesh is shown in Figure 2b;
(4) Boundary conditions: total locking of all degrees of freedom was applied to the internal face of the molar, corresponding to the connection with the bone structure at the roots.

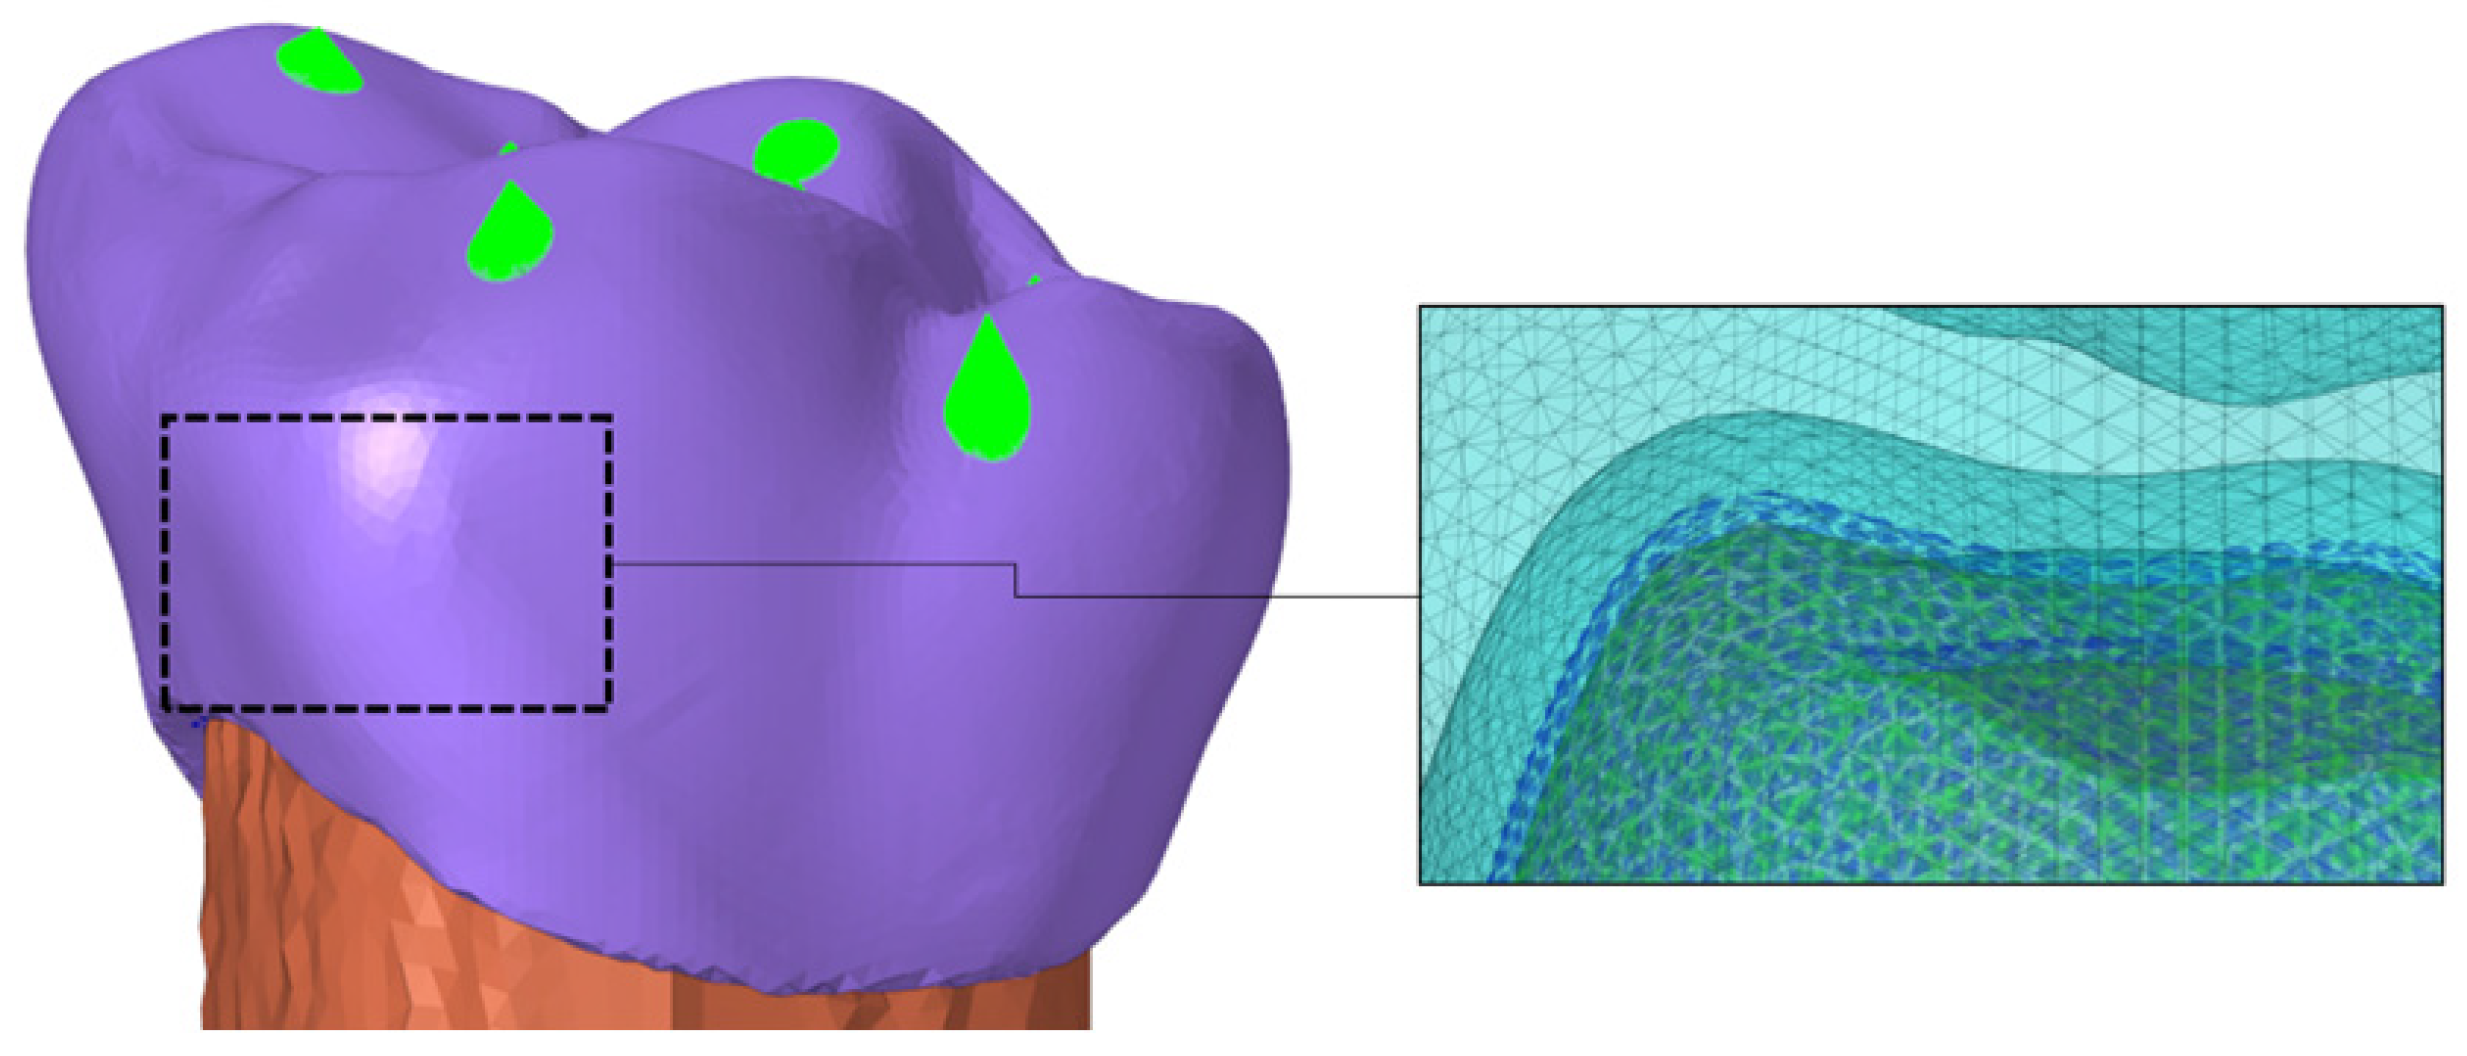
2.4.2. Model Assembly

To ensure the reliability of the predictions generated by the analysis of the isolated molar, an additional model was evaluated, considering the assembly of this prosthesis on a fixed base. This analysis aimed to assess the influence of the assembly on the critical regions of the FEM. The fixed base was modeled with the material properties of dentin (E = 18.6 GPa and Poisson’s ratio = 0.31 [24]). The internal face of the third molar (tooth 26) was attached to the fixed base using a tied contact definition, as depicted in Figure 3. An encastre boundary condition was applied to constrain all degrees of freedom in the base nodes.

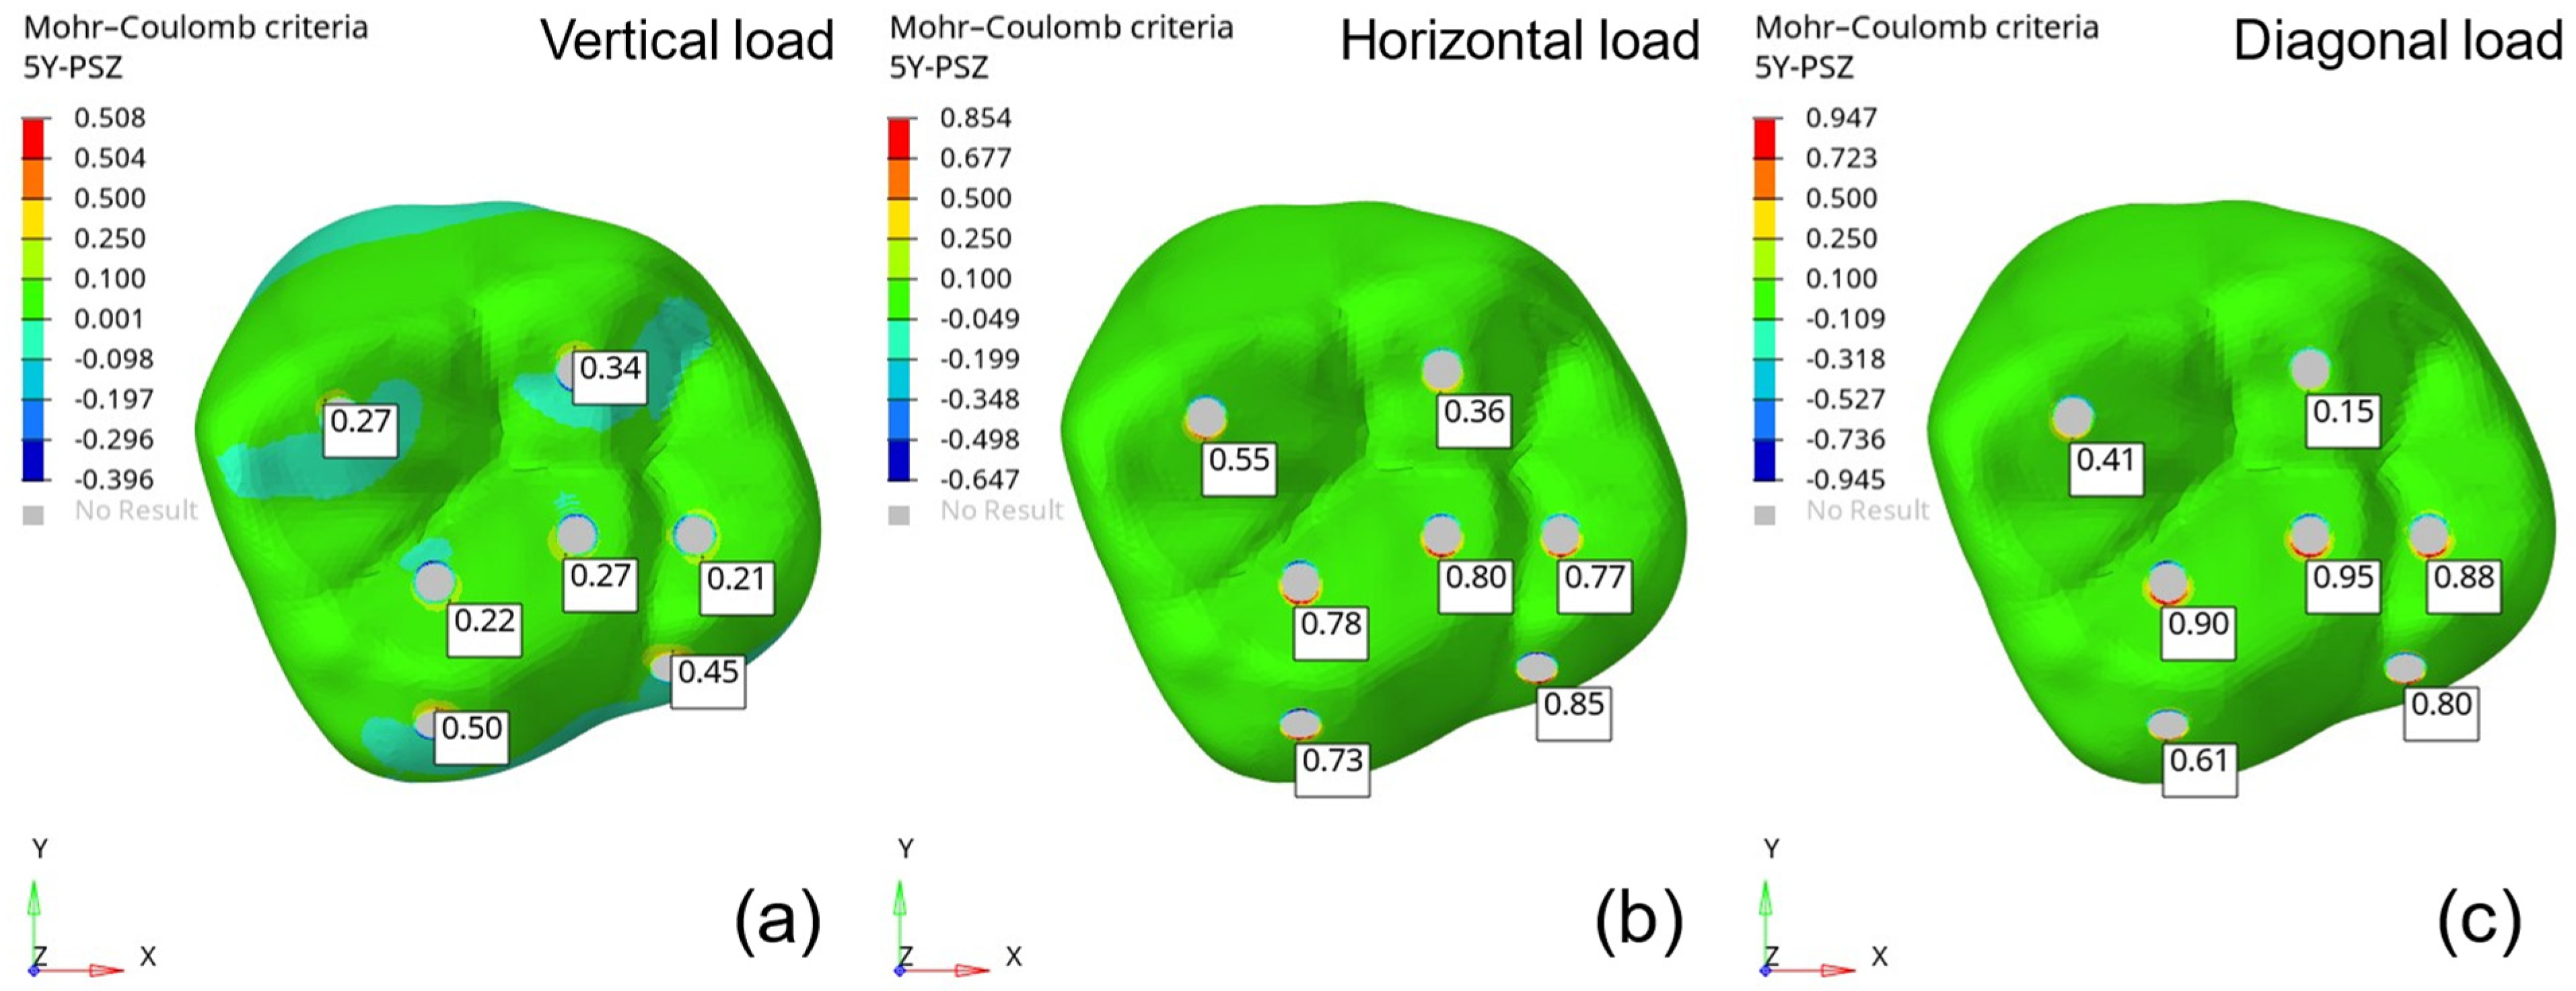
2.4.3. Mohr–Coulomb Criterion

The risk of failure of the ceramic material was evaluated using the Mohr–Coulomb isotropic yield criterion, which, in this study, is defined as [25]
σ 1 σ u t + σ 3 σ u c 1
where σ u t   i s the ultimate strength in uniaxial tension (434 MPa), σ u c is the ultimate strength in uniaxial compression (1.5 GPa), σ 1 is the maximum principal stress, and σ 3 is the minimum principal stress.

2.4.4. Numerical Simulations

The following loading conditions were defined for all numerical simulations: I–Vertical load: a load of 500 N, with increments of 50 N; II–Horizontal load: a load of 500 N, with increments of 50 N; III–Angular load: a load of 500 N applied at an angle of 45°, with increments of 50 N. The simulations were performed using ABAQUS 6.9 software on a dual-processor Intel Xeon 5690 workstation (3.47 GHz, 24 colors, 32 Gb RAM).

3. Results and Discussion

3.1. Observations

The sintered samples exhibited an average relative density of 99.5 ± 0.2%, indicating a residual porosity of less than 0.5%. Figure 4 shows the X-ray diffraction (XRD) pattern and scanning electron microscopy (SEM) micrograph of a sintered 5Y-PSZ sample. Additionally, Table 1 summarizes the Rietveld refinement results for the crystal structures of the sintered 5Y-PSZ ceramics.
The crystallographic characterization presented in Figure 4a and Table 1 reveals that the sintered zirconia contains 57.7% cubic phase (c-ZrO2) and 42.3% tetragonal phase (t-ZrO2). These results align with previous studies [14,26,27,28] investigating high-translucency zirconia partially stabilized with 5 mol.% yttria (5Y-PSZ) as a dopant. In such materials, the cubic phase predominates, enhancing translucency while reducing the proportion of the tetragonal phase.
The typical SEM micrograph of the sintered material in Figure 4b reveals a microstructure with equiaxed grains of varying sizes, averaging 1.25 ± 0.45 μm. This observation is consistent with prior studies that reported similar microstructural characteristics for these materials [27,28].
Table 2 summarizes the mechanical properties of the 5Y-PSZ dental ceramics. The measured Vickers hardness (1315 ± 48 HV), Young’s modulus (192.2 ± 4.8 GPa), and Poisson’s ratio (0.31 ± 0.05) are comparable to those reported in the literature for 5Y-PSZ ceramics and even tetragonal ceramics, such as 3Y-TZP [14,29,30,31]. Predominantly tetragonal zirconia-based ceramics, such as 3Y-TZP, exhibit high fracture toughness (6–8 MPa.m1/2) and flexural strength exceeding 800 MPa, ensuring high reliability and comfort for dental prostheses where masticatory loads do not exceed 400 MPa.
In contrast, zirconia ceramics containing 5 mol% Y2O3 are more translucent due to the increased cubic phase content but exhibit lower mechanical strength (fracture toughness and flexural strength) because of reduced toughening capacity associated with the diminished tetragonal phase [32]. The results for 5Y-PSZ ceramics in Table 2 confirm this trend, showing a fracture toughness of 3.67 ± 0.2 MPa.m1/2 and biaxial bending strength of 433.7 ± 67 MPa.
Although these results agree with the literature [14,29,30,31], the reduction in mechanical strength highlights a potential risk of failure. Therefore, simulating stress distribution under masticatory loads is crucial to improving the material’s reliability for dental applications.

3.2. Numerical Predictions

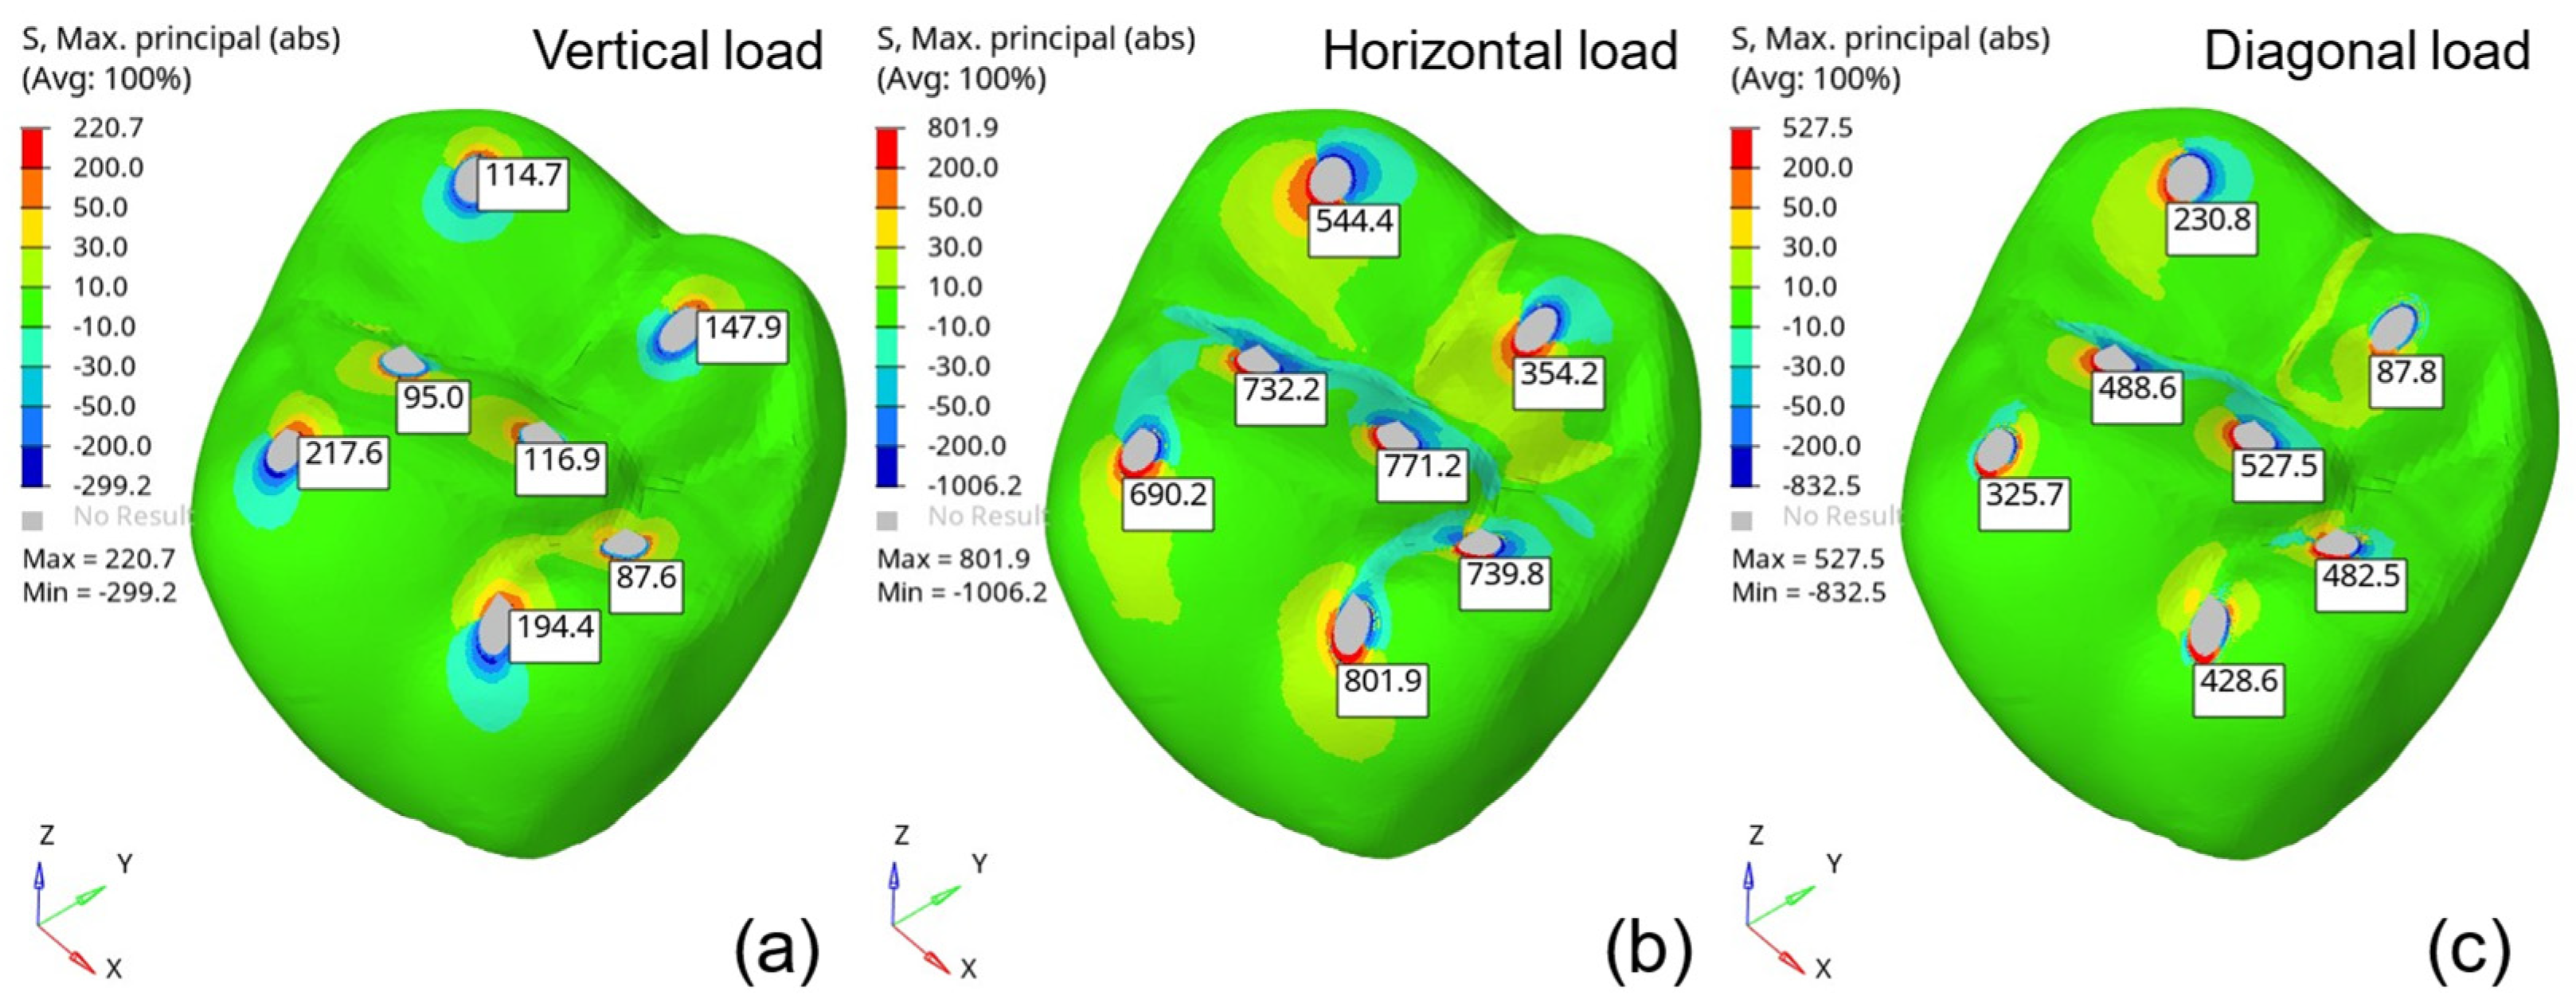
3.2.1. Absolute Maximum Principal Stress

Figure 5 presents the absolute maximum principal stress distributions resulting from the evaluated loading conditions. The highlighted values correspond to the maximum stress in each molar region, numbered 1 to 7 as indicated in Figure 2. From these maximum principal stress predictions, it is possible to identify the regions of interest for each loading type (vertical, horizontal, and angular). The critical regions were defined accordingly, and the maximum principal stress values were grouped for each point and are listed in Table 3.
In all molar regions, the highest maximum principal stress occurred under horizontal loading conditions. These findings align with the observations of Waltimo and Konomem [33], who described the natural limits of biting and chewing loads. Although horizontal loads are more critical, they do not generate stress levels as high as those caused by vertical loads.

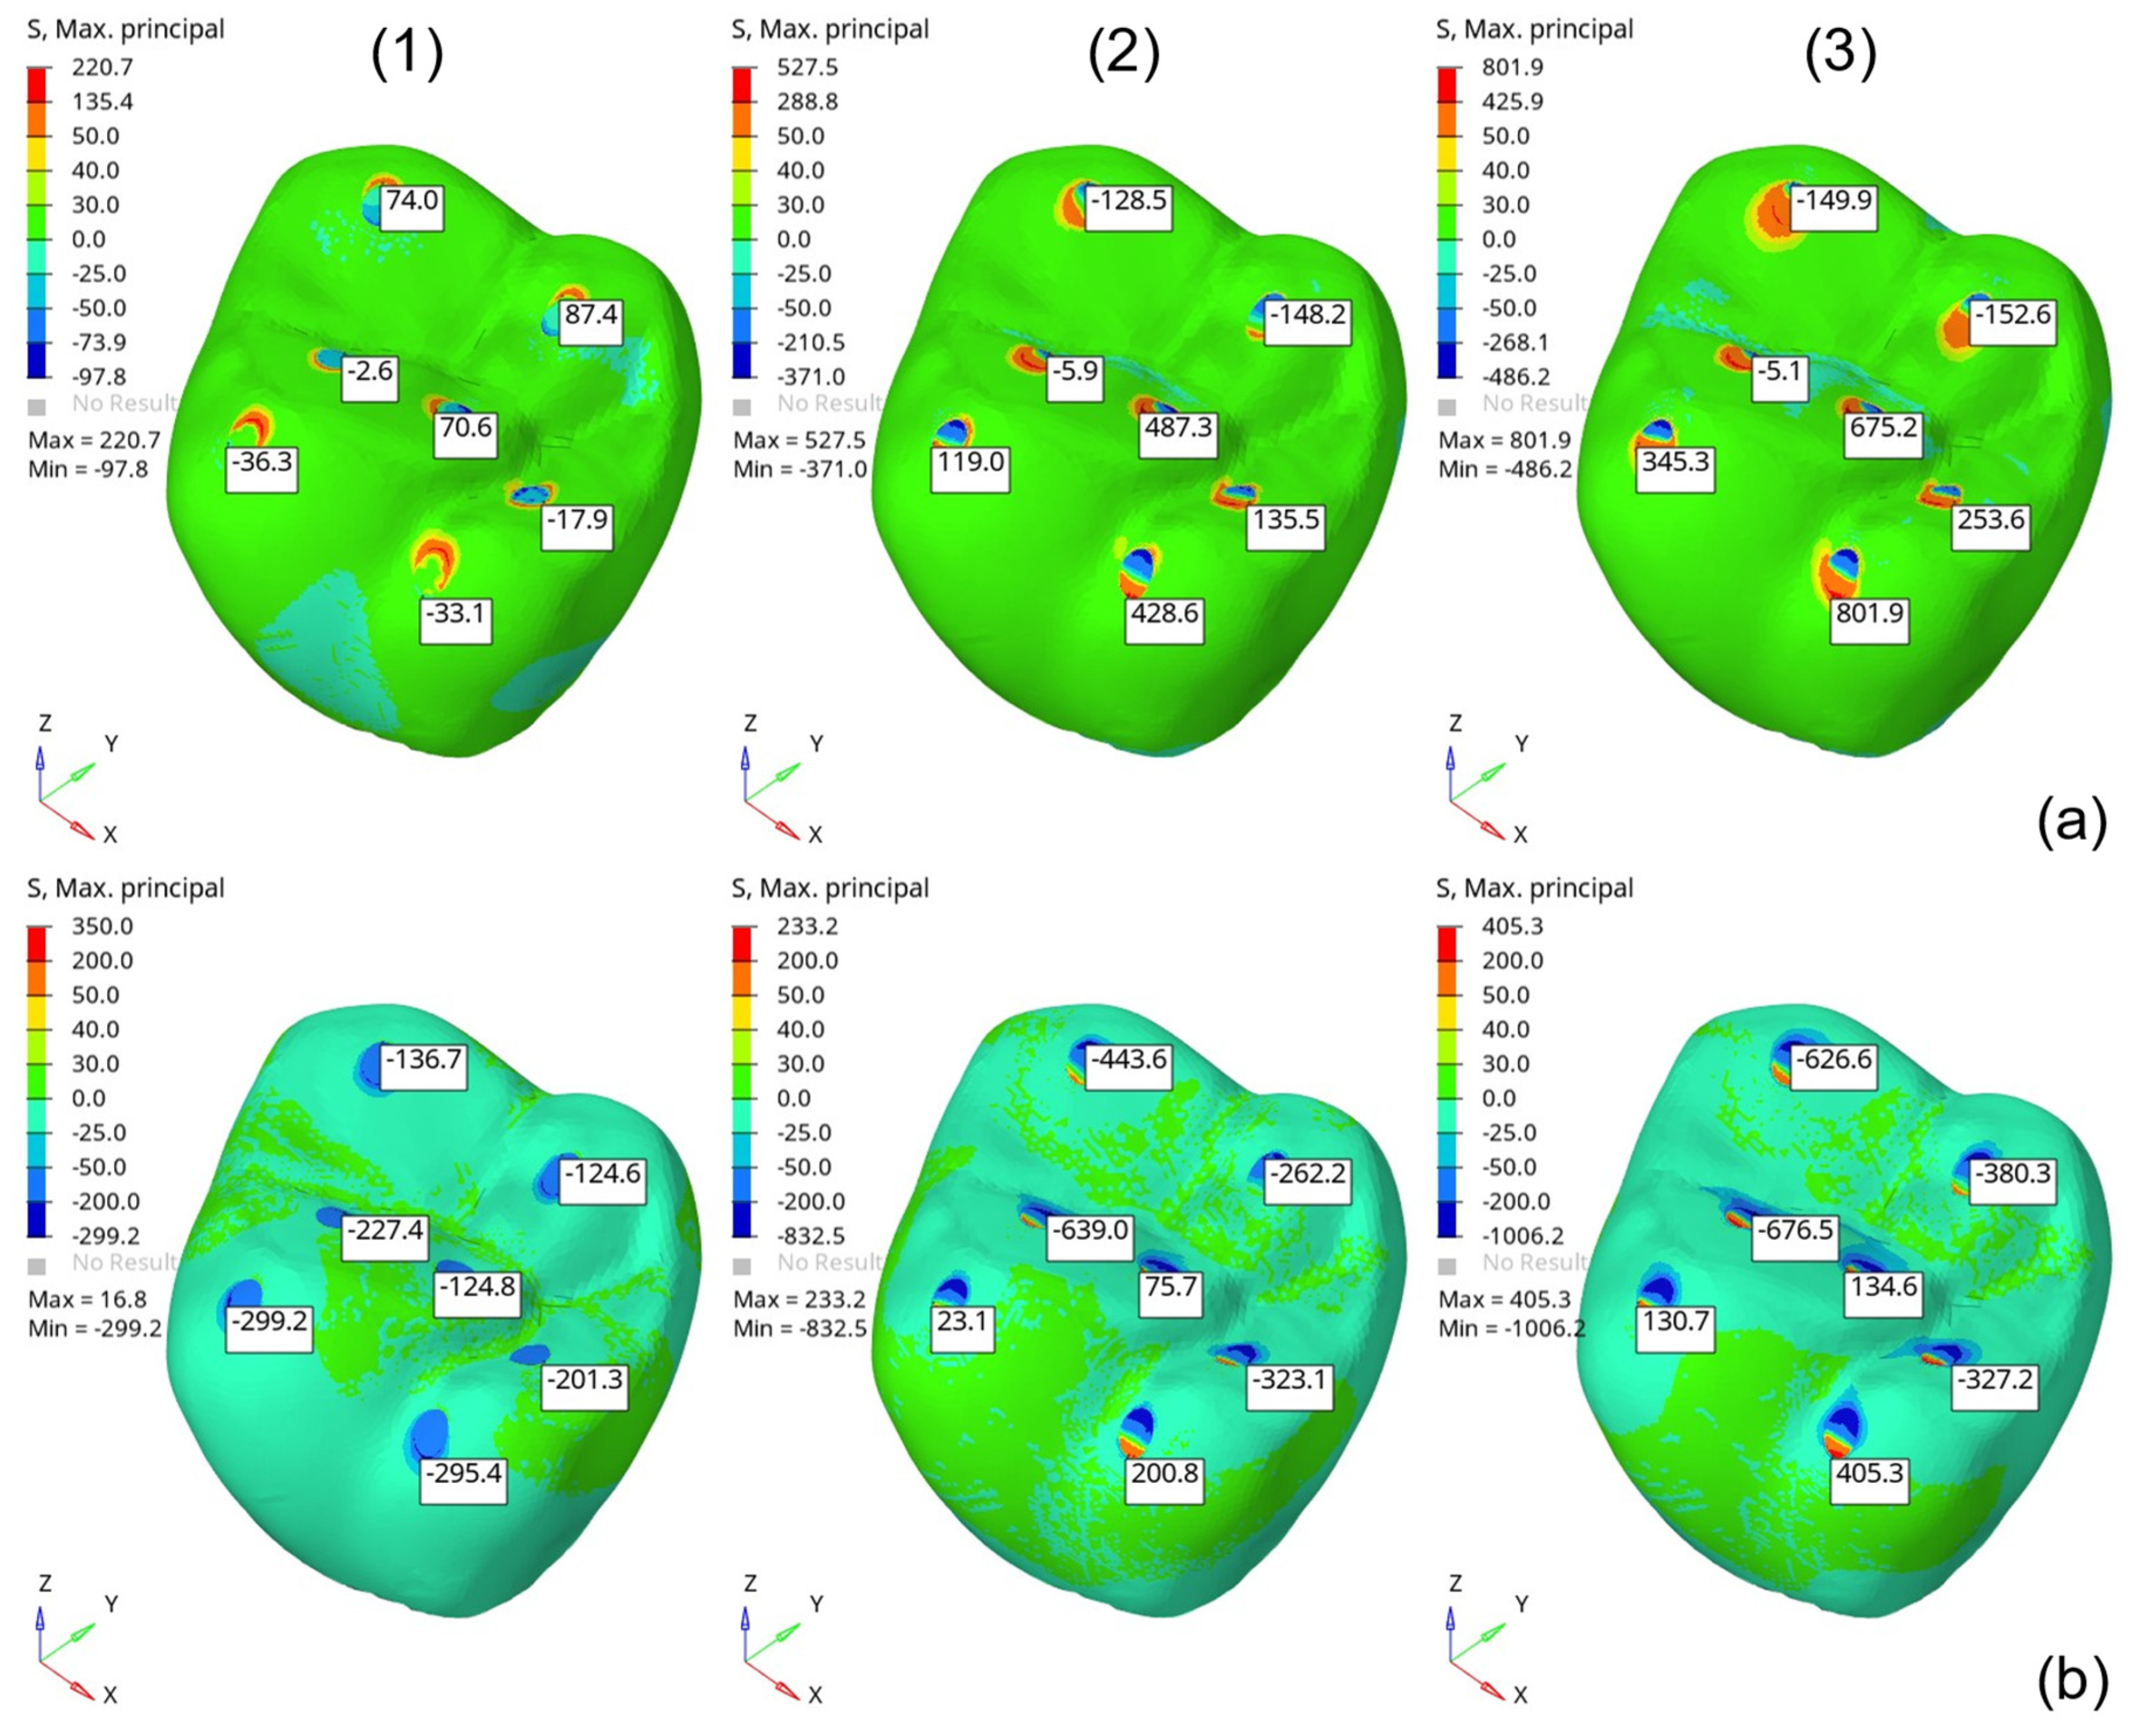
3.2.2. Fixed-Base Prosthesis Assembly

After analyzing the stress distribution in the isolated molar (tooth 26), the next step involved evaluating the prosthesis geometry assembled on a fixed base. For this purpose, a fixed base with the mechanical properties of dentin was used. Figure 6 compares the maximum principal stress distributions predicted for the isolated and fixed molar FEMs, showing a difference of up to 5%. Additionally, the stress distribution outside the load application regions is significantly influenced by the presence of the fixed base.

3.2.3. Stress Components

The influence of individual stress components on the evaluated geometry was analyzed to understand the behavior of the critical regions. This analysis classifies the nature of the acting loads as compressive or tensile stress and as normal or shear stress components. Evaluations were conducted separately for each load condition: vertical, horizontal, and angular.
Vertical load applications yielded well-defined results in a single principal direction. For convenience, the model was calculated with the vertical direction aligned with the global Z-axis. Since these materials are brittle, the failure criterion for the final evaluation considered the maximum ( σ 1 ) and minimum ( σ 3 ) stress values.
As shown in Table 4, the normal stress component (σ33) closely matches the minimum principal stress (σ3), and both are compressive. Additionally, the shear stress components (σ12, σ23, and σ31) have minimal influence on the principal stresses in the evaluated regions. This outcome primarily depends on the evaluated geometry and was expected, as the vertical loads act in the normal direction on the molar surface regions, generating predominantly compressive stresses aligned with the normal direction.
Under horizontal and angular loading conditions, conducting a general analysis is more challenging because of the significant influence of prosthesis geometry on numerical predictions. Additionally, the cusps where the loads are applied vary in size and shape, further complicating the analysis. Based on the predictions in Table 5 and Table 6, tensile triaxial states were observed under horizontal and angular loading conditions.
Figure 7 shows the distributions of tensile stresses (in red) and compressive stresses (in blue) for the horizontal loading condition. This figure demonstrates that the geometry of the cusps significantly affects the distribution of tensile and compressive regions.

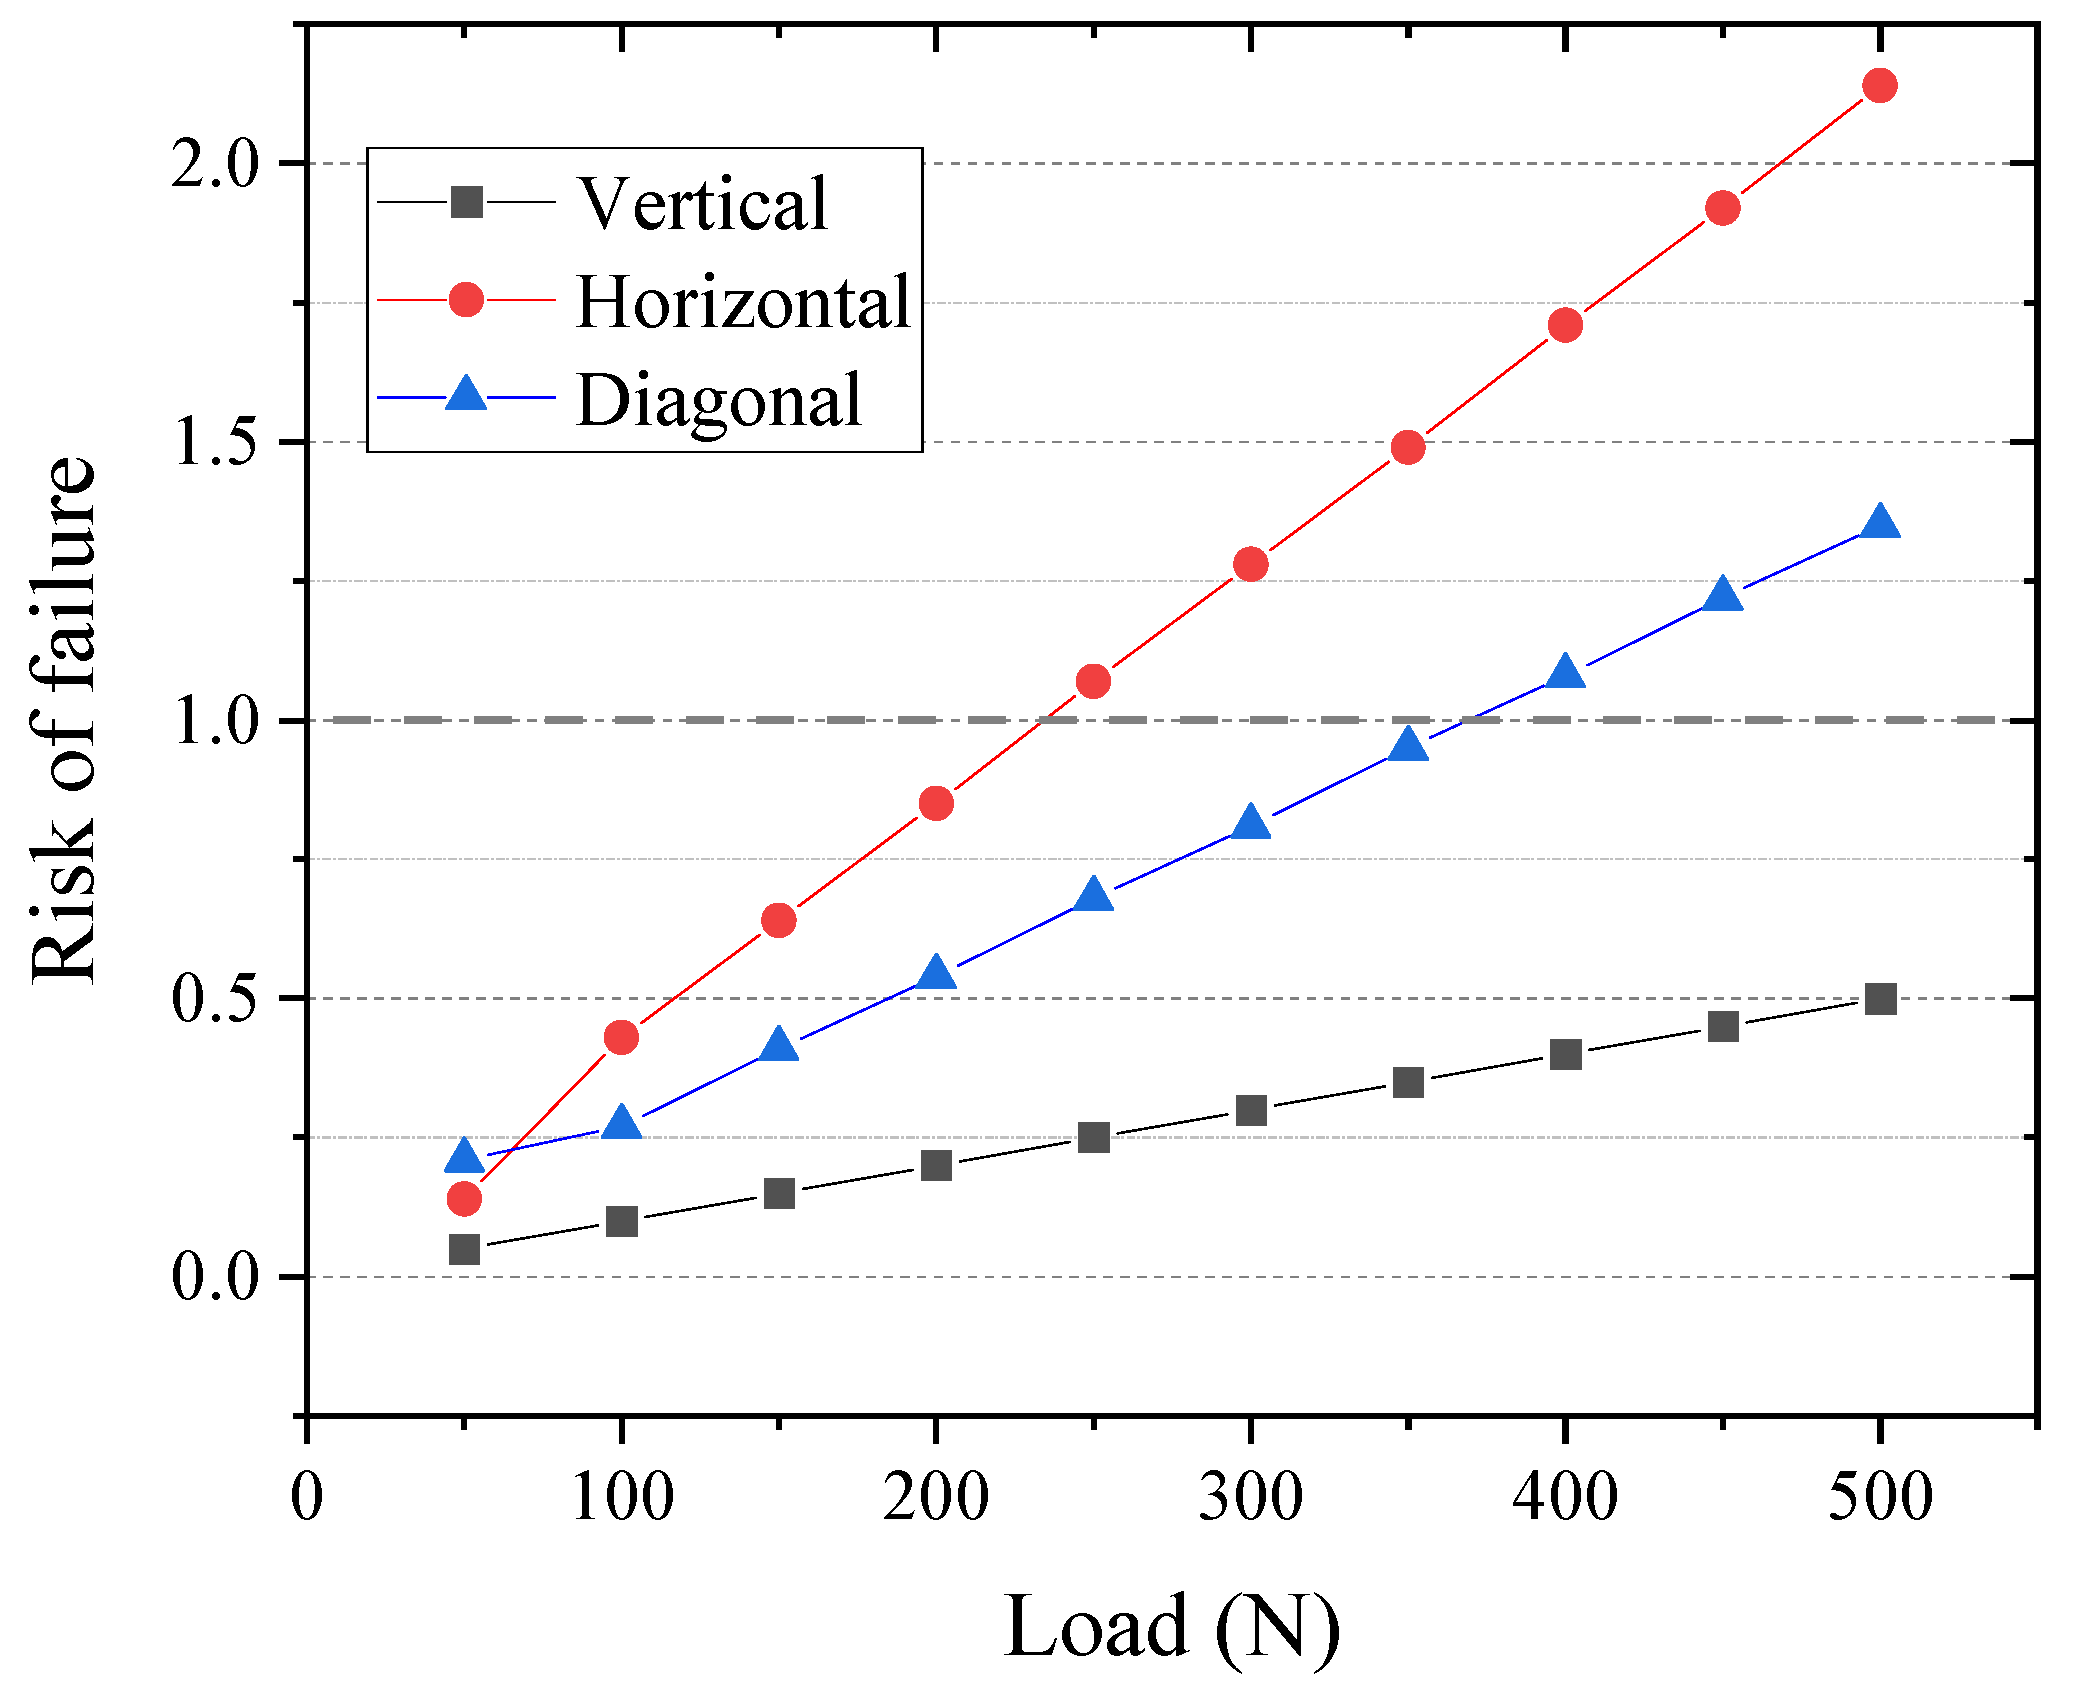
3.2.4. Risk of Failure

For the risk-of-failure analysis of the investigated prosthesis, the isolated model was used because the fixed dentin base has a minimal influence on the maximum stress in the molar’s critical regions. The risk of failure was calculated based on the maximum ( σ 1 ) and minimum ( σ 3 ) principal stress values on the outer surface, using the Mohr–Coulomb failure criterion (see Equation (7)). Figure 8 shows the principal stress predictions (S, Max and S, Min) under the evaluated loading conditions: (1) vertical (500 N), (2) horizontal (500 N) and, (3) angular (500 N). The stress values in the critical regions were used to calculate the risk of failure for each loading condition.
Figure 9 provides a risk-of-failure analysis as a function of the simulated masticatory load and its application direction. The graph summarizes the allowable loads for each condition, highlighting that the risk of failure (≥1.0) is most critical for horizontal and angular loading conditions. Consequently, the allowable load values are limited to 200 N and 350 N for the horizontal and angular loads, respectively, as illustrated in Figure 10.
Given that these results were obtained using a simplified material representation in the ABAQUS software, the maximum and minimum principal stress values were corrected for simulation errors to determine the material’s strength limits and obtain more conservative risk-of-failure values. Table 7 summarizes the maximum allowable loads for each condition without risk of failure.
The masticatory load is generally reported to range between 37% [34] and 40% [35] of the maximum bite force, which is approximately 700 N [36,37], representing a 280 N load. According to the results of this study, 5Y-PSZ remains risk-free for both vertical and angular loads within this loading range and conditions. The loading position significantly influences stress concentrations in complex structures such as full-crown restorations. When the load was applied horizontally, the tensile stress on the surface of the prosthesis was higher compared with vertical or angular loading.
Morikawa [38] reported that the masticatory force on the mandibular first molar is applied at angle of 20–28° relative to the tooth axis in healthy individuals. This indicates that, under normal circumstances, the risk of failure due to horizontal loading may be reduced.
Pileicikiene and Surna [39] evaluated the functioning of the human masticatory system and noted that the human neuromuscular system is self-regulated to ensure bite forces do not exceed the capacity limits of periodontal tissue. Consistent with previous research, their study reported a mean maximum bite force ranging between 600 N and 750 N. For cyclic masticatory loads, forces were fixed between 60 N and 100 N, which is lower than the typically studied range of 300 N. Ideally, further analyses should consider varied load conditions and geometries.

4. Conclusions

The experimental results obtained in this study for high-translucency zirconia ceramics demonstrate that this material has properties suitable for dental applications. Its mechanical properties, including a fracture toughness of approximately 3.7 MPa.m1/2 and flexural strength of around 434 MPa, qualify it for use in dental prostheses.
Numerical simulations performed at various points of the prosthesis, simulating the masticatory forces of a molar tooth, indicated that under the proposed conditions, the maximum loads without risk of failure are as follows: 500 N for vertically applied loads, 350 N for angular loads, and 200 N for horizontal loads. Under these conditions, the stresses remained below the safety threshold defined by the Mohr–Coulomb criterion, with maximum stresses not exceeding 440 MPa.
Despite the anatomical variability among individuals and the diversity of masticatory strategies, the modeling and evaluation standards adopted in this study proved effective in simplifying the analyses. These methods may facilitate future stress evaluations of novel dental ceramic compositions, providing preliminary insights into their potential success as dental prostheses.

Author Contributions

Conceptualization, F.A.d.C.W., P.C.d.S. and L.P.M.; methodology, F.A.d.C.W., P.C.d.S. and M.F.R.P.A.; software, F.A.d.C.W., P.A.d.C.W., P.C.d.S. and M.F.R.P.A.; validation, F.A.d.C.W., P.A.d.C.W. and L.P.M.; formal analysis, F.A.d.C.W., C.S. and L.P.M.; investigation, F.A.d.C.W. and M.F.R.P.A.; resources, F.A.d.C.W. and L.P.M.; data curation, F.A.d.C.W., P.A.d.C.W., P.C.d.S. and M.F.R.P.A.; writing—original draft preparation, F.A.d.C.W., P.C.d.S. and M.F.R.P.A.; writing—review and editing, F.A.d.C.W., L.P.M., M.F.R.P.A. and C.S.; visualization, L.P.M. and C.S.; supervision, L.P.M. and C.S.; project administration, L.P.M. and C.S.; funding acquisition, L.P.M. and C.S. All authors have read and agreed to the published version of the manuscript.

Funding

This research was funded by Fundação Carlos Chagas de Amparo à Pesquisa do Estado do Rio de Janeiro—FAPERJ (grants n° E26-201.476/2014, n° E26-202.997/2017 and n° E26-211.760/2015) and Conselho Nacional de Desenvolvimento Científico e Tecnológico—CNPq (grants n° 307465/2022-5, n° 311119/2017-4, and n° 305194/2015-1) for financial support.

Institutional Review Board Statement

Not applicable.

Informed Consent Statement

Not applicable.

Data Availability Statement

The raw data supporting the conclusions of this article will be made available by the authors on request.

Acknowledgments

Paula C. Silva acknowledges CAPES for a PhD scholarship. The authors also thank the Brazilian consultant, Fábio Costa, for providing the molar 26-tooth archives used in the simulations.

Conflicts of Interest

The authors declare no conflicts of interest.

References

  1. Li, R.W.K.; Chow, T.W.; Matinlinna, J.P. Review: Ceramic dental biomaterials and CAD/CAM technology: State of the art. J. Prosthod. Res. 2014, 58, 208–216. [Google Scholar] [CrossRef] [PubMed]
  2. van Noort, R. The future of dental devices is digital. Dent. Mater. 2021, 28, 3–12. [Google Scholar] [CrossRef] [PubMed]
  3. Zandparsa, R. Digital Imaging and Fabrication. Dent. Clin. N. Am. 2014, 58, 135–158. [Google Scholar] [CrossRef]
  4. Guazzato, M.; Albakry, M.; Ringer, S.P.; Swain, M.V. Strength, fracture toughness and microstructure of a selection of all-ceramic materials. Part II. Zirconia-based dental ceramics. Dent. Mater. 2004, 20, 449–456. [Google Scholar] [CrossRef] [PubMed]
  5. Denry, I.; Kelly, J.R. State of the art of zirconia for dental applications. Dent. Mater. 2008, 24, 299–307. [Google Scholar] [CrossRef]
  6. Camposilvan, E.; Leone, R.; Gremillard, L.; Sorrentino, R.; Zarone, F.; Ferrari, M.; Chevalier, J. Aging resistance, mechanical properties and translucency of different yttria-stabilized zirconia ceramics for monolithic dental crown applications. Dent. Mater. 2018, 34, 879–890. [Google Scholar] [CrossRef]
  7. Kelly, P.M.; Rose, L.F. The martensitic transformation in ceramics—Its role in transformation toughening. Prog. Mater. Sci. 2002, 47, 463–557. [Google Scholar] [CrossRef]
  8. Basu, B. Toughening of yttria-stabilised tetragonal zirconia ceramics. Int. Mater. Rev. 2005, 50, 239–256. [Google Scholar] [CrossRef]
  9. Kelly, J.R.; Denry, I. Stabilized zirconia as a structural ceramic: An overview. Dent. Mater. 2008, 24, 289–298. [Google Scholar] [CrossRef]
  10. Chevalier, J. What future for zirconia as a biomaterial? Biomaterials 2006, 27, 535–543. [Google Scholar] [CrossRef]
  11. Abreu, L.G.; Quintino, M.N.; Alves, M.F.; Habibe, C.H.; Ramos, A.S.; Santos, C. Impact of the microstructure on the life prediction of hydrothermal degraded 3Y-TZP bioceramics. J. Mater. Res. Technol. 2020, 9, 10830–10840. [Google Scholar] [CrossRef]
  12. Ramesh, S.; Lee, K.S.; Tan, C.Y. A review on the hydrothermal ageing behaviour of Y-TZP ceramics. Ceram. Int. 2018, 44, 20620–20634. [Google Scholar] [CrossRef]
  13. Zhang, F.; Inokoshi, M.; Batuk, M.; Hadermann, J.; Naert, I.; van Meerbeek, B.; Vleugels, J. Strength toughness and aging stability of highly-translucent Y-TZP ceramics for dental restorations. Dent. Mater. 2016, 32, 327–337. [Google Scholar] [CrossRef] [PubMed]
  14. Alves, M.F.R.P.; Ribeiro, S.; Suzuki, P.A.; Strecker, K.; Santos, C. Effect of Fe2O3 addition and sintering temperature on mechanical properties and translucence of zirconia dental ceramics with different Y2O3 content. Mater. Res. 2021, 24, e20200402. [Google Scholar] [CrossRef]
  15. Santos, C.; Rosa, G.O.; Quintino, M.N.; Alves, M.F.R.P.; Ribeiro, S.; Melo-Silva, C.L. Effect of surface finishing and thickness on the translucency of zirconia dental ceramics. Ceram. Int. 2020, 46, 7748–7755. [Google Scholar] [CrossRef]
  16. ISO 6872-15; Dentistry—Dental Materials. International Standard Organization: Geneva, Switzerland, 2015.
  17. Dittmer, M.P.; Kohorst, P.; Borchers, L.; Stiesch, M. Influence of the supporting structure on stress distribution in all-ceramic FPDs. Int. J. Prosthodont. 2010, 23, 63–68. [Google Scholar]
  18. Guess, P.C.; Zavanelli, R.A.; Silva, N.R.; Bonfante, E.A.; Coelho, P.G.; Thompson, V.P. Monolithic CAD/CAM lithium disilicate versus veneered Y-TZP crowns: Comparison of failure modes and reliability after fatigue. Int. J. Prosthodont. 2010, 23, 434–442. [Google Scholar] [PubMed]
  19. Lin, J.; Shinya, A.; GomiI, H.; Shinya, A. Finite element analysis to compare stress distribution of connector of lithia-disilicate reinforced glass ceramic and zirconia based fixed partial denture. Odontology 2012, 100, 96–99. [Google Scholar] [CrossRef]
  20. ASTM E1876-15; Standard Test Method for Dynamic Young’s Modulus, Shear Modulus, and Poisson’s Ratio by Impulse Excitation of Vibration. ASTM International: West Conshohocken, PA, USA, 2015; 17p.
  21. ASTM C1327-15; Standard Test Method for Vickers Indentation Hardness of Advanced Ceramics. ASTM International: West Conshohocken, PA, USA, 2015; 10p.
  22. Niihara, K.A. Fracture mechanics analysis of indentation induced Palmqvist crack in ceramics. J. Mater. Sci. Lett. 1983, 2, 221–223. [Google Scholar] [CrossRef]
  23. Madeira, M.C.; Rpelf, J.; Rizzolo, C. Capítulo 2, Anatomia individual dos dentes. In Anatomia do Dente; Sarvier: Mount Morris, IL, USA, 2014. [Google Scholar]
  24. Ha, S.-R.; Kim, S.-H.; Han, J.-S.; Yoo, S.-H.; Jeong, S.-C.; Lee, J.-B.; Yeo, I.-S. The influence of various core designs on stress distribution in the veneered zirconia crown: A finite element analysis study. J. Adv. Prosthodont. 2013, 5, 187–197. [Google Scholar] [CrossRef]
  25. Labuz, J.F.; Zang, A. Mohr–Coulomb Failure Criterion. Rock Mech. Rock Eng. 2012, 45, 975–979. [Google Scholar] [CrossRef]
  26. Zhang, Y. Making yttria-stabilized tetragonal zirconia translucent. Dent. Mater. 2014, 30, 1195–1203. [Google Scholar] [CrossRef]
  27. Santos, C.; Baltazar, J.; Alves, M.F.R.P.; Olhero, S.M. Development of translucent zirconia by robocasting. Mater. Lett. 2022, 325, 132785. [Google Scholar] [CrossRef]
  28. Santos, C.; Baltazar, J.; Alves, M.F.R.P.; Olhero, S.M. Translucent zirconia dental prosthesis processed by Direct Ink Writing: Updates and challenges. J. Manuf. Process 2024, 131, 1656–1666. [Google Scholar] [CrossRef]
  29. Amarante, J.E.V.; Pereira, M.V.S.; Souza, G.M.; Alves, M.F.R.P.; Simba, B.G.; Santos, C. Effect of hydrothermal aging on the properties of zirconia with different levels of translucency. J. Mech. Behav. Biomed. Mater. 2020, 100, 103847. [Google Scholar] [CrossRef] [PubMed]
  30. de Araújo-Júnior, E.N.; Bergamo, E.T.; Bastos, T.M.; Jalkh, E.B.B.; Lopes, A.C.; Monteiro, K.N.; Cesar, P.F.; Tognolo, F.C.; Migliati, R.; Tanaka, R.; et al. Ultra-translucent zirconia processing and aging effect on microstructural, optical, and mechanical properties. Dent. Mater. 2022, 38, 587–600. [Google Scholar] [CrossRef]
  31. Mavriqi, L.; Traini, T. Mechanical Properties of Translucent Zirconia: An In Vitro Study. Prosthesis 2023, 5, 48–59. [Google Scholar] [CrossRef]
  32. Shelar, P.; Abdolvand, H.; Butler, S. On the behaviour of zirconia-based dental materials: A review. J. Mech. Behav. Biomed. Mater. 2021, 124, 104861. [Google Scholar] [CrossRef]
  33. Waltimo, A.; Kononen, M. A novel bite force recorder and maximal isometric bite force values for healthy young adults. Scand. J. Dent. Res. 1993, 101, 171–175. [Google Scholar] [CrossRef]
  34. Laurell, L.; Lundgren, D. Periodontal ligament areas and occlusal forces in dentitions restored with cross-arch bilateral end abutment bridges. J. Clin. Periodontol. 1985, 12, 850–860. [Google Scholar] [CrossRef]
  35. Gibbs, C.H.; Mahan, P.E.; Lundeen, H.C.; Brehnan, K.; Walsh, E.K.; Holbrook, W.B. Occlusal forces during chewing and swallowing as measured by sound transmission. J. Prosthet. Dent. 1981, 46, 443–449. [Google Scholar] [CrossRef] [PubMed]
  36. Ohlmann, B.; Marienburg, K.; Gabbert, O.; Hassel, A.; Gilde, H.; Rammelsberg, P. Fracture-load values of all-ceramic cantilevered FPDs with different framework designs. Int. J. Prosthodont. 2009, 22, 49–52. [Google Scholar] [PubMed]
  37. Ulusoy, M.; Toksavul, S. Fracture resistance of five different metal framework designs for metal-ceramic restorations. Int. J. Prosthodont. 2002, 15, 571–574. [Google Scholar] [PubMed]
  38. Morikawa, A. Investigation of occlusal force on lower first molar in function. Kokubyo Gakkai Zasshi 1994, 61, 250–274. [Google Scholar] [CrossRef]
  39. Pileicikene, G.; Surna, A. The human masticatory system from a biomechanical perspective: A review. Stomatol. Balt. Dent. Maxillofac. J. 2004, 6, 81–84. [Google Scholar]
Figure 1. Geometry of the first molar (tooth 26) obtained through 3D digital scanning: (a) occlusal view, (b) bottom view, (c) finite element mesh, and (d) labeled occlusal view.
Oral 05 00015 g001
Figure 2. Optimized finite element mesh of the first molar (tooth 26): (a) loading application regions and (b) interior layered mesh refinement.
Oral 05 00015 g002
Figure 3. Model assembly: upper left first molar (tooth 26) with a fixed base.
Oral 05 00015 g003
Figure 4. (a) XRD pattern and (b) SEM micrograph of 5Y-PSZ sintered samples.
Oral 05 00015 g004
Figure 5. Absolute maximum principal stress distributions (MPa) under 500 N loading conditions: (a) vertical, (b) horizontal, and (c) angular.
Oral 05 00015 g005
Figure 6. Maximum principal stress distributions (MPa) obtained from the isolated (left) and assembled (right) molar FEMs under 500 N loading conditions: (a) vertical, (b) horizontal, and (c) angular.
Oral 05 00015 g006
Figure 7. Tensile and compressive stress regions determined for horizontal loading of 500 N.
Oral 05 00015 g007
Figure 8. Maximum (a) and minimum (b) principal stress (MPa) obtained from the isolated molar model under 500 N loading conditions: (1) vertical, (2) horizontal, and (3) diagonal.
Oral 05 00015 g008
Figure 9. Risk-of-failure predictions based on the Mohr–Coulomb criterion for the third molar (tooth 26) prosthesis FEM using 5Y-PSZ dental ceramics under different loading conditions.
Oral 05 00015 g009
Figure 10. Risk of failure based on the Mohr–Coulomb yield criterion: (a) vertical load (500 N), (b) horizontal load (200 N), and (c) angular load (350 N).
Oral 05 00015 g010
Table 1. Rietveld refinement of the crystal structures of the sintered 5Y-PSZ ceramics.
Lattice Parameters5Y-PSZ
ZrO2 –Tetragonal (ZrO2-t), space group P42/nmca = 3.610(8) Å/c = 5.162(8) Å/V = 67.3104 A3
Tetragonality (c/a√2)1.011(0)
Y2O3 in ZrO2-t phase (mol.%)4.57
ZrO2 –Cubic (ZrO2-c), space group-Fm-3 ma = 5.134(1) Å/V = 135.33 A3
Y2O3 in ZrO2-c phase (mol.%)5.33
Phase composition42.3% ZrO2-t/57.7% ZrO2-c
Table 2. Elastic parameters, bending strength, and Weibull parameters of 5Y-PSZ dental ceramics.
Young’s Modulus (GPa)Vickers Hardness (HV)Fracture Toughness (MPa.m1/2)Poisson’s RatioFlexural Strength (MPa)Characteristic Strength (MPa)Weibull Modulus
192.2 ± 4.81315 ± 483.7 ± 0.20.31 ± 0.05433.7 ± 67463.56.7
Table 3. Maximum principal stress values (MPa) determined for each loading condition.
Loading ConditionRegion
1234567
Vertical217.6194.495.0116.987.6114.7147.9
Horizontal690.2801.9732.2771.2739.8544.4354.2
Angular (45°)325.7428.6488.6527.5482.5230.887.8
Table 4. Stress components (MPa) determined under vertical loading of 500 N.
Regionσ11σ22σ33σ12σ23σ31σ1σ2σ3σmises
1−95.9−51.3−267.2−27.0−49.0−61.4−36.3−78.9−299.2244.4
2−89.1−41.0−289.6−10.3−38.44.1−33.1−91.2−295.4238.7
3−71.9−110.3−120.43.2109.3−25.1−2.6−72.6−227.4199.3
4−1.817.3−115.252.5−31.3−28.370.6−45.6−124.8170.3
5−34.8−88.3−183.7−13.911.750.5−17.9−87.6−201.3160.4
6−10.120.5−122.3−52.242.4−32.274.0−49.2−136.7183.3
7−58.658.5−85.4−19.359.6−41.987.4−48.3−124.6186.0
Table 5. Stress components (MPa) determined from horizontal loading of 500 N.
Regionσ11σ22σ33σ12σ23σ31σ1σ2σ3σmises
1156.9196.1320.19.61.568.7345.3197.1130.7190.3
2414.3489.2759.18.7−104.1−53.2801.9455.3405.3374.1
3−197.9−311.6−383.5−9.9321.2−79.2−5.1−211.3−676.5595.7
4140.7651.2415.446.073.6−16.7675.2397.5134.6468.3
5−16.1−41.8−16.0−261.6125.320.4253.6−0.2−327.2504.3
6−172.7−611.6−305.870.242.036.6−149.9−313.7−626.6419.5
7−186.1−356.6−178.667.94.215.4−152.6−188.4−380.3212.1
Table 6. Stress components (MPa) determined under angular loading of 500 N.
Regionσ11σ22σ33σ12σ23σ31σ1σ2σ3σmises
143.1102.437.4−12.3−33.65.1119.040.823.188.4
2229.9317.0331.9−1.1−100.8−34.8428.6249.4200.8207.8
3−190.8−298.3−356.3−4.7304.4−73.8−5.9−200.4−639.0561.7
498.2472.7212.369.629.9−31.8487.3220.175.7361.7
5−36.0−92.0−141.2−194.896.950.1135.5−81.6−323.1397.3
6−129.3−417.9−302.712.759.63.2−128.5−277.8−443.6273.0
7−173.1−210.8−186.734.445.1−18.7−148.2−160.1−262.2108.6
Table 7. Maximum allowable load values determined for critical loading conditions without risk of failure.
Vertical Load
Maximum Bite (500 N)
Horizontal Load
Chewing (200 N)
Angular Load
Chewing (350 N)
Critical Stress (MPa)Risk of FailureCritical Stress (MPa)Risk of FailureCritical Stress (MPa)Risk of Failure
299.20.55320.80.85447.30.95
Disclaimer/Publisher’s Note: The statements, opinions and data contained in all publications are solely those of the individual author(s) and contributor(s) and not of MDPI and/or the editor(s). MDPI and/or the editor(s) disclaim responsibility for any injury to people or property resulting from any ideas, methods, instructions or products referred to in the content.

