Article

Nonlinear Finite Element Analysis of Bone–Implant Contact in Three Short Dental Implant Models with Varying Osseointegration Percentages

by
Dawit Bogale Alemayehu
1,*,
Masahiro Todoh
2 and
Song-Jeng Huang
3
1
Division of Human Mechanical Systems and Design, Graduate School of Engineering, Hokkaido University, Sapporo 060-8628, Japan
2
Division of Mechanical and Aerospace Engineering, Faculty of Engineering, Hokkaido University, Sapporo 060-8628, Japan
3
Department of Mechanical Engineering, National Taiwan University of Science and Technology, Taipei 10607, Taiwan
*
Author to whom correspondence should be addressed.
Oral 2024, 4(4), 505-524; https://doi.org/10.3390/oral4040040
Submission received: 28 August 2024 / Revised: 17 October 2024 / Accepted: 21 October 2024 / Published: 22 October 2024

Abstract

Objectives: Dental implants have become a cornerstone of restorative dentistry, providing a long-lasting method for tooth replacement. The degree of osseointegration has a significant effect on biomechanical stability at the bone–implant contact (BIC), determining the continued efficacy of these implants. However, the exact consequences of changing osseointegration levels on different implant designs, especially in bones with variable densities, are not well known. Methods: This study used 3D finite element analysis (FEA) to look at the biomechanical performance of three short dental implants: BioMet 3iT3, Straumann® Standard Plus Short-Regular Neck (SPS-RN), and Straumann® Standard Plus Short-Wide Neck (SPS-WN). This paper tested the implants at four stages of osseointegration: 25%, 50%, 75%, and 100% in both high-density (bone type III) and low-density (bone type IV) cancellous bone. It also created and examined realistic CAD models under static occlusal loading conditions to assess stress distribution and major strains at the bone–implant contact. Results: The study discovered that as osseointegration increases, von Mises stress and principal strains go down significantly for all implant types. The SPS-WN implant had the lowest strain values, especially for bone with low density. These reductions demonstrate increased mechanical stability as the bone–implant interface becomes more capable of dispersing mechanical stresses, minimizing the potential for localized deformation and bone resorption. Conclusions: The results highlight the importance of achieving optimum osseointegration to reduce mechanical stress and increase the lifespan of dental implants. The SPS-WN type implant performed better in biomechanical tests than the others, especially when bone conditions were not ideal. This makes it a great choice for clinical applications that need long-term implant success.

1. Introduction

Dental implants have transformed the sector by offering a long-lasting, functionally efficient, and aesthetically beautiful alternative to missing teeth [1]. Dental implants aim to integrate directly with the jawbone, a process known as osseointegration, unlike typical dental prostheses like dentures or bridges [2]. This integration is critical to the implant’s long-term durability and success because it enables it to operate like a natural tooth root, firmly supporting the overlying prosthesis [3]. Normally, we classify implants based on their length. Short implants are commonly characterized as those that are less than 8 mm in length, whereas standard implants are more than 8 mm. Implants measuring 7 mm or less are classified as short or extra-short by certain clinicians. These shorter implants are commonly utilized in the posterior area to prevent more invasive operations like bone grafting or sinus lifts, which are generally required for regular implant placement due to restricted bone height [4]. Short dental implants have become a more prevalent dental restorative treatment, mainly for individuals with poor bone health [5]. These implants are a stable and durable strategy for restoring lost teeth, with significant benefits over conventional dentures or bridges. Unlike standard dental artificial teeth, short dental implants directly connect to the jawbone through a process known as osseointegration [6]. This bonding is important for recovering teeth function in addition to their original physique because it enables the implant to act analogously to an actual tooth root, firmly holding the prosthesis. Furthermore, combining dental implants with prostheses like tooth-supported restorations can provide excellent treatments for partial edentulism and neighboring worn teeth, especially in the esthetic zone. Proper restorative material selection is critical for controlling occlusal pressures and meeting patient aesthetic expectations [7].
However, the recipient’s bone qualities, along with the surgical approach and implant quality, heavily influence the success of dental implants [8]. In recipients with an appropriate quantity of bone and density, osseointegration typically occurs readily, resulting in an anchored and safe implant. However, a considerable minority of patients, notably those with low bone density or height, have major difficulties in attaining effective osseointegration [6,9]. The efficacy of dental implants is intimately related to osseointegration, in which bone forms around and binds with the implant surface, forming a firm base [10]. These properties are particularly prevalent in bone types III and IV, where the bone is either less thick or exceedingly porous, thereby increasing the likelihood of malfunctioning implants [11].
Short dental implants have emerged as a potential solution for individuals with poor bone health in the context of dental implantology [12]. Traditionally, invasive operations like bone grafting or sinus lifts treated patients with insufficient bone height or density, augmenting the bone and providing a solid foundation for standard-length implants [13]. While successful, these techniques are linked to greater surgical complexity, longer recovery periods, and higher expenses [14]. The International Team for Implantology (ITI) defines short implants as those that are 6 mm or less in length, and they provide suitable results in situations where regular implants may not be an option [15]. Short dental implants have grown in popularity because of their potential to offer excellent results in situations where regular implants would be undesirable. Small implants, when implanted in the accessible bone, may eliminate the need for extensive grafting operations in patients with limited bone height, particularly in the posterior maxilla [16]. Also, when a patient has low bone density, short implants put less stress on the bone around them. This may help the distribution of occlusal force and lower the risk of overworking the bone–implant contact [17].
The practical use of short dental implants has benefited from advancements in implant design and surface technology, as they have proven to enhance osseointegration, even in challenging bone conditions [18]. Despite these advances, research into the biomechanical behavior of short implants with varied degrees of osseointegration is still underway. Understanding how varied degrees of osseointegration influence stress distribution and strain at the bone–implant interface is critical for optimizing implant designs and improving patient outcomes, especially in individuals with low bone density [19].
A variety of industries, including automobile engineering [20,21], dentistry [22,23], and heat transfer studies [24], use the finite element method (FEM), an advanced and adaptable computational method. In the field of dental implantology, FEM is critical for the biomechanical characterization of dental implants and surrounding bone structures [22,23]. This technology enables researchers and physicians to anticipate how implants will interact with bone in various settings by simulating and evaluating complex mechanical characteristics in detail [25]. Researchers have widely used FEM to estimate stress distribution inside dental implants, as well as in compact and spongy bone, under various loading conditions and degrees of osseointegration [26].
This study examines the biomechanical effects of various osseointegration levels in three short dental implant models: BioMet 3iT3, SPS-RN, and SPS-WN. The goal is to find the best implant for people who have low bone density and limited bone height (<7 mm). Increased osseointegration improves load distribution and reduces stress and strain in both cortical and cancellous bones, resulting in superior mechanical stability and lifespan of dental implants, particularly in low-density bones. Short implants provide a less intrusive alternative to bone grafting, lowering surgical risks, recuperation time, and expenses while producing excellent results. This work uses nonlinear three-dimensional finite element analysis (FEA) to examine crucial biomechanical parameters, such as maximum stress and strain at the bone–implant interface (BIC) and the distribution of von Mises stresses among implant designs. These considerations are critical in defining an implant’s capacity to evenly distribute mechanical stresses, reduce localized stress, and preserve stability under challenging circumstances. We aim to use the results to guide clinicians in selecting implants that enhance biomechanical performance, enhance patient outcomes in non-bone grafting scenarios, and establish a new benchmark in dental implantology for intricate clinical scenarios.

2. Materials and Methods

2.1. CAD Geometry Design

In terms of size and shape, three-dimensional geometric models of the premolar implant and the peri-implant bone were considered to be closely realistic [27]. Prior research modified both compact (cortical) and spongy (cancellous) bone sections to represent the interaction between the implant and surrounding bone, as the implant depth interacts with both types of bone tissue [28]. Model I was the Biomet 3iT3 Short implant with a dimension of 5 mm (D) × 4 mm (L), which was obtained from (Zimmer Biomet Dental, Palm Beach Gardens, FL, USA); Model II was the Standard Regular neck SRN-Straumann® Standard Plus Short (SPS) implant, at 4 mm long, 4.1 mm diameter, Straumann, and this implant design was received from (Holding AG, Basel, Switzerland); Model III was the Standard Wide Neck SWN-Straumann Standard Plus Short (SPS) implant, at 4 mm long, 4.8 mm diameter, Straumann, and this implant design was obtained from (Holding AG, Basel, Switzerland); and the bone was designed using CATIA V5-6R2017 software (Dassault Systèmes, Paris (Vélizy-Villacoublay), France). A bone block model was also built based on a cross-sectional image of the molar region’s human mandible, 15 mm high, 12 mm wide, and 12 mm thick, and the trabecular bone in the center was surrounded by 1 mm of cortical bone (refer to Figure 1). The implant was placed in the bone block that was cortical and cancellous.

2.2. Three-Dimensional Finite Element Analysis (FEA)

2.2.1. Material Properties

A set of fabric elastic properties was allotted to the jawbone models. Ideally, the properties ought to represent the property of the bone. The bone was taken as anisotropic, as it showed different mechanical properties once measured in several directions (in the identical sample) [29]. The bone can be assumed to be transversely isotropic based on the elastic moduli of the cortical bone in the buccolingual and infero-superior directions [30], and that of the cancellous bone in the direction of buccolingual and mesiodistal [30], which were not significantly different. Hence, the bone can be approximated to be transversely isotropic, with only five independent elastic properties instead of nine in the case of orthotropic materials (independent in x, y, and z directions but symmetrical for each orthogonal axis). Consequently, this approximation of transverse isotropy better substitutes the ideal scenarios of the bone’s anisotropy (21 fully independent elastic properties that would be derived from the generalized Hooke’s law) than the most frequently used assumption of isotropy (2 independent elastic properties: Poisson’s ratio and modulus of elasticity). For the purpose of ease, isotropic material properties are often assigned to the jawbone models. And its properties are well-thought-out and uniform in all directions, unlike the human mandible material properties.
All the assigned elastic material properties that apply to bone types III and IV for this particular study are illustrated in Table 1 [27,31]. These properties ought to represent cortical bone, low-density spongy bone, and high-density spongy bone. The properties given to the bone–implant transition region are developed from the properties of bulk compact and trabecular bones. Varied degrees of osseointegeration are considered during the transition of this region. Full stability (perfect osseointegeration) is attained when the transition region has 100% bulk properties, where partial osseointegeration is said to be achieved at constant Poisson’s ratio when the bulk’s elastic moduli and shear moduli are described by its fractional values [29].
With respect to the bone type, the assigned elastic properties may apply to bone types II, III, or IV. Following the definition, the properties should represent high-density cancellous bone, low-density cancellous bone, and cortical bone. The properties assigned to the bone–implant transition region are acquired from the properties of the bulk cortical and cancellous bones. Various degrees of osseointegeration are featured in this transition region. The assumption of perfect osseointegeration applies when the transition region has 100% bulk properties. Partial osseointegeration is represented by the fractional values of the bulk’s elastic and shear moduli at constant Poisson’s ratio and are illustrated in Table 2 [31].
Finally, the analysis was carried out using the ABAQUS 2017 version finite element software, and the results were entered again in visualization and post-processing of the maps. The results were then visualized in the maximum von Mises stress, principal stress, and strain maps (MPa) to analyze the stress distribution in the dental implant, spongy, and cortical bone tissue (low- and high-density). Lekholm and Zarb classify bone quality into four types based on density: type I, which is dense cortical bone with little or no trabecular bone; type II, which is thick cortical bone surrounding dense trabecular bone; type III, which is thin cortical bone surrounding dense trabecular bone; and type IV, which is very thin cortical bone surrounding sparse trabecular bone [32].

2.2.2. FE Mesh and Contact Definition

After modeling the solids, geometries were exported to the FEA software for pre- and post-processing (ABAQUS 2017, Dassault Systèmes SIMULIA, Johnston, RI, USA). To obtain meshes, especially for our case, the geometries are very complicated; in such a situation, tetrahedral elements, specifically quadratic tetrahedral elements with 10 nodes (C3D10), were used for each model (Table 3). The mechanical properties of each simulated material were attributed to the meshes by using previously published values in the literature (Table 3) [33]. The bone materials were anisotropic, and the implant material was to be homogeneous, isotropic, and linearly elastic [34].
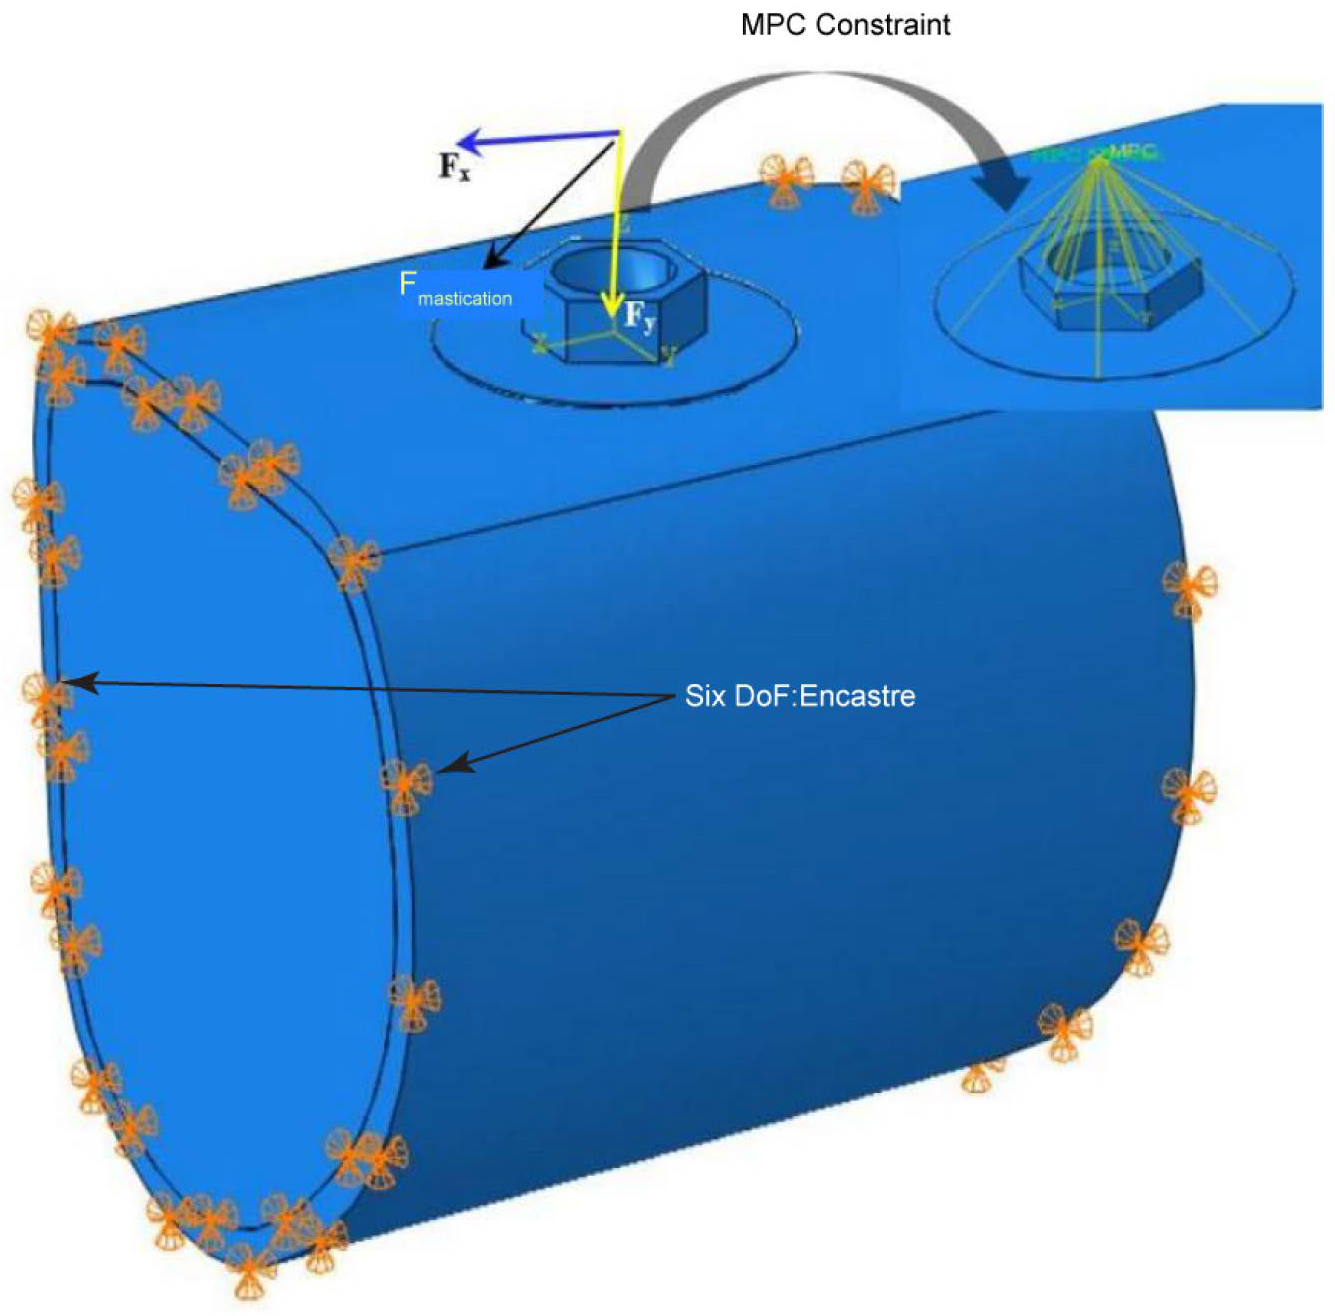
All contacts between implant/bone and bone/bone were simulated using “finite sliding” to ensure no slipping between the surfaces. The interaction properties were also defined. For this, contact “tangential behavior” and friction were determined to be “rough”. This prevented any slips between the surfaces. Most importantly, all the contacts were simulated using symmetric contacts. Constraint definitions were established as fixed in the axes (x, y, and z) at the mesial and distal surfaces of the cortical and trabecular bone (As shown in Figure 2). All other model surfaces were unrestricted. For the static occlusal load, concentrated oblique force was 380 N at the specific four points on the internal slope of the cusps, which is equivalent to a pressure of 100 MPa [35].
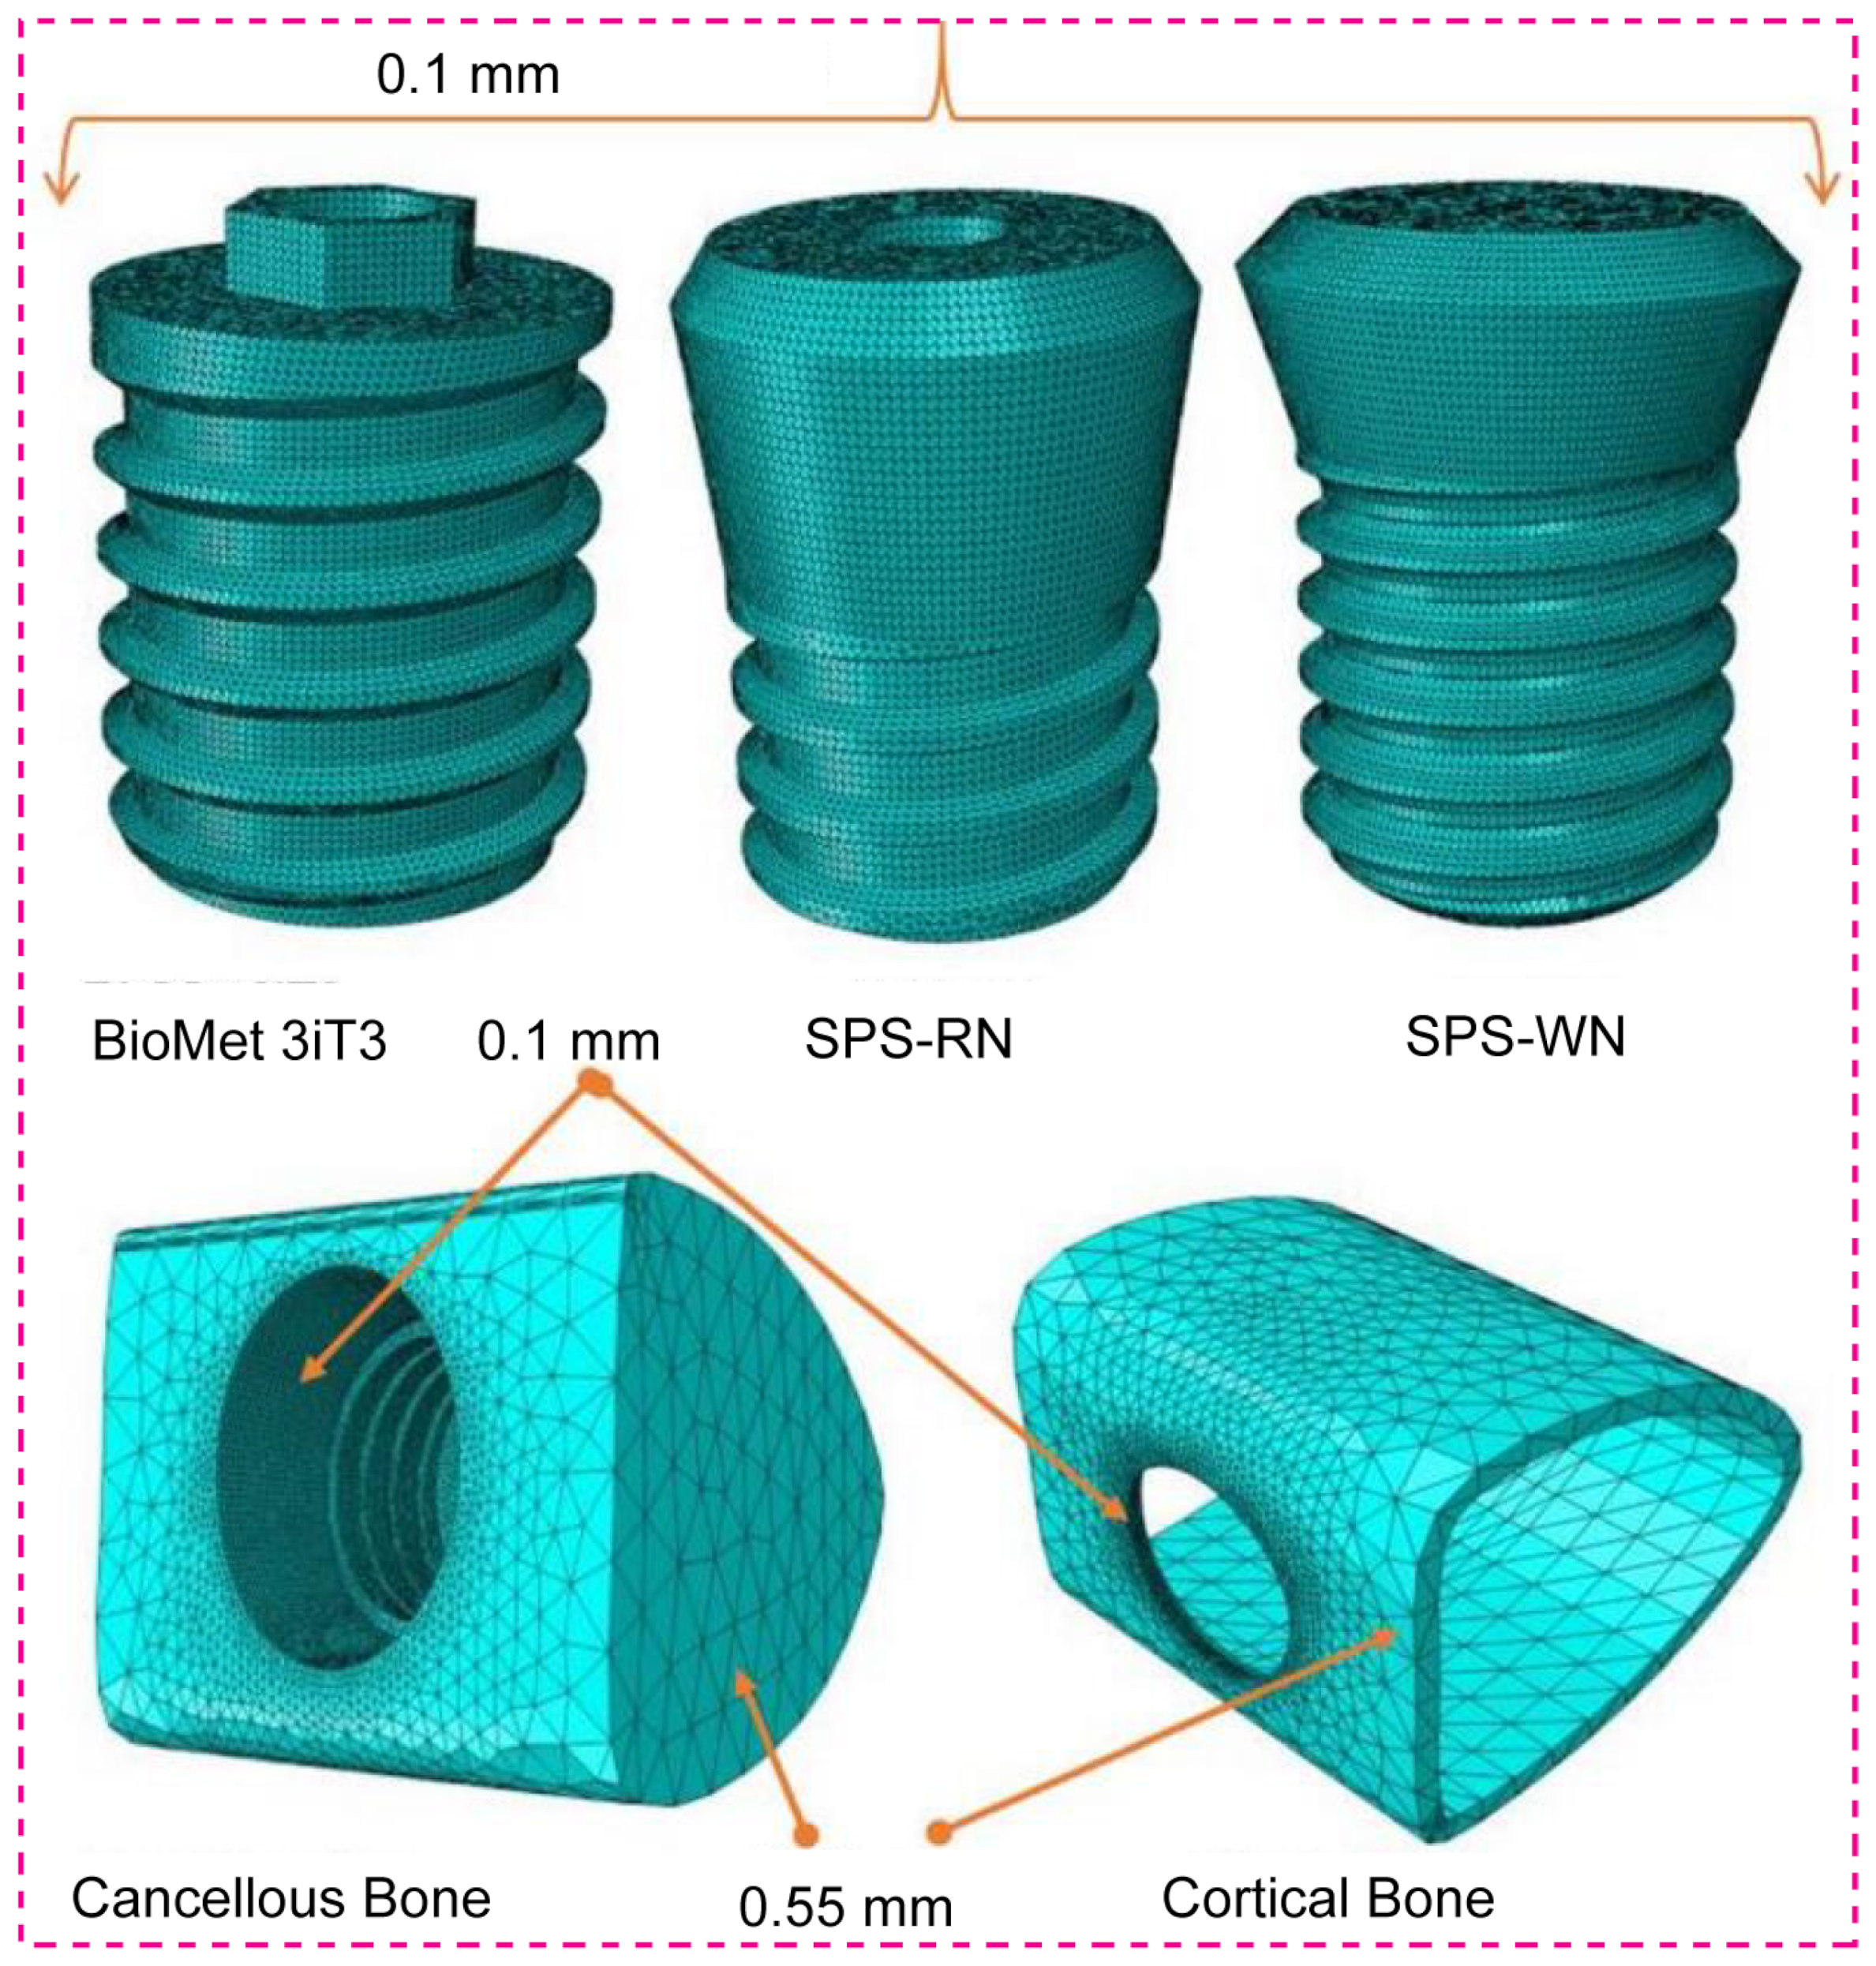
We used tetrahedral elements (C3D10) with linear geometric order for both the implants and the bone structures around them in a finite element (FE) mesh analysis of three types of short dental implants. We used a targeted meshing strategy, allocating a small element size of 0.1 mm to significant highlights such as short implants and hole regions of compact and cancellous bone. In contrast, we selected a coarser element size of 0.55 mm in the less crucial surrounding areas to maximize computing efficiency while retaining accuracy in the most important locations (refer to Figure 3). This method accurately models the stress and strain distributions at the bone–implant interface, which is important for checking how well the implants work mechanically when they are loaded in different ways. Nonlinear contact zones were defined at two critical interfaces: implant–bone, and bone–bone. Contact analysis defined the load and deformation transfer between different components. The friction coefficient (μ) was set as 0.65 for the cortical bone–implant interface [36], and 0.77 for the cancellous bone–implant interface [30].

3. Results

3.1. Maximum Stress and Maximum Bone Strain

3.1.1. BioMet 3iT3 Short Implant

Table 4 shows that the mechanical response of cortical and cancellous bones varies significantly with osseointegration level. The findings demonstrate that when the osseointegration percentage in cortical bone increases from 25% to 75%, the maximum stress rises significantly from 158.4 MPa to 174.3 MPa. This implies that an improvement in bone–implant contact enhances the transmission of load to the cortical bone, leading to a rise in stress levels. Despite the increased stress, the strain inside the cortical bone reduces substantially, from 0.02559 at 25% osseointegration to 0.009997 at 75%. This decrease in strain suggests that the cortical bone is better able to bear applied stresses as osseointegration advances, most likely due to a more solid and durable bone–implant contact. Table 3 shows a somewhat different trend in cancellous bone. The maximum stress falls significantly as osseointegration progresses, decreasing from 19.23 MPa at 25% to 17.79 MPa at 75%. This means that the cancellous bone is under less stress when the implant integrates with the surrounding bone tissue. Similarly, strain in cancellous bone drops considerably with improved osseointegration, from 0.106 at 25% to 0.03264 at 75%. This decrease in strain demonstrates the beneficial effect of improved osseointegration on the mechanical stability of the implant, since it minimizes the risk of excessive deformation in the surrounding bone.

3.1.2. Standard Plus Short (SPS) Implants with Regular Neck (SRN)

The results in Table 5 show that the Standard Regular Neck SRN-Straumann® Standard Plus Short (SPS) implants put different amounts of stress and strain on the cortical and cancellous bones at different osseointegration percentages. The findings reveal significant variations in how bone types III and IV respond to patient bite loads. When the osseointegration percentage for bone type III goes from 25% to 100%, the highest stress in the cortical bone changes. It goes from 137 MPa at 25% osseointegration to 136.6 MPa at 100% osseointegration. However, the maximum strain in the cortical bone drops dramatically, from 0.04126 at 25% osseointegration to 0.009295 at 100%. This suggests that with increased osseointegration, the cortical bone deforms less under strain, implying a more stable bone–implant contact. The maximum stress in type III cancellous bone decreases from 38.48 MPa at 25% osseointegration to 33.32 MPa at 100%. Similarly, the maximum strain in cancellous bone decreases significantly, from 0.1099 at 25% osseointegration to 0.02463 at 100%. These findings show that increased osseointegration not only lowers stress levels but also significantly decreases strain in cancellous bone, improving the implant’s durability. For bone type IV, the consequences are more apparent. The maximum stress in the cortical bone is much greater, beginning at 330.1 MPa at 25% osseointegration and dropping to 300.1 MPa at 100%. The strain in the cortical bone drops significantly, from 0.08977 at 25% osseointegration to 0.02171 at 100%. These findings imply that since bone type IV is less dense, it endures more stress at first, but as osseointegration progresses, the bone’s capacity to withstand deformation under load increases.
The maximum stress in type IV cancellous bone decreases significantly, from 26.12 MPa at 25% osseointegration to 25.45 MPa at 100%. The strain shows a similar trend, falling from 0.4199 at 25% osseointegration to 0.1027 at 100%. These results show that even though stress levels in cancellous bone are usually lower than those in cortical bone, the decrease in strain that comes with better osseointegration is very important for keeping the structure of the implant, especially in bone that is not very dense.

3.1.3. Standard Plus Short (SPS) Implants with Wide Neck (SWN)

The data in Table 6 and Table 7 shows that Standard Regular neck SRNand the Standard Wide Neck SWN-Straumann® Standard Plus Short (SPS) implants, which yields different levels of stress and strain in the cortical and cancellous bones when the patient bites down on them. This happens at different levels of osseointegration. For bone type III, the findings reveal that when the osseointegration percentage grows from 25% to 100%, the maximum stress in the cortical bone drops from 135.5 MPa to 114.3 MPa (refer to Table 7). This tendency shows that as osseointegration develops, the implant becomes more closely integrated with the bone, prompting the cortical bone to endure less stress. As a result, the strain in the cortical bone drops substantially, from 0.04750 at 25% osseointegration to 0.009631 at 100%. This reduction in strain suggests that the bone deforms less under stress as osteointegration proceeds, which improves implant stability. The maximum stress in type III cancellous bone decreases slightly, from 14.78 MPa at 25% osseointegration to 13.34 MPa at 100%. Similarly, the strain in cancellous bone decreases from 0.06905 at 25% to 0.01645 with 100% osseointegration. Although cancellous bone typically experiences lower stress levels than cortical bone, it also benefits from enhanced osseointegration, creating a more stable and supportive environment for the implant.
The findings for bone type IV demonstrate a more significant trend. At 25% osseointegration, the maximum stress in the cortical bone is 399.1 MPa, which decreases to 322.7 MPa at 100%. The equivalent strain in the cortical bone drops significantly, from 0.09706 at 25% osseointegration to 0.02004 at 100%. This suggests that increased osseointegration significantly reduces both stress and strain in less dense bone type IV, which is critical for lowering the likelihood of implant failure due to excessive loading. The maximum stress in type IV cancellous bone is relatively constant, ranging from 15.73 MPa at 25% osseointegration to 15.68 MPa at 100%. However, the strain drops significantly, from 0.2803 at 25% to 0.06946 with 100% osseointegration. This large decrease in strain indicates that with increased osseointegration, the cancellous bone is better able to distribute the applied stresses, lowering the chance of deformation and improving overall implant stability.

3.2. Maximum Shear Stresses Along the Three-Plane

According to Table 8, the highest shear stresses in three planes (Sxy, Sxz, and Syz) for different implant types under a static mastication load vary significantly in cancellous and cortical bones at different stages of osseointegration.
As osseointegration grows from 25% to 100% in the BioMet 3iT3 implant model, shear stresses in cancellous bone vary to some extent. Specifically, the shear stress in the XY plane (Sxy) begins at 0.9718 MPa at 25% osseointegration and increases gradually to 1.581 MPa at 100%. The XZ and YZ planes exhibit similar tendencies, with stress levels typically increasing as osteointegration improves. Cortical bone, on the other hand, experiences more significant variations in shear stresses. For example, the shear stress in the XY plane (Sxy) rises from 97.53 MPa at 25% osseointegration to 102.8 MPa at 100%, but the XZ plane (Sxz) increases significantly from 55.37 MPa to 67.93 MPa over the same range. This suggests that when osseointegration advances, the cortical bone experiences increased shear stresses, perhaps indicating improved load transmission and stability. The shear stresses in cancellous bone in the SPS-RN (Standard Plus Regular Neck) implant model are rather consistent across varying osseointegration levels. The Sxy stress in the XY plane, for example, maintains at 1.55 MPa for all osseointegration levels. Shear stresses in the cortical bone, on the other hand, fall in a clear pattern. The XY plane stress (Sxy) drops from 78.34 MPa at 25% osseointegration to 75.28 MPa at 100%. This reduction implies that when bone–implant contact improves, the distribution of shear loads becomes more uniform, possibly lowering the likelihood of localized stress concentrations. It was found that shear stresses in cancellous bone are usually lower in the SPS-WN (Standard Plus Wide Neck) implant model than in the others. The Sxy stress in the XY plane drops from 1.105 MPa at 25% osseointegration to 1.095 MPa at 100%. The cortical bone experiences a greater decrease in shear forces as osteointegration advances. For instance, the Sxy stress in the XY plane decreases from 62.77 MPa at 25% osseointegration to 57.96 MPa at 100%, with comparable trends observed in the other planes. This decrease in shear stress, especially in the cortical bone, shows that the implant’s stability increases with improved osseointegration, as the bone becomes more capable of handling the imposed stresses without excessive shear.

3.3. Maximum von Mises Stress at the Bone–Implant Contact (BIC)

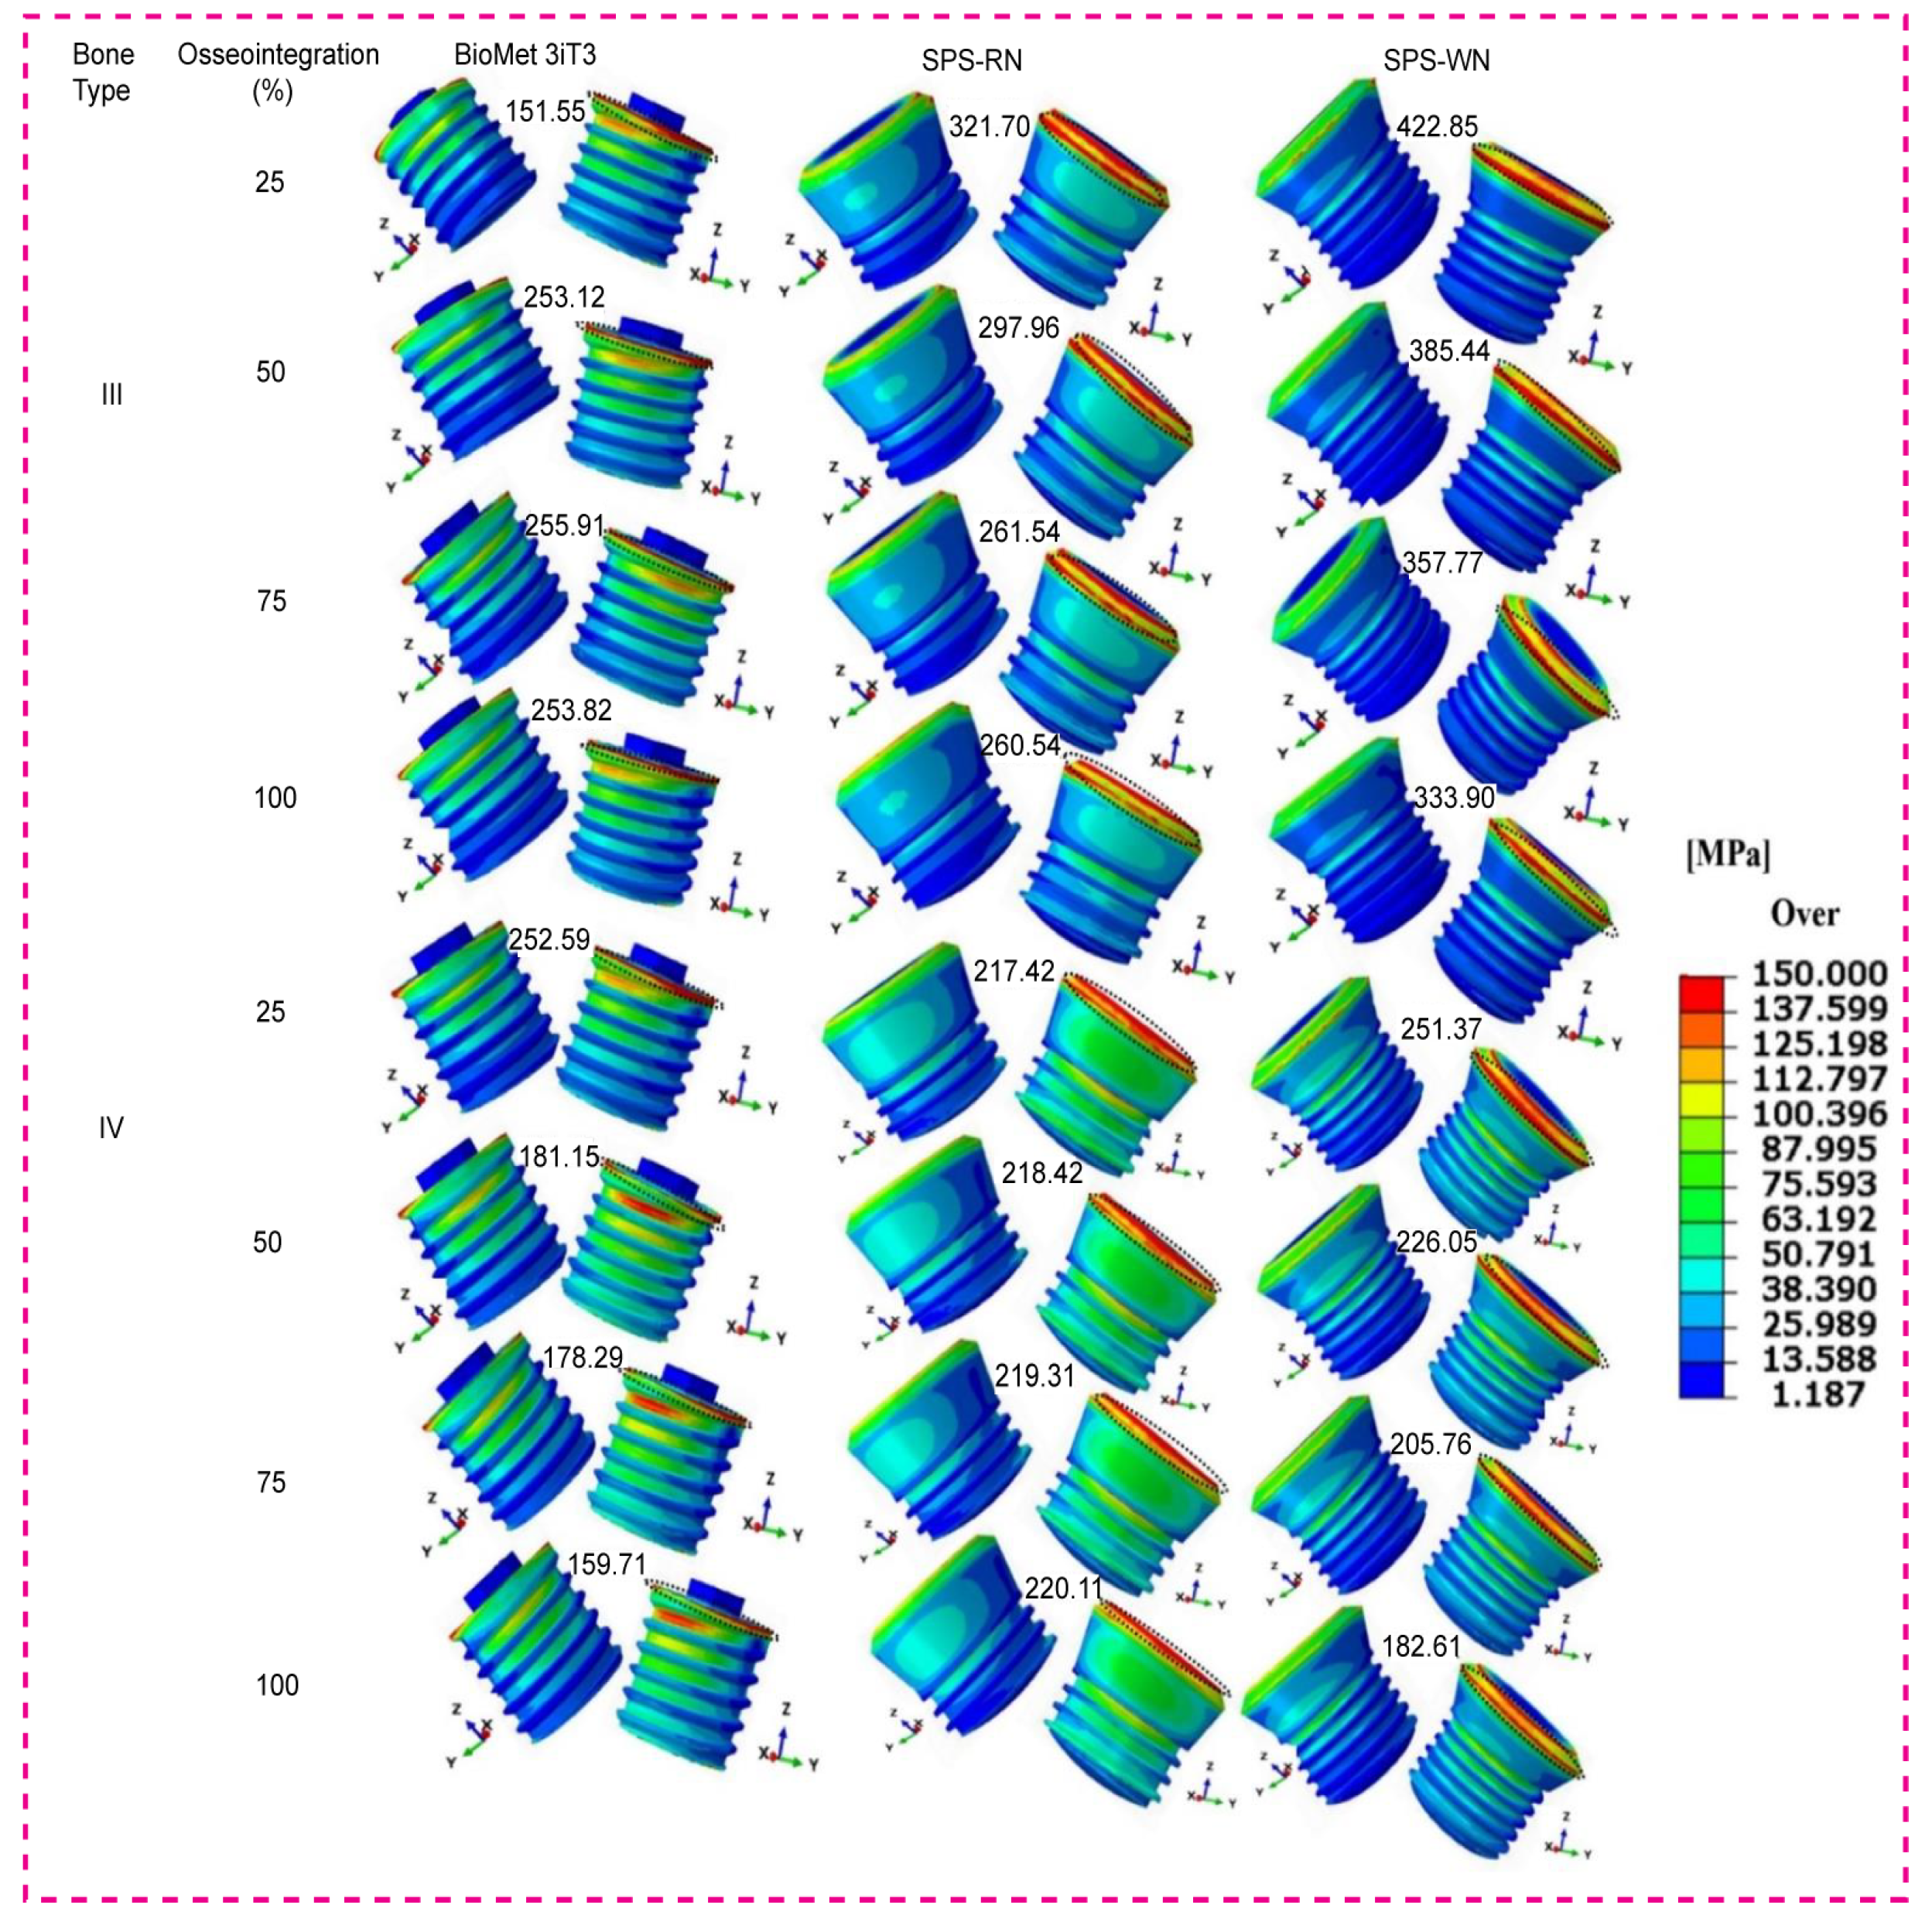
For three types of short implants—BioMet 3iT3, SPS-WN, and SPS-RN—at different stages of osseointegration, Figure 4 below shows the highest von Mises stress at the bone–implant contact (BIC) area. This is the area where the bone hole meets the implant’s angled neck. The black dotted circles in the illustrations represent the highest stress position in the associated contour plots.
For all implant types, including bone type III, the maximum von Mises stress values decrease as osseointegration increases. For example, the BioMet 3iT3 implant experiences a stress drop from 151.75 MPa at 25% osseointegration to 147.41 MPa at 100% osseointegration. The SPS-WN implant exhibits a greater reduction in stress, from 209.83 MPa at 25% osseointegration to 156.82 MPa at 100%. Similarly, the SPS-RN implant experiences a slight drop from 177.25 MPa to 176.77 MPa across the same range. These findings show that when osteointegration improves, the load distribution at the bone–implant interface becomes more uniform, resulting in reduced stress concentrations and perhaps increasing implant stability. In bone type IV, the pattern is more complicated. The BioMet 3iT3 implant’s von Mises stress first increases from 120 MPa at 25% osseointegration to 181.15 MPa at 50%, then gradually decreases to 162.18 MPa at 100% osseointegration. The stress on the SPS-WN implant, on the other hand, drops from 183.85 MPa at 25% osseointegration to 135.31 MPa at 100%. This shows that better osseointegration lowers stress at the interface, especially in bone that is not as dense. The SPS-RN implant had generally steady stress values of 162.49 MPa throughout various osseointegration phases, with a little rise to 166.7 MPa at 100% osseointegration. These findings, as seen in the following figure, emphasize the necessity of attaining perfect osseointegration to reduce stress concentrations at the bone–implant interface, possibly lowering the likelihood of implant failure and improving long-term stability. Variations in stress between implant types and bone conditions further indicate that implant design and bone quality have a considerable impact on the mechanical environment at the BIC, which is crucial for dental implant success.

3.4. Maximum von Mises Stress in Three Types of Short Dental Implants

The contour plots of the maximum von Mises stress, representing the distribution of mechanical stress during loading, for the three types of short dental implants, are depicted in Figure 5 below.
As osseointegration advances, bone type III for the BioMet 3iT3 implant exhibits a significant rise in von Mises stress, beginning at 151.55 MPa at 25% and culminating at 255.91 MPa at 75%. Interestingly, with 100% osseointegration, the stress drops significantly to 253.82 MPa. The SPS-RN implant follows a similar trajectory, with a high starting stress of 321.7 MPa at 25% osseointegration and gradually decreasing to 260.51 MPa at 100% osseointegration. However, the SPS-WN implant suffers the greatest stress values of any implant type, beginning at 422.85 MPa at 25% osseointegration and decreasing to 333.9 MPa at 100%. These findings suggest that the SPS-WN implant puts more stress on the bone around it in bone type III, even when osseointegration improves. This raises the possibility of implant–bone interface stress concentration. Bone type IV for the BioMet 3iT3 implant has a high initial von Mises stress of 252.59 MPa at 25% osseointegration, which decreases significantly to 179.51 MPa at 100%. The SPS-RN implant has a more constant stress level, beginning at 217.42 MPa at 25% osseointegration and rising slightly to 220.11 MPa at 100%. The von Mises stress on the SPS-WN implant slowly goes down, from 251.37 MPa at 25% osseointegration to 182.61 MPa at 100%. This shows that this implant design benefits the most from better osseointegration in bone type IV, which is less dense. Overall, the von Mises stress contours show that osseointegration is crucial for lowering stress at the bone–implant contact. When osseointegration is better, implants with higher starting stress values (SPS-WN) show bigger reductions, especially in bones that are not very thick (type IV). These results, as shown in the contour plots, highlight the need for attaining optimum osseointegration to reduce mechanical stress and improve implant stability.
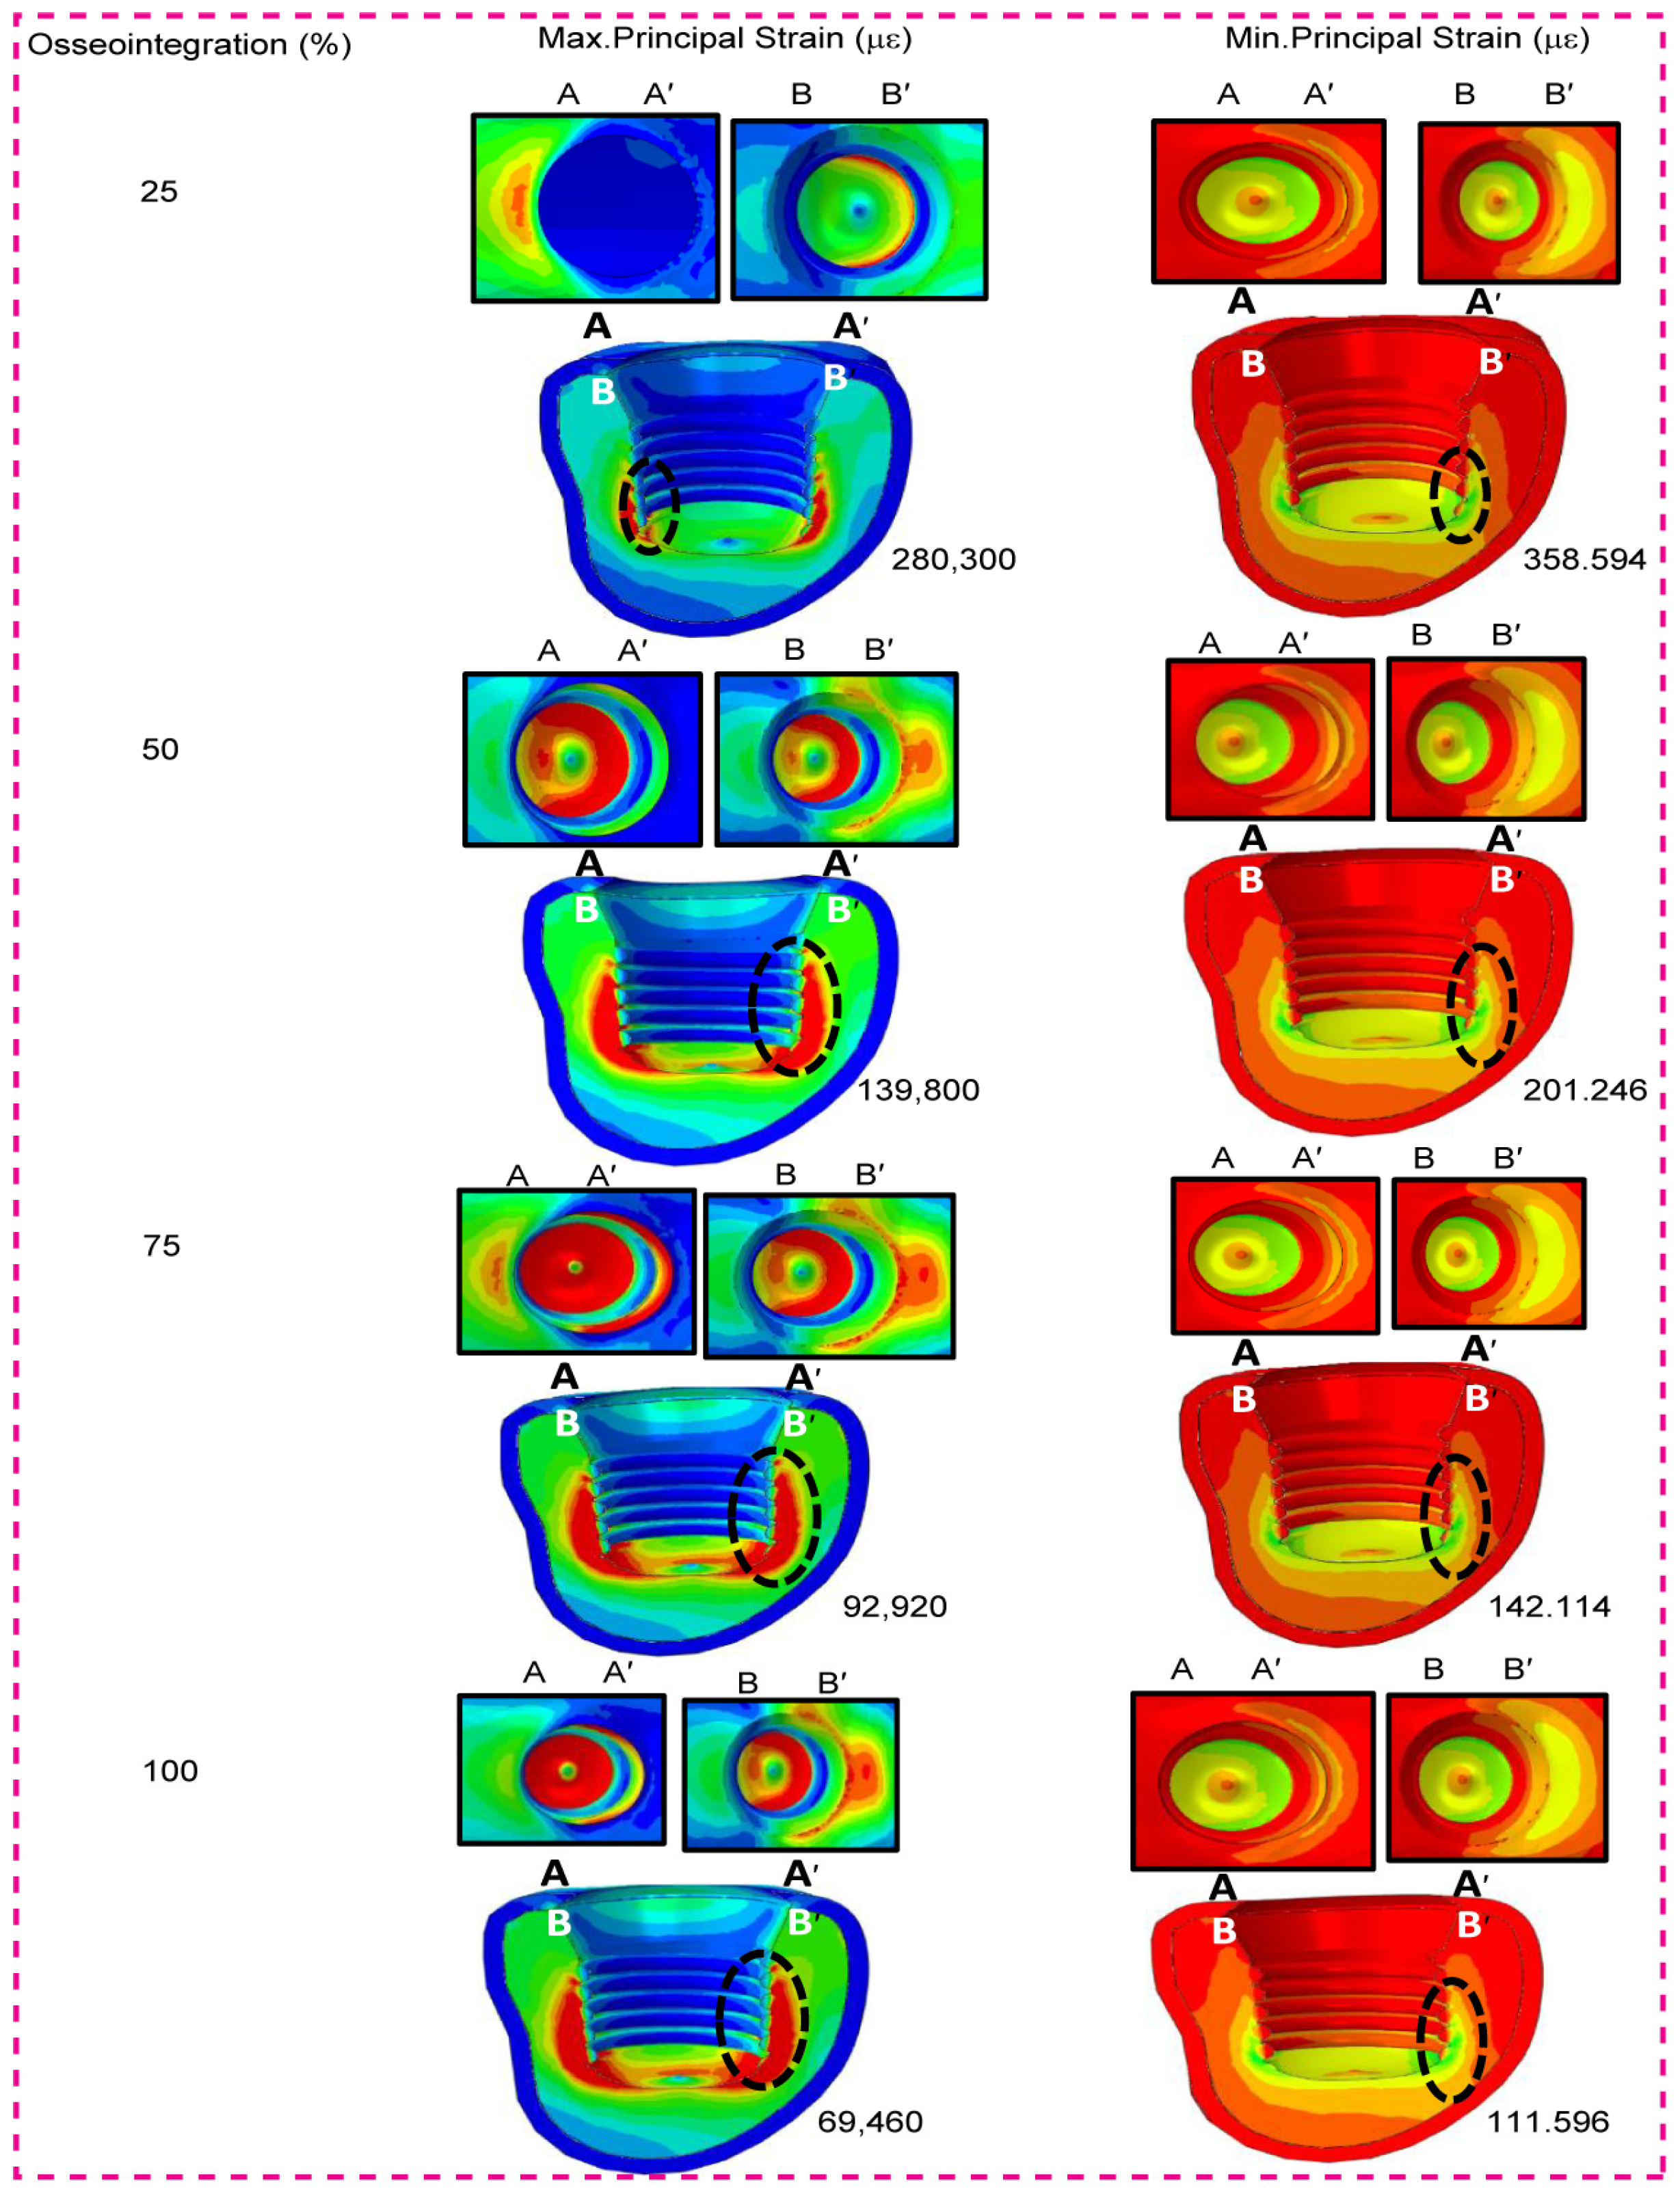
When the SPS-WN implant model was used, the table showed the highest and lowest primary stresses in micrometers (µm) for low-density cancellous bone (bone type IV) at different levels of osseointegration (25%, 50%, 75%, and 100%). We particularly measured the strain values at the bone–implant contact interface, and the contour plots displayed the locations of these strains as black dotted circles. As shown in the table and contour graphs, the maximum principal strain decreases significantly as osseointegration progresses. At 25% osseointegration, the maximum strain is 280,300 µε, which gradually decreases to 69,460 µε at 100% osseointegration. This decrease in maximum strain suggests that as the bone–implant contact becomes more integrated, the bone can better distribute the load, resulting in less localized deformation. With osseointegration, the minimum principal strain decreases from 358.594 at 25% to 111.596 at 100%. This pattern demonstrates a constant increase in the implant’s mechanical stability as osseointegration continues, with the bone experiencing reduced strain levels under the same loading conditions. These decreases in both maximum and lowest primary stresses indicate that establishing better osseointegration is critical for minimizing mechanical strain on the bone–implant interface, thereby improving implant stability and lifespan.

3.5. Low-Density Cancellous Bone Maximum and Minimum Principal Strain

Figure 6 shows that when osseointegration happens, both the maximum and minimum principal strains for the SPS-WN implant model in low-density cancellous bone (bone type IV) go down by a large amount. The highest principal strain falls from 280,300 at 25% osseointegration to 69,460 at 100%, while the lowest principal strain drops from 358.594 to 111.596 across the same range. These decreases show that as the bone–implant contact becomes more integrated, the bone efficiently distributes mechanical stresses, reducing localized deformation and improving implant stability. Black dotted circles mark the positions of the highest and lowest principal strains at the implant–cancellous bone contact, illustrating key stress concentration zones.

3.6. High-Density Cancellous Bone Maximum and Minimum Principal Strain

As osseointegration advances, Figure 7 presented findings for the SPS-WN implant model in high-density cancellous bone (bone type III), demonstrating a significant reduction in both maximum and minimum principal strains. The highest main strain falls from 69,050 at 25% osseointegration to 16,450 at 100%, whereas the lowest principal strain drops from 157.457 to 64.1361 within the same range. These lower strains mean that as the bone–implant contact gets stronger, the bone is better able to spread mechanical stresses, which means that the implant is less likely to deform in one place and is more stable overall. Black dotted circles at the implant–cancellous bone contact depict the highest and lowest principal strains, highlighting key stress concentration locations. The contour plots further demonstrate this tendency, showing a more equal strain distribution throughout the top surface of the bone holes (A–A′ and B–B′) as osseointegration improves, which is critical for the implant’s durability.

3.7. Low- and High-Density Cancellous Bone Maximum and Minimum Principal Strain in Three Types of Short Dental Implants

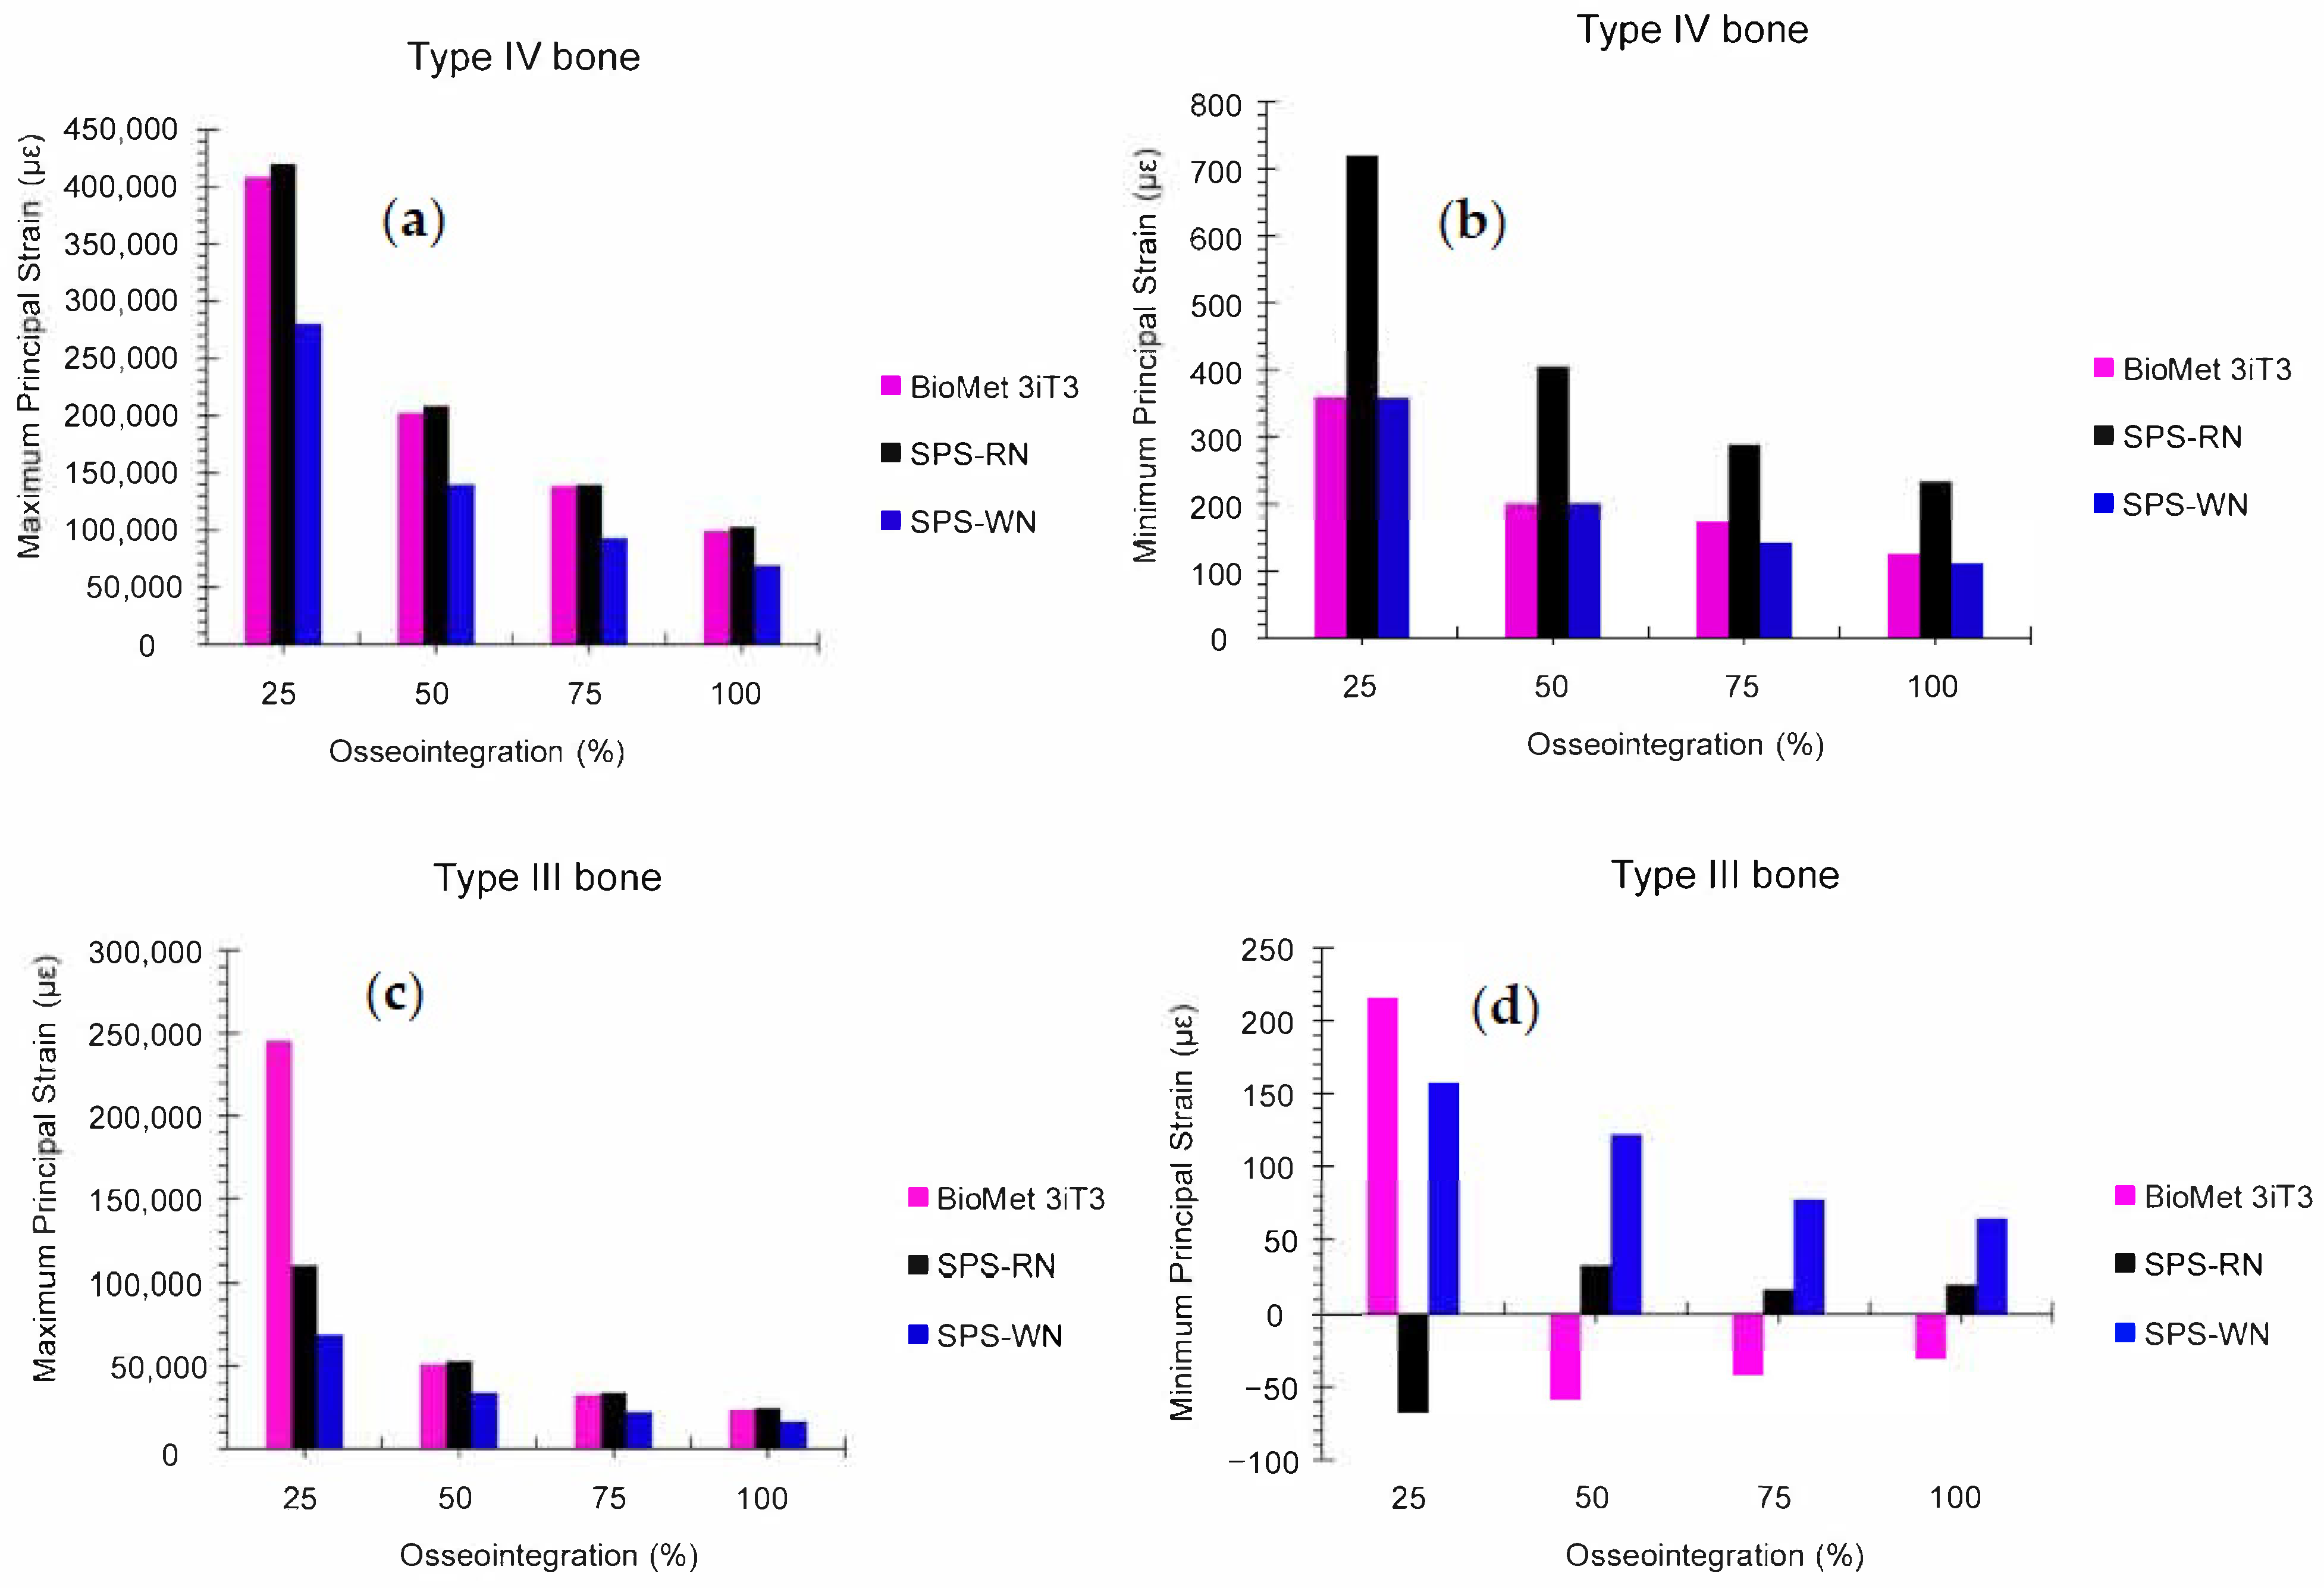
Figure 8a shows the bar chart for maximum principal strain in low-density cancellous bone (bone type IV) for the BioMet 3iT3, SPS-RN, and SPS-WN implant types at four different levels of osseointegration: 25%, 50%, 75%, and 100%.We can see the highest principal strain values for low-density cancellous bone (bone type IV) at different osseointegration levels (25%, 50%, 75%, and 100%) for three implant models below. These are BioMet 3iT3, SPS-RN, and SPS-WN. The bar chart, which originally depicted these comparisons, generated these figures.
At 25% osseointegration, the SPS-RN implant model has the greatest maximum principal strain (419,862 µε), followed closely by the BioMet 3iT3 model (408,801 µε). At this early stage of osseointegration, the SPS-WN implant had a significantly reduced strain of 280,000 µε. As osteointegration progresses to 50%, 75%, and 100%, all three implant models show a significant decrease in maximum principal strain, with the SPS-WN model consistently having the lowest strain values at each stage. At 100% osseointegration, the SPS-WN model has the lowest maximum principal strain of 69,000 µε, suggesting a significant increase in mechanical stability when the implant completely integrates with the bone. The results, shown in the bar chart, show that the SPS-WN model is better at reducing strain at higher levels of osseointegration, especially when there is 100% bone–implant contact. The SPS-RN model experiences the most strain when osseointegration is low. This decrease in stress as osseointegration progresses underscores the need for complete integration for the implant’s long-term stability and success.
The data in Figure 8b show a considerable decrease in minimum principal strain in low-density cancellous bone (bone type IV) across the BioMet 3iT3, SPS-RN, and SPS-WN implant models as osseointegration advances from 25% to 100%. The SPS-WN model consistently has the lowest minimum principal strain, ranging from 280,000 at 25% osseointegration to 69,000 at 100%, indicating improved mechanical stability. While the BioMet 3iT3 and SPS-RN models have higher strain values throughout the osseointegration process, the highest strains were seen at the lowest levels of osseointegration. This shows how important it is to achieve full osseointegration to lower mechanical stress and improve the long-term success of the implant.
There are four levels of osseointegration shown in Figure 8c. These levels are 25%, 50%, 75%, and 100%. The graph shows the maximum principal strain in high-density cancellous bone (bone type III) for the BioMet 3iT3, SPS-RN, and SPS-WN implant types. At 25% osseointegration, the BioMet 3iT3 implant model had the largest maximum principal strain, reaching 245,281 µε. This is much larger than the strains reported in the SPS-RN and SPS-WN models, which were 109,945 µε and 69,000 µε, respectively. As osseointegration progresses, all three implant types exhibit a significant decrease in maximum principal strain. At 100% osseointegration, the BioMet 3iT3 model strain drops to 23,581.7 µε, whereas the SPS-RN and SPS-WN models have even lower strain values of 24,633.1 µε and 16,446.6 µε, respectively. Notably, the SPS-WN model always has the lowest maximum principal strain across all levels of osteointegration. This shows that it works better at reducing strain at the bone–implant interface as osteointegration progresses.

4. Discussion

This study supports the claim that higher osseointegration improves load distribution, decreases stress and strain in cortical and cancellous bones, and improves the mechanical stability and lifetime of dental implants. The findings reveal that when osseointegration levels rise, the mechanical behavior of the bone–implant interface improves, resulting in greater load transfer and less deformation in both bone types. Specifically, when osseointegration improves, stress increases but strain drops significantly, showing that the bone becomes more capable of carrying heavier loads with less distortion. Stress and strain in the cancellous bone diminish as osseointegration increases, lending credence to the notion that increased bone–implant contact lessens the risk of mechanical overload and bone resorption. These findings are also in agreement with previous research, which has shown that much higher osseointegration decreases cancellous bone strain and increases implant stability without surpassing the bone stress threshold [26].
In the cortical bone, as osseointegration progresses, the maximum stress increases but strain levels decrease. Specifically, stress rises from 158.4 MPa at 25% osseointegration to 174.3 MPa at 75% osseointegration, indicating that better bone–implant contact improves load transfer. The overall stability of the implant is enhanced by this rise in stress, which emphasizes the increased load-bearing function that the cortical bone takes on as osseointegration advances. Simultaneously, the decrease in strain from 25,590 µm to 9997 µm demonstrates that the cortical bone becomes better capable of tolerating these stresses without significantly deforming. Our results are in line with earlier research that suggests osseointegration helps the bone grow around implants and makes the bone–implant interface stronger. This allows the cortical bone to keep its mechanical integrity under higher functional pressures while reducing strain [37].
Osteointegration has a particularly substantial influence on bone type IV, which is less dense and more susceptible to mechanical stress. As osseointegration progresses from 25% to 100%, the cortical bone’s maximum stress drops from 330.1 MPa to 300.1 MPa. Additionally, strain reduces from 89,770 µm to 21,710 µm. Similarly, the cancellous bone exhibits a drop in stress from 26.12 MPa to 25.45 MPa, with a significant strain decrease from 419,900 µm to 102,700. These findings demonstrate how increased osseointegration helps control the mechanical demands of lower-density bones such as type IV, lowering the risk of implant failure due to excessive stress and deformation. Clinically, this stresses the need to optimize implant designs and surgical methods to enable speedy and full osseointegration.
As osseointegration progresses, the mechanical response in cancellous bone decreases significantly from 19.23 MPa at 25% to 17.79 MPa at 75%, indicating more effective load transmission to the surrounding bone and a lower likelihood of stress-induced bone resorption. Furthermore, cancellous bone strain drops significantly from 106,000 µm to 32,640 µm, indicating improved mechanical stability and reduced deformation risk in weaker bone types. These findings emphasize the critical significance of osseointegration in maintaining the bone–implant contact, especially in less thick bone. Earlier studies have shown that improving osseointegration is important for distributing the load evenly across both cortical and cancellous bones, which lowers the risk of implant failure [38]. These results support the current study’s findings.
These results highlight the need for customizing implant designs and surgical methods to promote speedy and successful osseointegration, particularly for patients with low-density bone types. Complete osseointegration is important for the long-term success of dental implants. Surgical precision and surface treatments like roughening or bioactive coatings play key roles in improving patient outcomes and increasing bone–implant contact. The research also found that when osseointegration proceeds, shear stress in the cancellous bone rises somewhat in certain models, such as the BioMet 3iT3, suggesting better load transmission. The SPS-RN and SPS-WN models, on the other hand, show a decrease in shear stress in the cortical bone. This means that the loads are spread out more evenly and there are fewer areas of high stress, which is very important for preventing problems like bone damage or implant loosening. Also, as osseointegration gets better, von Mises stress drops at the bone–implant interface, especially in the SPS-WN implant, going from 209.83 MPa to 156.82 MPa. This shows how important it is to keep stress levels low to avoid bone loss and implant failure. Overall, enhancing osseointegration is critical to assuring implants’ mechanical stability and lifespan, specifically for less dense bone. Based on attributes gathered from the literature, we created bone models to represent the essential anatomical aspects of cortical and cancellous bone. They use transversely isotropic material behavior to mimic the anisotropy seen in actual bone. However, variables like remodeling and patient-specific characteristics impact the microstructure and mechanical response of actual bone, which these models cannot account for. Despite these simplifications, the models closely approximate actual bone mechanics under static stress circumstances, making them appropriate for biomechanical simulations.
To promote osseointegration, doctors may use a variety of approaches, including surface modification procedures like sandblasting and acid etching, which increase implant surface roughness and improve bone–implant integration [39]. Furthermore, bioactive coatings such as hydroxyapatite or growth hormones may promote bone repair and osseointegration. Short implants also assist in better dispersing occlusal stresses, lowering the risk of implant overload [40]. Furthermore, we can customize patient-specific aspects like preoperative bone augmentation, systemic health monitoring, and rapid loading procedures to optimize the osseointegration results [41].
Despite the remarkable results of the study, there are some limitations. Researchers should use a wider range of short implant models to examine the applicability of the findings. Furthermore, the lack of consideration for crucial implant system components such as the crown, retaining screw, cement, and abutments in this research may limit its applicability to real-world clinical scenarios. Finally, the study only examined static loading situations; future research should look into dynamic loading scenarios to better represent the stresses that dental implants encounter on a regular basis. While finite element analysis (FEA) is useful for understanding the biomechanical behavior of implants, it only works in controlled settings. Clinical conditions include further complications, such as biological reactions, tissue integration, and dynamic loads, that the models do not completely represent. As a consequence, the findings of this research should serve as a guide, not a replacement, for medical decisions. The results supplement clinical evaluations by providing biomechanical data to aid implant design and selection. While the findings give important biomechanical insights, more research using models imitating lower bone height is required to prove their full clinical application in such circumstances.

5. Conclusions

This research examines the biomechanical performance of three kinds of short dental implants—BioMet 3iT3, SPS-RN, and SPS-WN—through four phases of osseointegration (25%, 50%, 75%, and 100%) in cancellous bones with high and low densities (bone type III and IV, respectively). The following summaries are based on the current research.
Osseointegration improves implant stability: Across all implant types and bone densities, increasing osseointegration results in a substantial decrease in both von Mises stress and principal strains at the bone–implant interface, indicating better load distribution and a reduced likelihood of localized destruction of the bone.
The SPS-WN implant exhibits superior biomechanical performance, with the lowest maximum and minimum principal strains at all phases of osseointegration, particularly at 100% integration. This shows that the SPS-WN implant design is more successful at reducing mechanical stress while increasing stability, making it ideal for individuals with variable bone densities.
The effect of bone density on stress distribution: All implants showed higher initial stress and strain in low-density cancellous bone (bone type IV). This shows how important it is to achieve complete osseointegration to reduce these effects. The SPS-WN implant was particularly successful in lowering stress in low-density bone, indicating its potential for use in patients with poor bone quality.
BioMet 3iT3 implant needs careful consideration: The BioMet 3iT3 implant had greater starting strain values, but it benefitted from enhanced osseointegration, resulting in considerable stress and strain reductions. However, the fact that it consistently shows higher strain values than the SPS-WN model suggests that it might not work as well when bone quality is low or osseointegration is weak.
The critical role of complete osseointegration: The research emphasizes the need for 100% osseointegration for proper implant function. Incomplete osseointegration is linked to increased stress concentrations and a higher likelihood of implant failure, especially in less dense bones.
In conclusion, this research highlights the significance of implant design and osseointegration in assuring mechanical stability and long-term success of dental implants. The SPS-WN implant type is the most biomechanically advantageous, especially in complicated bone conditions, making it an excellent choice for clinical applications requiring excellent osseointegration.

Author Contributions

Conceptualization, D.B.A., M.T. and S.-J.H.; methodology, D.B.A., S.-J.H. and M.T.; software, D.B.A., M.T. and S.-J.H.; validation, D.B.A., S.-J.H. and M.T.; formal analysis, D.B.A.; investigation, D.B.A.; data curation, D.B.A.; writing—original draft preparation, D.B.A.; writing—review and editing, D.B.A., M.T. and S.-J.H.; supervision, M.T. and S.-J.H.; project administration, S.-J.H. and M.T. All authors have read and agreed to the published version of the manuscript.

Funding

This research received no external funding.

Data Availability Statement

The original contributions presented in the study are included in the article, further inquiries can be directed to the corresponding author/s.

Acknowledgments

The authors acknowledge the use of the language editing software QuillBot 3.60.8 (https://quillbot.com/) for enhancing grammar, spelling, paraphrasing, and plagiarism checking.

Conflicts of Interest

The authors declare no conflicts of interest.

References

  1. Rane, A.V.; Abitha, V.K.; Sisanth, K.S.; Kanny, K. Introduction to Polymer Materials for Implants. In Polymeric Materials for Biomedical Implants; Elsevier: Amsterdam, The Netherlands, 2024; pp. 1–29. [Google Scholar]
  2. Michalakis, K.; Misci, S.; Abdallah, A.; Vasilaki, D.; Hirayama, H. Implant Supportive Maintenance for Fixed Prosthetic Rehabilitations: The Patient with the Complete Arch Fixed Implant–Supported Rehabilitation: Prosthetic Concepts to Optimize Maintenance Protocols. In Saving Dental Implants; Wiley: Hoboken, NJ, USA, 2024; pp. 357–380. [Google Scholar] [CrossRef]
  3. Xu, X.; Zuo, J.; Zeng, H.; Zhao, Y.; Fan, Z. Improving Osseointegration Potential of 3D Printed PEEK Implants with Biomimetic Periodontal Ligament Fiber Hydrogel Surface Modifications. Adv. Funct. Mater. 2024, 34, 2308811. [Google Scholar] [CrossRef]
  4. Lemos, C.A.A.; Ferro-Alves, M.L.; Okamoto, R.; Mendonça, M.R.; Pellizzer, E.P. Short Dental Implants versus Standard Dental Implants Placed in the Posterior Jaws: A Systematic Review and Meta-Analysis. J. Dent. 2016, 47, 8–17. [Google Scholar] [CrossRef] [PubMed]
  5. Trombelli, L.; Farina, R.; Tomasi, C.; Vignoletti, F.; Paolantoni, G.; Giordano, F.; Ortensi, L.; Simonelli, A. Factors Affecting Radiographic Marginal Bone Resorption at Dental Implants in Function for at Least 5 Years: A Multicenter Retrospective Study. Clin. Oral Implants Res. 2024. [Google Scholar] [CrossRef] [PubMed]
  6. Scarano, A.; Khater, A.G.A.; Gehrke, S.A.; Inchingolo, F.; Tari, S.R. Animal Models for Investigating Osseointegration: An Overview of Implant Research over the Last Three Decades. J. Funct. Biomater. 2024, 15, 83. [Google Scholar] [CrossRef] [PubMed]
  7. Villalobos-Tinoco, J.; Fischer, N.G.; Jurado, C.A.; Sayed, M.E.; Feregrino-Mendez, M.; de la Mata Garcia, O.; Tsujimoto, A. Combining a Single Implant and a Veneer Restoration in the Esthetic Zone. Int. J. Esthet. Dent. 2020, 15, 428–439. [Google Scholar]
  8. Tseng, K.-F.; Shiu, S.-T.; Hung, C.-Y.; Chan, Y.-H.; Chee, T.-J.; Huang, P.-C.; Lai, P.-C.; Feng, S.-W. Osseointegration Potential Assessment of Bone Graft Materials Loaded with Mesenchymal Stem Cells in Peri-Implant Bone Defects. Int. J. Mol. Sci. 2024, 25, 862. [Google Scholar] [CrossRef]
  9. Luo, F.; Mo, Y.; Jiang, J.; Wen, J.; Ji, Y.; Li, L.; Wan, Q. Advancements in Dental Implantology: The Alveolar Ridge Split Technique for Enhanced Osseointegration. Clin. Implant Dent. Relat. Res. 2024, 26, 1012–1031. [Google Scholar] [CrossRef]
  10. Mohammadi, A.; Dehkordi, N.R.; Mahmoudi, S.; Rafeie, N.; Sabri, H.; Valizadeh, M.; Poorsoleiman, T.; Jafari, A.; Mokhtari, A.; Khanjarani, A. Effects of Drugs and Chemotherapeutic Agents on Dental Implant Osseointegration: A Narrative Review. Curr. Rev. Clin. Exp. Pharmacol. Former. Curr. Clin. Pharmacol. 2024, 19, 42–60. [Google Scholar] [CrossRef]
  11. Šromová, V.; Sobola, D.; Kaspar, P. A Brief Review of Bone Cell Function and Importance. Cells 2023, 12, 2576. [Google Scholar] [CrossRef]
  12. Choukroun, E.; Parnot, M.; Surmenian, J.; Gruber, R.; Cohen, N.; Davido, N.; Simonpieri, A.; Savoldelli, C.; Afota, F.; El Mjabber, H. Bone Formation and Maintenance in Oral Surgery: The Decisive Role of the Immune System—A Narrative Review of Mechanisms and Solutions. Bioengineering 2024, 11, 191. [Google Scholar] [CrossRef]
  13. Menchini-Fabris, G.B.; Toti, P.; Crespi, G.; Covani, U.; Crespi, R. Distal Displacement of Maxillary Sinus Anterior Wall versus Conventional Sinus Lift with Lateral Access: A 3-Year Retrospective Computerized Tomography Study. Int. J. Environ. Res. Public Health 2020, 17, 7199. [Google Scholar] [CrossRef] [PubMed]
  14. Rizvi, Z.H.; Bhangoo, H.S.; Meyer, A.J.; Rao, G.V.; Buttar, N.S. Full-Thickness Endoscopic and Combined Laparoscopic-Endoscopic Techniques. In Advanced Techniques for Endoscopic Resection in the GI Tract; CRC Press: Boca Raton, FL, USA, 2024; pp. 387–402. [Google Scholar]
  15. Bornstein, M.M.; Al-Nawas, B.; Kuchler, U.; Tahmaseb, A. Consensus Statements and Recommended Clinical Procedures Regarding Contemporary Surgical and Radiographic Techniques in Implant Dentistry. Int. J. Oral Maxillofac. Implants 2014, 29, 78. [Google Scholar] [CrossRef] [PubMed]
  16. Hossain, N.; Islam, M.A.; Ahmed, M.M.S.; Chowdhury, M.A.; Mobarak, M.H.; Rahman, M.M.; Hossain, M.D.H. Advances and Significances of Titaniumin Dental Implant Applications. Results Chem. 2024, 7, 101394. [Google Scholar] [CrossRef]
  17. Liang, L.; Wu, X.; Yan, Q.; Shi, B. Are Short Implants (≤8.5 Mm) Reliable in the Rehabilitation of Completely Edentulous Patients: A Systematic Review and Meta-Analysis. J. Prosthet. Dent. 2024, 131, 826–832. [Google Scholar] [CrossRef]
  18. Strauss, F.J.; Gil, A.; Smirani, R.; Rodriguez, A.; Jung, R.; Thoma, D. The Use of Digital Technologies in Peri-Implant Soft Tissue Augmentation–A Narrative Review on Planning, Measurements, Monitoring and Aesthetics. Clin. Oral Implants Res. 2024, 35, 922–938. [Google Scholar] [CrossRef]
  19. Truong, T.-D.-N.; Pradhan, A.M.S.; Nguyen, T.-T.; Tran, M.-H.; Nguyen, C.-K.; Ho, D.-D.; Huynh, T.-C. Bone-Implant Osseointegration Monitoring Using Electro-Mechanical Impedance Technique and Convolutional Neural Network: A Numerical Study. J. Nondestruct. Eval. 2024, 43, 10. [Google Scholar] [CrossRef]
  20. Alemayehu, D.B.; Huang, S.-J.; Koricho, E.G. Experimental and FEM Analysis of Three Carbon Steel Characterization under Quasi-Static Strain Rate for Bumper Beam Application. In MATEC Web of Conferences, Proceedings of the 2nd International Conference on Precision Machinery and Manufacturing Technology (ICPMMT 2017), Kending, Taiwan, 19–21 May 2017; EDP Sciences: Les Ulis, France, 2017; Volume 123. [Google Scholar]
  21. Alemayehu, D.B.; Masahiro, T. Enhanced Energy Absorption with Bioinspired Composite Triply Periodic Minimal Surface Gyroid Lattices Fabricated via Fused Filament Fabrication (FFF). J. Manuf. Mater. Process. 2024, 8, 86. [Google Scholar] [CrossRef]
  22. Alemayehu, D.B.; Jeng, Y.R. Three-Dimensional Finite Element Investigation into Effects of Implant Thread Design and Loading Rate on Stress Distribution in Dental Implants and Anisotropic Bone. Materials 2021, 14, 6974. [Google Scholar] [CrossRef]
  23. Alemayehu, D.B.; Todoh, M.; Huang, S.J. Advancing 3D Dental Implant Finite Element Analysis: Incorporating Biomimetic Trabecular Bone with Varied Pore Sizes in Voronoi Lattices. J. Funct. Biomater. 2024, 15, 94. [Google Scholar] [CrossRef]
  24. Alemayehu, D.B. Design and Development of Shell and Tube Heat Exchanger for Harar Brewery Company Pasteurizer Application (Mechanical and Thermal Design). Am. J. Eng. Res. 2013, 2, 99–109. [Google Scholar]
  25. Alshoaibi, A.M.; Fageehi, Y.A. Simulation of Quasi-Static Crack Propagation by Adaptive Finite Element Method. Metals 2021, 11, 98. [Google Scholar] [CrossRef]
  26. Yang, Y.; Liu, Y.; Yuan, X.; Ren, M.; Chen, X.; Luo, L.; Zheng, L.; Liu, Y. Three-Dimensional Finite Element Analysis of Stress Distribution on Short Implants with Different Bone Conditions and Osseointegration Rates. BMC Oral Health 2023, 23, 220. [Google Scholar] [CrossRef] [PubMed]
  27. Hisam, M.J.; Lim, J.Y.; Kurniawan, D.; Nor, F.M. Stress Distribution Due to Loading on Premolar Teeth Implant: A Three Dimensional Finite Element Analysis. Procedia Manuf. 2015, 2, 218–223. [Google Scholar] [CrossRef]
  28. Ye, Z.; Ye, H.; Wu, Y.; Jiang, Z.; Yao, H.; Xu, X.; Zhang, Y.; Du, W.; Li, W.; Zheng, Y. Effect of Bone Mass Density and Alveolar Bone Resorption on Stress in Implant Restoration of Free-End Edentulous Posterior Mandible: Finite Element Analysis of Double-Factor Sensitivity. Ann. Anat.-Anat. Anz. 2024, 253, 152210. [Google Scholar] [CrossRef]
  29. Kurniawan, D.; Nor, F.M.; Lee, H.Y.; Finite, J.Y.L. Finite Element Analysis of Bone—Implant Biomechanics: Refinement through Featuring Various Osseointegration Conditions. Int. J. Oral Maxillofac. Surg. 2012, 41, 1090–1096. [Google Scholar] [CrossRef]
  30. Williams, J.L. Anisotropic Elasticity of Cortical and Cancellous Bone in the Posterior Mandible Increases Peri-Implant Stress and Strain under Oblique Loading. Clin. Oral Implant. Res. 1995, 12, 648–657. [Google Scholar]
  31. Lee, C.C.; Lin, S.C.; Kang, M.J.; Wu, S.W.; Fu, P.Y. Effects of Implant Threads on the Contact Area and Stress Distribution of Marginal Bone. J. Dent. Sci. 2010, 5, 156–165. [Google Scholar] [CrossRef]
  32. Farré-Pagès, N.; Augé-Castro, M.L.; Alaejos-Algarra, F.; Mareque-Bueno, J.; Ferrés-Padró, E.; Hernández-Alfaro, F. Relation between Bone Density and Primary Implant Stability. Med. Oral Patol. Oral Cir. Bucal 2011, 16, e62–e67. [Google Scholar] [CrossRef]
  33. Diao, Q.; Zeng, Y.; Chen, J. The Applications and Latest Progress of Ceramic 3D Printing. Addit. Manuf. Front. 2024, 3, 200113. [Google Scholar] [CrossRef]
  34. Liu, X.; Pang, F.; Li, Y.; Jia, H.; Cui, X.; Yue, Y.; Yang, X.; Yang, Q. Effects of Different Positions and Angles of Implants in Maxillary Edentulous Jaw on Surrounding Bone Stress under Dynamic Loading: A Three-Dimensional Finite Element Analysis. Comput. Math. Methods Med. 2019, 2019, 8074096. [Google Scholar] [CrossRef]
  35. Salavati, H.; Pullens, P.; Ceelen, W.; Debbaut, C. The Effect of a Necrotic Core on the Interstitial Fluid Pressure in Solid Tumors. In Proceedings of the 17th International Symposium on Computer Methods in Biomechanics and Biomedical Engineering and 5th Conference on Imaging and Visualization, Bonn, Germany, 7–9 September 2021. [Google Scholar]
  36. Dechow, P.C.; Nail, G.A. Elastic Properties of Human Supraorbital and Mandibular Bone. Am. J. Phys. Anthropol. 1993, 90, 291–306. [Google Scholar] [CrossRef] [PubMed]
  37. Tripathi, S.; Raheem, A.; Dash, M.; Kumar, P.; Elsebahy, A.; Singh, H.; Manivasagam, G.; Nanda, H.S. Surface Engineering of Orthopedic Implants for Better Clinical Adoption. J. Mater. Chem. B 2024. [Google Scholar] [CrossRef]
  38. Antoniac, I.; Valeanu, N.; Niculescu, M.; Antoniac, A.; Robu, A.; Popescu, L.; Manescu, V.; Anusca, D.; Enachescu, C.I. Outcomes of Birmingham Hip Resurfacing Based on Clinical Aspects and Retrieval Analysis of Failed Prosthesis. Materials 2024, 17, 3965. [Google Scholar] [CrossRef] [PubMed]
  39. Liu, Y.; Rath, B.; Tingart, M.; Eschweiler, J. Role of Implants Surface Modification in Osseointegration: A Systematic Review. J. Biomed. Mater. Res. Part A 2020, 108, 470–484. [Google Scholar] [CrossRef]
  40. Bjelić, D.; Finšgar, M. The Role of Growth Factors in Bioactive Coatings. Pharmaceutics 2021, 13, 1083. [Google Scholar] [CrossRef] [PubMed]
  41. Laubach, M.; Suresh, S.; Herath, B.; Wille, M.-L.; Delbrück, H.; Alabdulrahman, H.; Hutmacher, D.W.; Hildebrand, F. Clinical Translation of a Patient-Specific Scaffold-Guided Bone Regeneration Concept in Four Cases with Large Long Bone Defects. J. Orthop. Transl. 2022, 34, 73–84. [Google Scholar] [CrossRef] [PubMed]
Figure 1. Three-dimensional CAD model of the three dental implants and the bones.
Oral 04 00040 g001
Figure 2. Assembly of a short dental implant to its bone with mastication loading and BCs.
Oral 04 00040 g002
Figure 3. Finite element meshing of the short dental implants and bones.
Oral 04 00040 g003
Figure 4. Highest von Mises stress at the bone–implant contact (BIC) area for BioMet 3iT3, SPS-WN, and SPS-RN short implants at various stages of osseointegration, indicated by black dotted circles in the contour plots.
Oral 04 00040 g004
Figure 5. The three types of short dental implants—BioMet 3iT3, SPS-RN, and SPS-WN—went through the highest von Mises stress at different bone types and osseointegration percentages.
Oral 04 00040 g005
Figure 6. Low-density cancellous bone maximum and minimum principal strain for 25%, 50%, 75%, and 100% osseointegeration of bone implant for SPS-WN implant model.
Oral 04 00040 g006
Figure 7. Low-density cancellous bone maximum and minimum principal strain for 25%, 50%, 75%, and 100% osseointegeration of bone implant for SPS-WN implant model. A–A′ and B–B′ shows the contact location from bottom and Top surfaces. The black circle shows the location of Bone–implant interface maximum or minimum Principal strain.
Oral 04 00040 g007
Figure 8. Shows (a) the maximum principal strain for type IV bone, (b) the minimum principal strain for type IV bone, (c) the maximum principal strain for type III bone, and (d) the minimum principal strain for type IV bone, in the BioMet 3iT3, SPS-RN, and SPS-WN implant models for varied percentage of osseointegeration such as 25%, 50%, 75%, and 100%.
Oral 04 00040 g008
Table 1. Bone type according to cortical bone thickness and cancellous bone density [29,31].
Bone TypeCortical Bone ThicknessCancellous Bone Density
III1 mmHigh density
IV1 mmLow density
Table 2. Mechanical properties of the simulated materials [29,31].
PropertiesHigh-Density Cancellous BoneLow-Density Cancellous BoneCortical Bone
25%50%75%100%25%50%75%100%25%50%75%100%
Ex (MPa)287574861114857.5115172.523031506300945012,600
Ey (MPa)52.5105157.521010.52131.54231506300945012,600
Ez (MPa)287574861114857.5115172.52304850970014,55019,400
vxy0.050.050.050.050.050.050.050.050.30.30.30.3
vxz0.320.320.320.320.320.320.320.320.2530.2530.2530.253
vyz0.010.010.010.010.010.010.010.010.2530.2530.2530.253
Gxy (MPa)173451683.5710.5141212.524253637.54850
Gxz (MPa)108.5217325.543421.7543.565.2871425285042755700
Gyz (MPa)173451683.5710.5141425285042755700
Table 3. Summaries of the geometry and implant models evaluated.
ModelBrandDimensions (Diameter × Length)Description
Model IBiomet 3iT3 Short5 mm (D) × 4 mm (L)Biomet 3iT3 implant from Zimmer Biomet Dental, USA
Model IISRN-Straumann® SPS4.1 mm (D) × 4 mm (L)Standard Regular Neck Straumann Standard Plus Short implant from Holding AG, Switzerland
Model IIISWN-Straumann® SPS4.8 mm (D) × 4 mm (L)Standard Wide Neck Straumann Standard Plus Short implant from Holding AG, Switzerland
Table 4. The three short implant mesh model statistics.
Implant ModelImplantCancellous BoneCortical BoneAssembly
No. of NodesNo. of ElementsNo. of NodesNo. of ElementsNo. of NodesNo. of ElementsNo. of NodesNo. of Elements
BioMet 3iT373,108391,44847,751244,083559421,672126,453657,203
SPS-RN67,363363,52530,876149,142497419,015103,213531,682
SPS-WN88,074478,30749,333249,052766730,075145,074757,434
Table 5. Maximum stress and maximum strain for BioMet 3iT3 Short implant produced in bones due to applied patient biting load. With a dimension of 5 mm (D) × 6 mm (L).
Bone TypeOsseointegeration (%)Highest StressHighest Strain
Cortical (MPa)Cancellous (MPa)CorticalCancellous
III25158.419.230.025590.1060
50166.418.480.01390.05091
75174.317.790.0099970.03264
100182.117.150.0080470.02358
IV25303.018.620.049050.4088
50309.918.440.023790.2024
75316.218.360.015520.1387
100323.818.100.011890.09931
Table 6. Maximum stress and maximum strain for Standard Regular neck SRN-Straumann® Standard Plus Short (SPS) Implants, at 4 mm long, 4.1 mm diameter produced in bones due to applied patient biting load.
Bone TypeOsseointegration (%)Highest StressHighest Strain
Cortical (MPa)Cancellous (MPa)CorticalCancellous
III25137.038.480.041260.1099
50134.736.60.019880.05293
75134.134.880.012800.03402
100136.633.320.0092950.02463
IV25330.126.120.089770.4199
50319.125.910.044360.2084
75311.525.530.029670.1393
100300.125.450.021710.1027
Table 7. Maximum stress and maximum strain for Standard Wide Neck SWN-Straumann® Standard Plus Short (SPS) implants, at 4 mm long, 4.8 mm diameter produced in bones due to applied patient biting load.
Bone TypeOsseointegration (%)Highest StressHighest Strain
Cortical (MPa)Cancellous (MPa)CorticalCancellous
III25135.514.780.047500.06905
50127.114.270.022000.03396
75120.213.790.013680.02228
100114.313.340.0096310.01645
IV25399.115.730.097060.2803
50369.015.720.045230.1398
75344.015.700.028310.09292
100322.715.680.020040.06946
Table 8. The maximum shear stress that occurs along the three-plane due to static mastication load for all three models and conditions.
Implant ModelOsseointegeration (%)Cancellous BoneCortical Bone
IVIIIIVIII
Sxy (MPa)Sxz
(MPa)
Syz
(MPa)
Sxy
(MPa)
Sxz
(MPa)
Syz
(MPa)
Sxy
(MPa)
Sxz
(MPa)
Syz
(MPa)
Sxy
(MPa)
Sxz
(MPa)
Syz
(MPa)
BioMet 3iT3250.97184.0560.46261.6206.7600.770997.5355.3761.1958.5233.2236.71
501.6066.6950.76671.8067.3091.19099.3357.8264.4455.9327.7425.22
751.6206.7760.80931.7557.0121.161112.957.7943.4358.2232.1926.80
1001.5816.5670.75861.7066.7371.134102.867.9371.0160.4336.1528.38
SPS-RN251.5524.7330.90971.7448.2761.40978.3495.3574.0737.9650.7234.14
501.5464.6840.90371.7157.6341.35177.2795.4473.7839.2050.5335.09
751.5554.4880.90031.6867.1721.29977.2096.2974.5540.3250.3136.55
1001.5334.5160.89181.6587.3121.25275.2895.3775.9741.3650.0637.89
SPS-WN251.1055.0340.68541.2666.5661.03962.77106.937.4634.4460.7518.85
501.1025.0100.68511.2426.3061.01461.0593.3037.1332.9857.0318.83
751.0994.9840.68471.2196.0640.990359.4790.0136.8031.6354.3018.81
1001.0954.9610.68391.1976.0590.967557.9659.4136.4730.3851.9018.78
Sxy: Shear Stresses in XY plane, Sxz: Shear Stresses in XZ plane, Syz: Shear Stresses in YZ.
Disclaimer/Publisher’s Note: The statements, opinions and data contained in all publications are solely those of the individual author(s) and contributor(s) and not of MDPI and/or the editor(s). MDPI and/or the editor(s) disclaim responsibility for any injury to people or property resulting from any ideas, methods, instructions or products referred to in the content.