Article

Determining Aligner-Induced Tooth Movements in Three Dimensions Using Clinical Data of Two Patients

1
Biomaterials Science Center, Department of Biomedical Engineering, University of Basel, 4123 Allschwil, Switzerland
2
Core Facility for Micro- and Nanotomography, Department of Biomedical Engineering, University of Basel, 4123 Allschwil, Switzerland
3
Biomaterials Science Center, Department of Clinical Research, University of Basel, 4031 Basel, Switzerland
*
Author to whom correspondence should be addressed.
Oral 2024, 4(4), 487-504; https://doi.org/10.3390/oral4040039
Submission received: 26 June 2024 / Revised: 30 September 2024 / Accepted: 4 October 2024 / Published: 18 October 2024

Abstract

The effectiveness of a series of optically transparent aligners for orthodontic treatments depends on the anchoring of each tooth. In contrast with the roots, the crowns’ positions and orientations are measurable with intraoral scans, thus avoiding any X-ray dose. Exemplified by two patients, we demonstrate that three-dimensional crown movements could be determined with micrometer precision by registering weekly intraoral scans. The data show the movement and orientation changes in the individual crowns of the upper and lower jaws as a result of the forces generated by the series of aligners. During the first weeks, the canines and incisors were more affected than the premolars and molars. We detected overall tooth movement of up to about 1 mm during a nine-week active treatment. The data on these orthodontic treatments indicate the extent to which actual tooth movement lags behind the treatment plan, as represented by the aligner shapes. The proposed procedure can not only be used to quantify the clinical outcome of the therapy, but also to improve future planning of orthodontic treatments for each specific patient. This study should be treated with caution because only two cases were investigated, and the approach should be applied to a reasonably large cohort to reach strong conclusions regarding the efficiency and efficacy of this therapeutic approach.

Graphical Abstract

1. Introduction

During the last two decades, optically transparent aligner therapy has become more and more popular, although orthodontic treatments still often rely on metal brackets [1,2]. This development is in large part because optically transparent aligners are perceived as an appealing option due to esthetics and, more importantly, the possibility of removal for chewing food and tooth cleaning [3]. Furthermore, compared to traditional brackets, clear aligners provide a more stable course of treatment [4]. The digital workflow based on intraoral scanners has substantially facilitated aligner fabrication [5]. The performance of aligner therapy is continuously improving but not yet well quantified [6]. Some quantitative data, often combined with the clinical experience, are available [6]. The visualization of teeth, i.e., predictive, semiquantitative appearance, supports the improved planning of aligner therapy [7]. The following question arises: how can actual tooth movements and orientation changes be reasonably quantified?
An important parameter for successful therapy is the treatment duration [8]. There are well-known restrictions on the force limits to be applied [9]. Experts have generally agreed on two-week intervals for replacement with the successor aligner (see, e.g., ref. [10]). It is hypothesized that a more frequent change might be beneficial [11]. Therefore, the present case study uses weekly aligner changes with a related intraoral scan during the first nine weeks of active aligner therapy. Such an approach might be essential, because patients have provided negative feedback on the treatment duration [12].
Conventional polymeric aligners give rise to microplastics and additives that are detected within the patient’s body [13,14]. Therefore, the present study uses the NaturalignerTM, a polyethylene terephthalate glycol-modified product with a cellulose–polymer coating and naturally derived plasticizers, which reduce the unwanted phenomenon of non-degradable microparticles release. Finally, the NaturalignerTM orthodontic therapy provides a reasonable fit to the teeth [15].
The tooth movement in orthodontic treatments has been described on the microscopic level [16]. Here, however, we use oral scans to assess movement because they are accessible to many clinics and do not use X rays. With these intraoral scanners, only the crowns can be quantified with limited spatial resolution; thus, the proof of the related theories is restricted. With this study, we aim to propose a procedure for the quantification of the position changes in the individual crowns in the upper and lower jaws induced by aligner therapy.
We deal with the translational and rotational degrees of freedom (rotation, tip, inclination) for each individual crown, which is simply considered as a solid. Based on weekly oral scans and their registration, the progress of tooth arrangement is quantified down to the micrometer level. This series of oral scans of two patients acquired in the course of the therapy are combined and visualized by the video in the Supplementary Materials. They are directly compared with the therapy plans to determine the extent to which the actual orthodontic situation lags behind the scheduled plans.

2. Materials and Methods

2.1. Intraoral Scanner

To select an intraoral scanner for the clinical study, the suitability and accuracy of the four available scanners, Primescan (Dentsply Sirona, Charlotte, NC, USA), TRIOS® 3 (3shape, Copenhagen, Denmark), iTero Element 5D Plus scanner (Align Technology, San Jose, CA, USA), and Medit i700 (Medit Corp., Seongbuk-gu, Republic of Korea), were compared following the procedure published in [17]. A model was produced of a maxillary full denture with three parallel hollow cylinders at tooth positions 17 (C1), 21 (C2), and 27 (C3) (see ref. [17] and Figure 1a). It was milled out of an industrially manufactured polyether ether ketone (PEEK) block (Denseo PEEK blank, Denseo GmbH, Aschaffenburg, Germany) on a five-axis computerized-numerical-control milling machine (SilaMill 5, vhf camfacture AG, Ammerbuch, Germany, with 3 µm repeat accuracy) as previously described in Section 2.1 of ref. [17]. The PEEK model was scanned three times by an experienced dentist (I.F.). The operator followed the guidelines of the suppliers exactly.
The microtomography data of the PEEK model were used as reference. We selected the fourth dataset described in ref. [17] because of its high accuracy and its match to the CAD model. The three-dimensional data were acquired with a conventional tomography system, nanotom® m (phoenix|X-ray, GE Sensing & Inspection Technologies GmbH, Wunstorf, Germany) using an effective pixel length of 35 µm and averaging more than 120 voxels per reference center, which increased the accuracy to about 6 µm [17,18]. This works because the nanotom® m is designed for sub-micrometer resolution imaging, which was confirmed by investigations with a Siemens star [19], and, therefore, provides the necessary mechanical stability.
The model surfaces obtained by the intraoral scanners were compared with the reference surface using the following approach. First, the crown-like features and the hollow cylinders of the reference (see yellow and magenta objects in Figure 1b, respectively) were manually segmented using the software FreeCAD (version 0.19). The center of each hollow cylinder was determined by the geometrical mean of its thousands of surface points. Second, the surfaces from the scans were manually pre-aligned. Third, the reference surface was rigidly registered to the scans using the iterative closest point method from MATLAB (release R2020b, The MathWorks, Inc., Natick, MA, USA) with the optimization parameters set as follows: random sampling of 50% of points, 70% inlier ratio, maximum of 500 iterations, and 2.5 µm and 0.125 deg as convergence tolerance for translation and rotation, respectively. Fourth, for every point of the rigidly transformed reference surface, the closest point of the scanned surface was determined. Several points from the reference surface were often matched to the same point on the scanned surface, since the reference surface underwent finer sampling than the scanned meshes, i.e., 82 vs. 98 to 158 µm mean distance between points. This discretization error was removed by replacing the many-to-one distances with their smallest distance. Fifth, the error distributions were summarized by the mean and standard deviation of all points of the reference mesh regions and of 100 randomly sampled points of the reference mesh regions. Two regions were evaluated, namely either the three hollow cylinders or the surface of the crown-like features. The statistical significance of differences in the median values of the Euclidean distances was tested using the Mann–Whitney U-test. The statistical significance of differences in the mean values of the log-Euclidean distances was tested using the two-sample t-test.
Finally, we decided to apply the intraoral scanner Primescan (Dentsply Sirona, Charlotte, NC, USA) for the case study (see below). The planning of the orthodontic therapy, NaturalignerTM fabrication, and the determined translation and rotation of crowns were based on the scans recorded by the experienced dentist (I.F.). The weekly acquired scans are labeled according to the time points of active treatment, i.e., Week 0, for the start of the therapy, to Week 9, for the time point after 9 weeks of treatment.

2.2. Fabrication of Optically Transparent Aligners with Cellulose Coating

The company Bottmedical AG, Basel, Switzerland, provided sets of aligner pairs fabricated from 550 µm thin cellulose-coated polyethylene terephthalate glycol-modified films [15]. These films were thermoformed, because this approach leads to a reasonable fit [20] with an average thickness of 334 µm [15]. A heating temperature of 220 °C of a standard thermoforming unit, Biostar® (SCHEU-DENTAL GmbH, Iserlohn, Germany), resulted in a film surface temperature of 190 °C. A pressure of 4.8 bar was applied to the films as they were pressed towards a 3D-printed model, prepared according to the therapy planning. After separation from the model, the aligner was trimmed to guarantee a suitable interface with the gingiva. The optically transparent aligners are sold under the trade name NaturalignerTM.

2.3. Case Study with Two Patients

The two female patients had a dental Class II and moderate to severe crowding for both jaws according to the Discrepancy Index of the American Board of Orthodontics (ABO) (see below). Informed consent forms were signed by the patients.
The patients’ teeth were prepared according to the following standard procedure: first, the teeth were cleaned with a fluoride-free paste with Pumice powder; second, the phosphoric acidic gel Ultra-EtchTM (Ultradent Products Inc., Köln, Germany) was applied for a period of 30 s, followed by water rinsing and drying with air. Third, 3MTM TransbondTM XT was brushed on the treated enamel surfaces, aired, and light-cured for a duration of 20 s. Subsequently, the aligner attachments were glued using 3M™ Transbond™ before the excess composite was gently removed, and the attachments were polished.
Right after each appointment for intraoral scanning, the patients were instructed on how to change the aligners of the upper and lower jaws. This means the first change of each new aligner was carried out under supervision. In addition, the patients obtained an identical pair of aligners to replace them midweek. This approach was chosen to ensure that potential deformations of the 550 µm thin aligners during one week could be avoided and a moderate and constant force was maintained for inducing the desired tooth movements during the therapy.
The patients were advised to wear the aligners for a duration of at least 22 h per day. For eating and teeth brushing, the aligners should be carefully removed. Patients were allowed to drink with the aligners in place, considering the potential pigmentation of the devices. They were instructed to gently clean the aligners twice per day with a soft tooth brush.
While the case study with two patients has insufficient statistical power for providing conclusive clinical results, it did show that the proposed method is suitable for being applied to a reasonably large cohort.

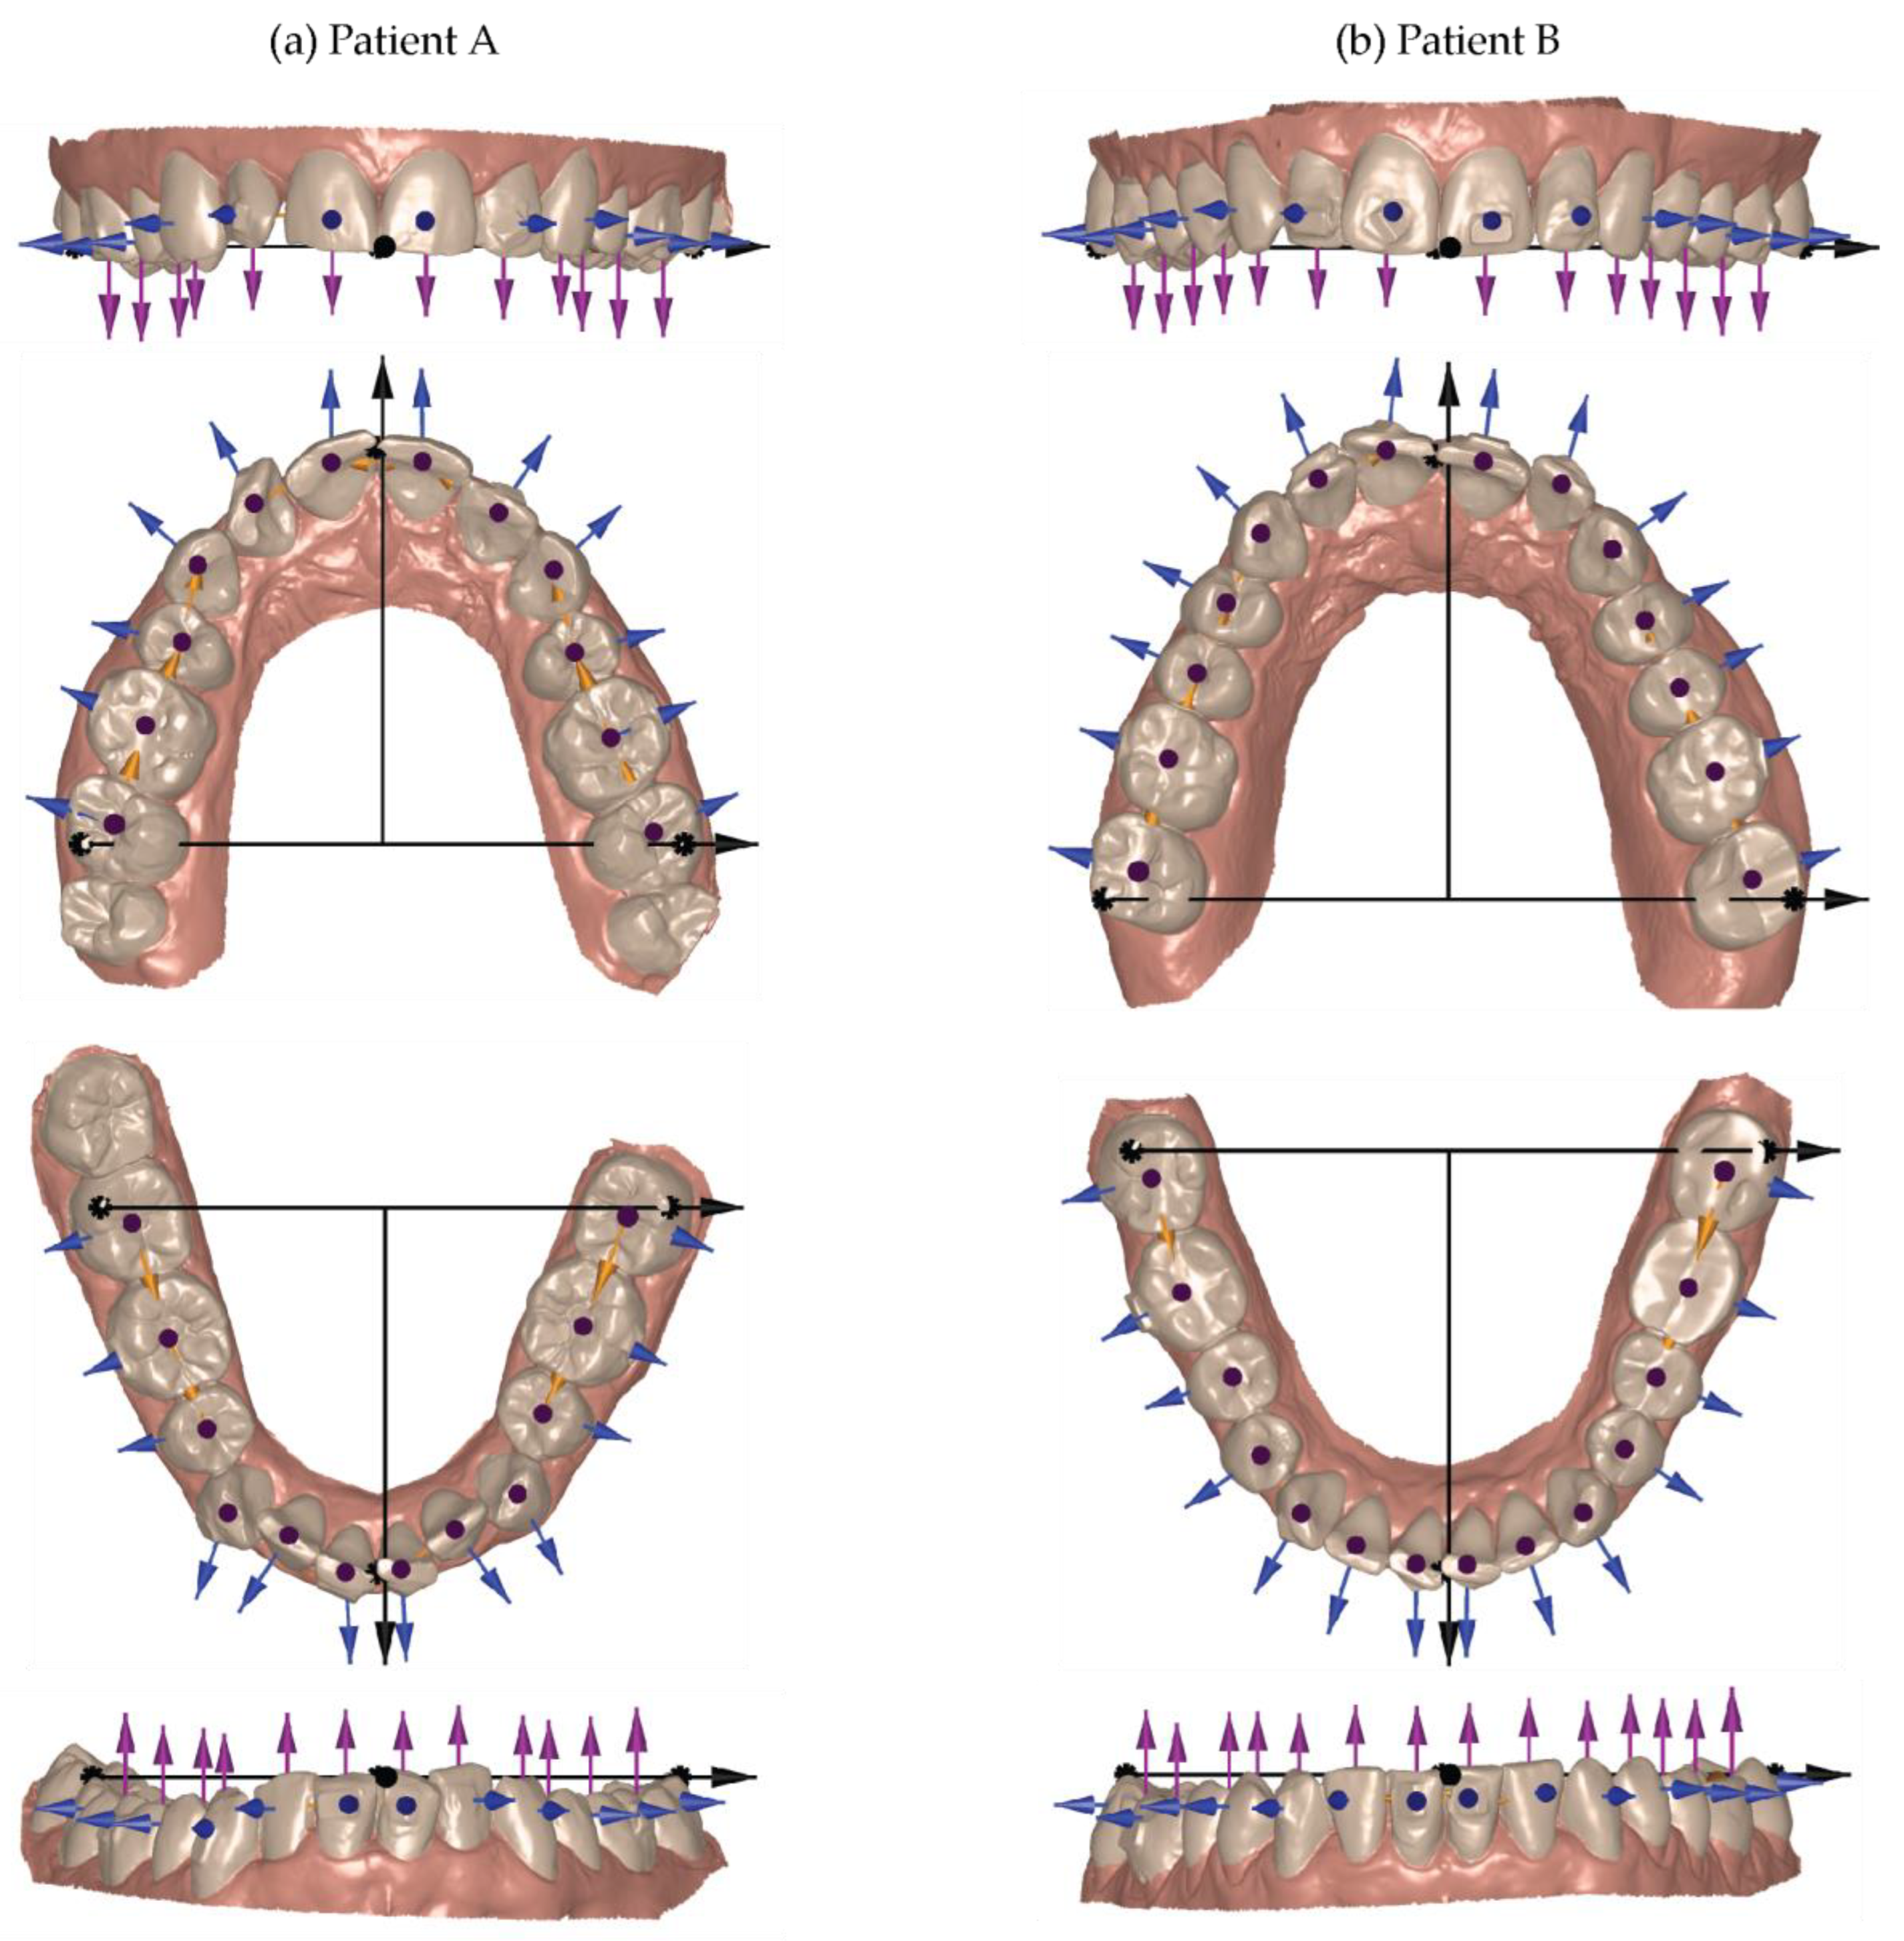
2.4. Selection of Global and Local Coordinate Systems

Figure 2 shows the intraoral scan data at Week 9 of Patient A and Patient B. Three anatomical landmarks at the two distobuccal cusps on the second molars for the upper and lower jaws, as well as labels between the crowns of the central incisors, were manually selected to determine the global coordinate system (see black dots and black arrows) [21]. These landmarks define the global left and global extrusion directions, where the latter is indicated by the magenta-colored arrows on the individual crowns. The global anterior direction was selected orthogonal to these two axes.
Figure 2 also shows the coordinate systems for each crown using colored arrows. The extrusion direction, given by the magenta color, coincides with the global coordinate system. The mesial direction of each tooth is given by the vector to the neighboring crown and displayed by the orange-colored arrows. The blue-colored arrows indicate the buccal direction of each crown and are orthogonal to the orange- and magenta-colored arrows.
It should be noted that for Patient A, one third molar, and for Patient B, the four third molars, are missing (see Figure 2). Therefore, the third molars were not included in the movement study. Patient A had undergone an orthodontic treatment previously. During this treatment, the four first premolars were extracted and, thus, Figure 2 shows only 24 crowns besides the third molars.

2.5. Data Evaluation

The individual crowns at Week 9 were semiautomatically segmented from the three-dimensional surface data of the intraoral scans for the upper and lower jaws by an experienced dentist (I.F.) using the commercially available software OnyxCeph3 TM (Image Instruments GmbH, Chemnitz, Germany). The necessary interactions of the operator took less than 25 min per jaw.
The jaw surfaces were trimmed with manually defined polygons using FreeCAD (version 0.19) to reduce the surface to the teeth and the adjacent gum to approximately the mucogingival junction. The segmented crowns were fused to a single surface mesh and rigidly registered to the trimmed jaw surfaces of the oral scans acquired at the selected timepoints using the MATLAB iterative closed points function called pcregistericp. Starting from this rigid registration result, the surfaces of the crowns were non-rigidly registered to the other trimmed jaw surfaces using the MATLAB function nricp based on the implementation from github.com/charlienash/nricp [22]. This non-rigid motion field defined the orthodontic tooth motion. Translation and rotation per crown in the three-dimensional domain were determined by fitting a rigid transformation to the non-rigid motion field of the crown, after setting the center of rotation to the crown’s center of mass. Note that this center of rotation serves to describe the rigid transformation of the crown in three-dimensional space, while the anatomical center of rotation of the tooth is unknown. The fitting was based on minimizing the root-mean-square distance via the Kabsch algorithm [23] using the MATLAB software from fileexchange 25746-kabsch-algorithm.
The teeth segmentations at Week 9 were propagated to the states at Weeks 0 to 8 based on the closest points after the non-rigid registration. Orthodontic tooth motion between Week 0 and all other states was determined by rigid and non-rigid registration as described above. Comparison to the treatment plan was similarly determined by rigid and non-rigid registration.

3. Results

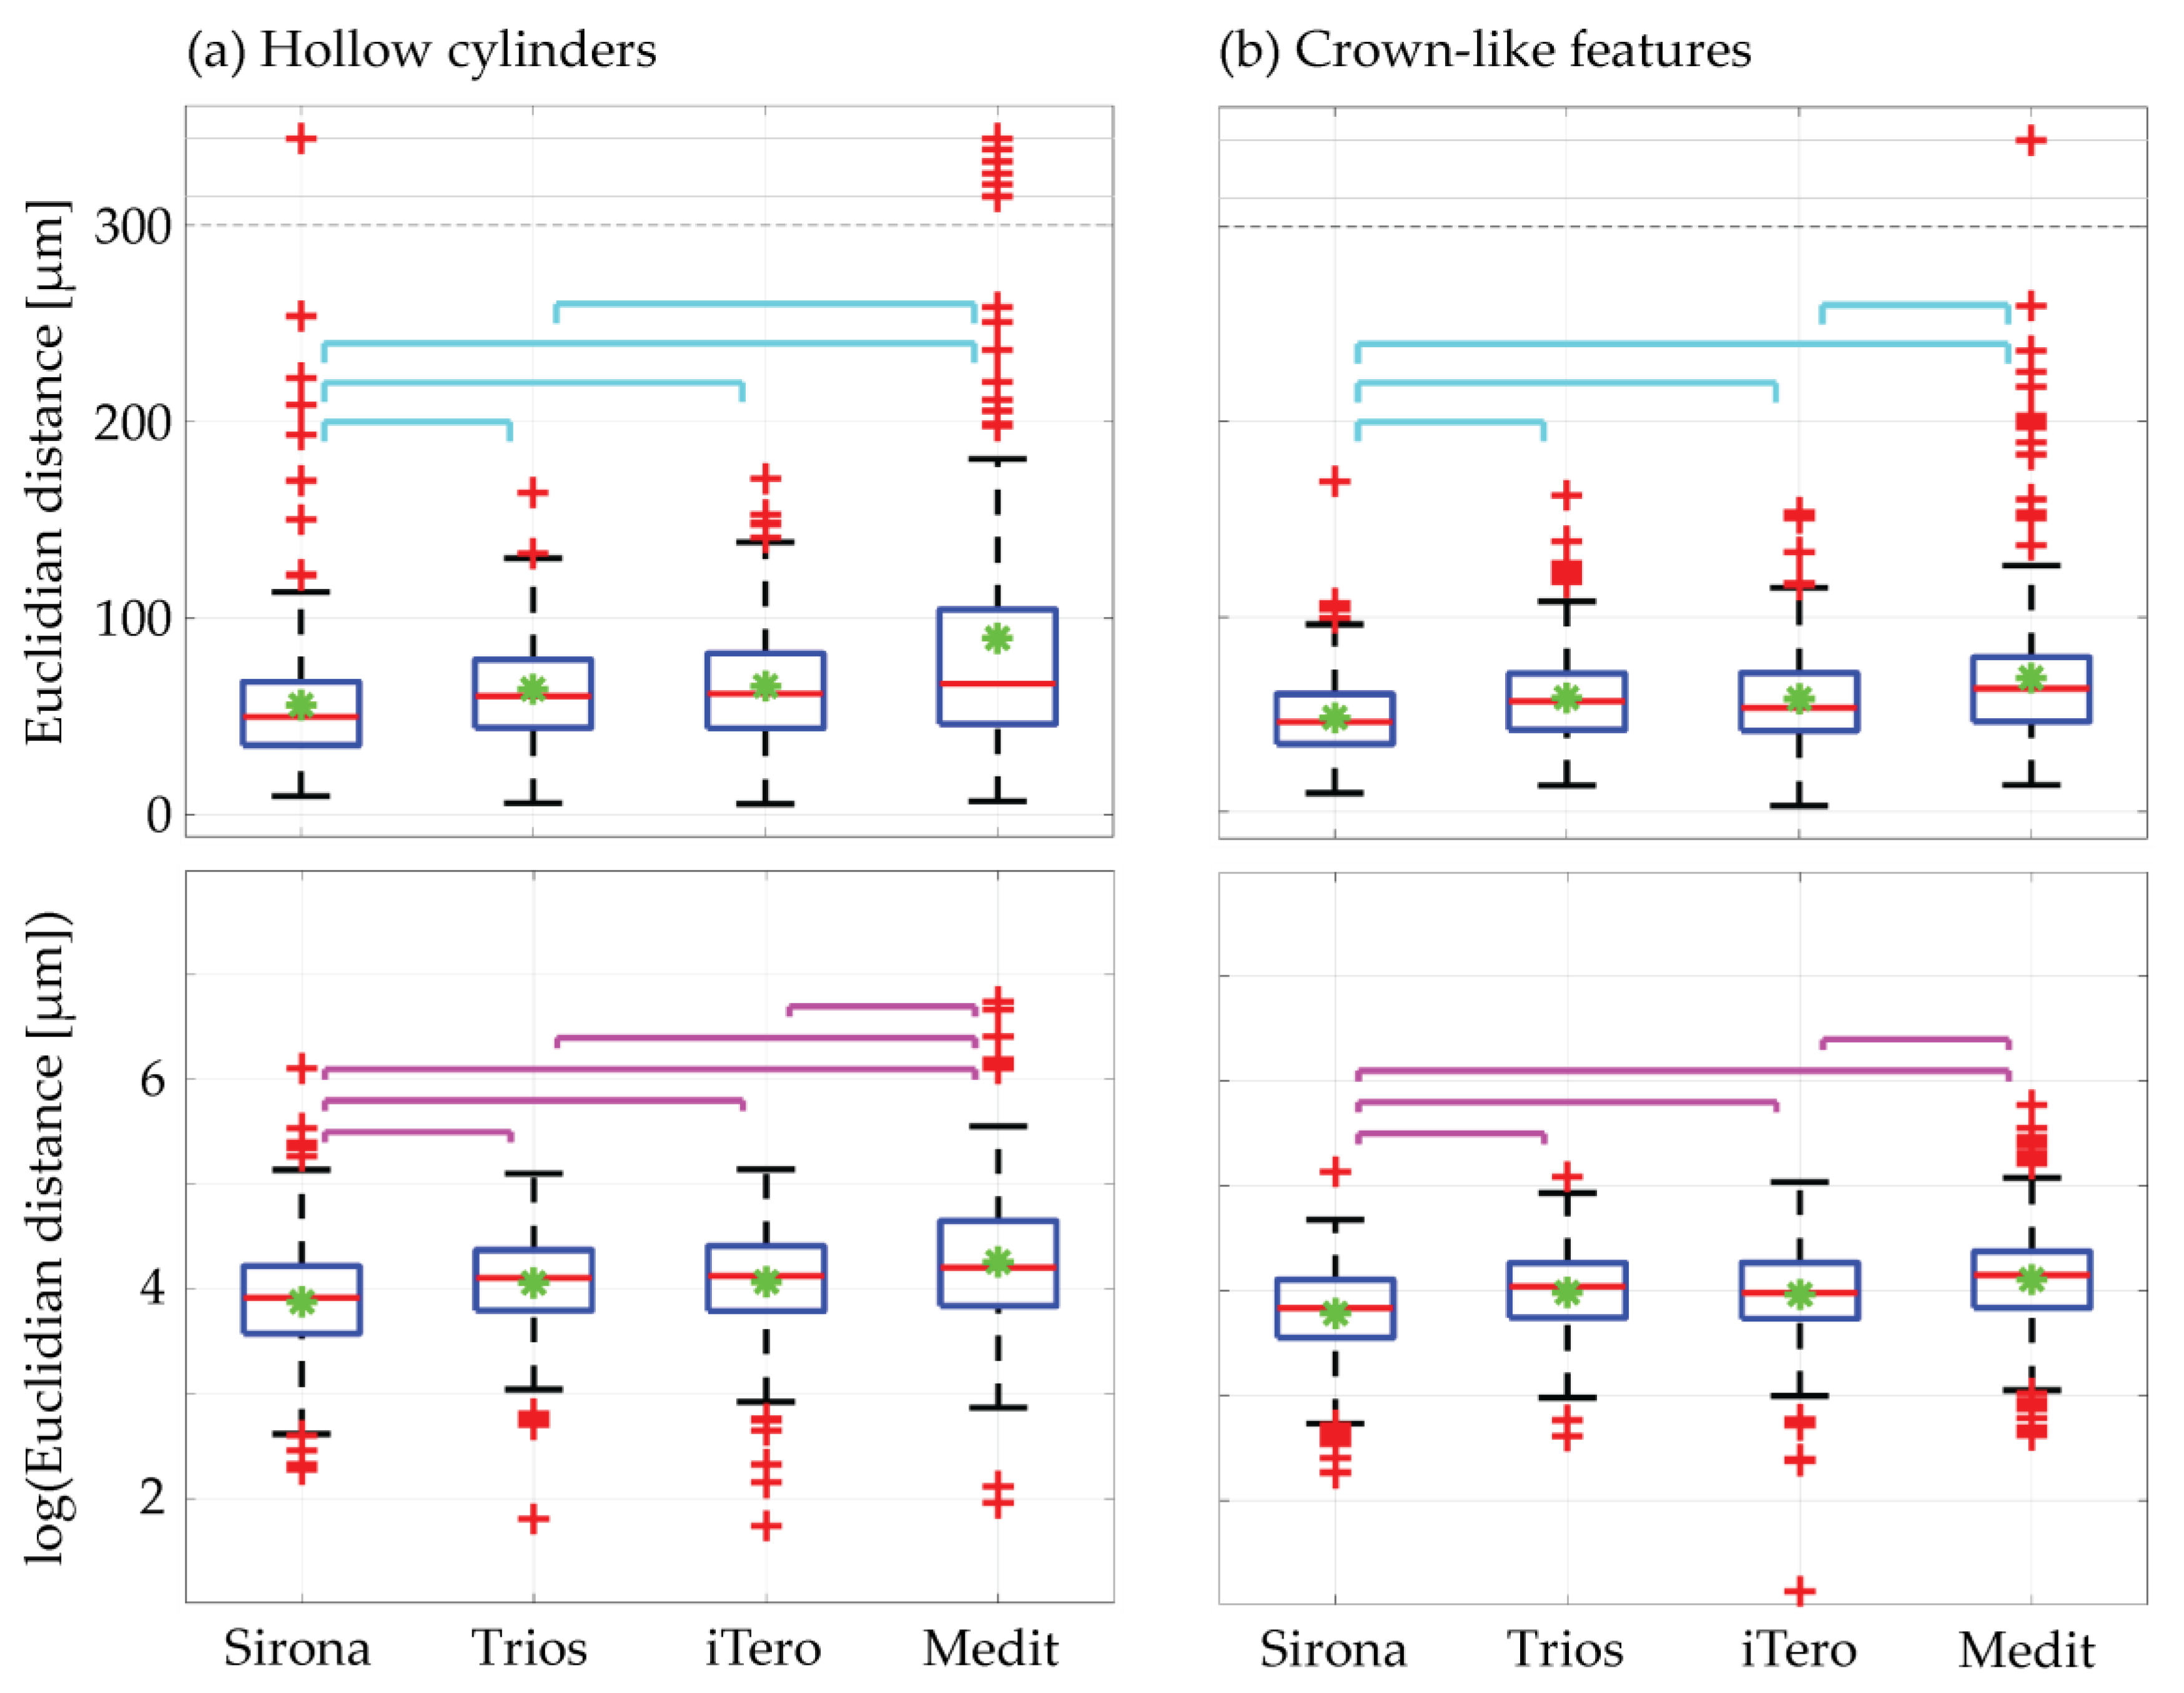
3.1. Intraoral Scanner Selection

Figure 1a displays the surface of the microtomography data from the PEEK model used as a reference. The segmented crown-like features in yellow and the segmented hollow cylinders in magenta were used to determine the accuracy of the four intraoral scanners available. In the first step, we checked whether the four scanners fully captured these features of the PEEK model. The images of the intraoral scanners in Figure 1 indicate that the crown-like features and the hollow cylinders were comprehensively represented. The scanned meshes had a mean distance between the points of 98, 146, 135, and 158 µm for the Sirona, Trios, iTero, and Medit devices, respectively. Thus, the data quality was reasonable. A more detailed quantitative analysis of the data is required to decide on the choice of intraoral scanner for the present case study and related future clinical studies.
Table 1 provides the mean values and the related standard deviation of the error statistics calculated for the analyzed features. For the cylinder centers and both feature regions, as well as for the entire dataset and the arbitrarily selected 100 points, the mean Euclidean distance increases from Sirona via Trios and iTero to Medit. The mean values of the Trios and iTero scanners are very similar.
The distributions from pooling 100 randomly selected points per scanner three times have a skewed shape, as the Euclidean distance measure is always positive (see boxplots in Figure 3, first row). Taking the logarithm of the Euclidean distances (cf. boxplots in the second row of Figure 3), the distributions are almost symmetric. For both regions, i.e., the hollow cylinders and the crown-like features, the median and mean results from the Sirona scanner are significantly more accurate at the 0.001 level than the median and mean values of the other three intraoral scanners.
The results for the hollow cylinders can be directly compared to the previously reported data [17]. In this study, the median Euclidean distances for the cylinders were smaller than previously reported, namely 61 vs. 79 µm for Trios and 67 vs. 98 µm for Medit. As before, the median results were more accurate for the Trios scanner than for the Medit scanner.
The intraoral scans of Sirona were statistically significantly more accurate than the scans from the Trios, the iTero, and the Medit scanners. Consequently, the Sirona scanner was the best choice for the present case study with two patients.

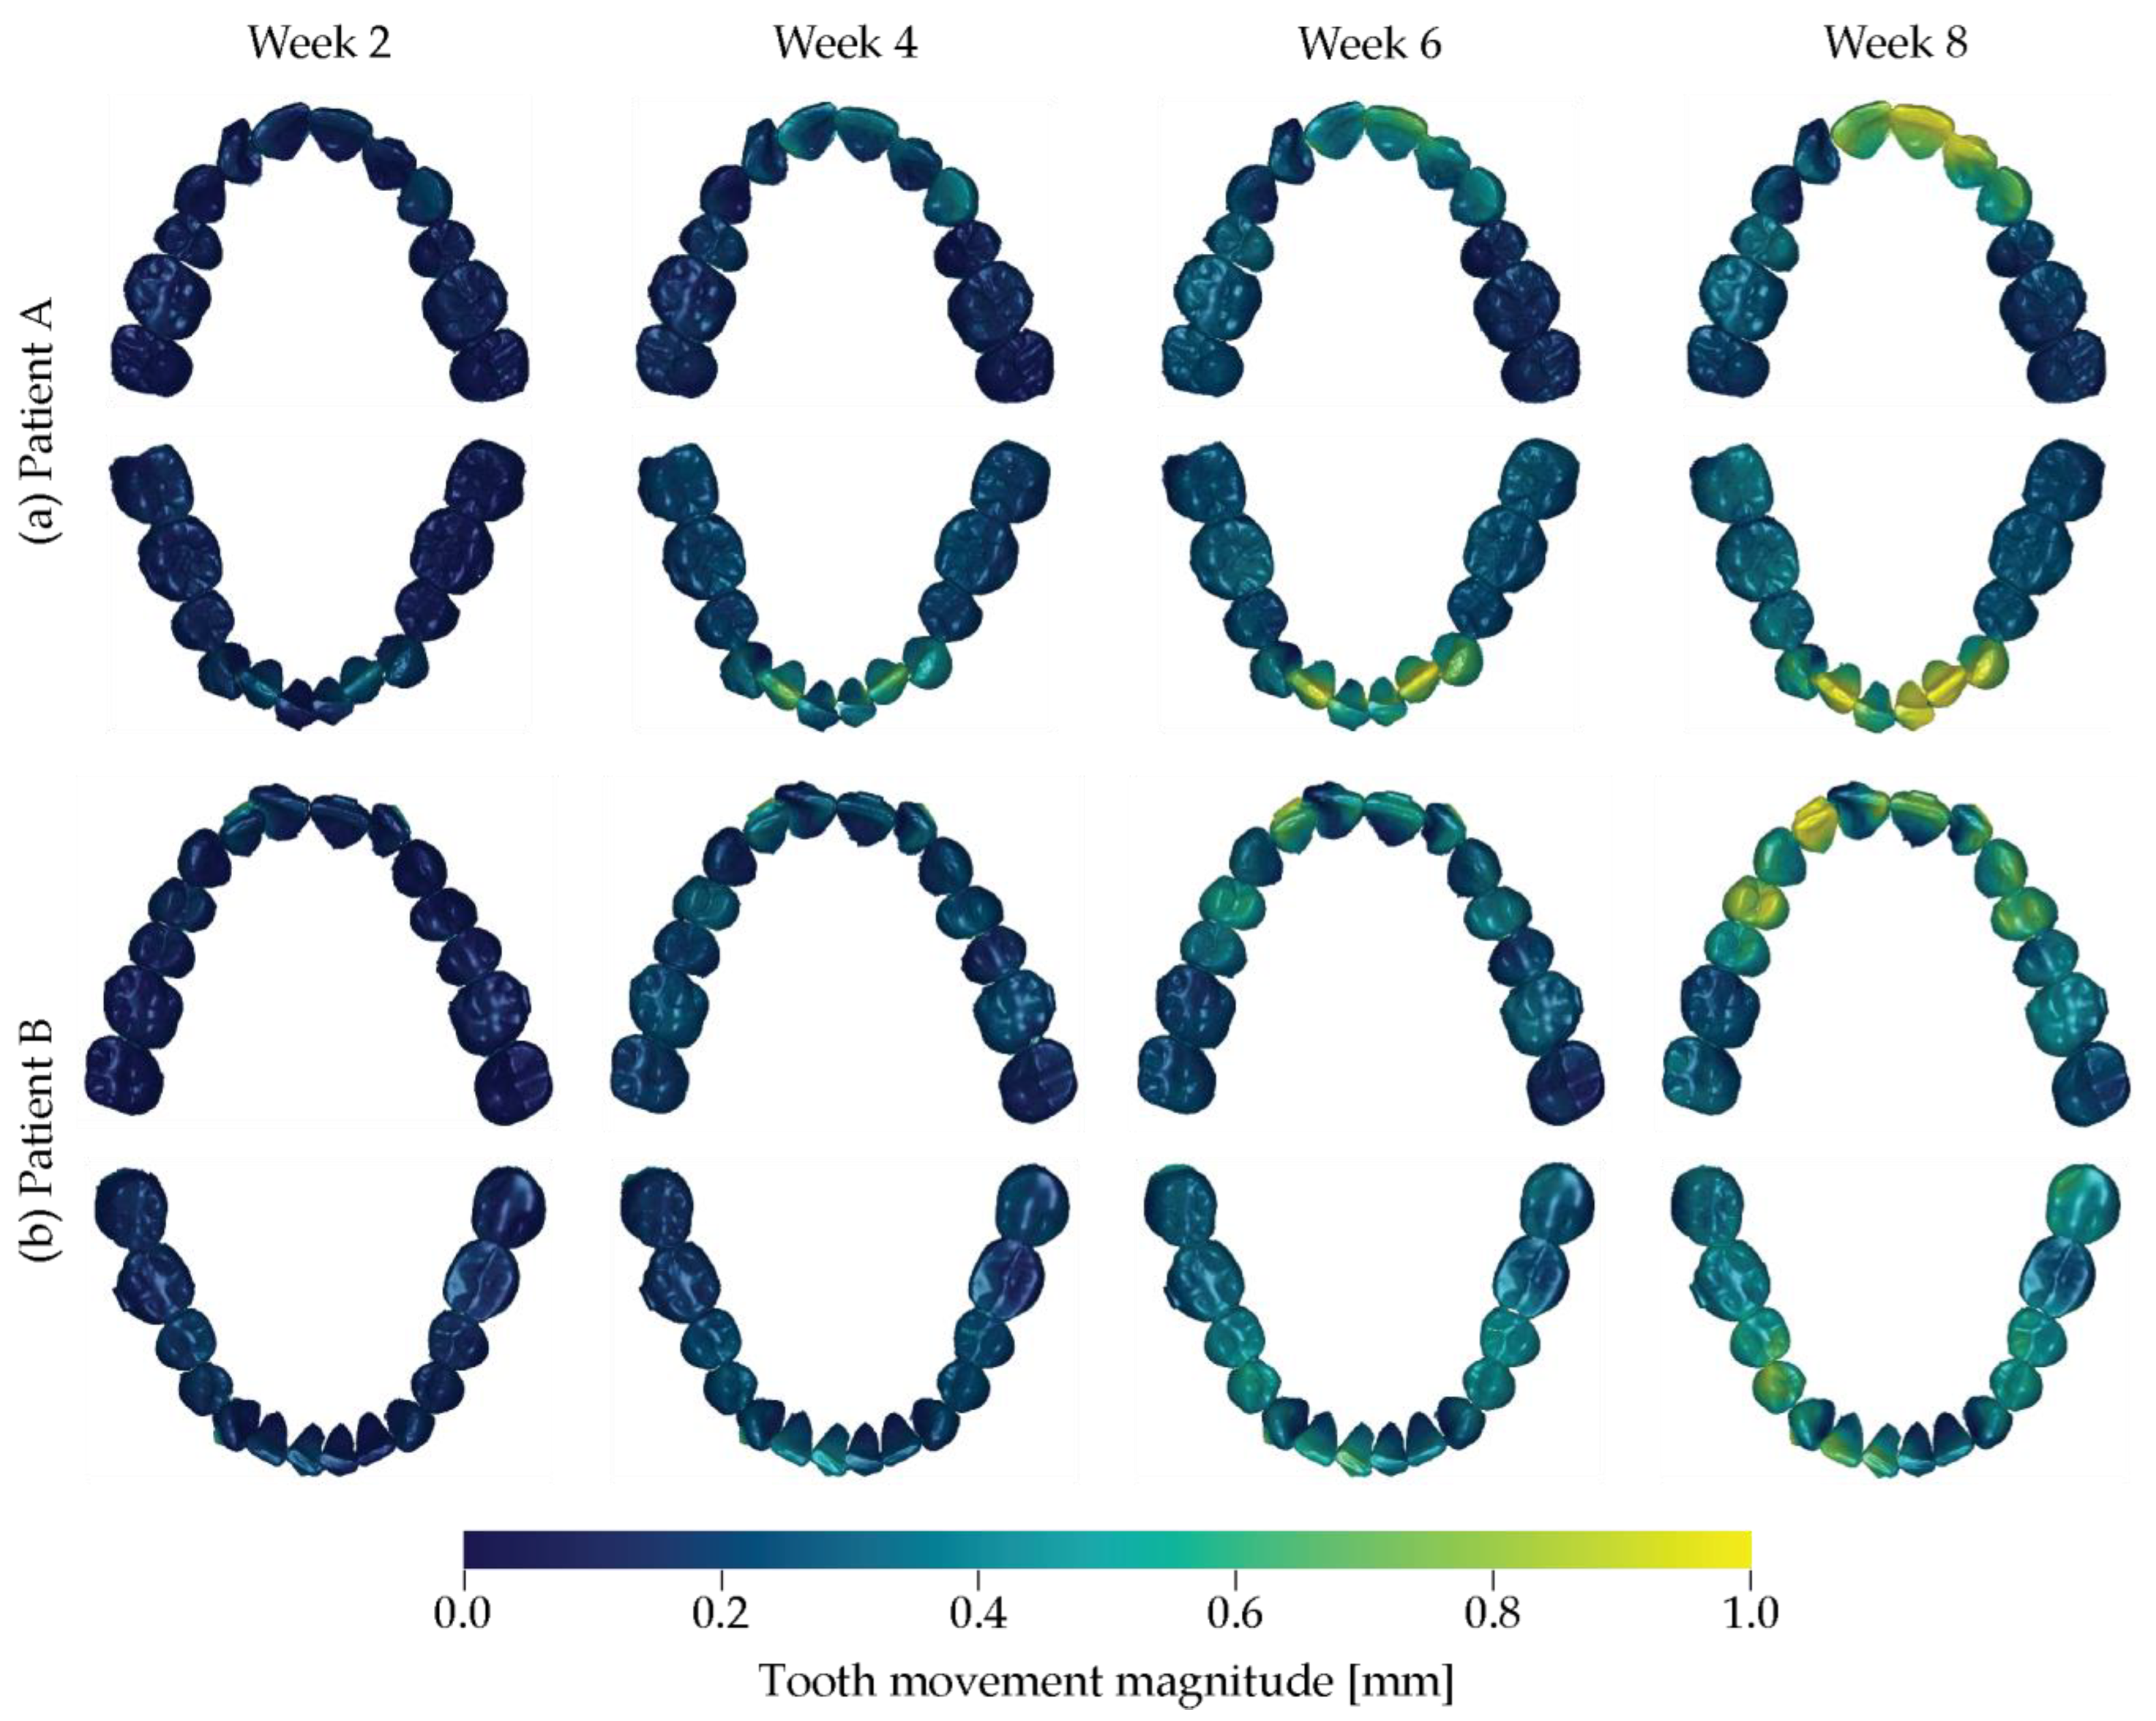
3.2. Tooth Movement Induced by a Series of Optically Transparent Aligners

Figure 4 displays the arrangement of the crowns for the upper and lower jaws of the two patients at the start of therapy (Week 0). These arrangements of crowns are given in quadruplicate to visualize the progress of therapy by color, from blue through green to yellow, for the treatment durations of two, four, six, and eight weeks. A dark blue color represents a static situation: no tooth displacement with respect to the start of therapy. A gradual color change to yellow (see color bar of Figure 4) corresponds to a tooth movement magnitude of up to 1 mm. For Patient A, the gradual tooth movement during the selected therapy period is obvious. As expected, the tooth movement of canines and incisors is much larger than that of molars for both the maxilla and mandible. Nevertheless, slight movement of the first molar is observed. For Patient B, tooth movement is also distinctly visible in the anterior region. The movement of the molars is delayed throughout the treatment time and only becomes evident after a therapy duration of eight weeks.

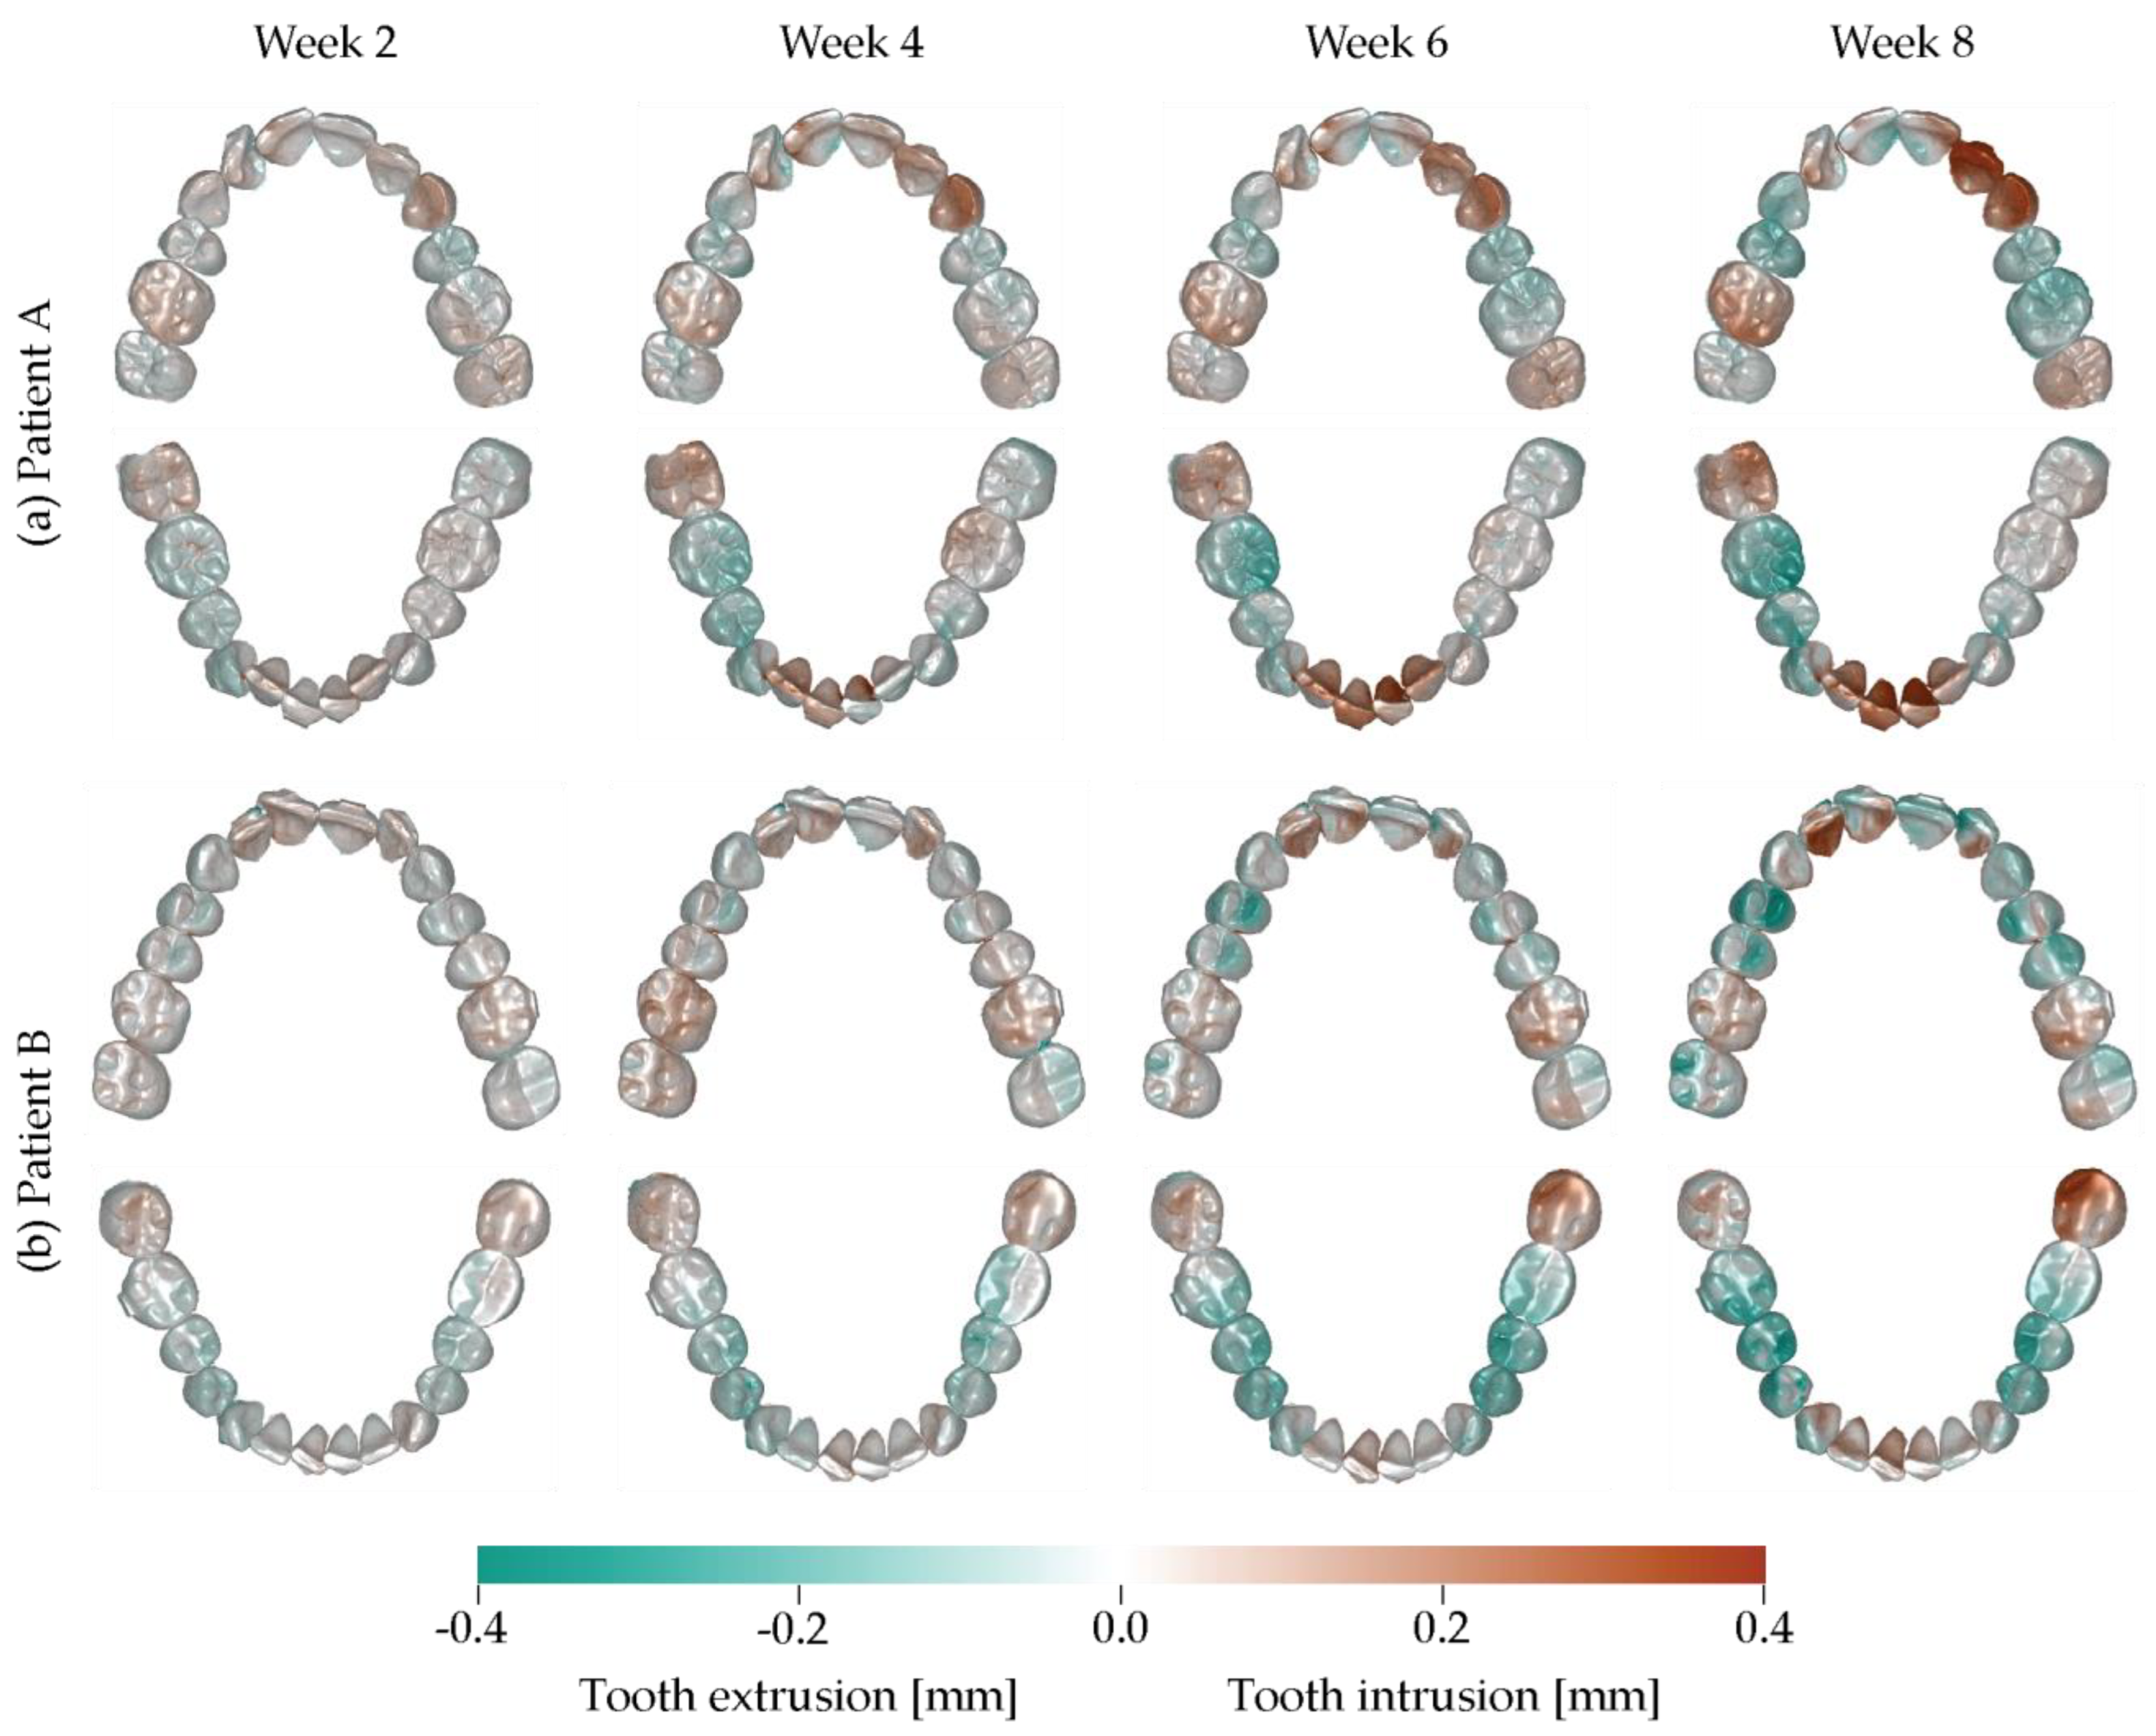
3.3. Intrusion–Extrusion Crown Displacements

The intrusion and extrusion of the individual crowns is visualized for the two patient treatments in Figure 5. The intrusion–extrusion crown displacements consistently increase with the therapy time for the selected period.
The anterior regions of Patient A show intrusion of up to 0.4 mm. The first upper right molar and the second lower right molar also show intrusion. The extrusion of the first lower right molar is consistent with the intrusion of its antagonist. The first upper left premolar and first molar on this side show an intrusion of about 0.2 mm.
Patient B shows more symmetric behavior than Patient A. Tooth displacement in the intrusion and extrusion directions was achieved. The extrusion of the lower second molar was successful and improved the frontal deep bite. Especially strong intrusion could be observed in the lower second left molar, which is consistent with the small extrusion of its antagonist in the upper left region for leveling the arch.

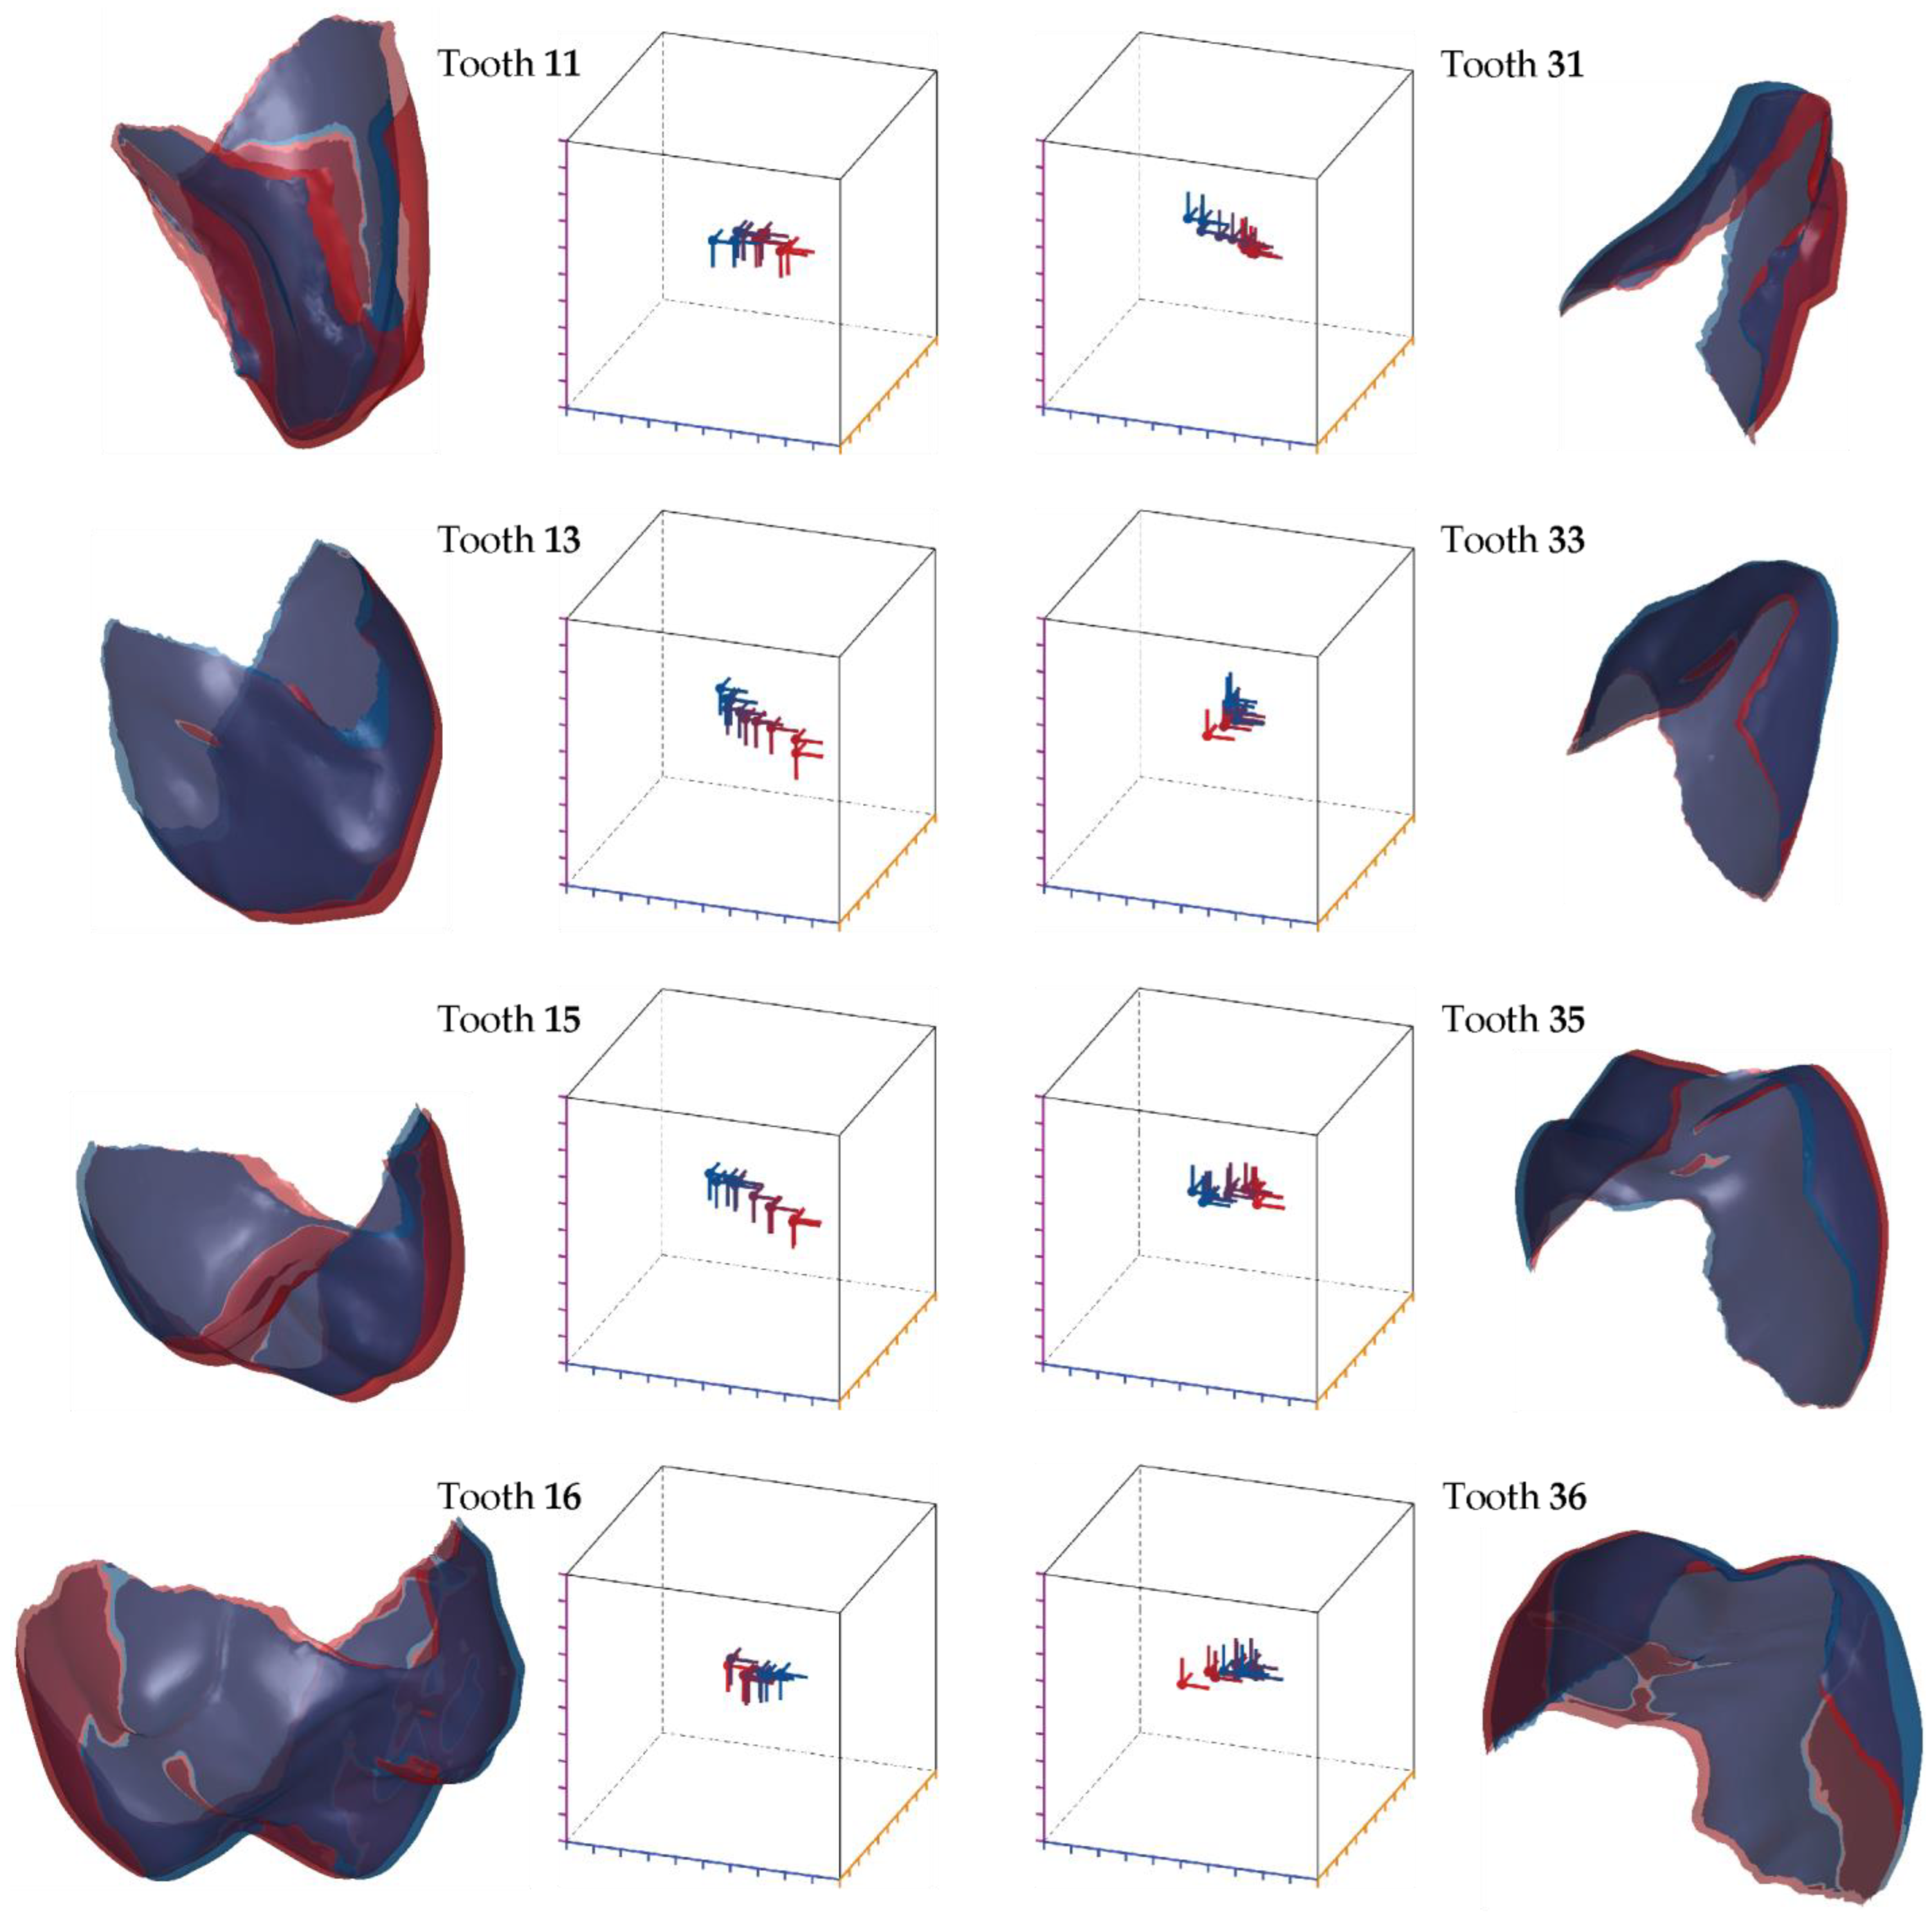
3.4. Displacement of Individual Teeth

The individual crowns were regarded as solids that do not change their shape during the therapy time of nine weeks. Therefore, three translational and three rotational parameters per crown are sufficient to quantitatively describe their movement, as evident in Figure 6 and Figure 7 for Patient A and Patient B, respectively.
The surface representations in Figure 6 and Figure 7 show the displacement of the crown to be considered from the therapy start in dark blue to the situation after nine-week aligner treatment in dark red. The translation and rotation in time steps of one week, using colors from blue to red, are visualized in three-dimensional space by cubes with a volume of (1 mm)3.
In general, major changes were observed for the incisors and canines, whereas the posterior regions are hardly affected. The incisors of Patient A showed relatively large translational and rotational changes. The premolars and molars exhibited much smaller changes, especially in the posterior region, where the molars only underwent minor rotations and minimal intrusions. Patient B presented a similar picture. Some intrusion of the canines in both jaws could be detected. In comparison with Patient A, we could identify larger rotational changes in the premolars than in the molars, more prominent in the mandible.

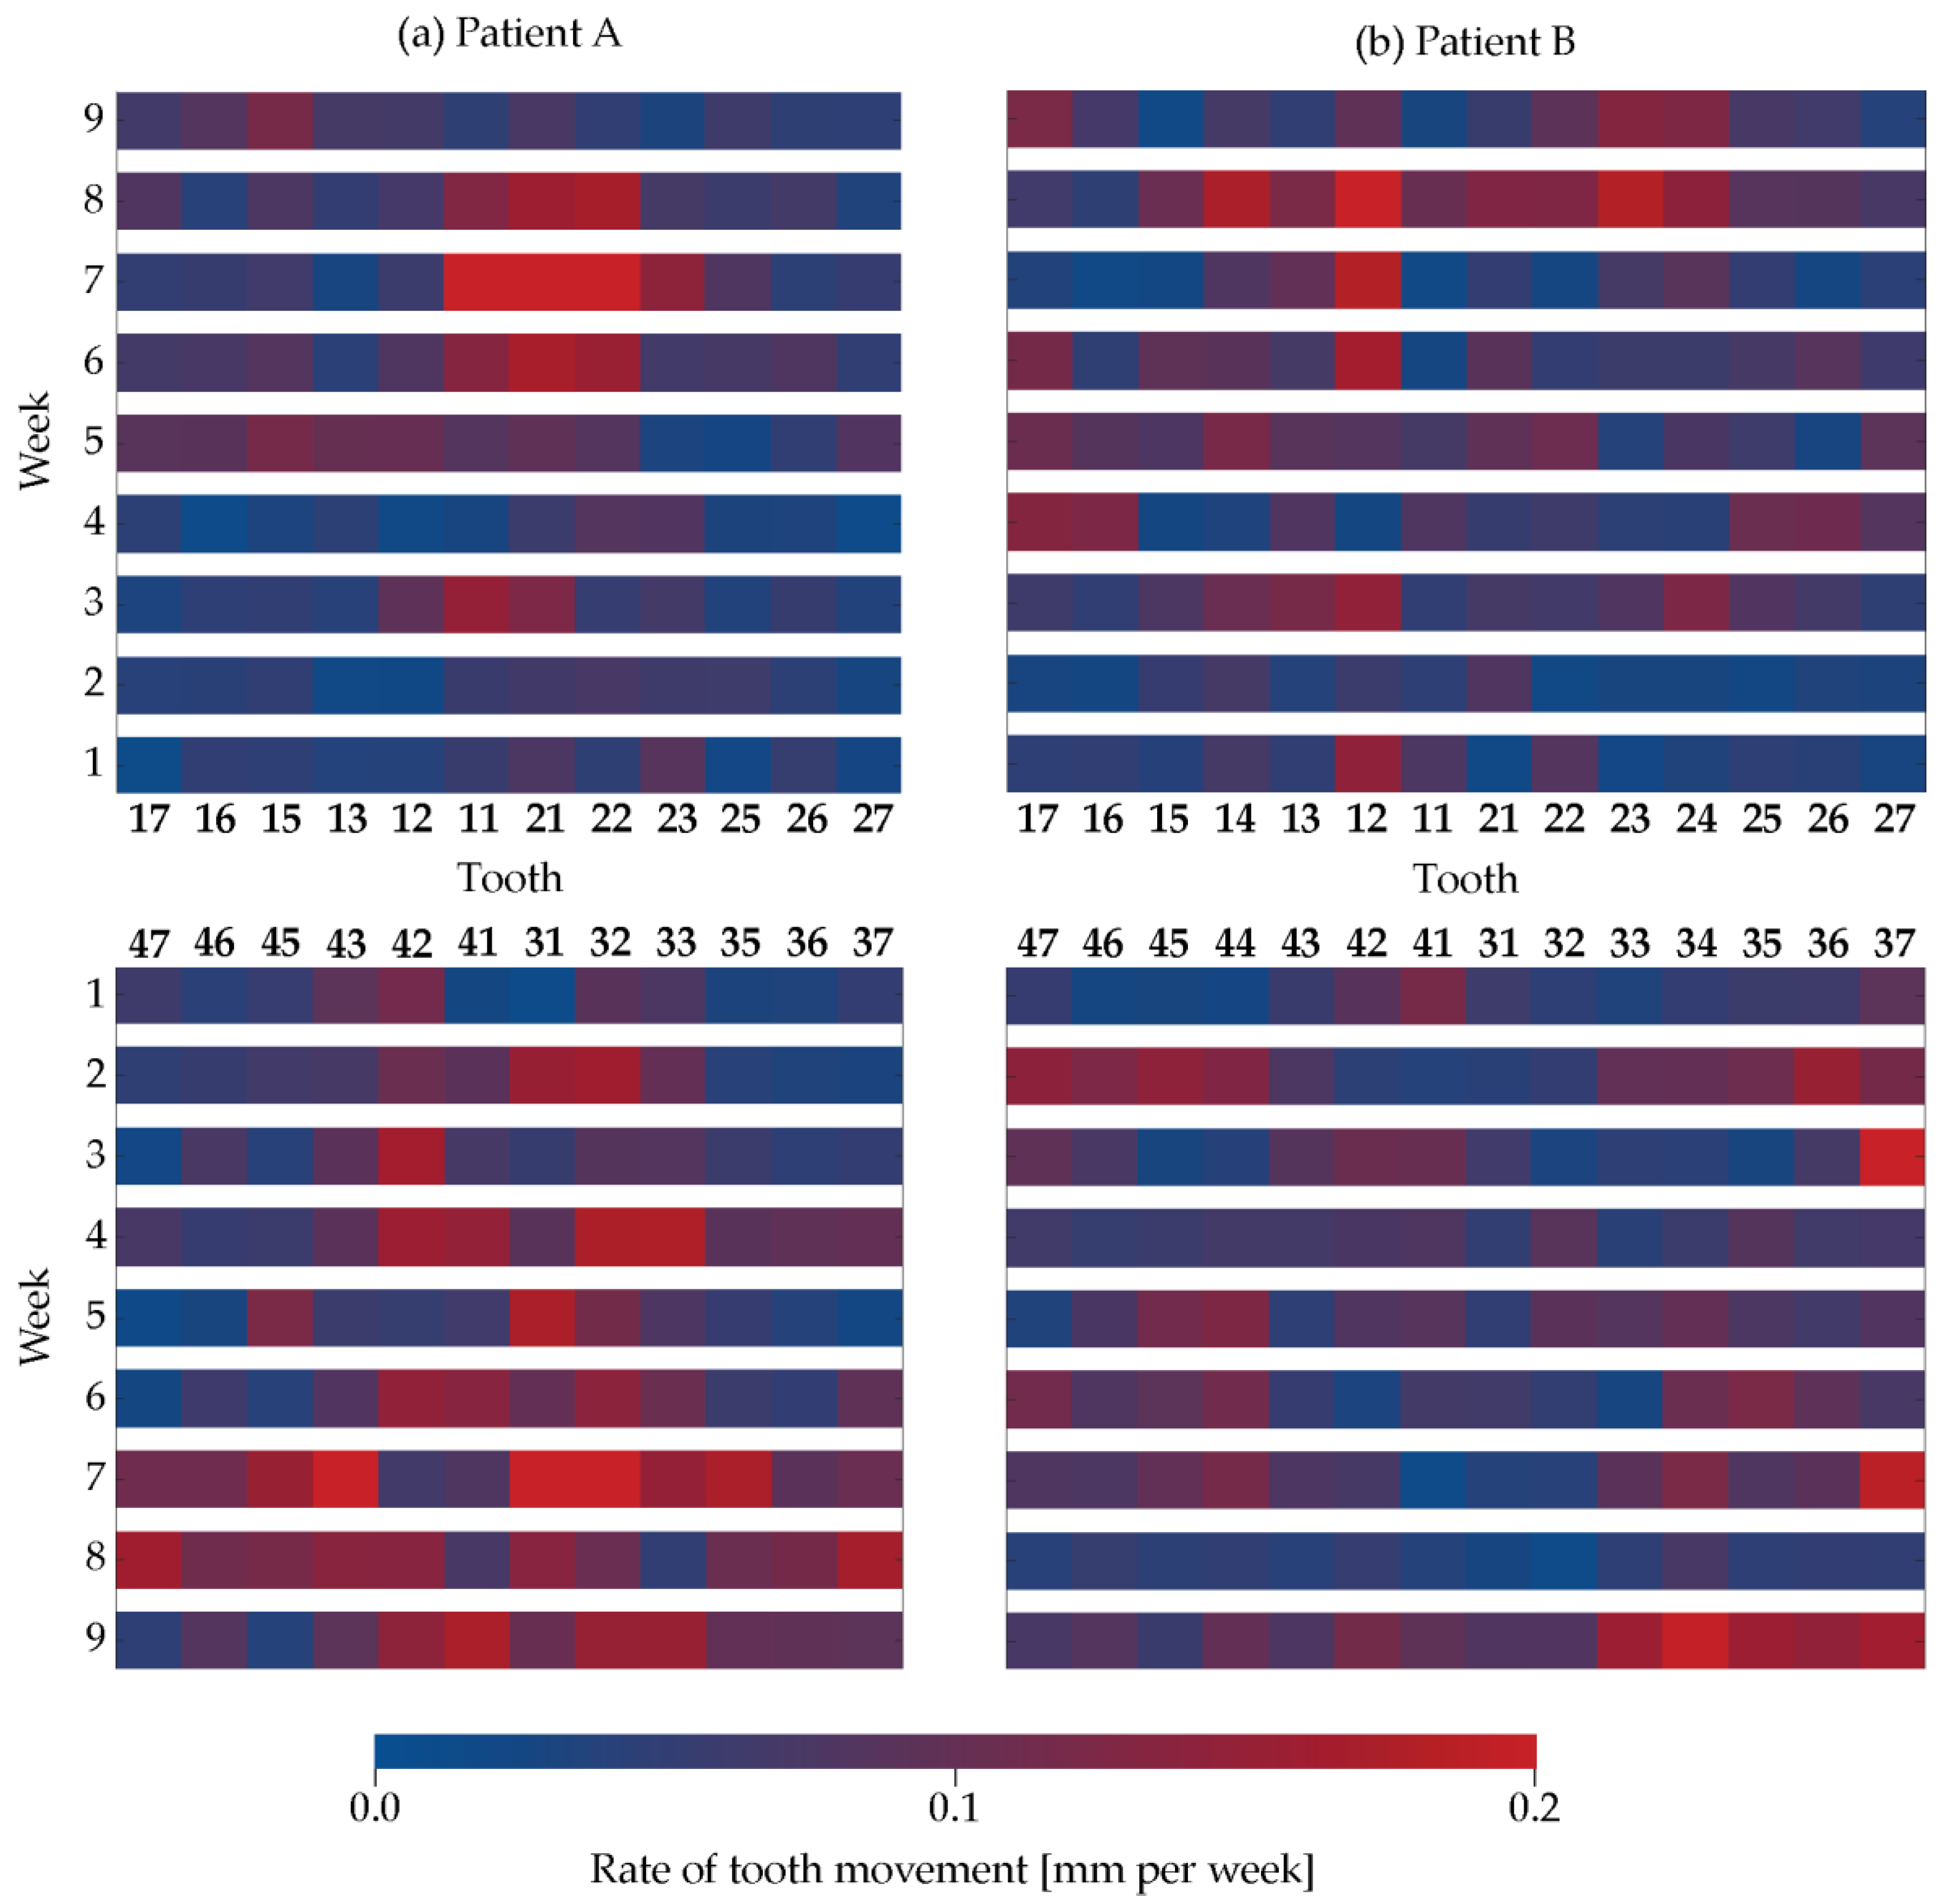
3.5. Rate of Tooth Movement

The results presented in Figure 8 focused on one of the objectives for this study, i.e., the quantification of tooth movement with time. Figure 8 depicts the rate of motion per week for each individual crown in the context of its neighborhood. It was observed that the neighboring teeth often moved together and that the motion rate generally increased at a later stage of therapy, for example, for Patient A after a duration of five weeks.
For Patient A, we observed that in the maxilla, the incisors and left canine, i.e., Tooth 11, Tooth 21, and Tooth 22, firmly moved between Week 6 and Week 8. The rate of movement for the other teeth was rather constant. In the mandible, the incisors, but also the canines and premolars, showed an increased rate of movement, but more intermittent and not constant throughout the selected therapy steps.
For Patient B, the lateral incisor of the maxilla, Tooth 12, showed a similarly higher rate of movement than in Patient A. Although less pronounced, this was also found for the other incisors, canines, and premolars (see Week 8). In the right posterior of the mandible (see Tooth 37, Tooth 36, Tooth 35, Tooth 34, and Tooth 33), we detected a high rate of movement during the final stage of therapy, i.e., within Week 9.

3.6. Tooth Displacement Difference to the Therapy Plan

Figure 9 shows the difference between the therapy plan and the achieved aligner treatment after two, four, six, and eight weeks. We found differences of up to 1 mm, represented by the red color. The planned buccal rotation for Tooth 17 and Tooth 27 was not achieved within the eight-week aligner treatment for both patients. In contrast, the incisors changed their position in close agreement with the therapy plan.
For Patient A, the clinical outcome followed the therapy plan during the first five weeks. Subsequently, we found discrepancies, which were prominent in the fourth quadrant. We also identified larger disagreement for the first than for the second quadrant.
For Patient B, the main difference was between the planning and achieved treatment related to the molar of the maxilla with a lack of tip, i.e., rotation around the mesial–distal axis. In addition, one can recognize a substantial discrepancy for the premolars in the first quadrant of the maxilla at Weeks 4 and 6. At Week 8, however, it becomes closer to the virtual plan. In the mandible, the differences were less prominent, with values below 0.6 mm.

4. Discussion

Optically transparent aligners have been applied for more than two decades. Their application, however, has been only partially successful, as stated by many recent reviews (see, e.g., [24,25,26]). Even very recent original work demonstrates the limitation of polymeric aligner treatments (see, e.g., [27]). Therefore, orthodontists are sometimes doubtful about the predictability of tooth movements caused by aligner therapy. Aligner treatments in moderate to severe cases take more time than conventional brace therapies, since the tooth movement rate, related to the applied forces, is lower for aligners, which are usually made from polymers such as polyurethane and ethylene vinyl acetate. The force generation, however, can be adapted by changing the aligner thickness (see, e.g., [28]). For effective bodily tooth movement, rather thick and single-layered rigid polymers are preferred [28]. Multi-layered aligners generally exert lower forces compared to their single-layered counterparts [28]. Therefore, we can reasonably expect comparably low force transmission from the 550 µm thin cellulose-coated polyethylene terephthalate glycol-modified films of the NaturalignerTM. That is why in the present study, we accelerated the treatment plan and applied two aligners per week to compensate for aging, as described in ref. [29].
To validate the treatment success of aligner therapy, intraoral scans at the start and the end state were collected and compared. Refinement scans, as performed in the present case study, are often included in such studies [30]. The present study is based on weekly scans during the first nine weeks to precisely determine the orientation and location changes in the individual crowns. It should be emphasized that the intraoral scans only capture the crowns. Orthodontists are likely to change their aligner treatment plan when given three-dimensional information on the position of a patient’s crowns, root, and bone coverage [31]. Within the current case study, we intentionally abstained from X-ray imaging of the upper and lower jaws, since the radiation dose for three-dimensional X-ray images would be inappropriate. This lack of information is a limitation of this study. A very recent study shows the benefits of using cone-beam computed tomography in comparing clear aligners to conventional brace treatments [32].
Although automatic tools for segmenting individual crowns from intraoral scans have reached a certain maturity, manual adjustments are needed for clinical use [33]. For the current study, we thus selected the software OnyxCeph3 TM. Even though this software contains a module for automatic crown segmentation, we used the module for trimming the cast bases to ensure the necessary quality of segmenting the individual crowns at Week 9. In this fashion, each crown was separated from the arch. For this purpose, the points that define the crown boundaries were manually set. Depending on the crown size and shape, the number of points selected ranged from 10 to 15. The time needed to select these points decreased with experience. Thanks to the quality of the segmentation at Week 9 and the automatic non-rigid registration, the crowns of the earlier time points were segmented promptly.
Adult patients show interest in fast aligner treatments [34]. Fialho et al. [35] compared the aligner treatments of mature adults with the seven- and fourteen-day exchange rates, which show the limitations of accelerated protocols. Nevertheless, we decided to use a weekly exchange. Furthermore, we provided two identical aligners per week and advised the patients to change them after 3.5 days to compensate for NaturalignerTM wear.
Posterior intrusion, mesiodistal translation, and torque movement are possible contraindications for the use of aligners (see, e.g., ref. [36] and references therein). We could not confirm some of these findings within this case study. This discrepancy may be due to the limited accuracy of previous approaches. For Patient A, we detected the largest intrusion movements in the anterior region of the incisors of the lower jaw, which fits the planned correction of the frontal deep bite. The chronological sequence of individual crown displacement and rotation was consistent with the leveling of the arches and the Curve of Spee for both jaws. The real situation certainly lagged behind the planning. The direction and magnitude of the movement of opposite teeth was consistent with the desired intrusion or extrusion. Crown rotations, especially extrusions of the molars, were only partially achieved.
This communication concentrates on the first nine weeks of treatment, although it continued for another 21 and 10 weeks for Patients A and B, respectively. This continuation was necessary to reach full satisfaction by the patients and the attending dentist. It should be noted that during the aligner treatment, the upper incisors of Patient B are mainly displaced (see video in Supplementary Materials), whereas the subsequent treatment induces tilting (see video in Supplementary Materials).

5. Conclusions

Treatments using optically transparent aligners are currently popular to displace and rotate the teeth in a desired fashion, as the often-cited paper of Robertson et al. clearly indicates [37]. We were able to demonstrate, for two cases, that the NaturalignerTM enabled fast and desired orthodontic therapy. The proposed analysis, comprising intraoral scans, manual crown segmentation at a selected stage, and automatic non-rigid registration of the entire sequence, enables the quantification of the displacement and rotation of the individual teeth over the treatment time. It should become the basis for the analysis of a statistically relevant cohort, with the goal of further improving aligner-based orthodontic therapies. Especially important is that the proposed methodology will allow for the precise quantification of the difference between the actual arrangement of the crowns and the force- and torque-generating shape of the optically transparent aligner used. Nonetheless, the present study has two clear limitations. First, three-dimensional X-ray images were regarded as inappropriate, so this study only relies on the optical images of the crowns. Second, the informative value is restricted to only two cases and has to be extended to provide a strong conclusion about the efficiency and efficacy of the NaturalignerTM.

Supplementary Materials

The following supporting information can be downloaded at: https://www.mdpi.com/article/10.3390/oral4040039/s1, Video V1: Surface rendering showing crown positions at weekly intervals for study duration of nine weeks and, subsequently, after treatment termination for Patient A (left) and Patient B (right).

Author Contributions

Conceptualization, J.A.v.J., T.T. and B.M.; methodology, C.T. and B.M.; software, C.T.; validation, C.T.; investigation, I.F. and G.S.; resources, I.F., J.A.v.J., G.S., T.T. and B.M.; data curation, I.F. and C.T.; writing—original draft preparation, I.F., C.T. and B.M.; writing—review and editing, I.F., C.T., J.A.v.J., G.S., T.T. and B.M.; visualization, C.T. and B.M.; supervision, B.M.; project administration, B.M.; funding acquisition, T.T. and B.M. All authors have read and agreed to the published version of the manuscript.

Funding

This research received no external funding.

Institutional Review Board Statement

According to the Swiss guidelines, the Ethic Committee approval can be waived as the submitted manuscript covers data of two single patients (case study).

Informed Consent Statement

Written informed consent was obtained from the two patients involved in this case study.

Data Availability Statement

The data from the intraoral scans are available at the Zenodo repository DOI 11280343/zenodo.11280343, and the software scripts can be accessed via the Github repository toothMovementAnalysis.

Acknowledgments

We thank Bottmedical AG, Basel, Switzerland, for providing the study materials (NaturalignerTM). The authors thank Zahnärzte am Kreis AG, 8754 Netstal, Switzerland, for the support with the OnyxCeph3 TM software and acknowledge the valuable technical discussions with Bekim Osmani, Basel, Switzerland. Griffin Rodgers kindly improved the readability of the manuscript.

Conflicts of Interest

J.A.v.J., T.T. and B.M. are founding members of Bottmedical AG, Basel, Switzerland. T.T. is a board member and B.M. is a scientific advisor of Bottmedical AG, Basel, Switzerland. The remaining authors declare that the research was conducted in the absence of any commercial or financial relationships that could be construed as a potential conflict of interest.

References

  1. Ke, Y.; Zhu, Y.; Zhu, M. A comparison of treatment effectiveness between clear aligner and fixed appliance therapies. BMC Oral Health 2019, 19, 24. [Google Scholar] [CrossRef] [PubMed]
  2. Papageorgiou, S.N.; Koletsi, D.; Iliadi, A.; Peltomaki, T.; Eliades, T. Treatment outcome with orthodontic aligners and fixed appliances: A systematic review with meta-analyses. Eur. J. Orthod. 2020, 42, 331–343. [Google Scholar] [CrossRef] [PubMed]
  3. Timm, L.H.; Farrag, G.; Baxmann, M.; Schwendicke, F. Factors influencing patient compliance during clear aligner therapy: A retrospective cohort study. J. Clin. Med. 2021, 10, 3103. [Google Scholar] [CrossRef]
  4. Shrivastava, A.; Mohanty, P.; Dash, B.P.; Jena, S.; Sahoo, N. Proficiency of clear aligner therapy: A systematic review and meta-analysis. Cureus 2023, 15, e45072. [Google Scholar] [CrossRef] [PubMed]
  5. Revilla-León, M.; Raney, L.; Cascón, W.; Barrington, J.; Zandinejad, A.; Özcan, M. Digital workflow for an esthetic rehabilitation using a facial and intraoral scanner and an additive manufactured silicone index: A dental technique. J. Prosthet. Dent. 2019, 123, 564–570. [Google Scholar] [CrossRef] [PubMed]
  6. Kau, C.H.; Soh, J.; Christou, T.; Mangal, A. Orthodontic aligners: Current perspectives for the modern orthodontic office. Medicina 2023, 59, 1773. [Google Scholar] [CrossRef]
  7. Weinstein, T.; Marano, G.; Aulakh, R. Five-to-five clear aligner therapy: Predictable orthodontic movement for general dentist to achieve minimally invasive dentistry. BMC Oral Health 2021, 21, 671. [Google Scholar] [CrossRef]
  8. Elnagar, M.H.; Pan, A.Y.; Handono, A.; Sanchez, F.; Talaat, S.; Bourauel, C.; Kaboudan, A.; Kusnoto, B. Utilization of machine learning methods for predicting orthodontic treatment length. Oral 2022, 2, 263–273. [Google Scholar] [CrossRef]
  9. Gay, G.; Ravera, S.; Castroflorio, T.; Garino, F.; Cugliari, G.; Deregibus, A. Root resorption in mandibular incisors during orthodontic treatment with Invisalign®: A radiometric study. Iran. J. Orthod. 2017, 12, e7915. [Google Scholar] [CrossRef]
  10. Gaddam, R.; Freer, E.; Kerr, B.; Weir, T. Reliability of torque expression by the Invisalign appliance: A retrospective study. Australas. Orthod. J. 2021, 37, 3–13. [Google Scholar] [CrossRef]
  11. Zhao, R.; Mei, L.; Long, H.; Jian, F.; Lai, W. Changing clear aligners every 10 days or 14 days? A randomised controlled trial. Australas. Orthod. J. 2023, 39, 1–12. [Google Scholar] [CrossRef]
  12. Grassia, V.; d’Apuzzo, F.; Alansari, R.A.; Jamilian, A.; Sayahpour, B.; Adel, S.M.; Nucci, L. Instagram and clear aligner therapy: A content analysis of patient perspectives. Semin. Orthod. 2024; in press. [Google Scholar] [CrossRef]
  13. Gopinath, P.M.; Parvathi, V.D.; Yoghalakshmi, N.; Kumar, S.M.; Athulya, P.A.; Mukherjee, A.; Chandrasekaran, N. Plastic particles in medicine: A systematic review of exposure and effects to human health. Chemosphere 2022, 303, 135227. [Google Scholar] [CrossRef] [PubMed]
  14. Quinzi, V.; Orilisi, G.; Vitiello, F.; Notarstefano, V.; Marzo, G.; Orsini, G. A spectroscopic study on orthodontic aligners: First evidence of secondary microplastic detachment after seven days of artificial saliva exposure. Sci. Total Environ. 2023, 866, 161356. [Google Scholar] [CrossRef] [PubMed]
  15. Ammann, R.; Tanner, C.; Schulz, G.; Osmani, B.; Nalabothu, P.; Töpper, T.; Müller, B. Three-dimensional analysis of aligner gaps and thickness distributions, using hard X-ray tomography with micrometer resolution. J. Med. Imaging 2022, 9, 031509. [Google Scholar] [CrossRef]
  16. Asiry, M.A. Biological aspects of orthodontic tooth movement: A review of literature. Saudi J. Biol. Sci. 2018, 25, 1027–1032. [Google Scholar] [CrossRef]
  17. Sacher, M.; Schulz, G.; Deyhle, H.; Jäger, K.; Müller, B. Accuracy of commercial intraoral scanners. J. Med. Imaging 2021, 8, 035501. [Google Scholar] [CrossRef]
  18. Vögtlin, C.; Schulz, G.; Jäger, K.; Müller, B. Comparing the accuracy of master models based on digital intra-oral scanners with conventional plaster casts. Phys. Med. 2016, 1, 20–26. [Google Scholar] [CrossRef]
  19. Schulz, G.; Thalmann, P.; Khimchenko, A.; Müller, B. Grating-based tomography applications in biomedical engineering. Proc. SPIE 2017, 10391, 1039117. [Google Scholar] [CrossRef]
  20. Park, S.Y.; Choi, S.-H.; Yu, H.-S.; Kim, S.-J.; Kim, H.; Kim, K.B.; Cha, J.-Y. Comparison of translucency, thickness, and gap width of thermoformed and 3D-printed clear aligners using micro-CT and spectrophotometer. Sci. Rep. 2023, 13, 10921. [Google Scholar] [CrossRef]
  21. Ali, D.; Mohammed, H.; Koo, S.H.; Kang, K.H.; Kim, S.C. Three-dimensional evaluation of tooth movement in Class II malocclusions treated without extraction by orthodontic mini-implant anchorage. Korean J. Orthod. 2016, 46, 280–289. [Google Scholar] [CrossRef] [PubMed]
  22. Amberg, B.; Romdhani, S.; Vetter, T. Optimal Step Nonrigid ICP Algorithms for Surface Registration. In Proceedings of the 2007 IEEE Conference on Computer Vision and Pattern Recognition, Minneapolis, MN, USA, 17–22 June 2007; pp. 1–8. [Google Scholar]
  23. Kabsch, W. A solution for the best rotation to relate two sets of vectors. Acta Crystallogr. Sect. A 1976, 32, 922–923. [Google Scholar] [CrossRef]
  24. Gonçalves, A.; Collard, A.; Monteiro, F.; Matos, D.; Carvalho, Ó.; Azevedo, R.; Silva, F.S.; Pinho, T. Accuracy of Invisalign(®) on upper incisors: A systematic review. Turk. J. Orthod. 2023, 36, 126–133. [Google Scholar] [CrossRef] [PubMed]
  25. Inchingolo, A.M.; Inchingolo, A.D.; Carpentiere, V.; Del Vecchio, G.; Ferrante, L.; Di Noia, A.; Palermo, A.; Di Venere, D.; Dipalma, G.; Inchingolo, F. Predictability of dental distalization with clear aligners: A systematic review. Bioengineering 2023, 10, 1390. [Google Scholar] [CrossRef] [PubMed]
  26. AlMogbel, A. Clear Aligner Therapy: Up to date review article. J. Orthod. Sci. 2023, 12, 37. [Google Scholar] [CrossRef]
  27. Chamberland, S.; Nataf, N. Noninvasive conservative management of anterior open bite treated with TADs versus clear aligner therapy. Clin. Oral Investig. 2024, 28, 236. [Google Scholar] [CrossRef]
  28. Elshazly, T.M.; Bourauel, C.; Ismail, A.; Ghoraba, O.; Aldesoki, M.; Salvatori, D.; Elattar, H.; Alhotan, A.; Alkabani, Y. Effect of material composition and thickness of orthodontic aligners on the transmission and distribution of forces: An in vitro study. Clin. Oral Investig. 2024, 28, 258. [Google Scholar] [CrossRef]
  29. Dalaie, K.; Fatemi, S.M.; Ghaffari, S. Dynamic mechanical and thermal properties of clear aligners after thermoforming and aging. Prog. Orthod. 2021, 22, 15. [Google Scholar] [CrossRef]
  30. Meade, M.J.; Weir, T.; Seehra, J.; Fleming, P.S. Clear aligner therapy practice among orthodontists in the United Kingdom and the Republic of Ireland: A cross-sectional survey of the British Orthodontic Society membership. J. Orthod. 2024, 51, 120–129. [Google Scholar] [CrossRef]
  31. Tüfekçi, E.; Carrico, C.K.; Gordon, C.B.; Lindauer, S.J. Does crown, root, and bone visualization in a clear aligner virtual setup impact treatment decisions? Am. J. Orthod. Dentofacial Orthop. 2024, 165, 671–679. [Google Scholar] [CrossRef]
  32. Al-Worafi, N.A.; Zheng, B.; Al-Warafi, L.A.; Alyafrusee, E.S.; Alsomairi, M.A.A.; Liu, Y. Impact of molar teeth distalization by clear aligners on maxillary alveolar bone thickness and root resorption: A three-dimensional study. BMC Oral Health 2024, 24, 237. [Google Scholar] [CrossRef] [PubMed]
  33. Woo, H.; Jha, N.; Kim, Y.-J.; Sung, S.-J. Evaluating the accuracy of automated orthodontic digital setup models. Semin. Orthod. 2023, 29, 60–67. [Google Scholar] [CrossRef]
  34. Adobes-Martin, M.; Montoya-Morcillo, M.L.; Zhou-Wu, A.; Garcovich, D. Invisalign treatment from the patient perspective: A Twitter content analyses. J. Clin. Exp. Dent. 2021, 13, e376–e382. [Google Scholar] [CrossRef] [PubMed]
  35. Fialho, T.; de Freitas, K.M.S.; Ohira, E.T.B.; de Souza, J.E.P.; de Oliveira, R.C.G.; de Oliveira, R.C.G.; Valarelli, F.P.; Pinzan-Vercelino, C.R.M.; Cotrin, P. Comparison of the efficiency of initial dental alignment with Invisalign® aligners changed every 7 or 14 days in mature adults: Randomized clinical trial. Orthod. Craniofac. Res. 2024, 27, 544–551. [Google Scholar] [CrossRef] [PubMed]
  36. Moradinejad, M.; Harrell, R.E.; Mousavi, S.M.; Alavi, M.; Basseri, A.D.; Feiz, A.; Daryanavard, H.; Rakhshan, V. Effects of clear aligners on the vertical position of the molar teeth and the vertical and sagittal relationships of the face: A preliminary retrospective before-after clinical trial. BMC Oral Health 2024, 24, 234. [Google Scholar] [CrossRef]
  37. Robertson, L.; Kaur, H.; Fagundes, N.C.F.; Romanyk, D.; Major, P.; Flores Mir, C. Effectiveness of clear aligner therapy for orthodontic treatment: A systematic review. Orthod. Craniofac. Res. 2020, 23, 133–142. [Google Scholar] [CrossRef]
Figure 1. (a) A photograph of the PEEK model. (b) A three-dimensional representation of the reference microtomography data (model) showing crown-like features in yellow and hollow cylinders in magenta. The data from the intraoral scanners (c) Sirona, (d) Trios, (e) iTero, and (f) Medit were manually aligned to the model and obtained as triplicates. The four devices allowed us to capture the crown-like features and the hollow cylinders.
Oral 04 00039 g001
Figure 2. Based on the intraoral scans of the upper and lower jaws at Week 9, the black arrows/dots illustrate the selection of the global coordinate systems for the patient data (see left and right columns, respectively). The orange-, magenta-, and blue-colored arrows are used to display the coordinate systems for the individual crowns in the mesial, extrusion, and buccal directions, respectively.
Oral 04 00039 g002
Figure 3. The distribution of three times 100 sampled Euclidean distances for (a) the hollow cylinders and (b) the crown-like features. Statistical significance at the 0.001 level is marked by cyan lines for medians (Mann–Whitney U-test) and magenta lines for means (t-test). The results for the hollow cylinders coincide with previously published data [17]. The data from the crown-like features show similar results. The intraoral scanner from Sirona is the best choice. Hence, it was selected for the present case study.
Oral 04 00039 g003
Figure 4. The arrangement of the crowns of the upper and lower jaws of Patient A and of Patient B is represented for the start of the treatment, i.e., Week 0. Their color corresponds to the magnitude of orthodontic tooth movement, ranging from blue through green to yellow, which is given for the selected treatment times of Week 2, Week 4, Week 6, and Week 8, always with respect to Week 0. The video in the Supplementary Materials shows the treatment progress.
Oral 04 00039 g004
Figure 5. The tooth displacement in the extrusion and intrusion directions is labeled according to the color bar from mint to a reddish color. Looking at the individual jaws, one frequently recognizes opposite coloring for the opposite quadrants. The reference is always the start of the therapy, i.e., Week 0. The video in the Supplementary Materials indicates the temporal changes in tooth displacement.
Oral 04 00039 g005
Figure 6. The movement of selected teeth of Patient A on the left for the maxilla and on the right for the opposite teeth of the mandible. The renderings are the crown positions at the start of the treatment, given in a dark blue color, and after nine-week treatment in a dark red color. The translation and rotation for each treatment step, which corresponds to exactly one week, represented by blue to red colors, are displayed in the local coordinate system of the start state: intrusion–extrusion direction—magenta scale; distal–mesial direction—orange scale; lingual–buccal direction—blue scale. The boxes cover a volume of (1 mm)3.
Oral 04 00039 g006
Figure 7. The movement of selected teeth of Patient B on the left for the maxilla and on the right for the opposite teeth of the mandible. The renderings are the crown positions at the start of the treatment, given in a dark blue color, and after nine-week treatment in a dark red color. The translation and rotation for each treatment step, which corresponds to exactly one week, represented by blue to red colors, are displayed in the local coordinate system of the start state: intrusion–extrusion direction—magenta scale; distal–mesial direction—orange scale; lingual–buccal direction—blue scale. The boxes cover a volume of (1 mm)3.
Oral 04 00039 g007
Figure 8. The rate of movement of the individual crowns is color-coded according to the bar and displayed for the aligner treatment duration according to the weekly oral scans: (a) upper and lower jaws of Patient A and (b) upper and lower jaws of Patient B.
Oral 04 00039 g008
Figure 9. The differences in the actual tooth positions and those of the treatment plan are color-coded from blue through green to red (see color bar) for Patient A on the top and Patient B at the bottom for the four treatment durations indicated. The reference space is always the starting point, i.e., Week 0. The video in the Supplementary Materials represents the progress of the actual treatment.
Oral 04 00039 g009
Table 1. The mean values ± standard deviation, in µm, of the Euclidean distances in three dimensions between the centers of the magenta-colored hollow cylinders and meshes for all and 100 randomly sampled points (in brackets) of hollow cylinders and crown-like features.
ScannerCylinder CentersHollow CylindersCrown-Like Features
Sirona14 ± 855 ± 35 (56 ± 38)50 ± 25 (48 ± 21)
Trios24 ± 1563 ± 26 (64 ± 28)58 ± 24 (58 ± 24)
iTero25 ± 1565 ± 28 (66 ± 30)60 ± 26 (58 ± 24)
Medit43 ± 2291 ± 90 (90 ± 91)70 ± 49 (69 ± 40)
Disclaimer/Publisher’s Note: The statements, opinions and data contained in all publications are solely those of the individual author(s) and contributor(s) and not of MDPI and/or the editor(s). MDPI and/or the editor(s) disclaim responsibility for any injury to people or property resulting from any ideas, methods, instructions or products referred to in the content.

