Case Report

Flow Cytometry Immunophenotyping in Hematology Clinical Practice: Panacea or a Diagnostic Tool? Conclusions from a Case Report

by
Georgios Boutsikas
1,2,
Konstantinos Agiannitopoulos
3,*,
Ioannis Anagnostopoulos
1,
Myrofora Vikentiou
1,
Maria Roumelioti
1,
Athanasios Papatheodorou
2,
Elisavet Kouvidi
4,
Andriana Panoutsou
1,
Georgios Georgiou
5,
Aglaia Dimitrakopoulou
6,
Nikolaos Paschalidis
7,
Elisavet Economaki
8 and
Evdoxia Pouliou
8
1
Phenotypos Medical Diagnostic Center, 11525 Athens, Greece
2
Department of Medical Research, 251 Air Force General Hospital, 11527 Athens, Greece
3
Division of Genetics & Biotechnology, Department of Biology, National and Kapodistrian University of Athens, 15701 Athens, Greece
4
Department of Genetics, Institute of Child Health, 11527 Athens, Greece
5
Unilabs, 1206 Geneva, Switzerland
6
Immunology Laboratory, “Laiko” General Hospital, 11527 Athens, Greece
7
Biomedical Research Foundation of the Academy of Athens, 11527 Athens, Greece
8
Hematopathology Department, “Evaggelismos” General Hospital, 10676 Athens, Greece
*
Author to whom correspondence should be addressed.
Hemato 2026, 7(2), 22; https://doi.org/10.3390/hemato7020022
Submission received: 24 April 2026 / Revised: 9 June 2026 / Accepted: 18 June 2026 / Published: 22 June 2026
(This article belongs to the Section Leukemias)

Abstract

Flow cytometry is an essential diagnostic method in hematology, and one of its main applications is the assessment of the clonality of mature B cells. We present a case report of a patient referred for the investigation of absolute lymphocytosis. The flow cytometry study revealed an increased percentage of B cells, but it could not establish B-cell clonality, based on the study of surface light chains in combination with the pattern of expression of mature B-cell markers. The diagnosis of Persistent Polyclonal B-cell Lymphocytosis (PPBL) was considered in the differential diagnosis as the mature B cells were found to be immunophenotypically memory B cells. However, due to the markedly elevated count of B cells, molecular testing with Polymerase Chain Reaction (PCR) for B-cell clonality based on IGH (Immunoglobulin Heavy Chain) gene rearrangements was performed, and it revealed the presence of two clones of B cells. Approximately one year later, the same work-up was repeated in the patient’s bone marrow aspirate. By flow cytometry, a distinct clonal B-cell population was isolated, while the molecular testing with PCR for B cell clonality based on IGH heavy-chain gene rearrangements revealed the presence of three clones of B cells. In addition, evaluation of the sample with high-dimensional mass cytometry showed the presence of four major immunophenotypically abnormal B-cell subsets.

1. Introduction

Investigation of absolute lymphocytosis represents one of the most common and clinically significant indications for flow cytometry immunophenotyping in hematological practice [1]. This laboratory technique plays a pivotal role in distinguishing between reactive (benign) and clonal (malignant) lymphoproliferative processes by enabling the detailed characterization of lymphocyte subsets based on their surface and cytoplasmic markers [2]. In many cases, flow cytometry provides sufficient information to establish a definitive diagnosis, particularly in well-defined entities such as chronic lymphocytic leukemia or certain non-Hodgkin lymphomas [1].
However, diagnostic challenges arise when immunophenotypic findings are inconclusive, atypical, or do not clearly correspond to established classification criteria. In such scenarios, reliance on flow cytometry alone may lead to diagnostic uncertainty or misclassification. Therefore, a comprehensive and integrative approach becomes essential. The interpretation of immunophenotypic data must be contextualized within the patient’s full clinical picture, including the medical history, physical examination findings, and additional laboratory parameters such as complete blood count trends, peripheral blood morphology, cytogenetic and molecular studies, and imaging results when appropriate [3].
This multidimensional assessment not only facilitates an accurate diagnosis but also guides the selection of further targeted investigations, such as a bone marrow examination or advanced molecular testing. Ultimately, combining flow cytometry with clinical and laboratory correlation supports the establishment of an evidence-based diagnosis, ensuring appropriate patient management and prognostic evaluation [4].

2. Case Presentation

An 82-year-old male was referred to our laboratory for flow cytometry investigation of absolute lymphocytosis, with a possible diagnosis of chronic lymphocytic leukemia (CLL). The clinical information provided did not mention B symptoms, lymphadenopathy, or organomegaly.
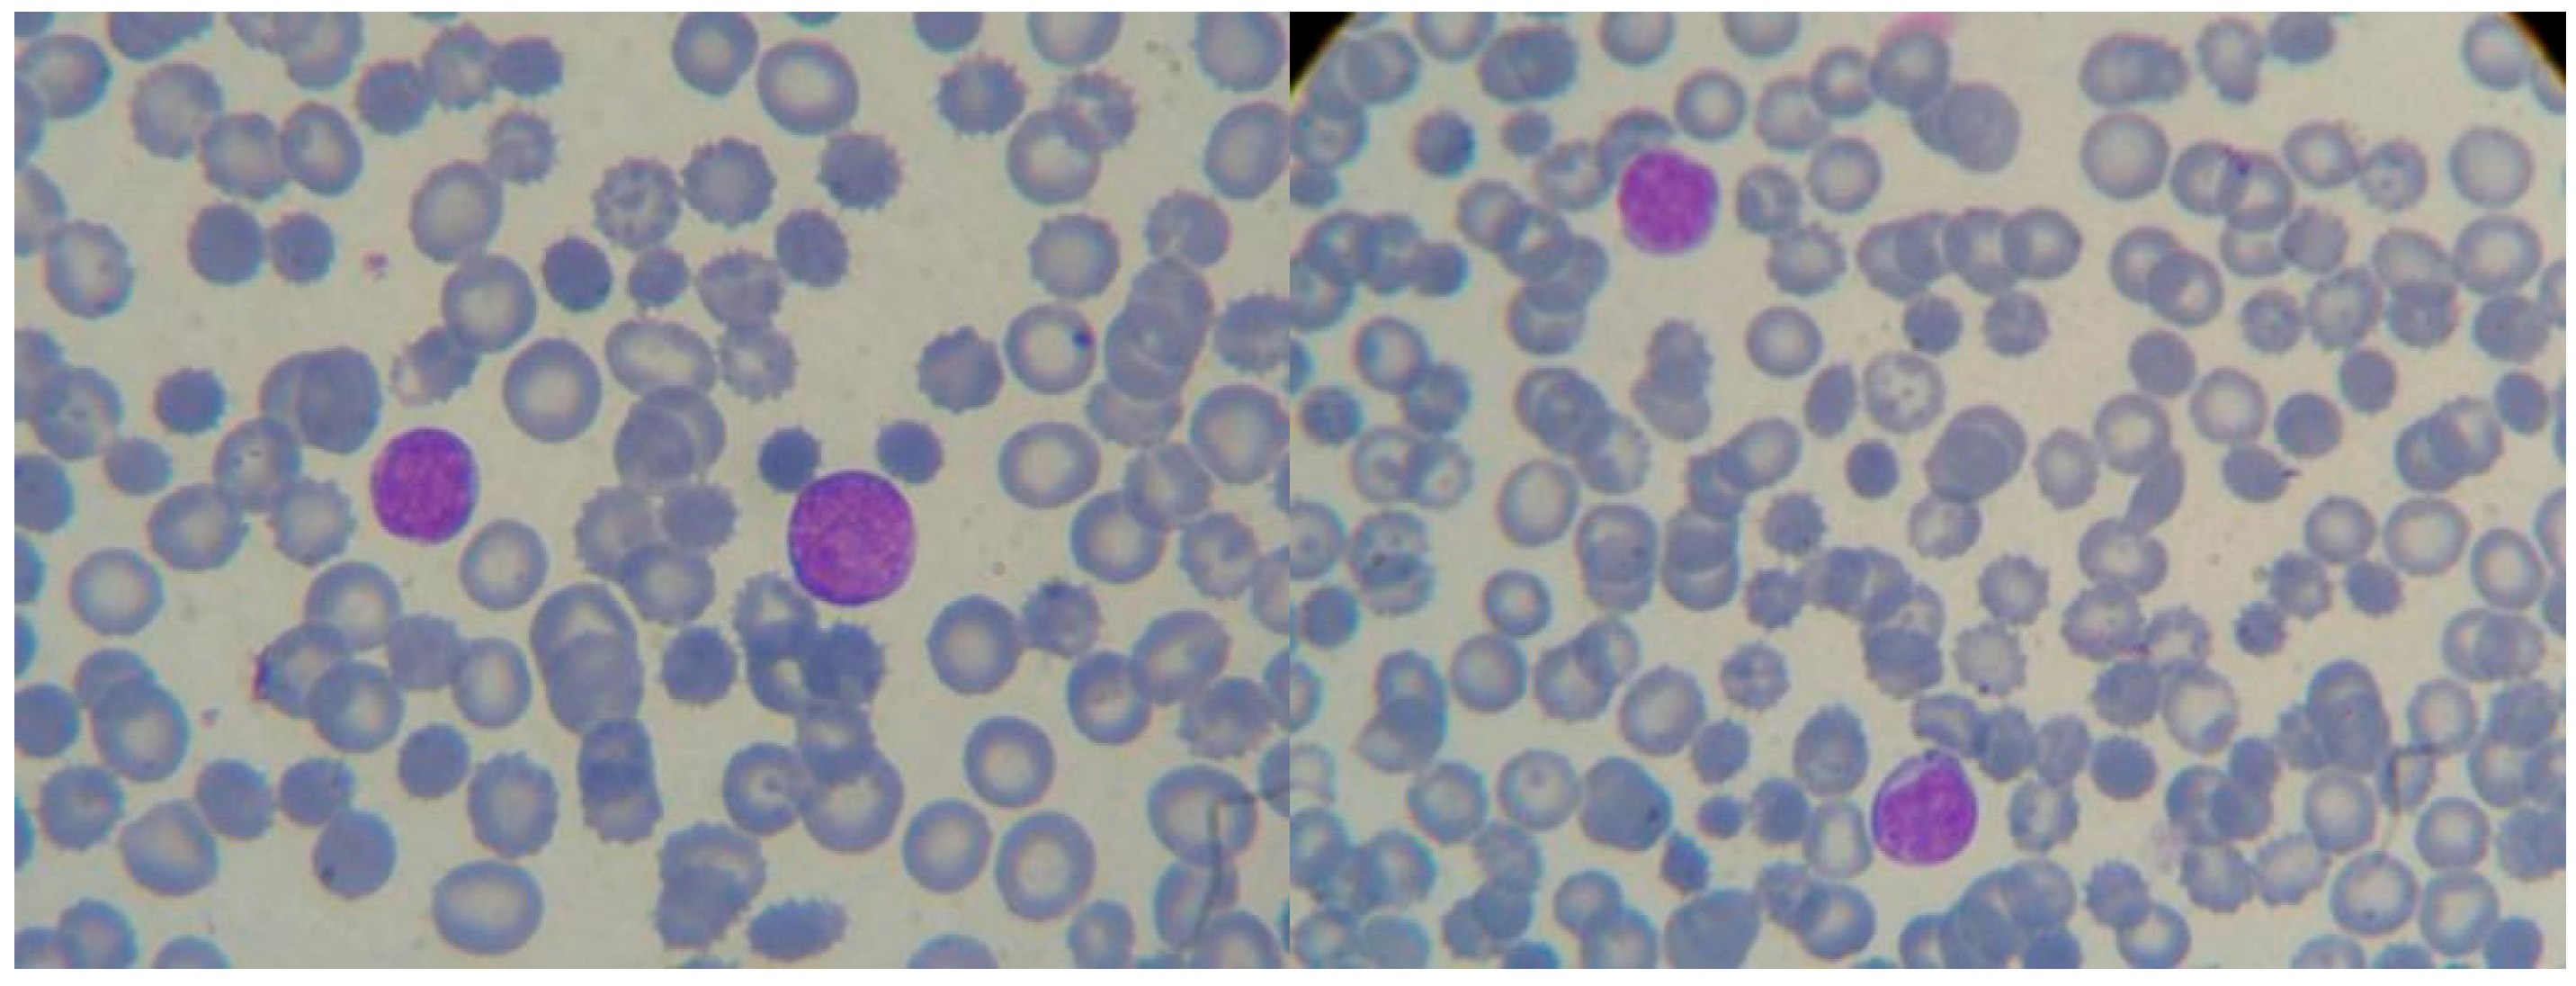
Complete blood count showed White Blood Cells 35 × 109/L, Absolute Lymphocyte Count 23 × 109/L, Hemoglobin 134 g/L, Platelets 148 × 109/L. Peripheral blood smear examination revealed a relatively monomorphic lymphocytic population without the presence of smudge cells or binucleated/bilobed B cells (Figure 1).
The blood sample was prepared with the Stain–Lyse–Wash (SLW) Protocol (Excellyse Live lysing solution, EXBIO, Vestec, Czech Republic) and analyzed by flow cytometry (screening tube: a basic combination of monoclonal antibodies used to evaluate the basic lymphocytic subpopulations and the clonality of B cells by assessing the surface light chain expression) using the following monoclonal antibody combination: CD45KO/(CD8 + Kappa)FITC (Fluorescein Isothiocyanate)/(CD4+Lambda)PE/CD3ECD/CD56PC5/CD19PC7/CD5APC/-/CD38APC-Cy7 (EXBIO, Vestec, Czech Republic). Acquisition was performed using a Navios Flow Cytometer [3 lasers, 10 colors (Beckman Coulter, Brea, CA, USA)] and data analysis was conducted using Kaluza Software 2.4 (Beckman Coulter, Brea, CA, USA).
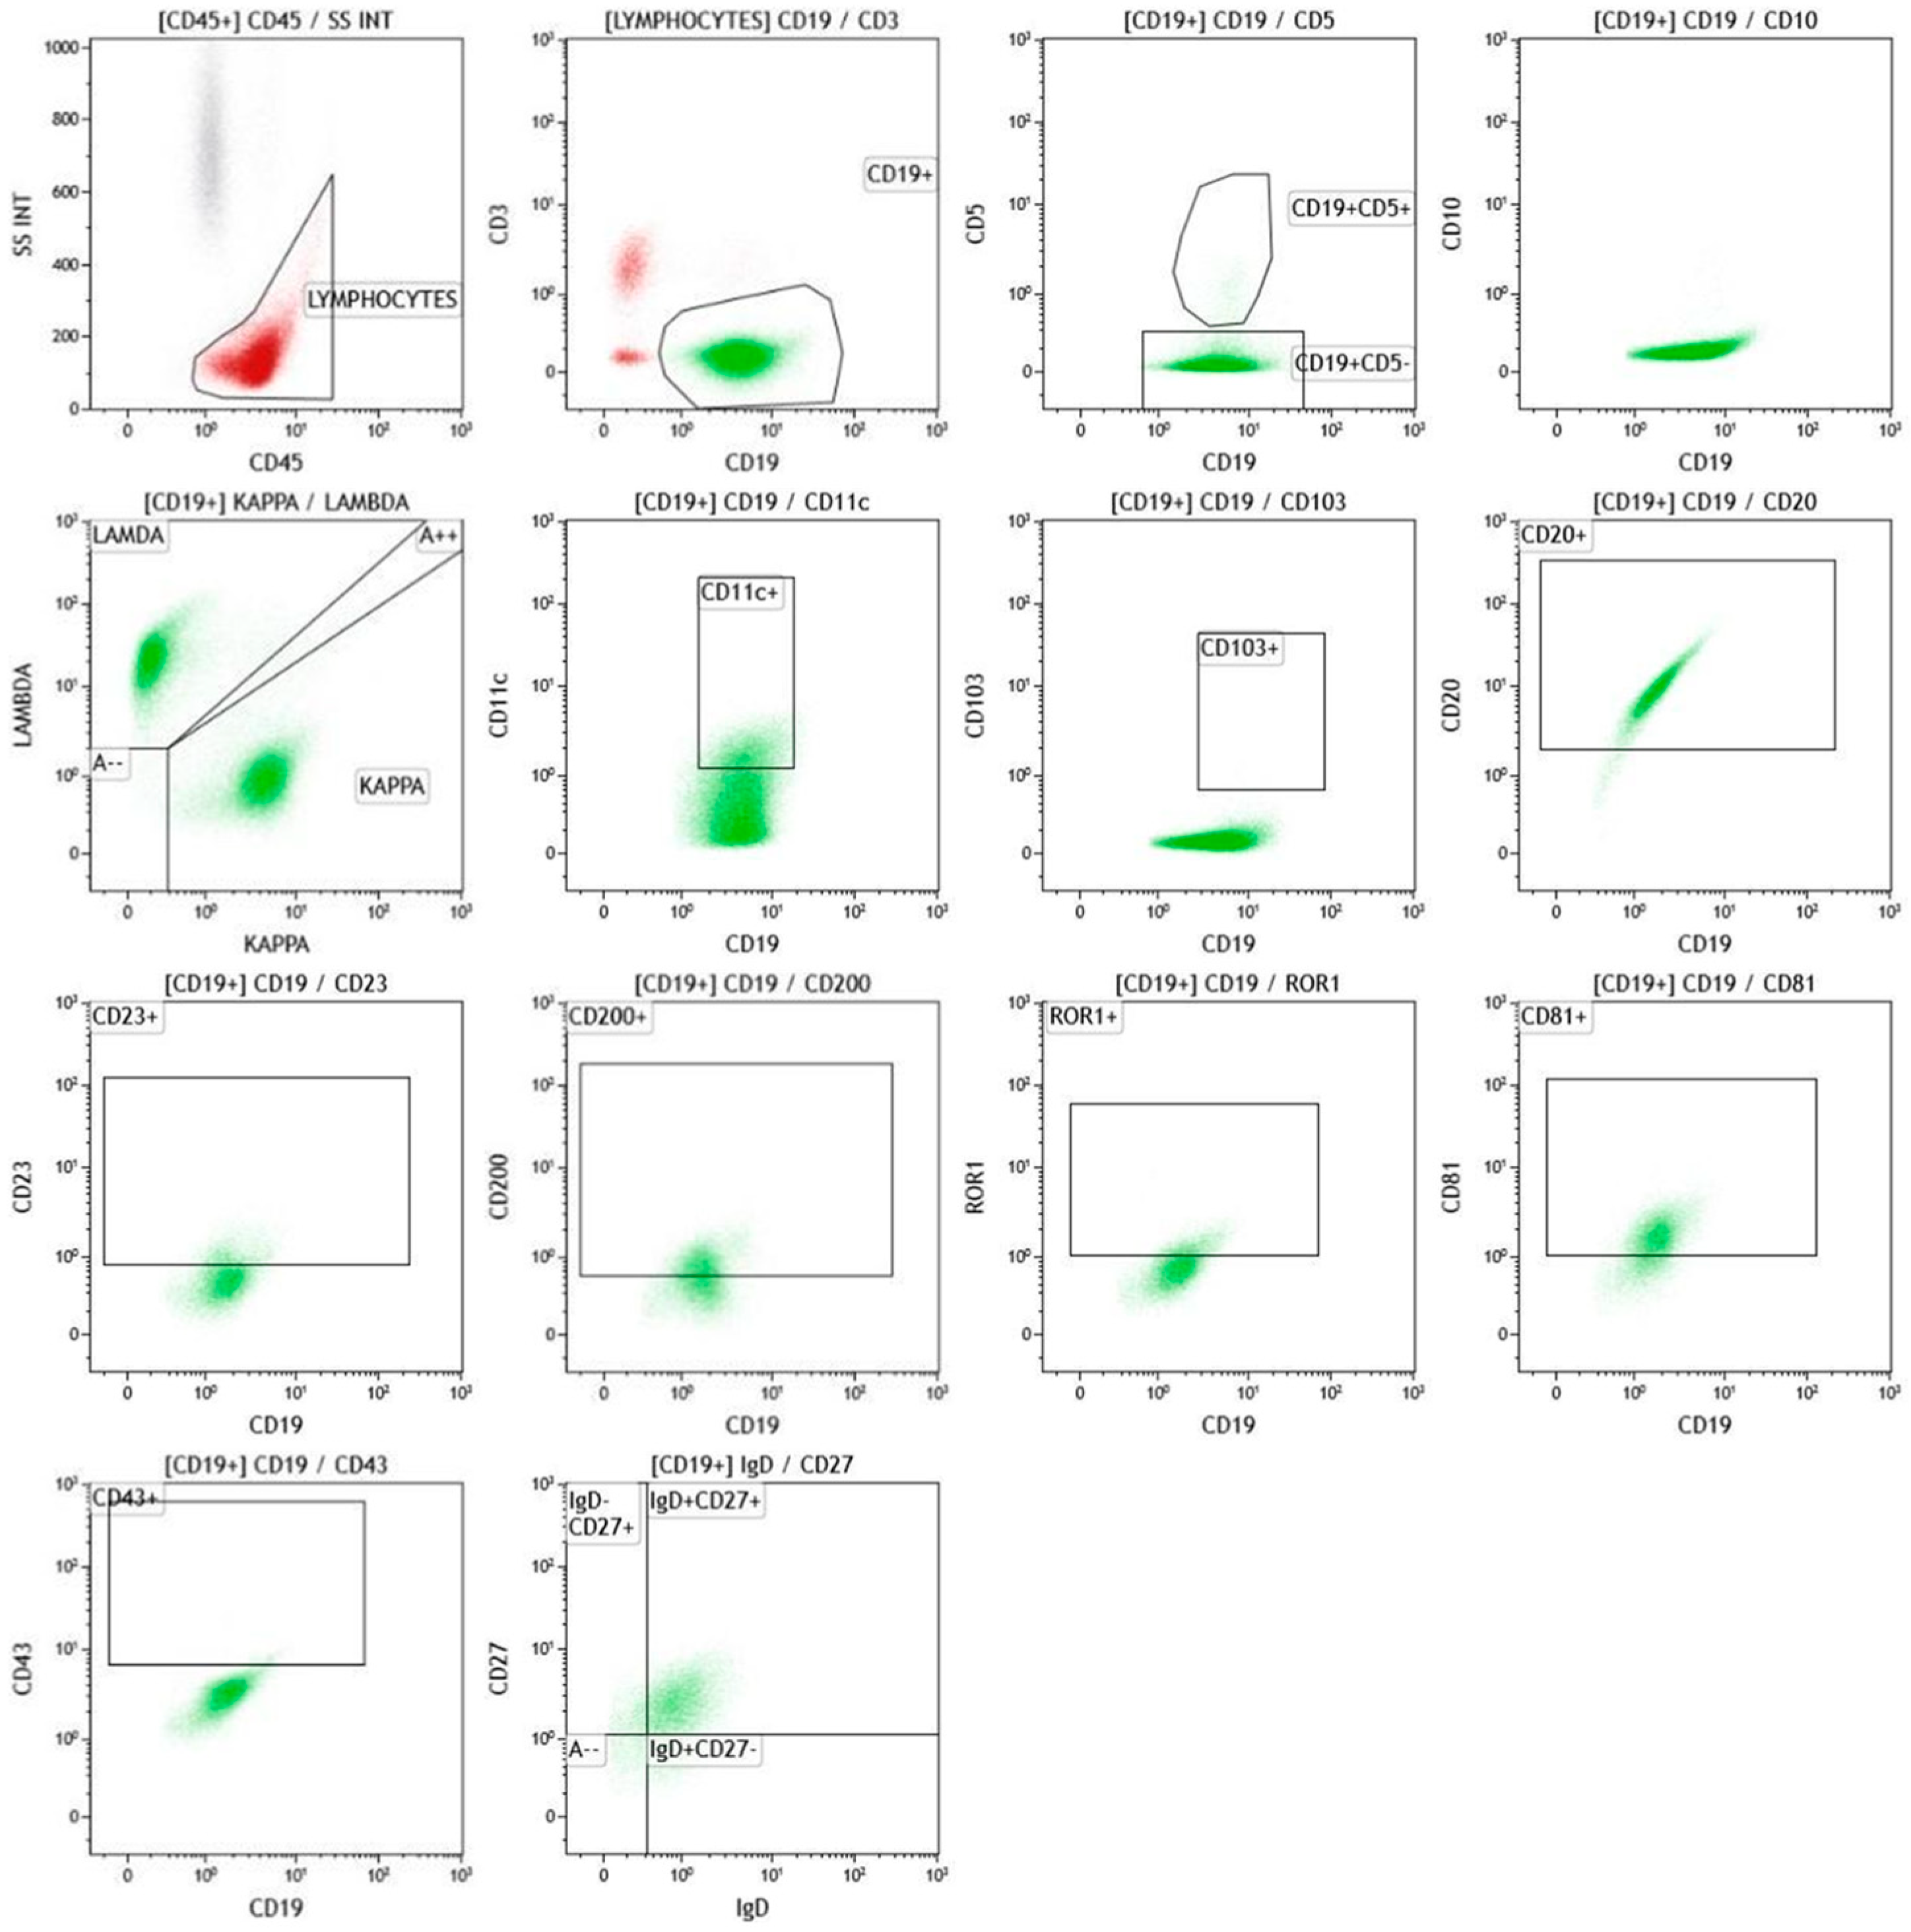
Flow cytometry analysis revealed an inversion of the neutrophil-to-lymphocyte ratio with an increased percentage of B cells (88% on lymphocytes CD19+CD20+sIg+), which, however, were polytypic (κ/λ ratio 0.4, indicating λ light chain predominance—clonality is documented when the κ/λ ratio > 10 or <0.1) based on surface light-chain assessment (Figure 2).
Additional monoclonal antibody combinations were used: KappaPB/CD45KO/CD11cFITC/CD103PE/CD10ECD/CD123PC5/CD19PC7/CD25APC/-/LambdaAPC-Cy7 and CD20PB/CD19KO/CD200FITC/CD79b/CD23ECD/CD49dPC5/ROR1PC7/CD81APC/CD45A700/CD43APC-Cy7 (EXBIO, Vestec, Czech Republic). These panels confirmed the polytypic nature of the B cells (the observed κ/λ ratio was between 0.1 and 10), with no loss, ectopic, or asynchronous antigen expression. The B-cell population showed uniform, yet heterogeneous, antigen expression overall (Figure 2).
Thus, Persistent Polyclonal B-cell Lymphocytosis (PPBL) was suspected due to the high percentage and absolute count of B-lymphocytes. A further panel was applied: IgDPB/CD3KO/CD8FITC/CD16PE/CD56ECD/CD27PC5/(CD19+TCRγδ)PC7/CD45RAAPC/CD45A700/CD4APC-Cy7 (EXBIO, Vestec, Czech Republic). The last panel demonstrated that the entire B-cell population consisted of unswitched memory B cells (IgD+CD27+), a finding indicative of PPBL (Figure 2).
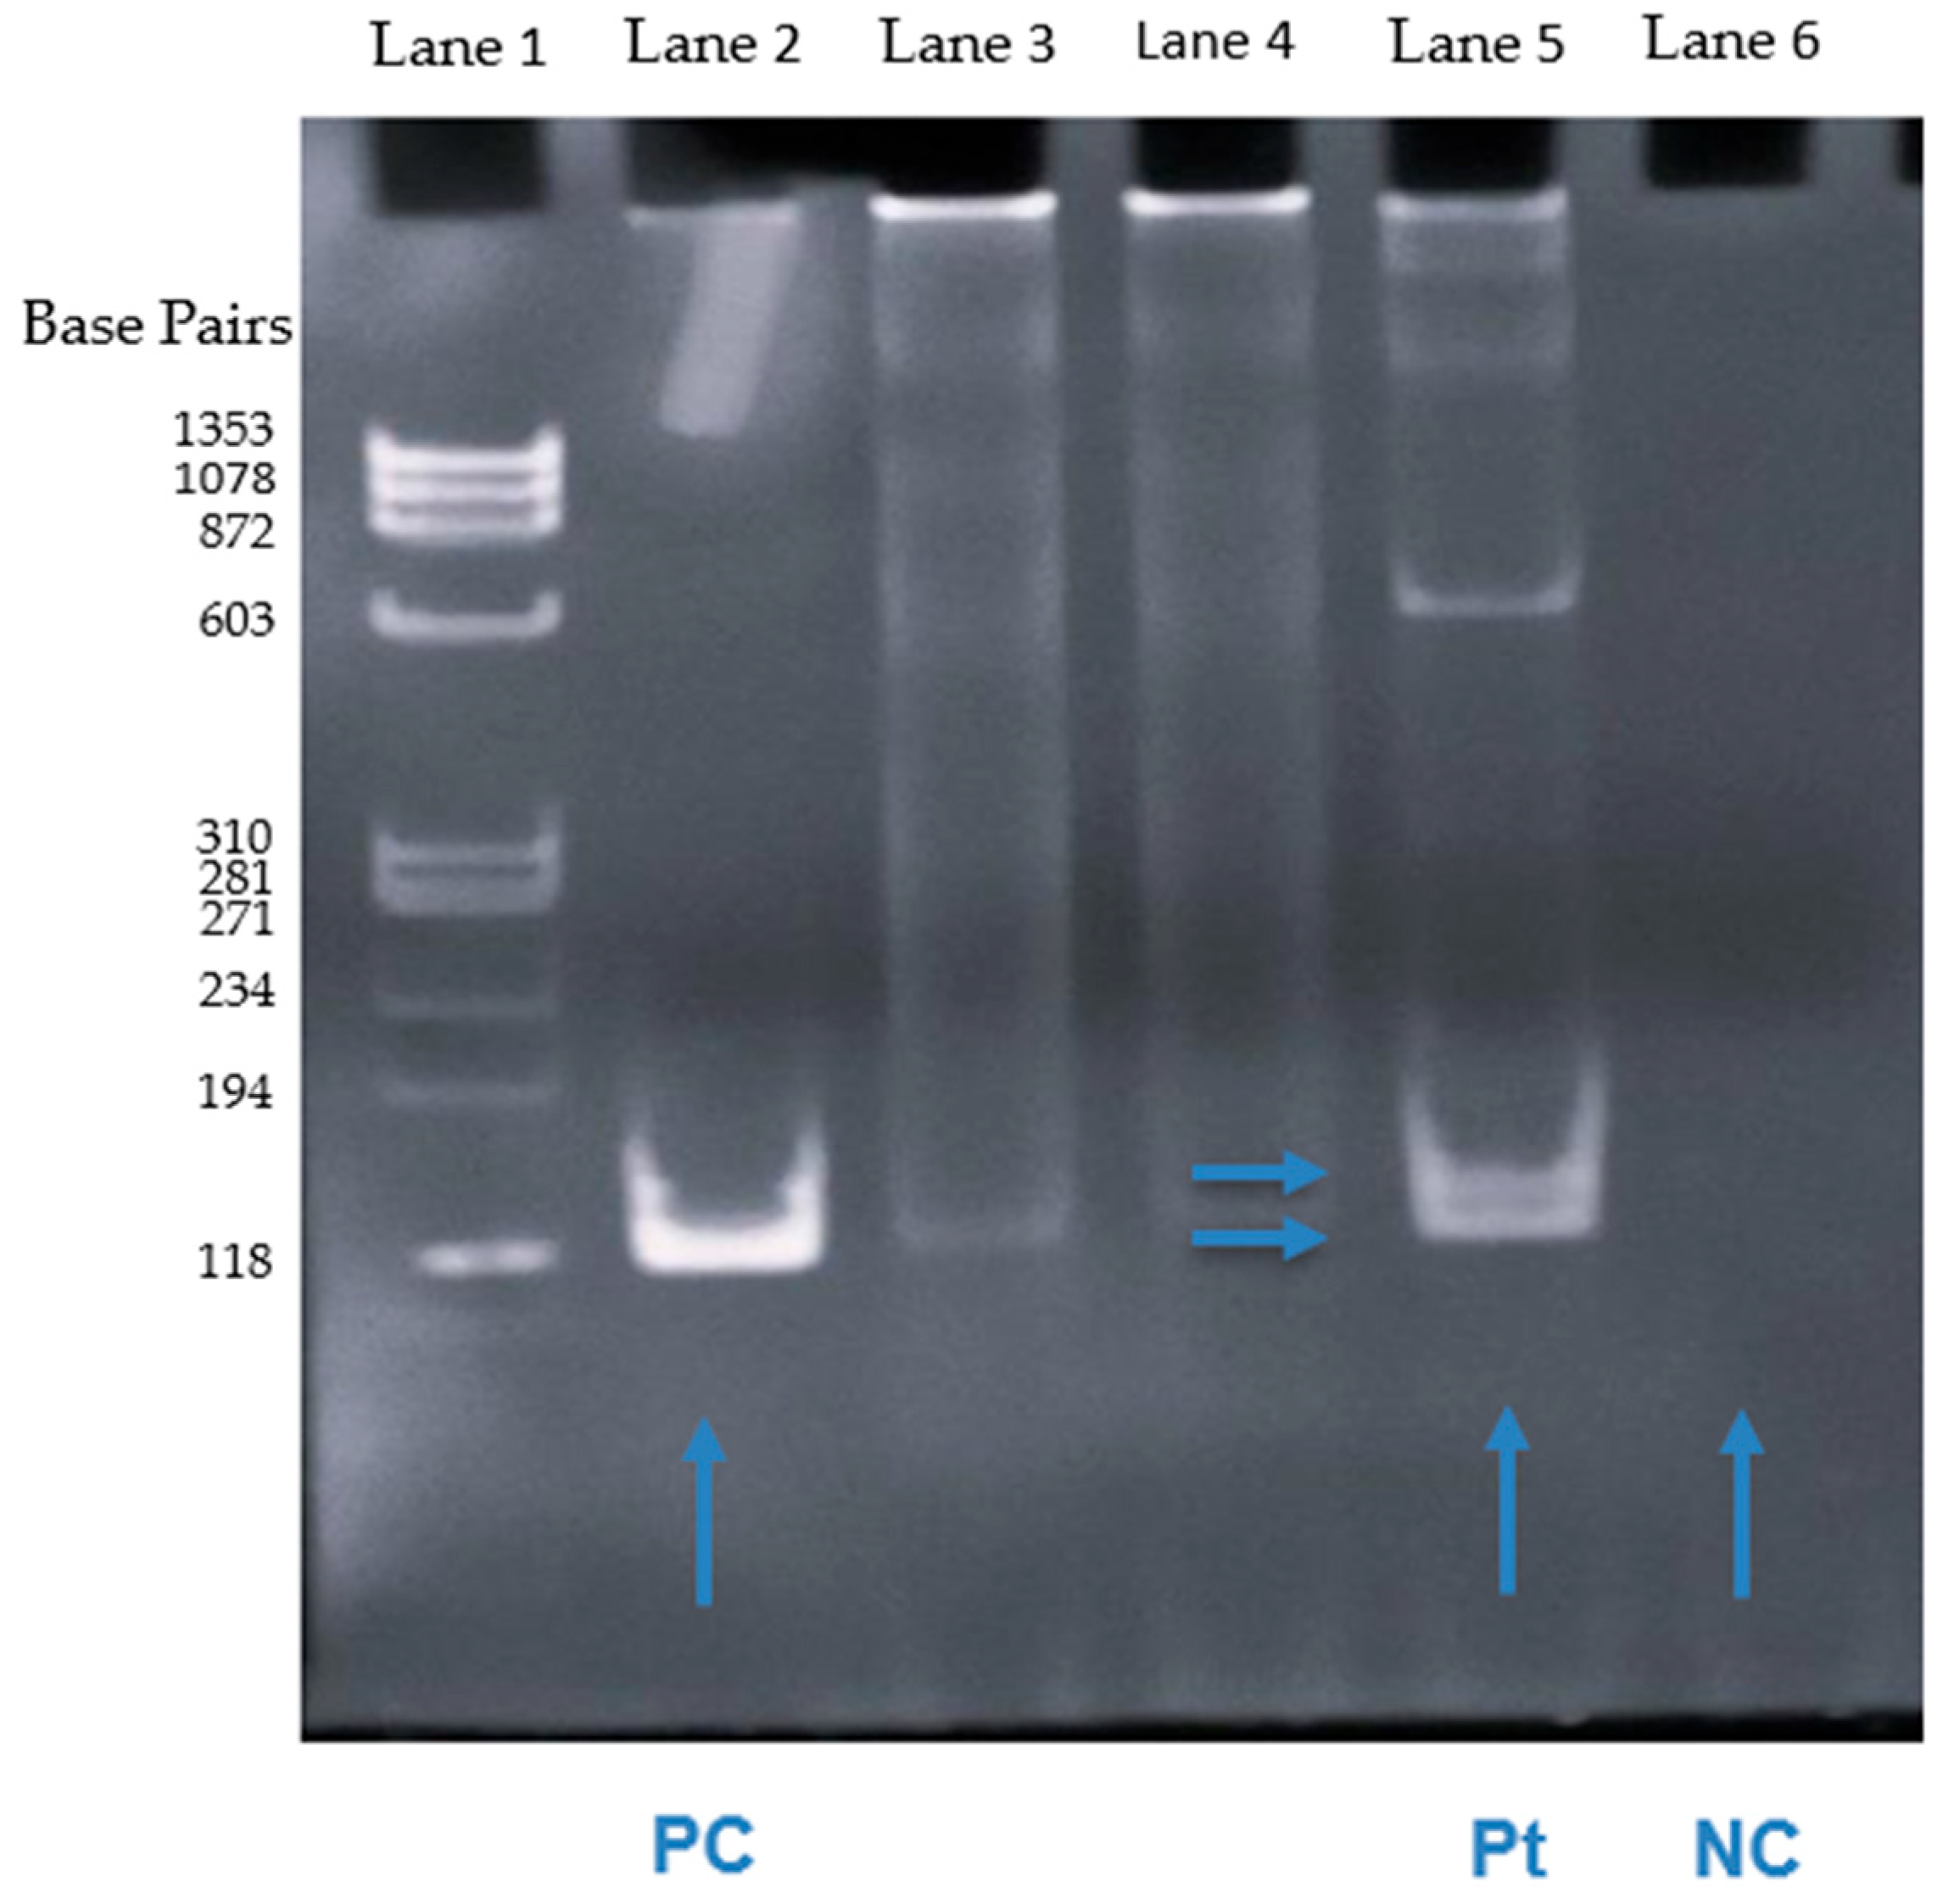
However, due to the markedly elevated absolute B-lymphocyte count, molecular testing with Polymerase Chain Reaction (PCR) for B-cell clonality based on IGH (Immunoglobulin Heavy Chain) gene rearrangements was performed. DNA was isolated from the patient’s blood smear (Zybio extraction systems, Chongqing Municipality, China), followed by PCR (Eppendorf SE, Hamburg, Germany) for IGH heavy-chain gene rearrangements (IGH-FR3) (Master Diagnostica kit BIOMED2, Master Diagnostica S.L., Granada, Andalusia, Spain). Polyacrylamide gel electrophoresis of the PCR products (using Heteroduplex analysis) revealed two distinct bands of different sizes, leading to the final diagnosis of two CD5-CD10- B-NHL clones (Figure 3).
The patient was placed under follow-up. Approximately one year later, we received THE patient’s bone marrow aspirate sample in our laboratory for immunophenotypic analysis by flow cytometry. The patient now presented with marked leukocytosis and lymphocytosis (Absolute Lymphocyte Count (ALC) > 100 × 109/L)). Taking into account the findings from the peripheral blood examination, the following combinations of monoclonal antibodies were applied: CD45KO/KappaFITC/LambdaPE/CD10ECD/CD19PC7/CD5APC/-/CD38APC-Cy7, CD4PB/CD45KO/CD8FITC/CD16PE/CD3ECD/CD56PC5/CD19PC7/CD34APC, KappaPB/45KO/200FITC/CD79bPE/CD23ECD/CD22PC5/CD19PC7/CD20APC/LambdaAPC-Cy7, KappaPB/CD45KO/CD11cFITC/CD103PE/CD25ECD/CD123PC5/CD19PC7/CD180APC/LambdaAPC-Cy7, IgDPB/CD19KO/KappaFITC/LambdaPE/CD27PC5/ROR1PC7/CD81APC/CD45A700/CD43APC-Cy7 and IgDPB/CD3KO/CD8FITC/CD16PE/CD56ECD/CD27PC5/(CD19+TCRγδ)PC7/CD45RAAPC/CD45A700/CD4APC-Cy7 (EXBIO, Vestec, Czech Republic). The rationale behind these protocols was to isolate a subpopulation or subpopulations of mature B cells based on antigen expression that would be clonal with respect to surface light-chain expression.
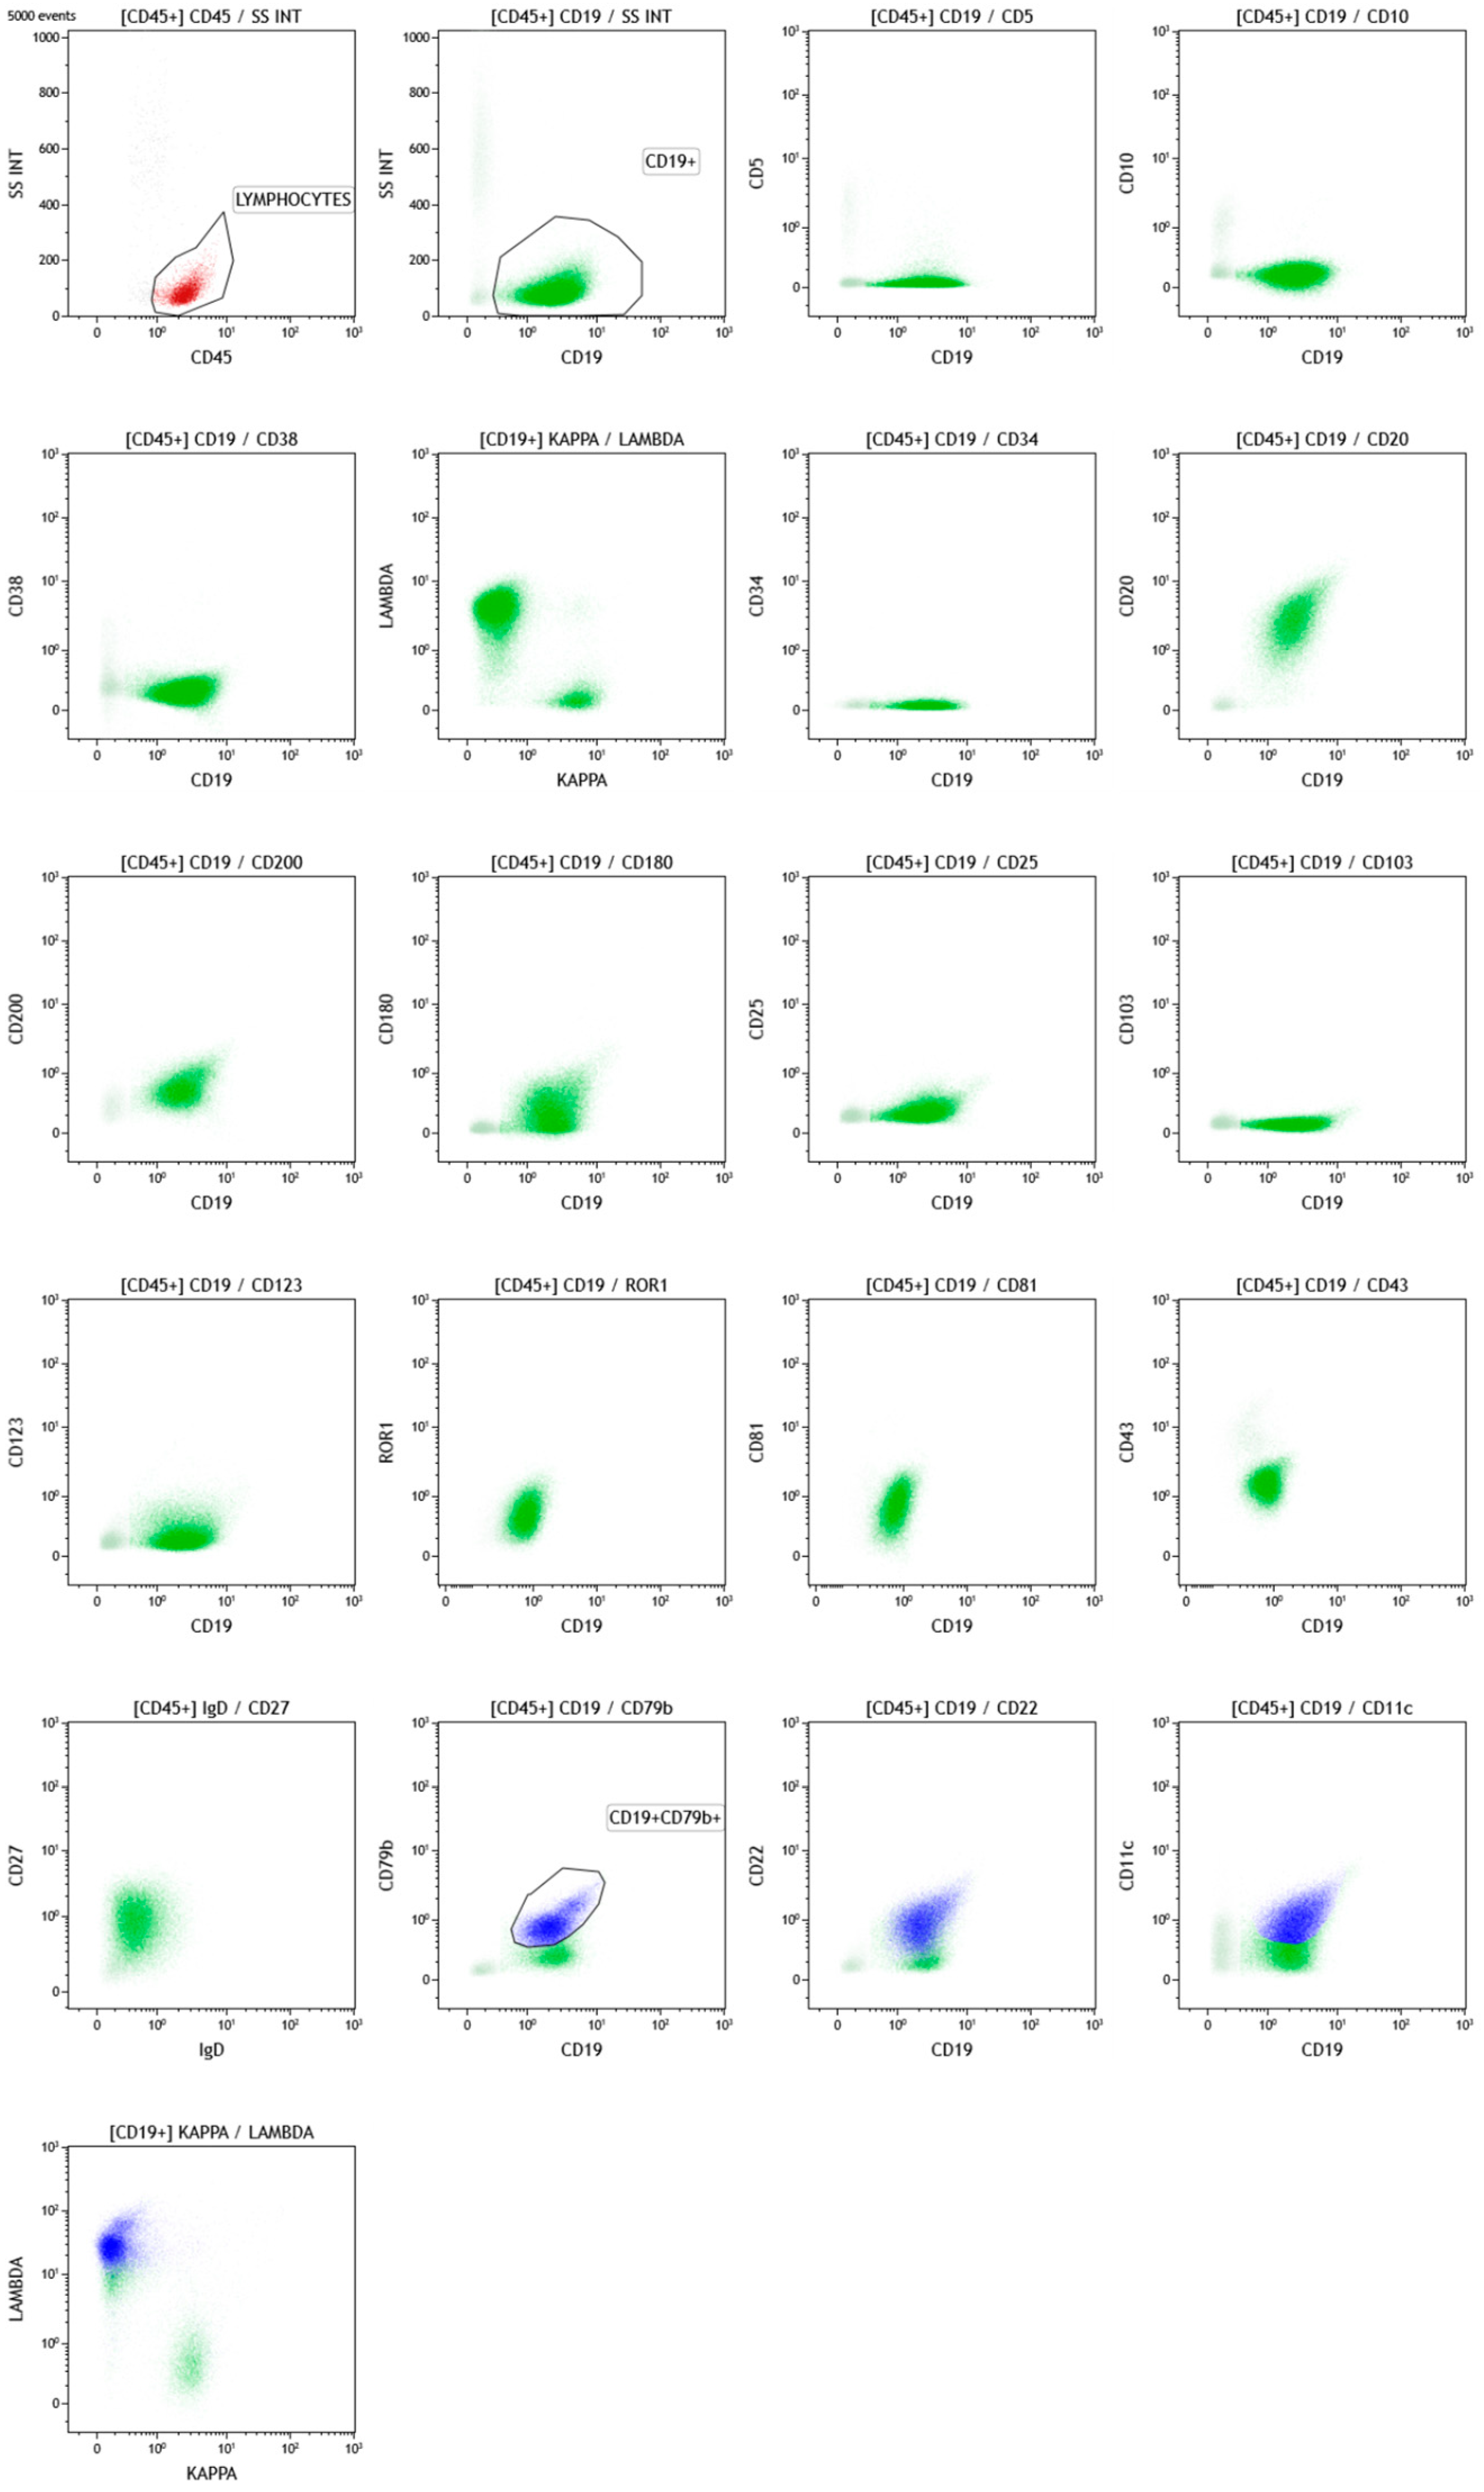
Flow cytometric data analysis revealed a strong presence of B cells in the bone marrow aspirate (lymphocytes 90% of CD45+ bone marrow cells, B cells 90% of lymphocytes), all of which were CD5- and CD10- and showed predominance of λ surface light chains (κ/λ ratio 0.2, (intermediate expression)). A distinct population of B cells (70% of B cells) was successfully isolated, characterized by stronger expression of CD79b, CD22 and CD11c compared to the remaining B cells (30% of B cells), and showing λ-restricted surface light-chain clonality (κ/λ ratio 0.01), a finding indicative of CD5-CD10- B-NHL (Figure 4).
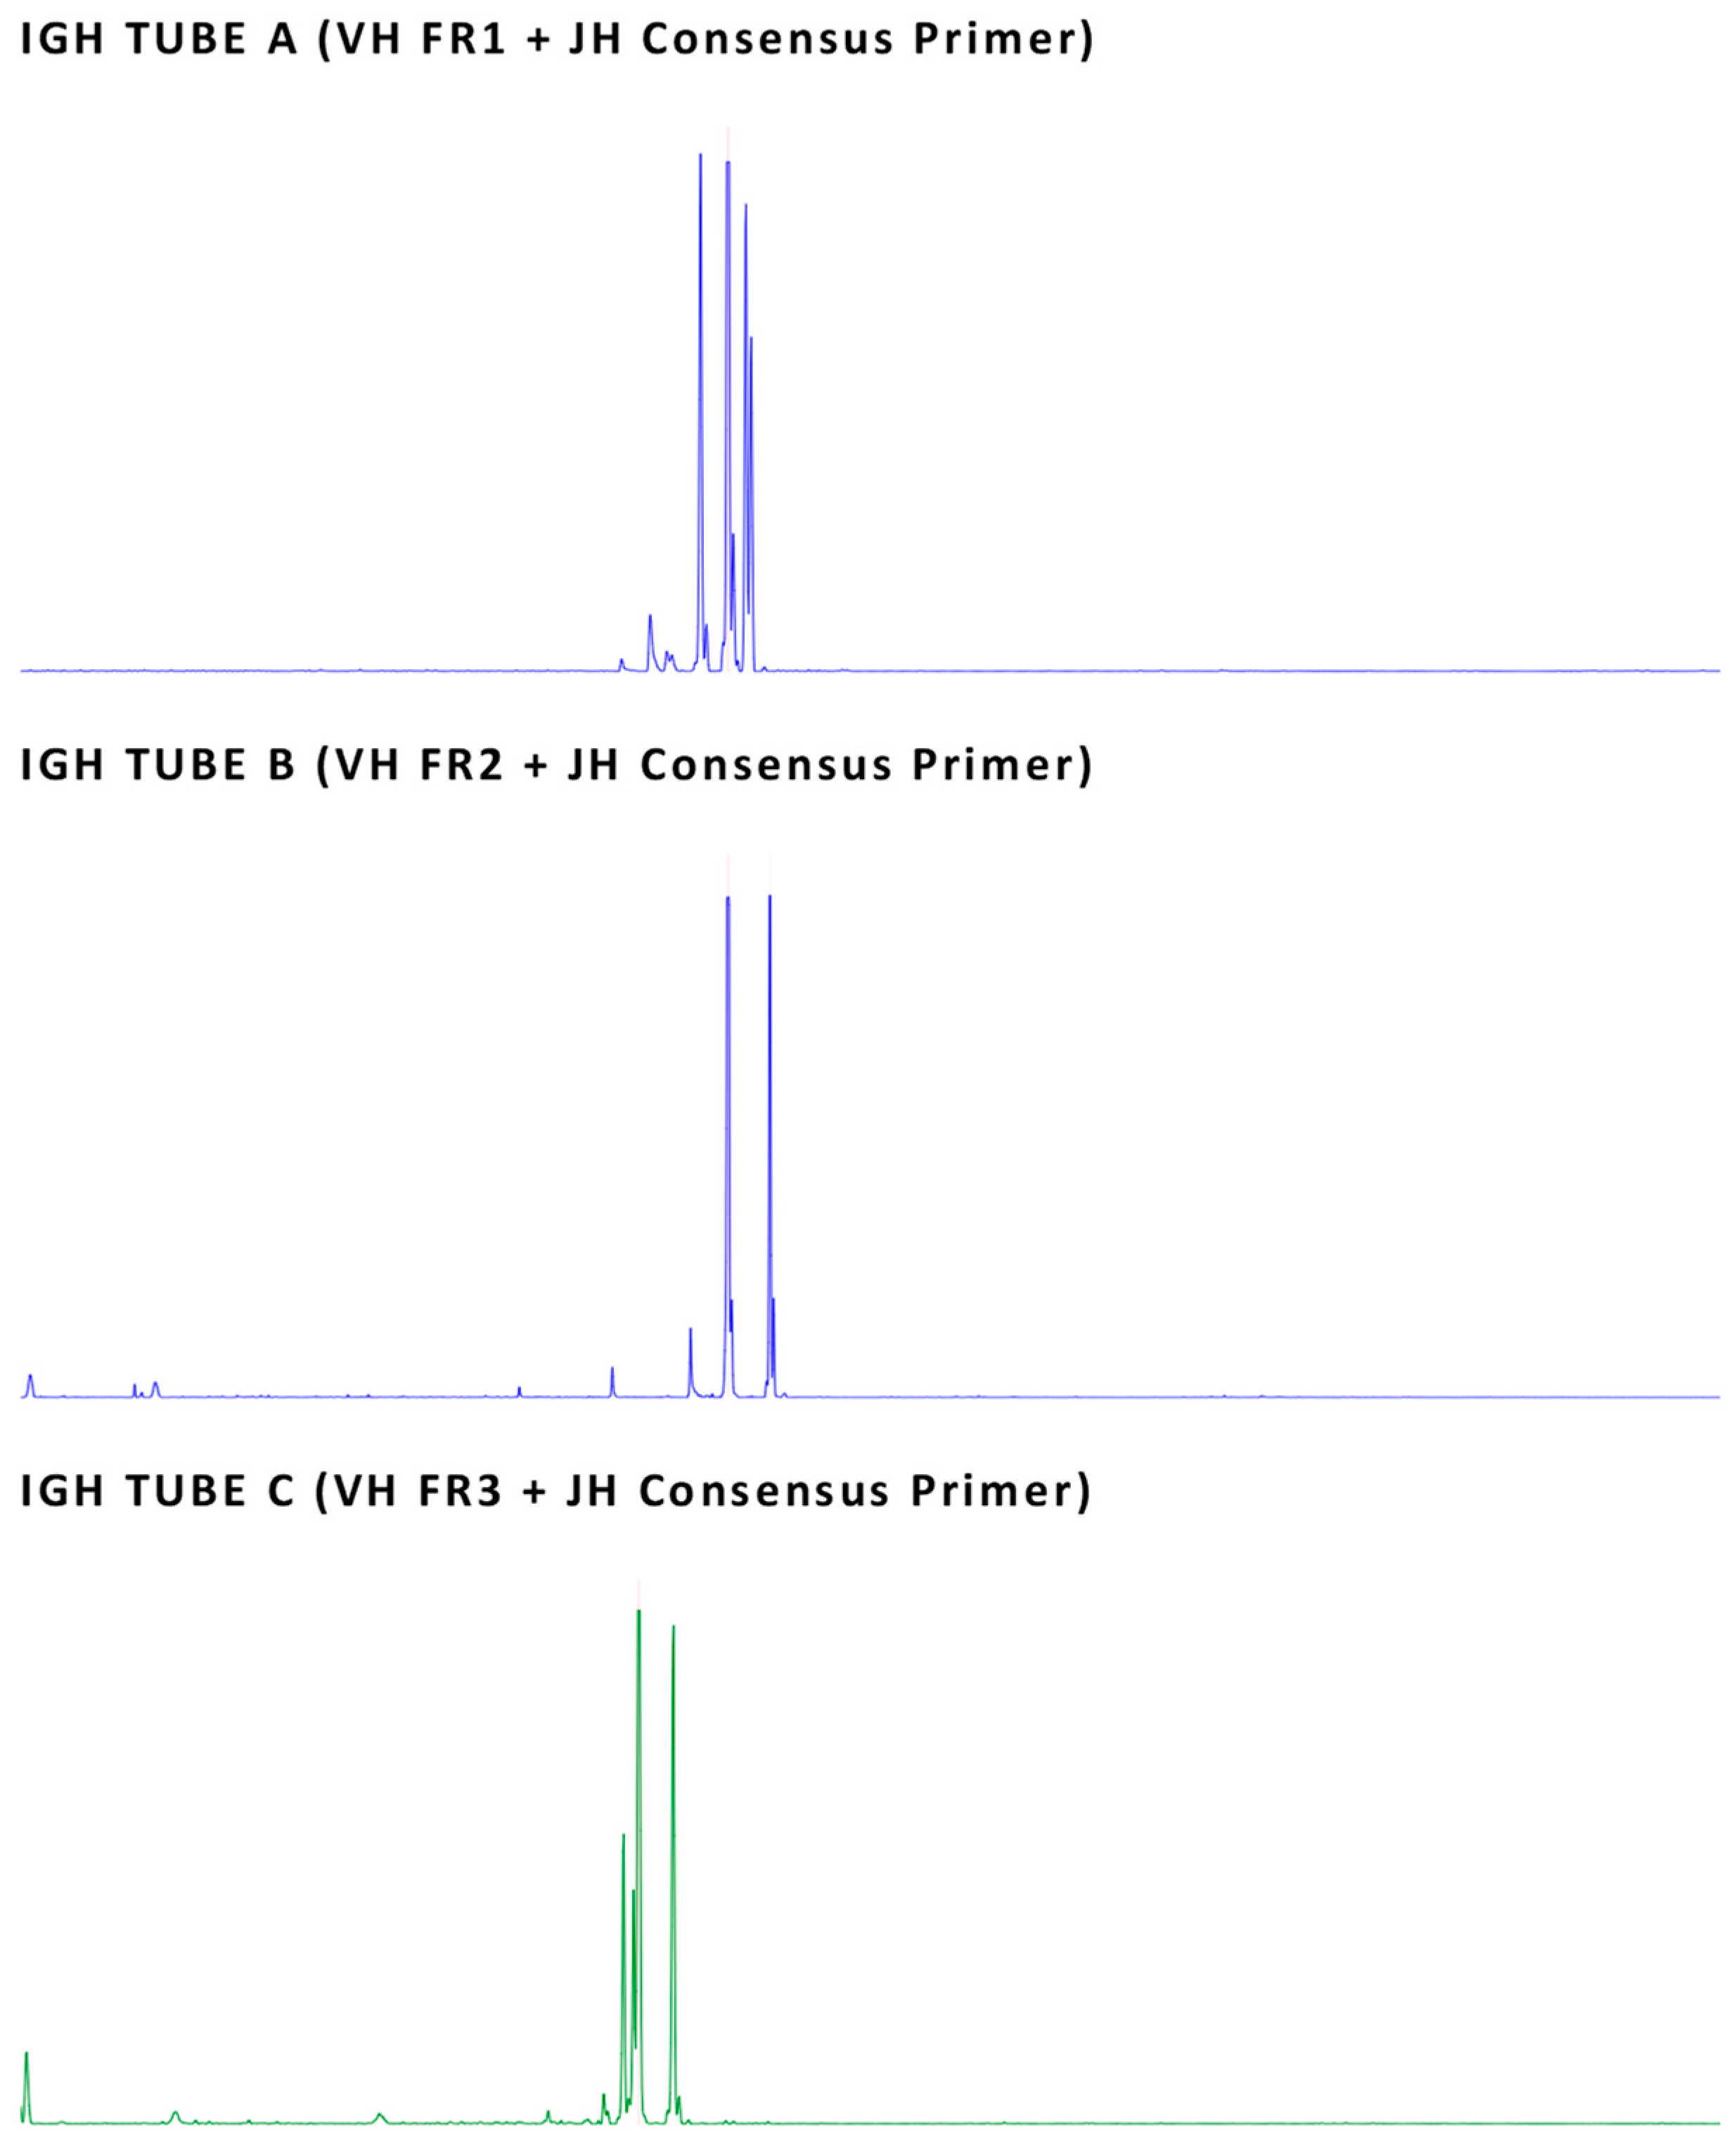
Given the findings in the peripheral blood and the marked B-lymphocytosis in the bone marrow, a clonality study of the B cells in the bone marrow sample was deemed appropriate, assessing immunoglobulin heavy-chain gene rearrangements using FR1, FR2, and FR3 primers. DNA was isolated from the patient’s bone marrow aspirate (Maxwell RSC Promega, Madison, WI, USA), followed by PCR for IGH heavy-chain gene rearrangements (IGH-FR1, FR2, FR3) (CE IVD kit IdentiClone IGH Gene Clonality Assay/Invivoscribe, San Diego/Carlsbad, CA, USA). Capillary electrophoresis of the products on the SeqStudio Genetic Analyzer platform (Thermo Fisher Scientific, Waltham, MA, USA) demonstrated the presence of three B-cell clones, leading to the final diagnosis of three CD5-CD10- B-NHL clones (Figure 5).
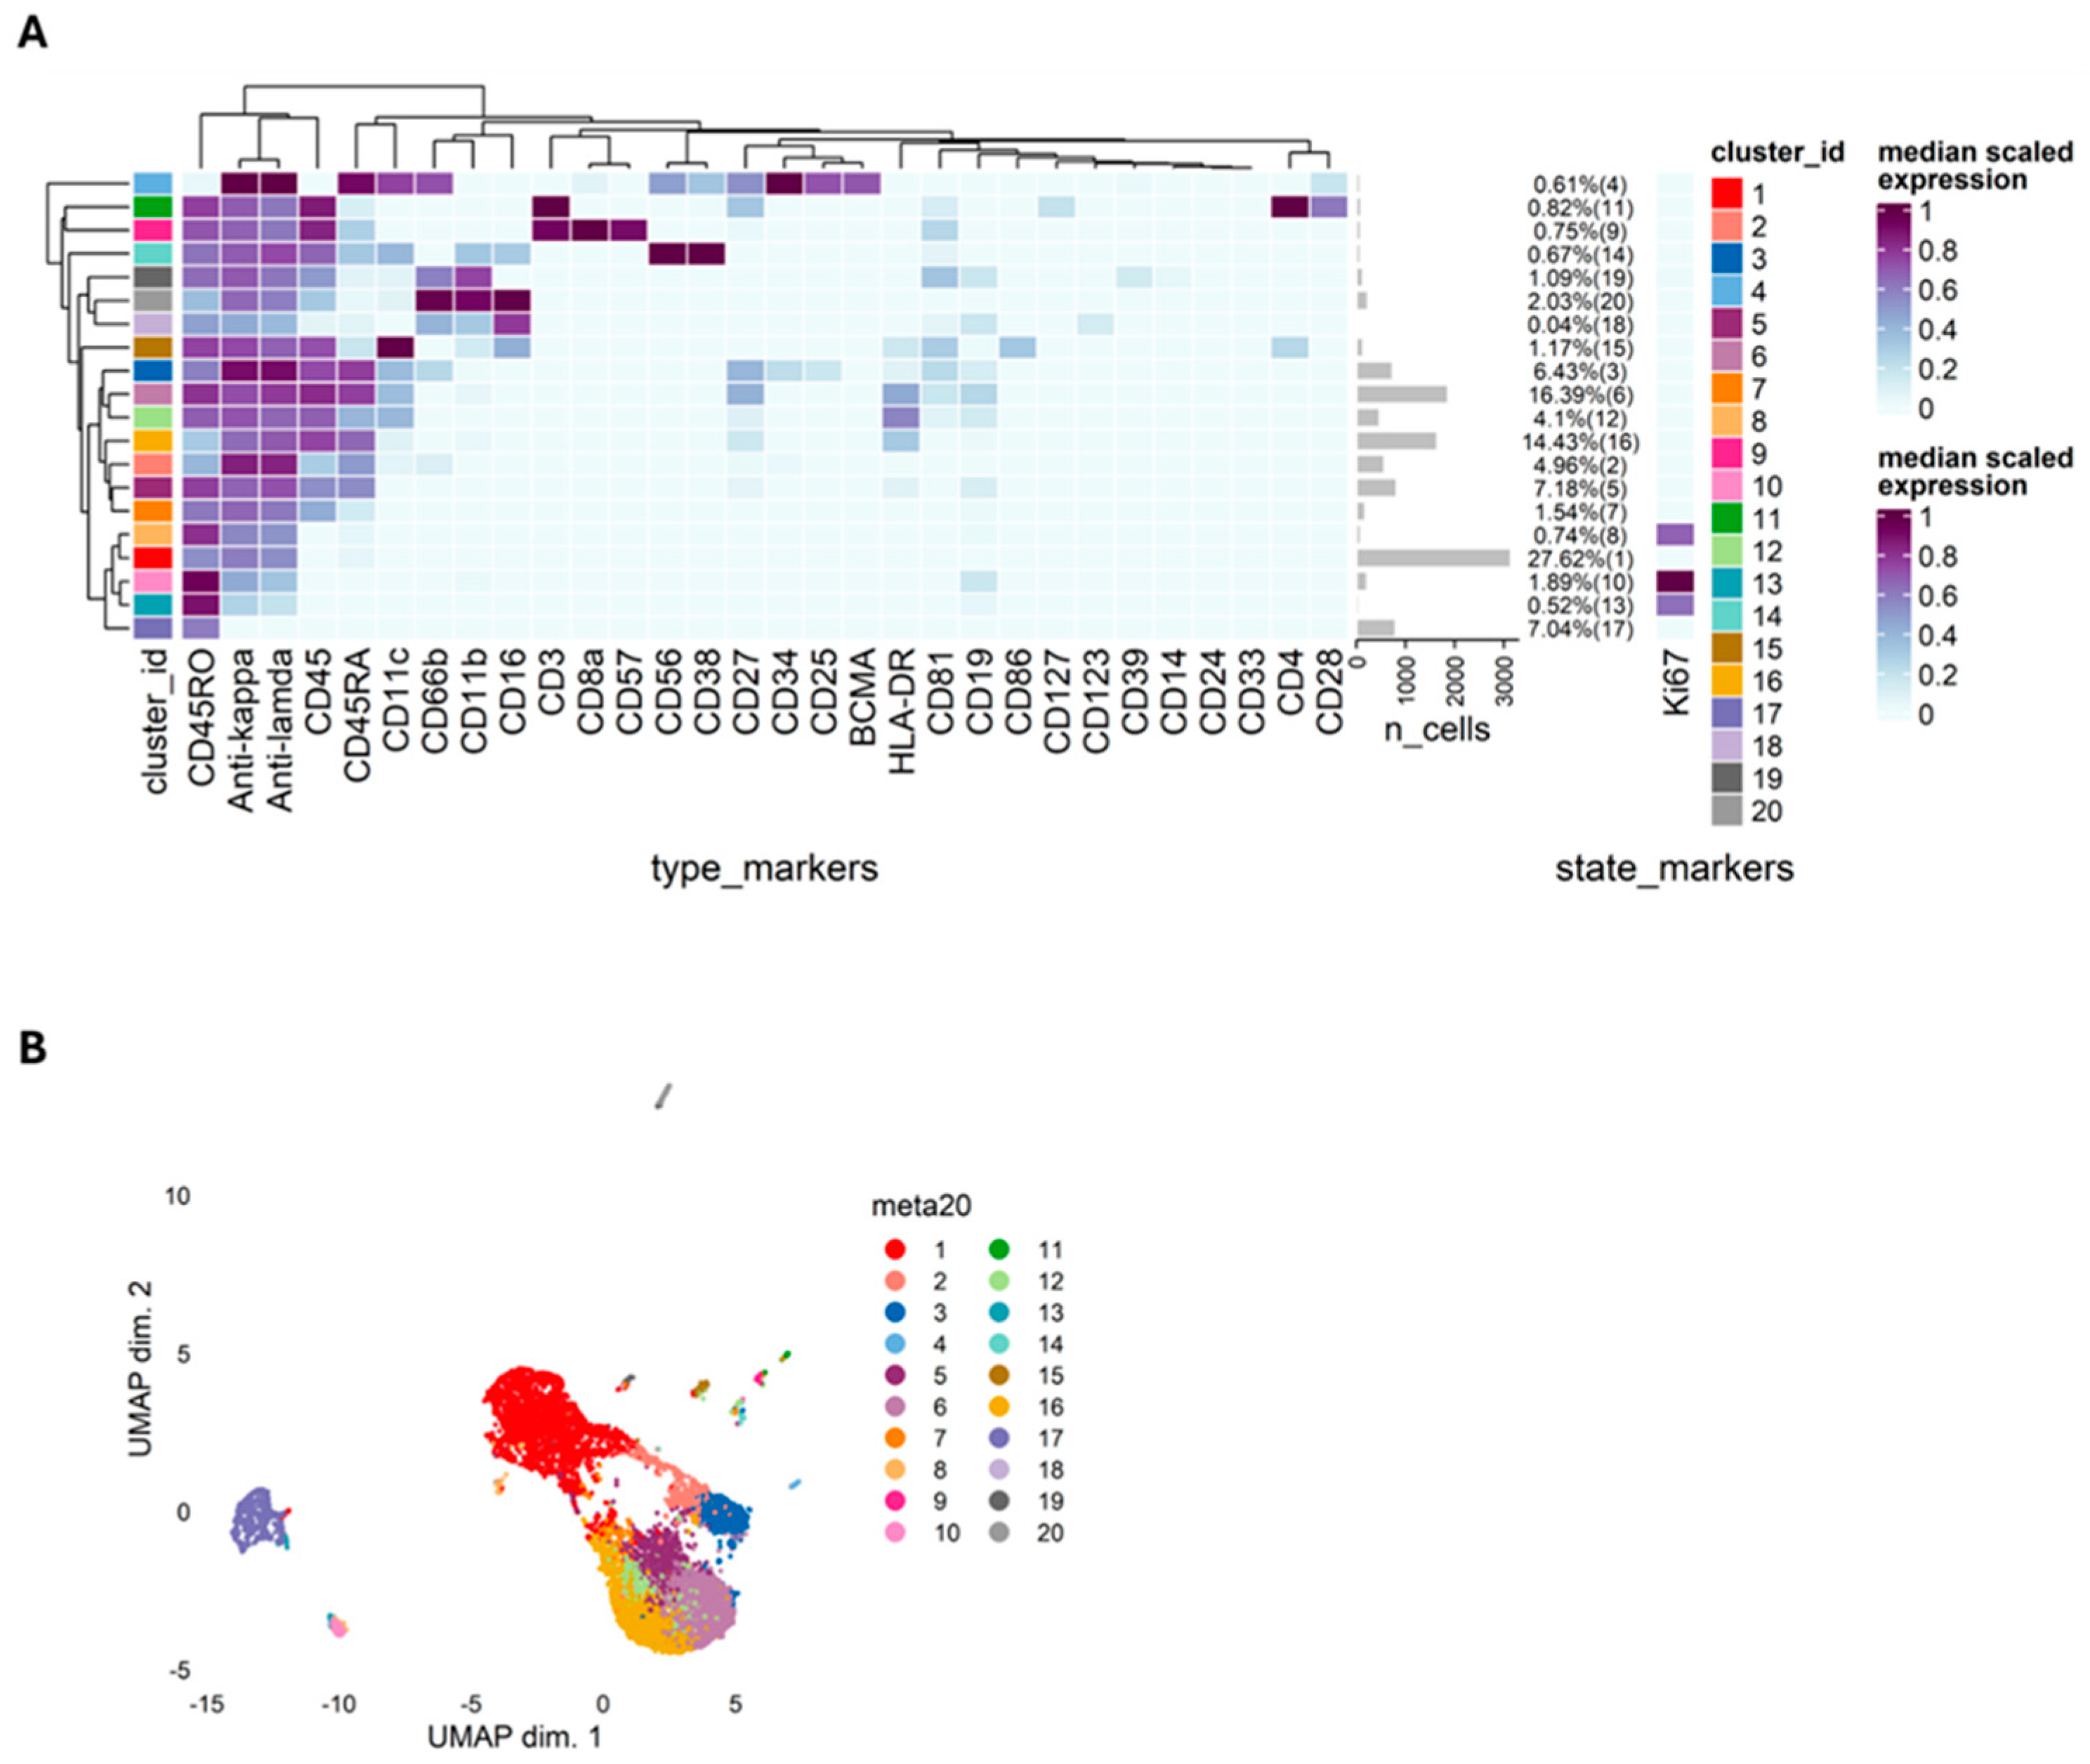
Subsequently, in order to further investigate the case, deep immunophenotyping of the bone marrow sample was performed using Mass Cytometry. Initially, a broad panel of myeloid, B- and T-cell markers was applied. Bone marrow cells were profiled using a 31-marker mass cytometry panel encompassing lineage-defining, maturation, and activation markers. The panel included markers for B cells (CD19, CD24, CD27, CD38, BCMA, κ/λ), T cells (CD3, CD4, CD8, CD28, CD45RA/RO), NK (Natural Killer) cells (CD16, CD56, CD57), and myeloid/progenitor populations (CD14, CD11b, CD11c, CD33, CD66b, CD123, CD34), along with functional markers including HLA-DR, CD25, CD39, CD81, CD86, CD127, and Ki-67. Computational analysis was performed in R using the diffcyt workflow, including FlowSOM-based clustering and Uniform Manifold Approximation and Projection (UMAP) for dimensionality reduction. Examination of the resulting heatmap revealed that, within the total bone marrow cell population, seven (7) dominant clusters were present, characterized by cytoplasmic expression of κ and λ light chains, THE absence of CD34 and CD38 expression, and heterogeneity in the expression of CD45, CD19 and HLA-DR (Clusters 1, 6, 16, 5, 17, 3, and 2, Figure 6), demonstrating the prominent presence of mature B-cell lineage cells.
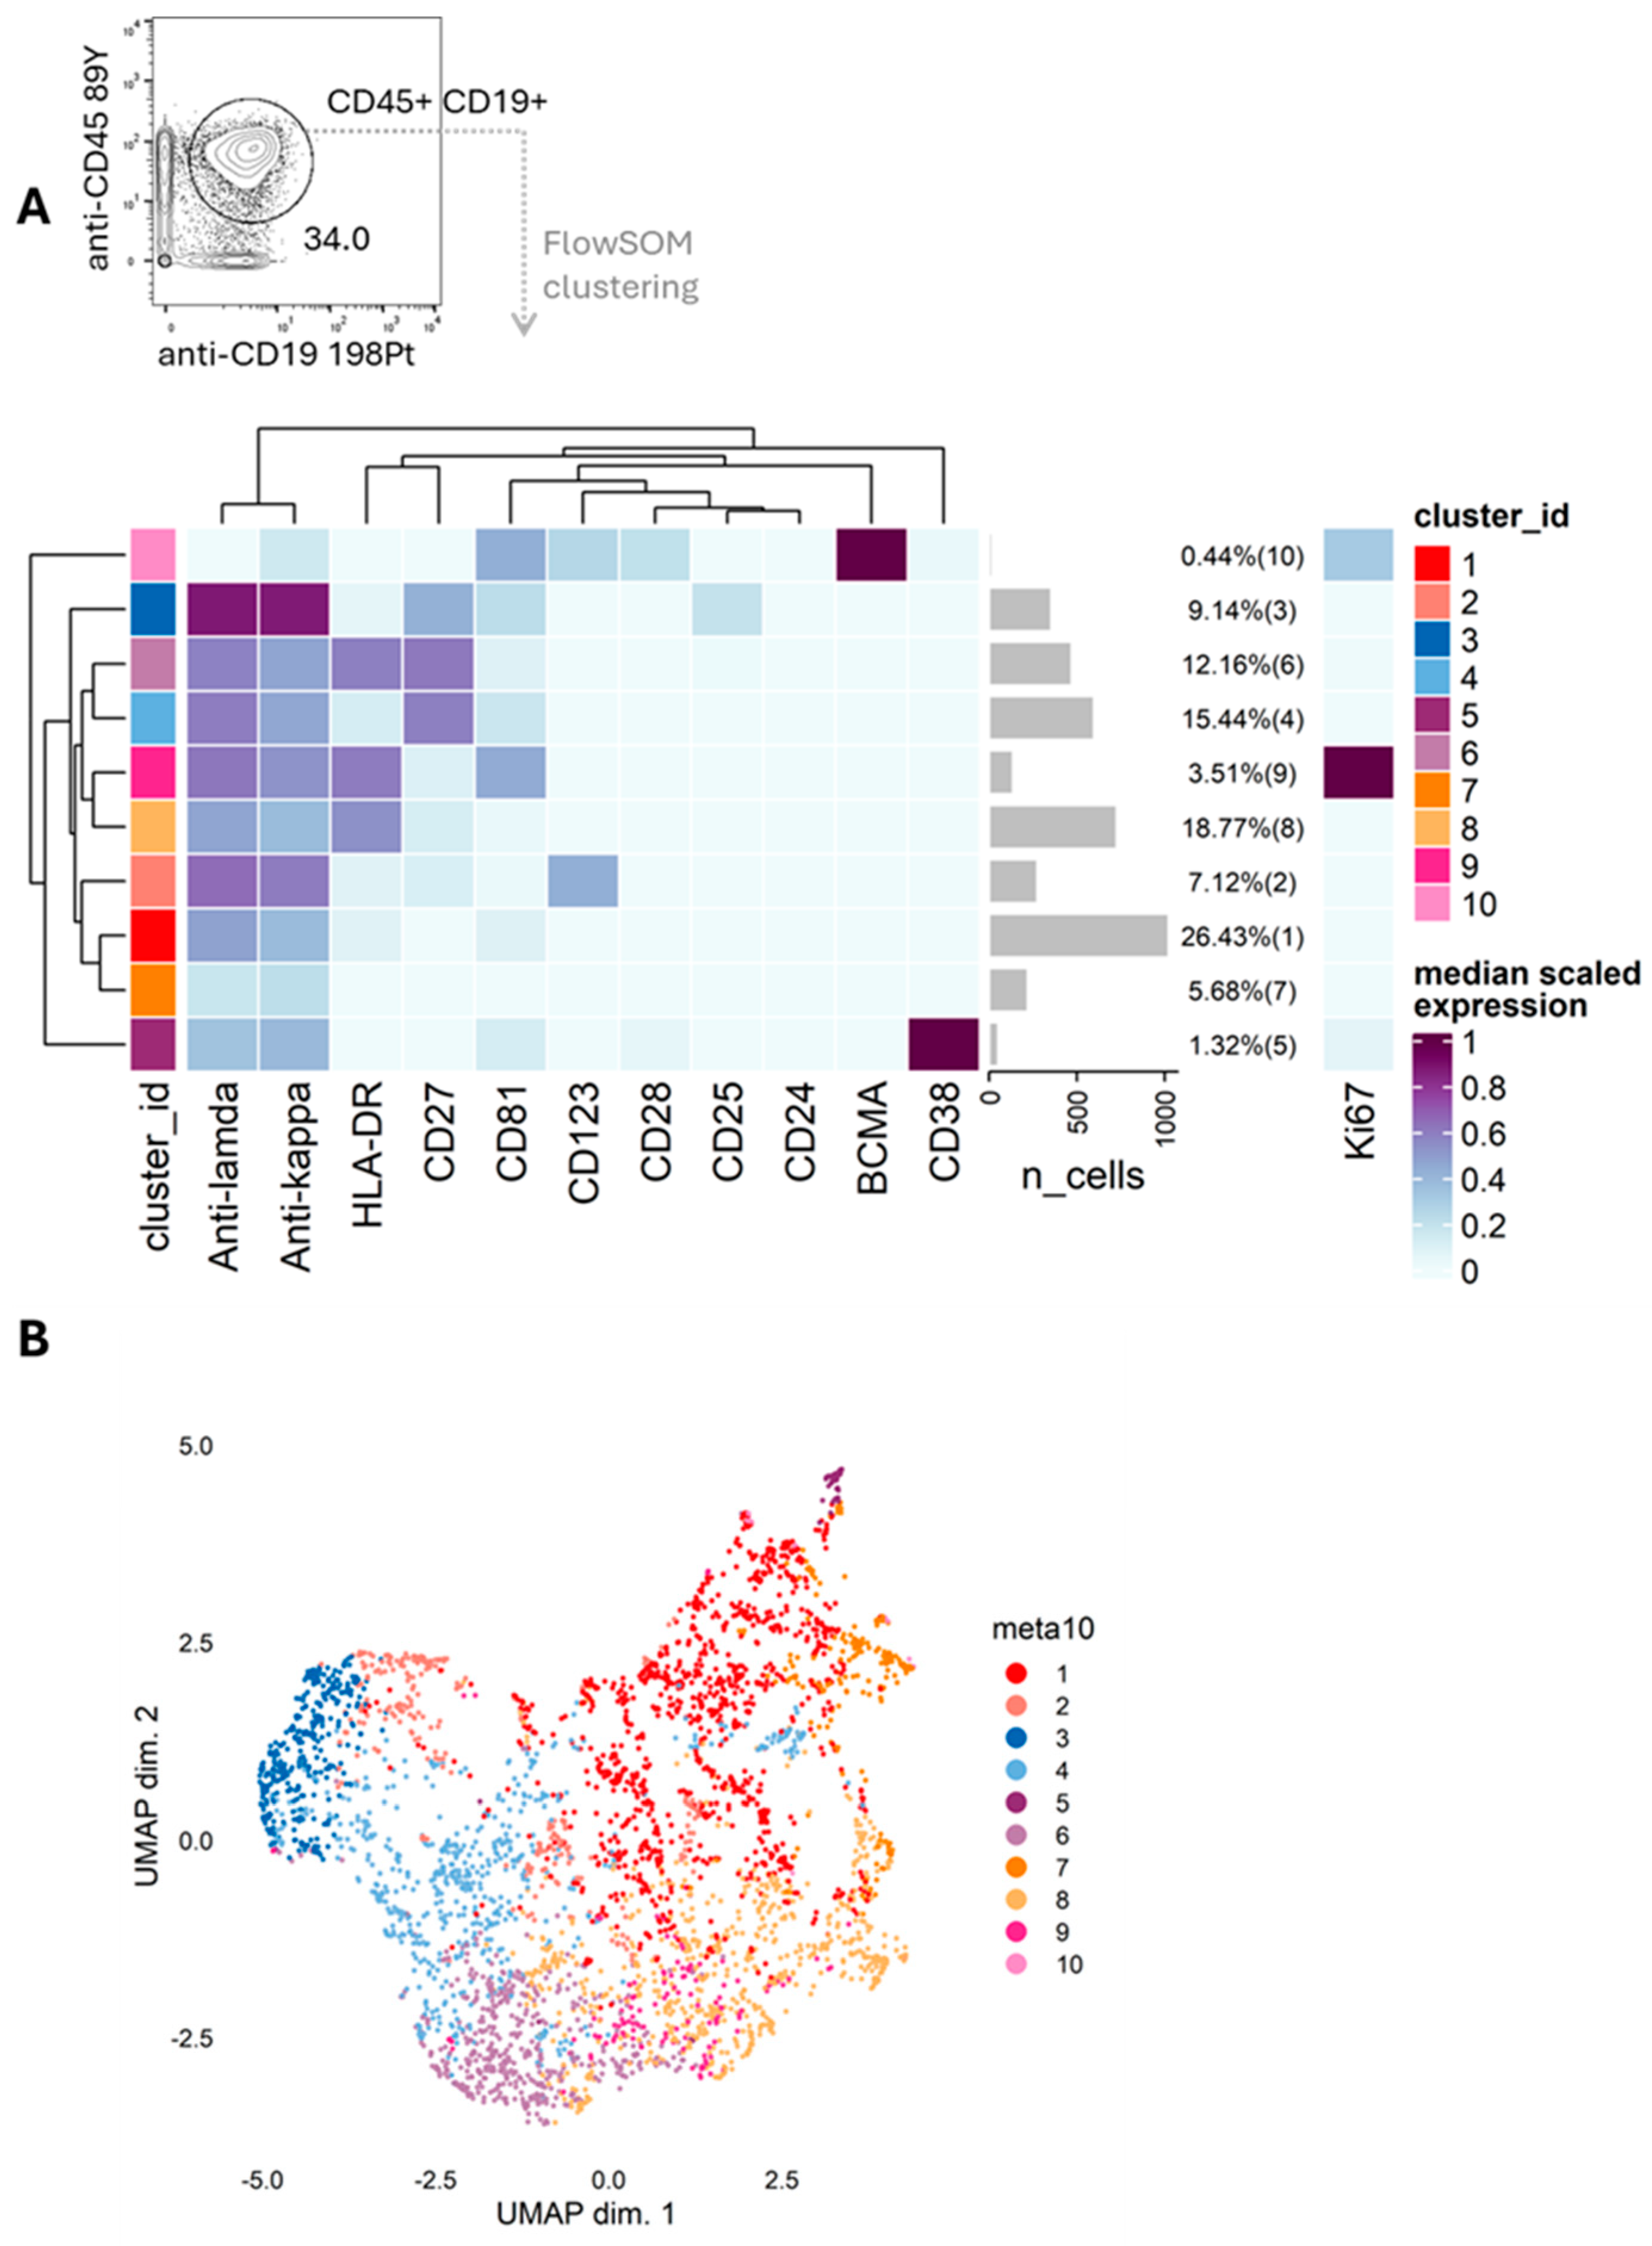
A second clustering analysis (FlowSOM) was then performed, this time restricting the target population to CD45+CD19+ cells of the bone marrow aspirate and focusing on B-cell markers (KAPPA, LAMBDA, HLA-DR, CD27, CD81, CD123, CD28, CD25, CD24, BCMA, CD38, and Ki67). Analysis of the resulting heatmap demonstrated four (4) dominant clusters within the total bone marrow cell population, all expressing cyKAPPA and cyLAMBDA, and additionally characterized as follows:
HLA-DRdimCD38-CD81dim/-CD27-, HLA-DRdimCD38-CD81-CD27dim, HLA-DR-CD38-CD81dimCD27+, HLA-DR+CD38-CD81-CD27+. These four B-cell subpopulations corresponded immunophenotypically to pathological B-cell subsets with low mitotic activity (Ki67 dim/-) (Clusters 1, 8, 4, and 6, Figure 7).

3. Discussion

Despite the continuous expansion of diagnostic capabilities in flow cytometry, particularly within hematology, its interpretative power remains inherently dependent on context. The increasing availability of large antibody panels, multicolor combinations, and the emerging development of spectral flow cytometry have significantly enhanced the sensitivity and resolution of immunophenotypic analysis [5]. These advances allow for a more precise delineation of hematopoietic populations, improved detection of aberrant antigen expression, and more refined identification of clonal B- and T-cell populations [6].
However, this case clearly illustrates that flow cytometry, despite its sophistication, is not a panacea and should not be regarded as a standalone or “global” diagnostic modality. Rather, it represents a highly powerful but targeted analytical tool whose performance is fundamentally shaped by the pre-analytical clinical context, panel design, and gating strategy. Without appropriate clinical correlation, even high-dimensional immunophenotypic data may yield incomplete, ambiguous, or potentially misleading interpretations.
In our case, despite the marked presence of B cells in peripheral blood, flow cytometry was unable to document a clonal B-cell population in the blood (a distinct B cell population with a κ/λ ratio > 10 or <0.1). Immunophenotypically, the B cells were CD5- and CD10- and polytypic based on surface light chain expression, which could be compatible with PPBL. Molecular studies revealed two clonal B-cell populations. In the bone marrow, flow cytometry demonstrated a strong presence of mature B cells and identified a λ-restricted clonal B-cell population with differential expression of the B-cell markers CD79b and CD22, as well as ectopic expression of CD11c compared with the remaining B cells, in which a clear predominance of λ surface light-chain expression was observed. Despite the panels of monoclonal antibodies used for the immunophenotyping study of the bone marrow sample were not identical to those used for the blood sample (the bone marrow sample was analyzed approximately one year later), the basic markers studied were almost the same (CD5, CD10, CD20, CD23, CD103, CD11c, CD25, CD200, CD79b, ROR1, CD81, CD43 in common; CD22, CD180 were additionally evaluated in the bone marrow). The difference in the selection of MoAbs combinations between the blood and bone marrow was that, in the bone marrow, we tried to include κ and λ in each combination in order to isolate a light-chain- restricted B-cell subpopulation.
Comparing blood and bone marrow analysis, there was no loss, ectopic, or asynchronous antigen expression in B cells in the blood (the B cells were CD5-CD10-CD11c-) and the B-cell population showed a uniform, yet heterogeneous, antigen expression overall. On the other hand, a distinct population of CD79b+CD22+CD11c+ B cells was found in the bone marrow, expressing λ surface light chain, demonstrating the presence of CD5-CD10- B-NHL, while the remaining B cells expressed predominantly the λ surface light chain. Immunophenotypically, the CD5-CD10- B-NHL clone could not be further classified. Molecular analysis of the bone marrow sample identified three clonal B-cell populations, while mass cytometry demonstrated the presence of four major B-cell populations with an abnormal immunophenotype.
Discrepancies in the immunophenotype of CD5-CD10- B-NHL between the blood and bone marrow are occasionally observed. Unfortunately, the PCR products were not analyzed with the same method in the blood and bone marrow (polyacrylamide gel electrophoresis vs. capillary electrophoresis). As a result, a direct comparison of B-cell clones between the blood and bone marrow is not feasible.
Unlike other published cases [7], in our case, only one clone of CD5-CD10- B-NHL was finally isolated immunophenotypically by flow cytometry in the bone marrow. This clone expressed the same surface light chain as the remaining B cells with the same level of expression. The remaining B cells demonstrated light-chain predominance.
The diagnosis of PPBL was included in the differential diagnosis, especially in the blood, since the B cells were found to be polytypic [8]. However, diagnosing PPBL in the case of an elderly male with excessive B-cell lymphocytosis (approximately 20 × 109/L), merely based on immunophenotyping by flow cytometry would be, in our opinion, questionable and unreliable.
Accurate diagnostic evaluation therefore requires a strict integration of clinical presentation, hematological parameters, morphological assessment, and complementary laboratory findings. Such integration is essential not only for guiding the selection of the most appropriate antibody panels but also for optimizing gating strategies and ensuring that rare or atypical populations are not overlooked. In this sense, flow cytometry should be viewed as a hypothesis-driven technique rather than an isolated diagnostic endpoint [9]. Furthermore, cases with persistent clinical suspicion but inconclusive or discordant immunophenotypic results highlight the limitations of relying solely on flow cytometry. In such scenarios, additional specialized diagnostic approaches, including molecular assays (e.g., IGH rearrangement studies), cytogenetics, bone marrow histopathology, and emerging high-dimensional techniques such as mass cytometry, become essential for achieving diagnostic resolution. These complementary methodologies provide orthogonal validation and can uncover clonal or subclonal populations that may not be fully resolved by conventional flow cytometry alone [2].
Ultimately, this case underscores the necessity of a multimodal diagnostic strategy in hematologic evaluation. Flow cytometry remains a cornerstone of modern hematopathology, but its highest diagnostic yield is achieved only when interpreted within a comprehensive clinical and laboratory framework. Such an integrated approach ensures not only diagnostic accuracy but also appropriate risk stratification, prognostic assessment, and optimal patient management.


4. Conclusions

In conclusion, this case illustrates that flow cytometry should be regarded as a powerful but context-dependent diagnostic tool rather than a definitive standalone method. Optimal diagnostic accuracy in complex lymphoproliferative disorders is achieved only through a comprehensive correlation of clinical, morphological, immunophenotypic, and molecular data.

Author Contributions

Conceptualization, G.B.; methodology, G.B., I.A., M.V., M.R., E.K., A.P. (Andriana Panoutsou), G.G., N.P. and E.E.; software, G.B., I.A., M.V., M.R., E.K., A.P. (Andriana Panoutsou), G.G., N.P. and E.E.; validation, G.B.; formal analysis, G.B.; investigation, G.B., A.P. (Athanasios Papatheodorou). A.D. and E.P.; resources, I.A.; data curation, G.B., I.A., M.V., M.R., E.K., A.P. (Andriana Panoutsou), G.G., N.P. and E.E.; writing—original draft preparation, G.B.; writing—review and editing, G.B., K.A. and E.K.; supervision, I.A. and E.P.; project administration, G.B. All authors have read and agreed to the published version of the manuscript.

Funding

This research received no external funding.

Institutional Review Board Statement

The investigations were conducted in accordance with the principles outlined in the Declaration of Helsinki (1975, revised in 2013). Ethical approval was not required for this study in accordance with local/national guidelines.

Informed Consent Statement

Informed consent was obtained from all subjects involved in the study.

Data Availability Statement

Supporting data is available upon reasonable request to the corresponding author.

Conflicts of Interest

Author Georgios Georgiou was employed by the company Unilabs. The remaining authors declare that the research was conducted in the absence of any commercial or financial relationships that could be construed as a potential conflict of interest.

Abbreviations

The following abbreviations are used in this manuscript:
ALCAbsolute Lymphocyte Count
CLLChronic Lymphocytic Leukemia
FITCFluorescein Isothiocyanate
IGHImmunoglobulin Heavy Chain
NKNatural Killer (cells)
PCRPolymerase Chain Reaction
PPBLPersistent Polyclonal B-cell Lymphocytosis
SLWStain–Lyse–Wash
UMAPUniform Manifold Approximation and Projection

References

  1. Rawstron, A.C.; Kreuzer, K.A.; Soosapilla, A.; Spacek, M.; Stehlikova, O.; Gambell, P.; McIver-Brown, N.; Villamor, N.; Psarra, K.; Arroz, M.; et al. Reproducible diagnosis of chronic lymphocytic leukemia by flow cytometry: An European Research Initiative on CLL (ERIC) & European Society for Clinical Cell Analysis (ESCCA) Harmonisation project. Cytom. B Clin. Cytom. 2018, 94, 121–128. [Google Scholar] [CrossRef] [Scilit] [PubMed]
  2. Gajzer, D.C.; Fromm, J.R. Flow Cytometry for B-Cell Non-Hodgkin and Hodgkin Lymphomas. Cancers 2025, 17, 814. [Google Scholar] [CrossRef] [Scilit] [PubMed]
  3. Fang, H.; Wang, S.A.; Medeiros, L.J.; Wang, W. Application of flow cytometry immunophenotypic analysis for the diagnosis of mature B-cell lymphomas/leukemias. Hum. Pathol. 2025, 156, 105711. [Google Scholar] [CrossRef] [Scilit] [PubMed]
  4. Alaggio, R.; Amador, C.; Anagnostopoulos, I.; Attygalle, A.D.; Araujo, I.B.O.; Berti, E.; Bhagat, G.; Borges, A.M.; Boyer, D.; Calaminici, M.; et al. The 5th edition of the World Health Organization Classification of Haematolymphoid Tumours: Lymphoid Neoplasms. Leukemia 2022, 36, 1720–1748. [Google Scholar] [CrossRef] [Scilit] [PubMed]
  5. Cossarizza, A.; Chang, H.D.; Radbruch, A.; Abrignani, S.; Addo, R.; Akdis, M.; Andrä, I.; Andreata, F.; Annunziato, F.; Arranz, E.; et al. Guidelines for the use of flow cytometry and cell sorting in immunological studies (third edition). Eur. J. Immunol. 2021, 51, 2708–3145. [Google Scholar] [CrossRef] [Scilit] [PubMed]
  6. Hartzell, C.M.; Shaver, A.C.; Mason, E.F. Flow Cytometric Assessment of Malignant Hematologic Disorders. Clin. Lab. Med. 2024, 44, 465–477. [Google Scholar] [CrossRef] [Scilit] [PubMed]
  7. Ibrahim, F.A.; Soliman, D.S.; Kohla, S.A.; Battah, A.H.A.L.; El Ajez, S.H.; Rahhal, S.A.; Akiki, S.; Eldean, M.S. Mature B-Cell Neoplasms with Immunophenotypically Distinct Dual B-Cell Clones: A Case Series. Ann. Case Rep. 2023, 8, 1194. [Google Scholar] [CrossRef] [Scilit]
  8. Marcondes, N.A.; Schneider, L.; Spindler, B.M.; Fernandes, F.B.; Faulhaber, G.A.M. Polyclonal B-cell lymphocytosis: Report of three cases. Cytom. B Clin. Cytom. 2018, 94, 953–955. [Google Scholar]
  9. Holl, E.; Kapinsky, M.; Larbi, A. An Update on Flow Cytometry Analysis of Hematological Malignancies: Focus on Standardization. Cancers 2025, 17, 2045. [Google Scholar] [CrossRef] [Scilit] [PubMed]
Figure 1. Peripheral blood smear (100×). A relatively monomorphic lymphocytic population is observed without the presence of smudge cells (May–Grünwald Giemsa (MGG)).
Hemato 07 00022 g001
Figure 2. Peripheral blood flow cytometry data analysis. Polytypic mature B cells demonstrate heterogeneous antigen expression, without evidence of antigen loss, ectopic expression, or asynchronous expression patterns (grey: CD45+, burgundy: lymphocytes, green: CD19+).
Hemato 07 00022 g002
Figure 3. Polyacrylamide gel electrophoresis analysis of PCR products obtained from peripheral blood. Lane 1: ΦX174 DNA–HaeIII digest molecular weight marker. Lane 2: Positive control (B-cell line, PC). Lane 5: Patient sample (Pt), showing two distinct DNA bands of different molecular sizes. Lane 6: Negative control (NC).
Hemato 07 00022 g003
Figure 4. Bone marrow flow cytometry data analysis. A monotypic (lambda light-chain–restricted) discrete population of mature B cells is identified, showing stronger expression of CD79b, CD22, and CD11c (blue color) compared with the background polytypic B-cell population (green color).
Hemato 07 00022 g004
Figure 5. VDJ rearrangement fragment analysis (bone marrow). Tube A demonstrates three clonal VDJ rearrangements (325/330/334 bp), Tube B shows two clonal VDJ rearrangements (260/273 bp), and Tube C reveals three clonal VDJ rearrangements (126/129/135 bp).
Hemato 07 00022 g005
Figure 6. High-dimensional immunophenotyping of bone marrow by mass cytometry. (A) Heatmap displaying the scaled median expression of immune surface markers across 20 cell clusters (1–20), identified through hierarchical clustering. Each row represents a cluster and each column a marker. The bar graph on the right indicates the proportion of total bone marrow cells represented by each cluster. (B) UMAP plot showing individual cells colored by cluster identity.
Hemato 07 00022 g006
Figure 7. Deep immunophenotyping analysis of CD45+CD19+ Bone Marrow Cells with mass cytometry. (A) Gating strategy to select CD45+ CD19+ cells and perform deep immunophenotyping analysis with FlowSOM clustering. Heatmap displaying the scaled median expression of immune surface markers across 10 cell clusters (1–10), identified through hierarchical clustering. Each row represents a cluster and each column a marker. The bar graph on the right indicates the proportion of CD45+CD19+ bone marrow cells represented by each cluster. (B) UMAP plot showing individual cells colored by cluster identity.
Hemato 07 00022 g007
Disclaimer/Publisher’s Note: The statements, opinions and data contained in all publications are solely those of the individual author(s) and contributor(s) and not of MDPI and/or the editor(s). MDPI and/or the editor(s) disclaim responsibility for any injury to people or property resulting from any ideas, methods, instructions or products referred to in the content.