Article

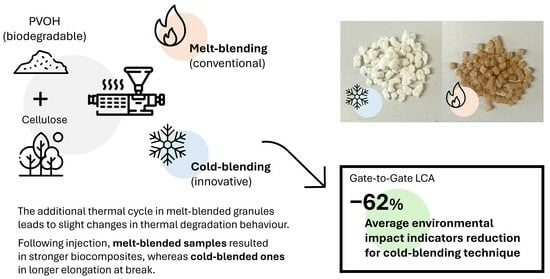
Innovative Cold Processing of PVOH-Based Composites: A Gate-to-Gate Life Cycle Assessment of Environmental Benefits

1
Department of Chemistry, Materials and Chemical Engineering “Giulio Natta”, Politecnico di Milano, Piazza Leonardo Da Vinci, 32, 20133 Milan, Italy
2
NextMaterials S.r.L., Via Turati 40, 20121 Milan, Italy
3
National Interuniversity Consortium of Materials Science and Technology, Via G. Giusti, 9, 50121 Firenze, Italy
*
Author to whom correspondence should be addressed.
Macromol 2025, 5(3), 30; https://doi.org/10.3390/macromol5030030
Submission received: 17 May 2025 / Revised: 3 June 2025 / Accepted: 1 July 2025 / Published: 3 July 2025

Abstract

Conventional thermoplastic polymer composites are produced using energy-intensive equipment. From an environmental perspective, reducing energy and material consumption, as well as selecting polymers and fillers that biodegrade without harmful consequences for the environment, is considered good practice. In this work, polyvinyl alcohol (PVOH), a biodegradable and water-soluble polymer, was compounded with 30 w%, 40 µm long cellulose fibres. Conventional melt blending production and innovative cold processing were compared from a tensile testing, thermogravimetric, and life cycle assessment (LCA) perspective through primary data collection. The granule production process significantly affects the mechanical performance of injected samples, with a 23.4% drop in tensile strength and an increase of 67.9% in elongation at break. The thermogravimetric analysis reported slight differences due to an additional thermal process involved in the melt blending of PVOH. From an LCA perspective, the innovative cold blending of PVOH-based composites drops all environmental indicators by 58–92%, maximizing the reduction of the “Water use” indicator. The most impactful production phase in the analysed production processes was drying, accounting for 46% and 85% of the conventional melt blending and innovative cold-blending processes, respectively.

Graphical Abstract

1. Introduction

The current production model is still mainly linear, with circular approaches representing less than 10% of the total, and has continued to decline in recent years [1]. Industry and consumers are required to make responsible choices that aim to maximize the sustainability of their actions, thereby minimizing the negative impacts on the environment, economy, and society, which represent the three pillars of sustainability [2,3].
Packaging is crucial for our economy since it can contain, protect, extend shelf life, and convey information about packaged goods. Fibre-based and polymeric packaging represent an industry that produces a turnover of a few hundred billion euros in Europe alone; moreover, fibre-based and polymeric packaging constitute around 60% of the total packaging waste, i.e., 34 and 16.1 Mt in 2022, respectively [4]. In particular, polymeric packaging is under the spotlight due to the accumulation of microplastics originating from petroleum-based polymers in soil, water, and the atmosphere [5,6,7,8]. Therefore, much research has focused on the development and use of so-called biopolymers, i.e., polymers obtained from renewable resources, biodegradable, and/or compostable when reaching their end-of-life [9]; the definition also includes petroleum-based polymers that biodegrade. Among others, previous studies investigated the use of polylactic acid [10,11], polyhydroxyalkanoates [12,13,14], polycaprolactone [13,15,16], polybutylene succinate [11,12], and polyvinyl alcohol (PVOH) [17,18,19] as packaging materials for renewable feedstock or the ability to biodegrade [20].
To further improve the sustainability of the materials, many studies have developed polymeric matrix composites (PMCs) using cellulose fibres as fillers, possibly derived from waste sources [10,21,22,23,24]. Cellulose is a natural polymer that is broadly available in nature as the main constituent of plants. Fibres used as fillers can milden the material cost, providing improved strength and stiffness, but reduced elongation at break and toughness [10,25,26].
Some materials based on biopolymers with suitable mechanical strength, better environmental compatibility, and reasonable cost compared to conventional polymers are already on the market. The actual benefits of using certain polymers or fillers should be determined through specific evaluation, as is done in life cycle assessment (LCA). Its principles and framework are defined in the ISO 14040 standard [27]. After setting a functional unit and proper system boundaries, a standardized methodology provides the evaluation of multiple impact categories such as energy use, global warming, acidification, eutrophication, etc. The application of LCA to PMCs is not yet a consolidated practice, requiring proper indications [28]. To achieve a comprehensive evaluation of product performances, and thus to obtain a life cycle sustainability assessment, it is necessary to combine the LCA with a social life cycle assessment and life cycle costing, assessing social and economic burdens, respectively.
Indeed, the reliability of LCA results strongly depends on data quality [28]; besides being a preferable option, primary data is not always available, making the use of databases necessary [29,30,31]. This is more common especially if, e.g., the production scale is very limited, materials are retrieved from third parties, industrial processing equipment is not available, or the aim is to consider a cradle-to-cradle assessment.
Previous studies have shown that polymeric matrix composites filled with cellulosic fillers help lower the overall environmental impact of the outcomes [32,33,34]. The main processes that combine and disperse natural fibres into thermoplastic polymeric matrixes typically involve heat, e.g., melt blending or compression moulding. Focusing on the former process, typical filler content reaches 30–40 w% [35,36], with some studies pushing it to 50 w% [17,26]. Considering biopolymers for packaging applications, PVOH represents an interesting candidate due to its oxygen barrier properties and hydrophilicity [37]. The soluble nature of PVOH opens a possible alternative processing path: the cold (i.e., room temperature) production of fibre-filled PVOH granules, which reduces the energy input of the blending process. Previous literature has highlighted that the energetic input provided into the production system and the sources used to produce it play a key role in the environmental impact outcomes. In particular, Baniasadi et al. [38] reported that the energetic input in the process is typically the second most impactful factor after matrix and coupling agent production and transportation. Therefore, reducing the energetic consumption during the production phases can improve the overall environmental impact of biocomposites. Still, the source production of electricity can broadly affect the results [30].
The research aimed to compare two different blending methodologies: one bringing PVOH at temperatures higher than its melting point, i.e., extrusion, and the other at room temperature. The emphasis of the latter is on minimizing energy input during blending to obtain biocomposite granules that provide lower environmental impacts. It is hypothesized that cold processing leads to lower energetic input during blending, which, in turn, leads to a lower environmental impact besides the need for post-blending drying. Subsequently, this work assessed the tensile properties of PVOH-based biocomposites filled with cellulosic fibres and compared the environmental impact of the biocomposite blending at a pilot production scale through LCA based on primary data. The significance of this study lies in its potential to contribute to developing more sustainable water-soluble PMC production.

2. Materials and Methods

An experimental PVOH formulation with hydrolysis degree ranging from 75 to 90%, average molecular weight ranging from 75 to 150 kDa, and a polydispersity index ranging from 2.5 to 4.3 was used as a matrix. The grade is the same as that involved in previous experimentation [17].
Arbocel® BE 600/30 PU cellulose fibres (average length: 40 µm; average thickness: 20 µm; bulk density: 232–248 g/L) were bought from J. Rettenmaier & Söhne GmbH (Rosenberg, Germany). The processed formulations are summarized in Table 1. Regarding the innovative cold-blending process, the water amount to be used was determined in preliminary research in which the authors optimized the trade-off between the biocomposite machinability and the shape-retaining and non-sticking behaviour of the outcoming granules, as described in Section 2.1.2.

2.1. Matrix-Filler Blending

The two investigated blending methods are described in the following sub-sections. The output of each process was 3–5 mm granules that were subsequently oven-dried at 80 °C in a VWR (Leuven, Belgium) VentiLine 120 Prime forced convection oven overnight before injection moulding to achieve a dog-bone specimen for tensile characterization according to ISO 527 [39]. The produced granules were dried, vacuum-sealed, and stored at room temperature.

2.1.1. Conventional Melt Blending

The matrix and filler were oven-dried for 16 h at 80 °C before processing. The matrix and filler were melt-blended in a TSA (Luisago, Italy) FSCM 2140 co-rotating twin extruder (screw diameter: 20 mm; length/diameter ratio: 40). The screws feature two kneading zones between zones 3 and 4, and between zones 5 and 6. The temperature profile is reported in Table 2, and the screw speed was set to 150 rpm. The die matrix (zone 8) featured three circular holes with a diameter of 3 mm. The extruded filaments were then granulated using a Matex Varese (Casciago, Italy) TG.5 granulator. The rotating tool speed was set to 60 rpm. Given the aforementioned parameters, hourly productivity was 1.5 kg/h.

2.1.2. Innovative Cold Blending

PVOH, cellulose fibres, and water were weighed and added to a container, subsequently mounted on a kneading machine, and whisked for 10 min. The humid blend was poured into the cold extruder and forced through a 3 mm circular die matrix, before being cut by a rotating knife to 3 mm long granules. Given the specific processing, the hourly productivity was 4.5 kg/h.
The granules were subsequently dried in the VWR (Leuven, Belgium) VentiLine 120 Prime forced convection oven at 80 °C until dry by monitoring the weight loss at constant timeframes.

2.2. Injection Moulding and Tensile Testing

Type IV dog-bone specimens were injection-moulded using an INVERA (Rakovník, Czech Republic) Intec 250/1110 injection moulder. The processing parameters were the same for both materials and included a barrel temperature of 210 °C, a mould temperature of 80 °C and an injection pressure of 16 MPa.
To investigate the potential effect of processing on mechanical performance, the dog-bone specimens were tensile tested using a Shimadzu (Kyoto, Japan) Autograph AGS-X dynamometer with a 10 kN load cell according to ASTM D638-14 [40]. The testing speed was set to 50 mm/min. Tensile strength (in MPa) was determined by dividing the maximum measured force (in N) by the nominal cross-sectional area in the gauge length (in mm2). Young’s modulus was determined after toe correction of the zero-strain point, as defined in ASTM D638-14. Finally, the elongation at break was determined as the elongation (%) when the test specimen undergoes rupture.

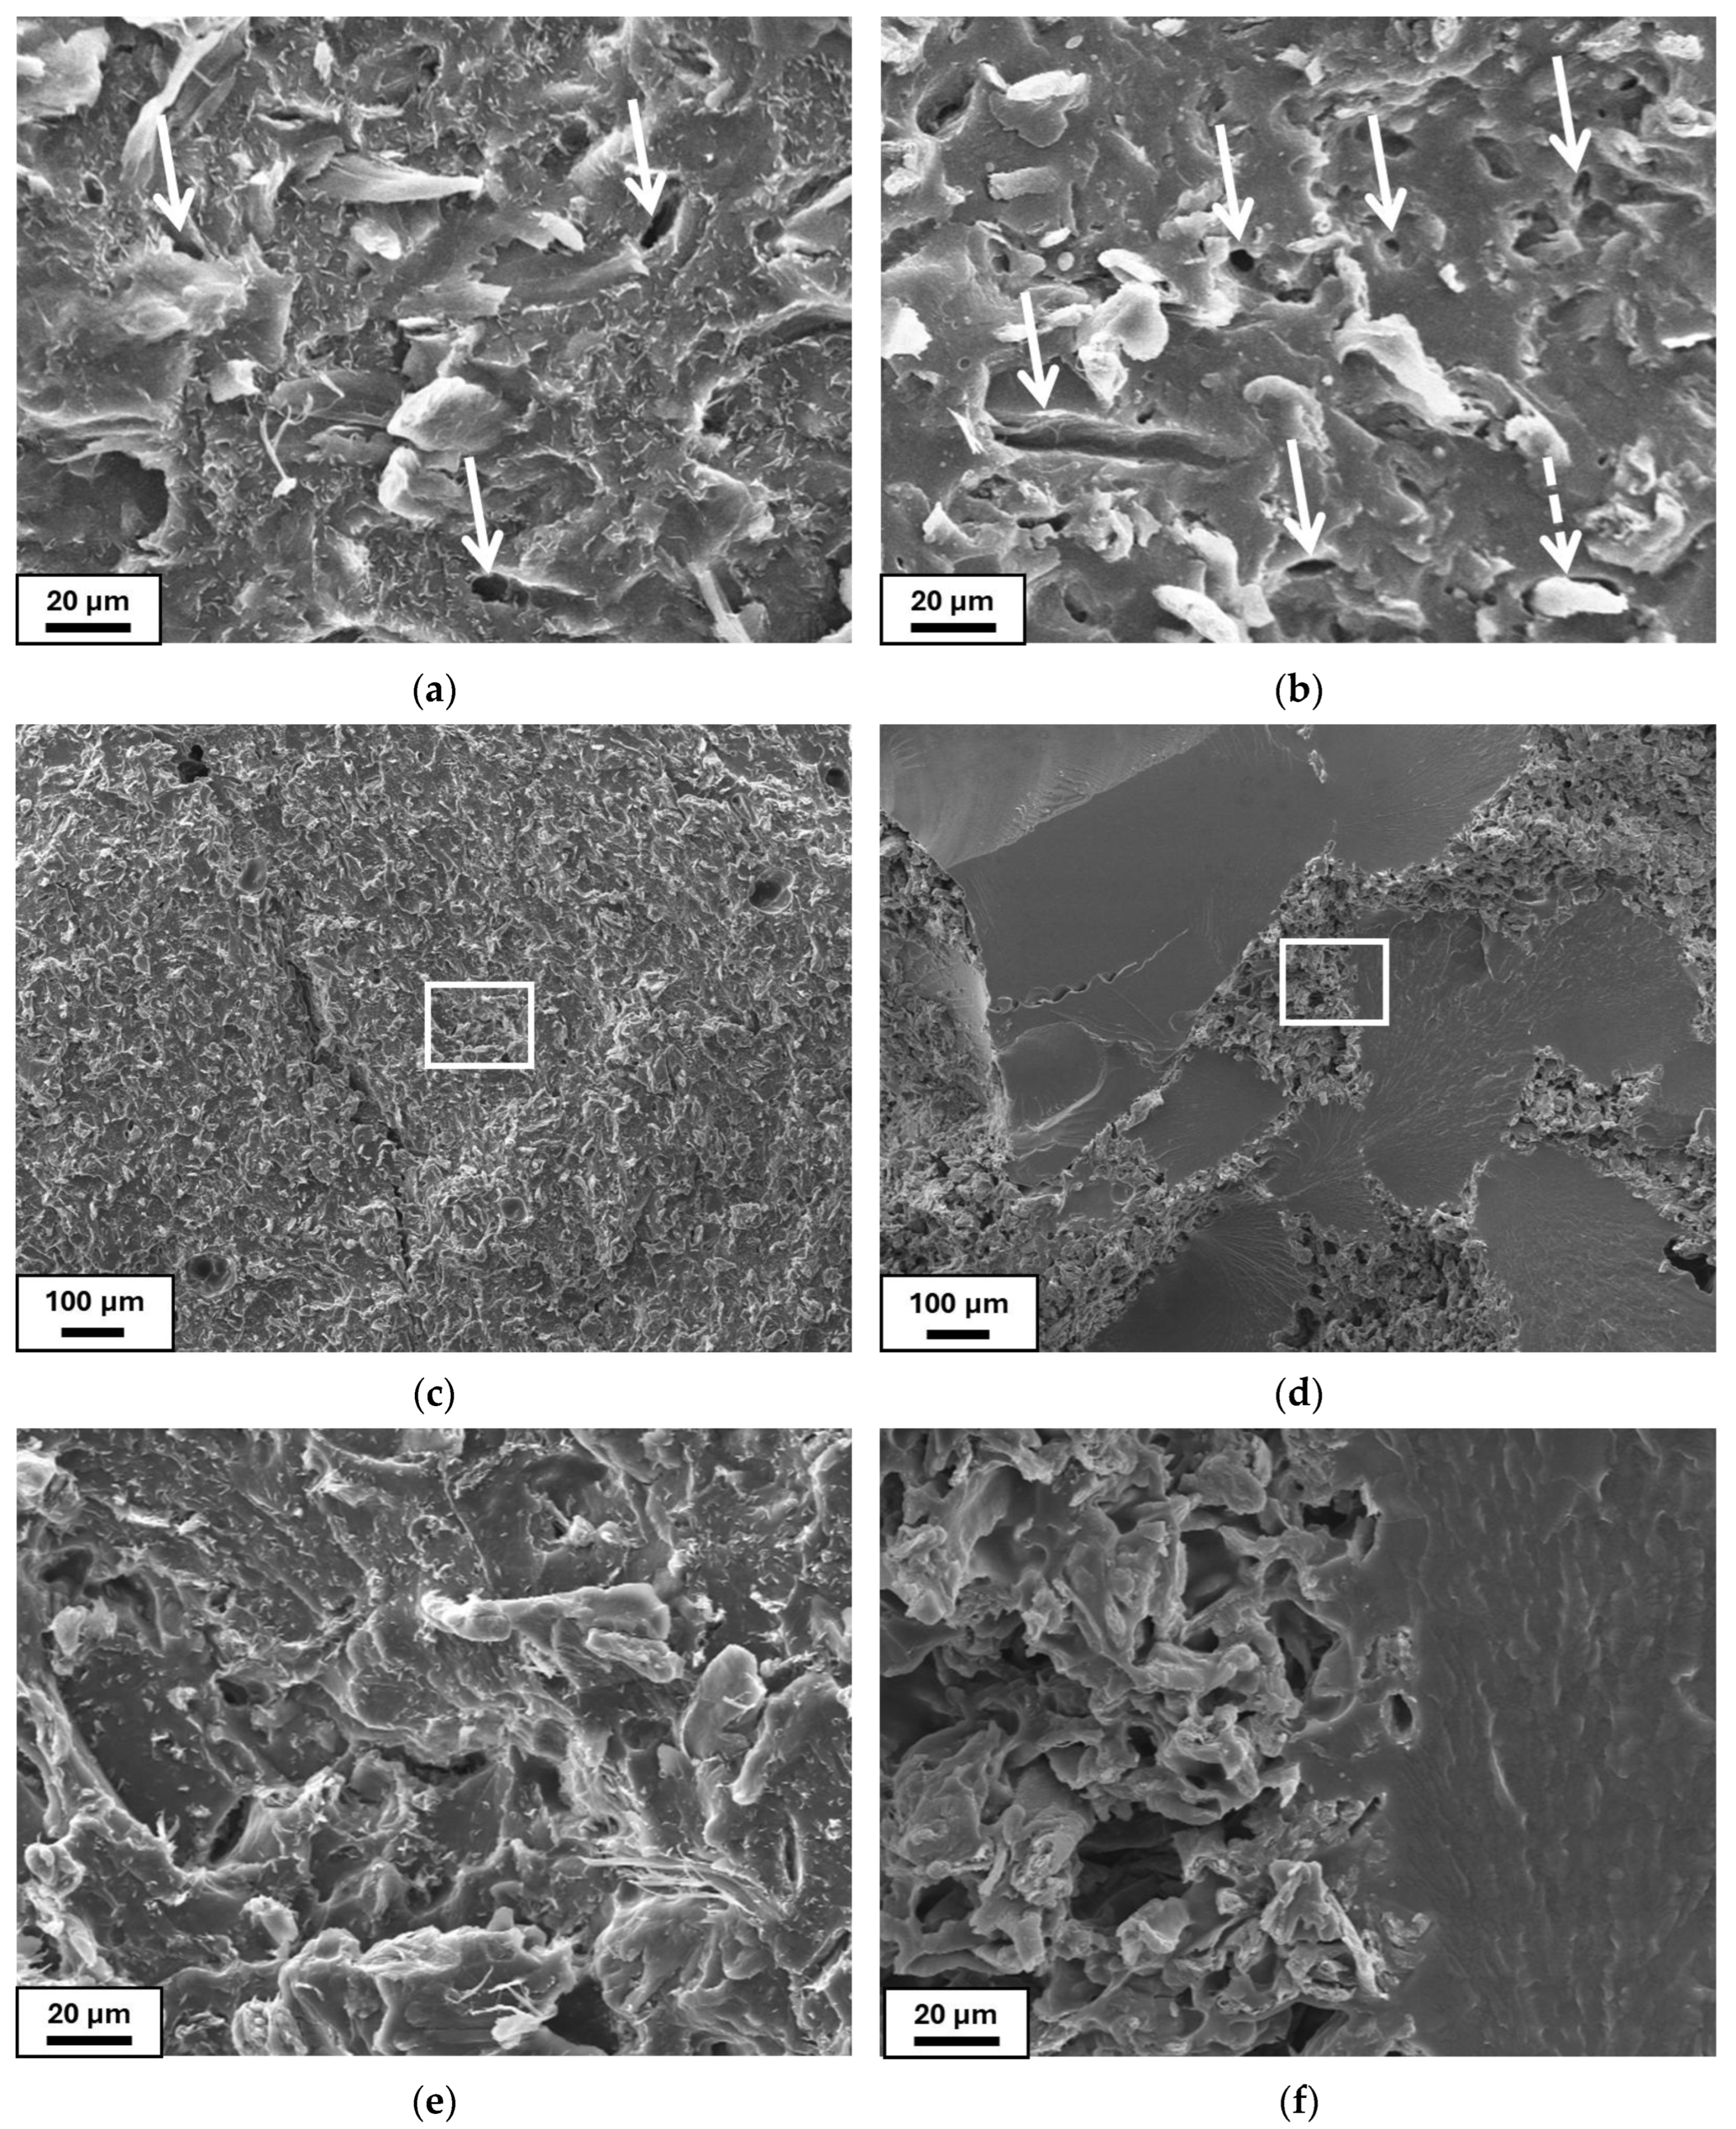
2.3. Scanning Electron Microscopy (SEM)

The injection moulded samples were fractured in liquid nitrogen, gold-sputtered, and analysed by scanning electron microscopy using an extended pressure ZEISS EVO 50 (Zeiss, Wetzlar, Germany) electron microscope at 20 kV. The aim was to observe possible microstructural differences between the two processing technologies that might support the varying mechanical performance of the injection-moulded samples. Before the analysis, the samples were fractured in liquid nitrogen and gold-sputtered. Both the granules (as produced) and injection-moulded samples were analysed.

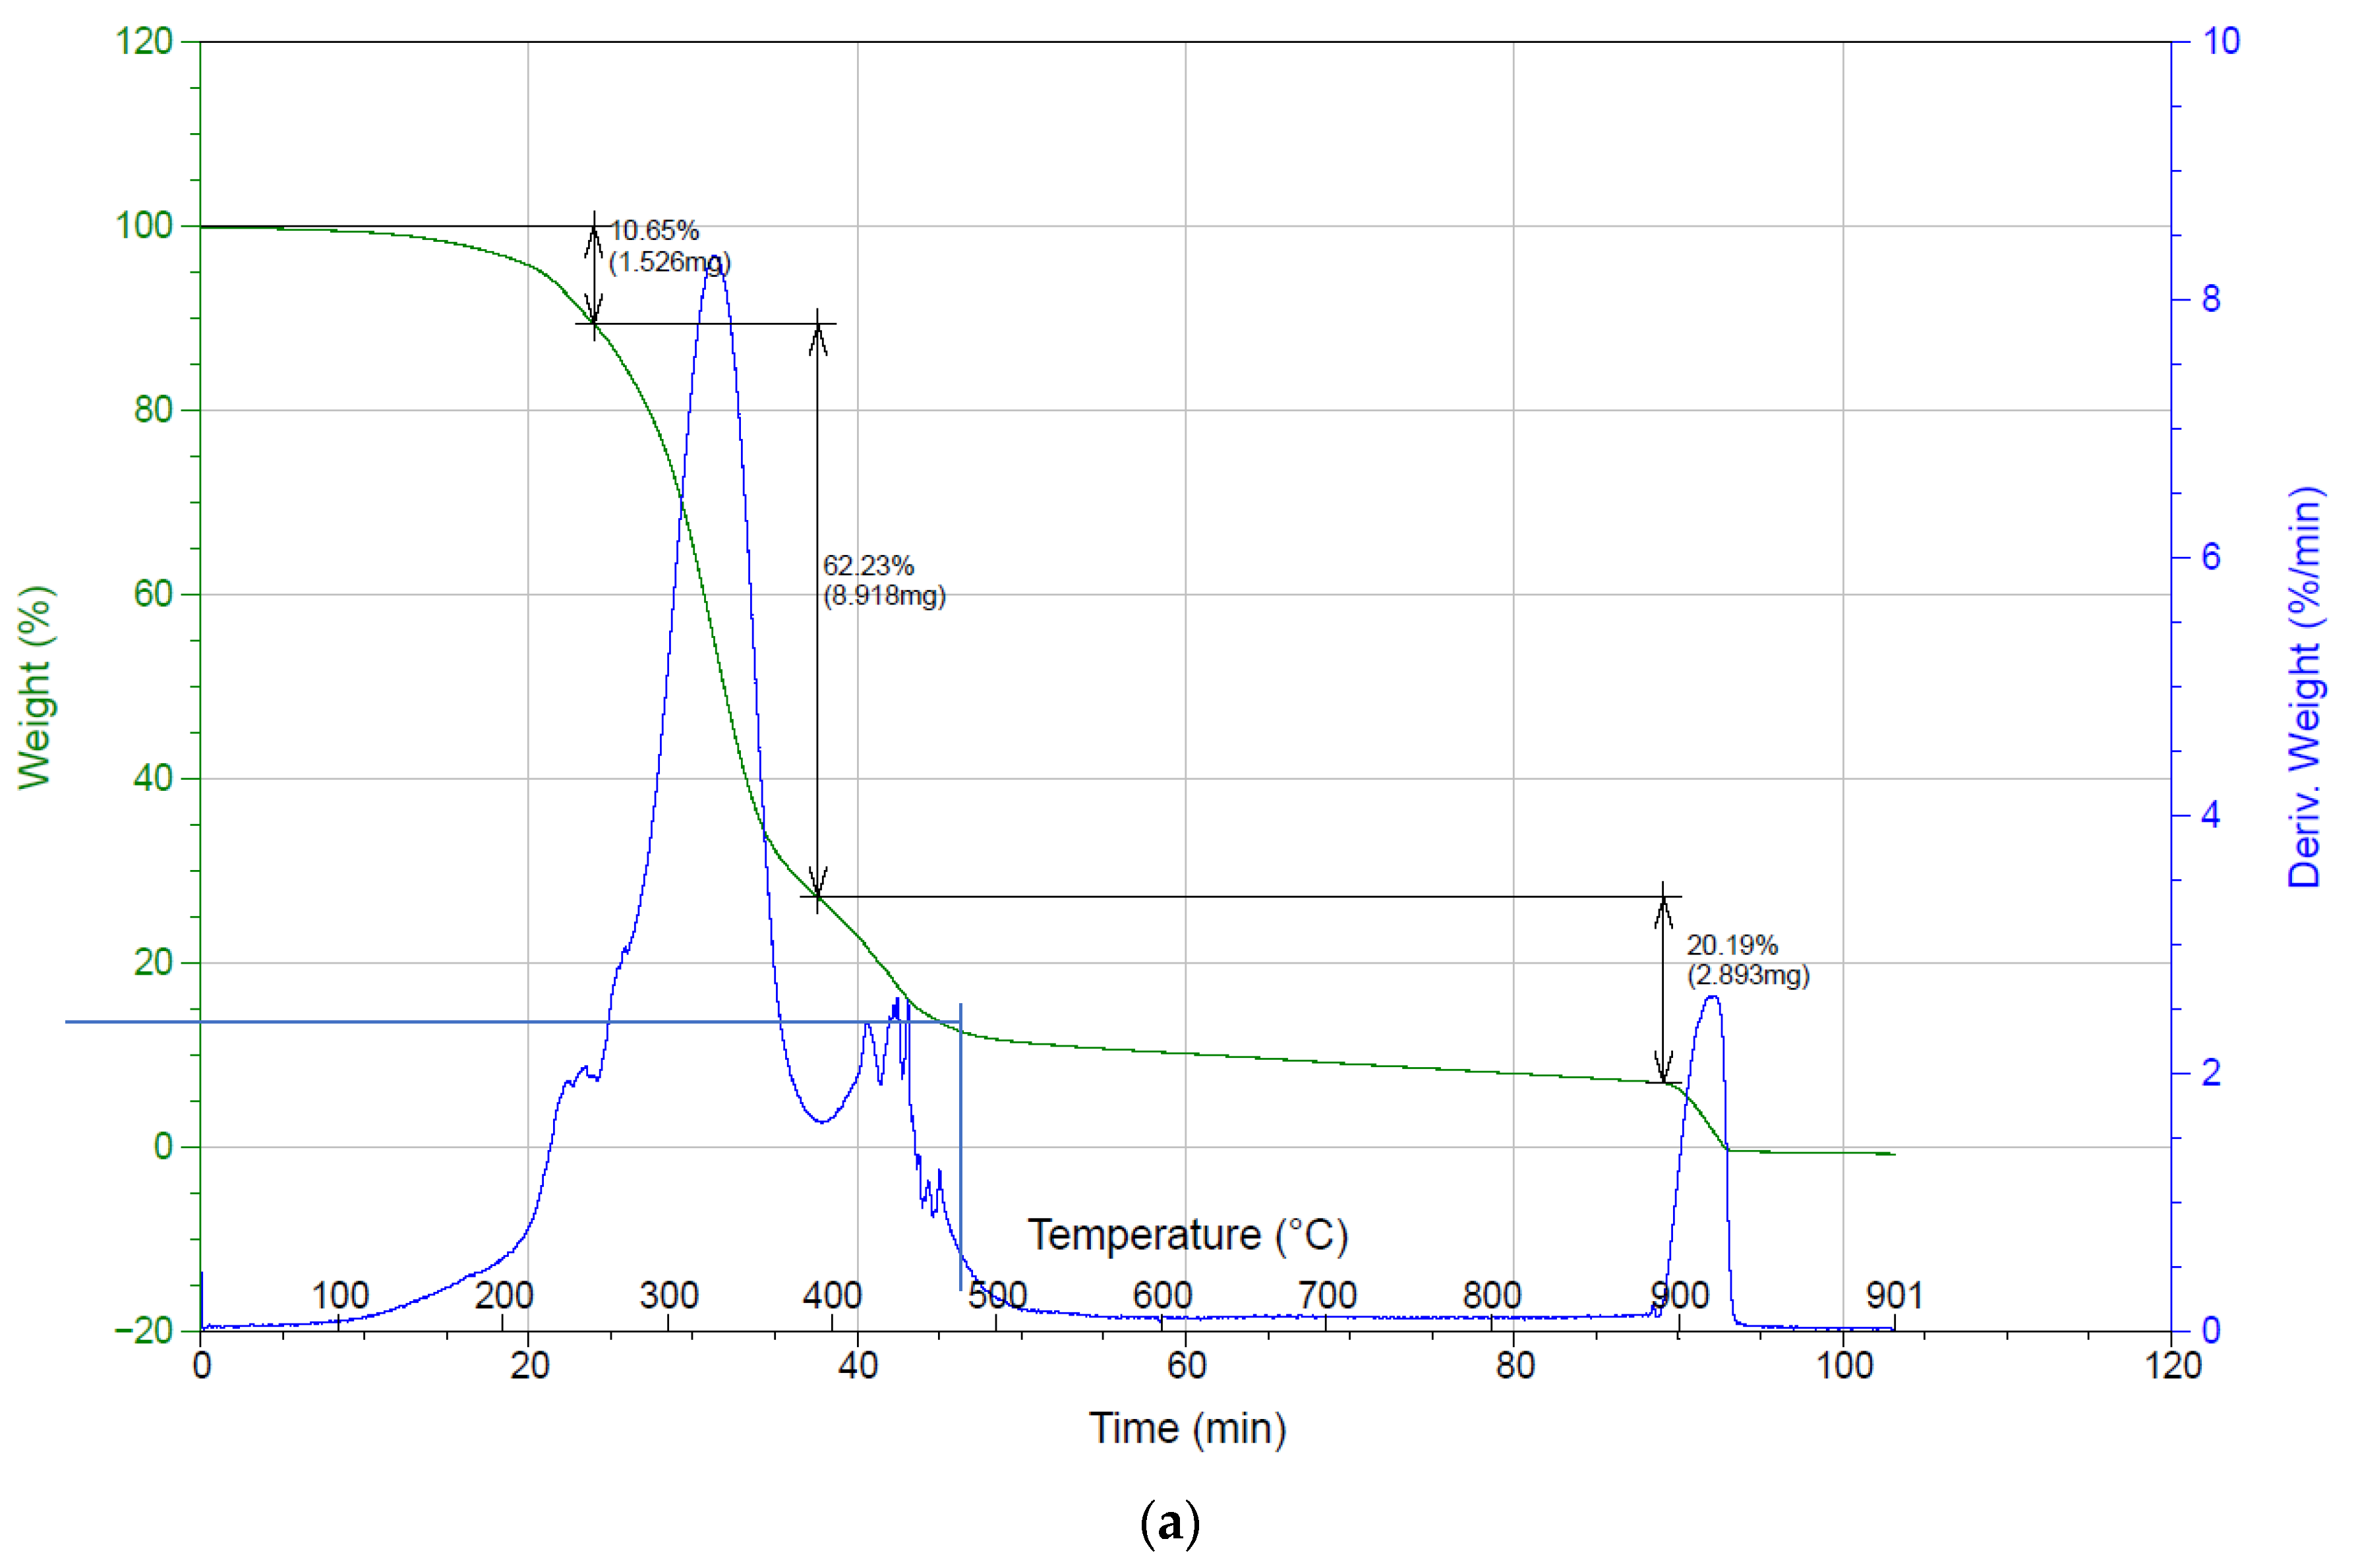
2.4. Thermogravimetric Analysis (TGA)

Thermogravimetric analyses were performed using a TA Instruments (New Castle, DE, USA) SDT Q600. Around 15–20 µg of each sample (i.e., cold-blended and melt-blended granules) were tested in the 30–900 °C range with a heating ramp of 10 °C/min in a nitrogen environment.

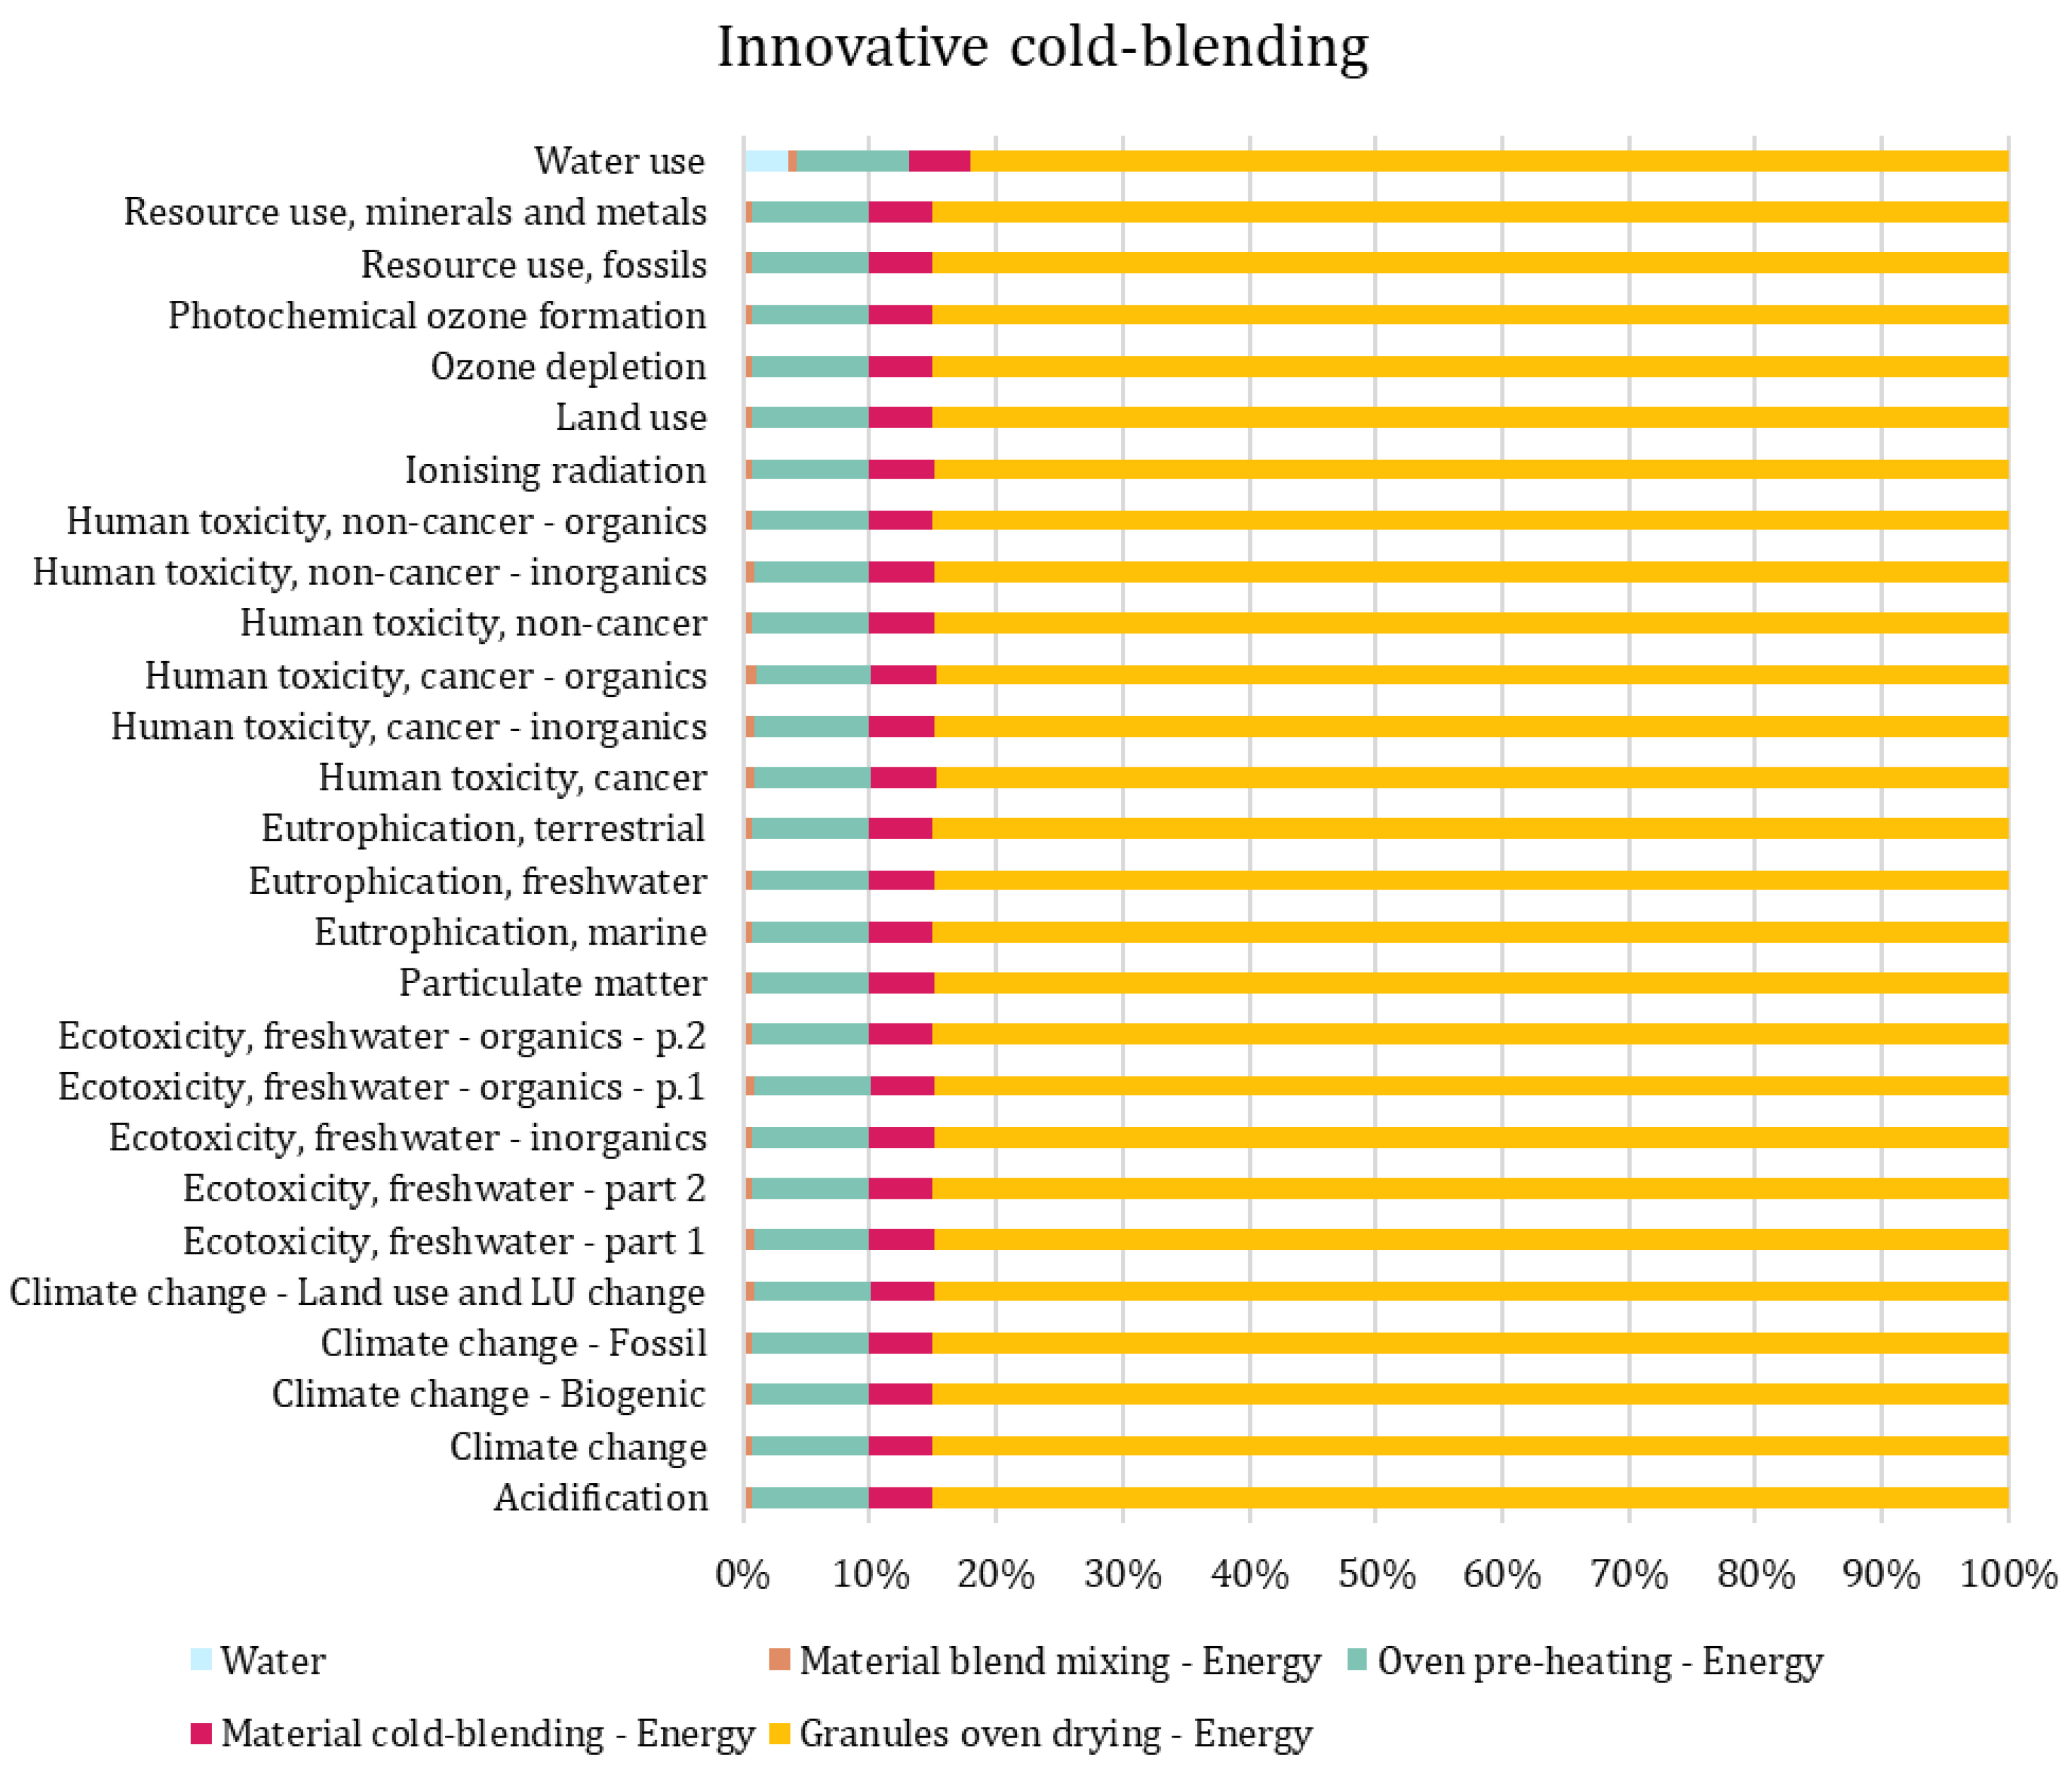
2.5. Life Cycle Assessment

2.5.1. Goal and Scope Definition

The primary goal of the study was to quantify the environmental impacts of the innovative production methodology versus the conventional melt blending of PVOH-based biocomposites. The biocomposites were produced at a pilot scale as filaments and granules, which were formed into 3–5 mm pellets to be used for further processing, i.e., injection moulding. The comparative analysis aimed to highlight possible benefits of using less energy- and water-intensive processes, such as cold blending, in contrast to traditional extrusion.
Two scenarios were considered here. Scenario 1 (S1), the baseline scenario, is related to the production of the PVOH-based biocomposite filled with 30 w% of short cellulose fibres through a conventional melt-blending process and subsequent granulation into pellets to be injection-moulded. Scenario 2 (S2) refers to the production of the same biocomposite (PVOH filled with 30 w% cellulose fibres) using innovative cold-blending technology, and its granulation and subsequent drying to obtain granules to be injection-moulded.

2.5.2. Functional Unit

The functional unit for the PVOH-based biocomposite was defined as one kilogram of biocomposite in the form of dry granules with an average diameter ranging from 3 to 5 mm.

2.5.3. System Boundaries and Life Cycle Stages—Data Quality

The system boundaries are reported in Figure 1. For both S1 and S2, the investigation assessed the gate-to-gate approach. S1 considers the following stages: material pre-drying in an oven, biocomposite melt blending into 3 mm filaments, granulation into pellets, and material stocking. Similarly, S2 considered the dry blending of the feedstock, the cold blending into 3 mm filaments and their contextual granulation, pellet drying in an oven, and material stocking.
In the assessment, only primary data obtained from in situ experimentation was used. The processes were modelled considering the inputs from energy and water consumption.

2.5.4. Life Cycle Inventory (LCI)

The inventories for obtaining one functional unit for S1 and S2 are reported in Table 3 and Table 4, respectively.

2.5.5. Data and Modelling Assumptions

The energetic mix chosen for the current simulation was the Italian low-voltage electricity mix. Water, instead, referred to the European market (excluding Switzerland) for tap water.
The equipment was run to process the functional unit, as stated elsewhere in this manuscript. For S1, the following assumptions were made when attributing water or power consumption to each phase:
  • The oven has a maximum granule or powder drying batch of 3 kg. Pre-heating was proportionally attributed to one batch as the limit processed amount per working day.
  • The drying phase of PVOH and cellulose fibres occurs overnight, i.e., for 16 h.
  • The extruder (melt blender) works for one 8 h shift, producing 1.5 kg/h. The pre-heat and working consumption of water and electricity was proportional to the processed amount per shift.
Regarding S2, the following assumptions were made:
  • The oven has a maximum PMC granule drying batch of 3 kg. As per the experimental data, it takes 4.5 h to completely dry one batch. The oven works continuously to process two batches. Therefore, the pre-heating electricity consumption was split proportionally into two dried batches.

2.5.6. Sensitivity Analysis

In this study, the authors applied sensitivity analysis to assess the uncertainty related to the energetic mix available for producing the biocomposite. The rationale is based on the impact of electricity within the defined system boundaries. The baseline was constituted by scenario S1, i.e., conventional melt blending. S1 sets the impacts of a functional unit as produced by drying a mass of 3 kg of dry blend of the composite for 16 h at 80 °C; moreover, the electricity consumed by the melt blender was distributed over a total production of 12 kg, i.e., the amount produced in an 8 h shift at a nominal production rate of 1.5 kg/h.
Both S1 and S2 were then assessed for changes in the energetic mix compared to the Italian low-voltage one. The authors searched for an energetic mix comprising the highest share of energy produced from renewable sources. Therefore, the Norwegian low-voltage electricity mix was chosen for the sensitivity analysis due to its renewable mix, which reaches 98.3%.
To further consider the effects of energy and water consumption in the baseline scenario, an alternative analysis involved the variation of the production rate of the melt-blending process and blend drying time to observe possible environmental impact indicators’ mitigation. The first modified baseline scenario adjusted the production rate to match that of the cold-blended granules, i.e., 4.5 kg/h. The authors assumed that the electricity consumption rate of the melt blender did not change with the increased production rate. The second alternative scenario considered a shorter drying time for the blend, halving it to 8 h from 16 h of S1. Both drying times are considered reasonable since previous literature abounds with broadly variable drying times, from longer than 24 h [41] to as few as 4 h [42], typically reporting it to occur overnight (typically 8–12 h).

2.5.7. Life Cycle Impact Assessment (LCIA)
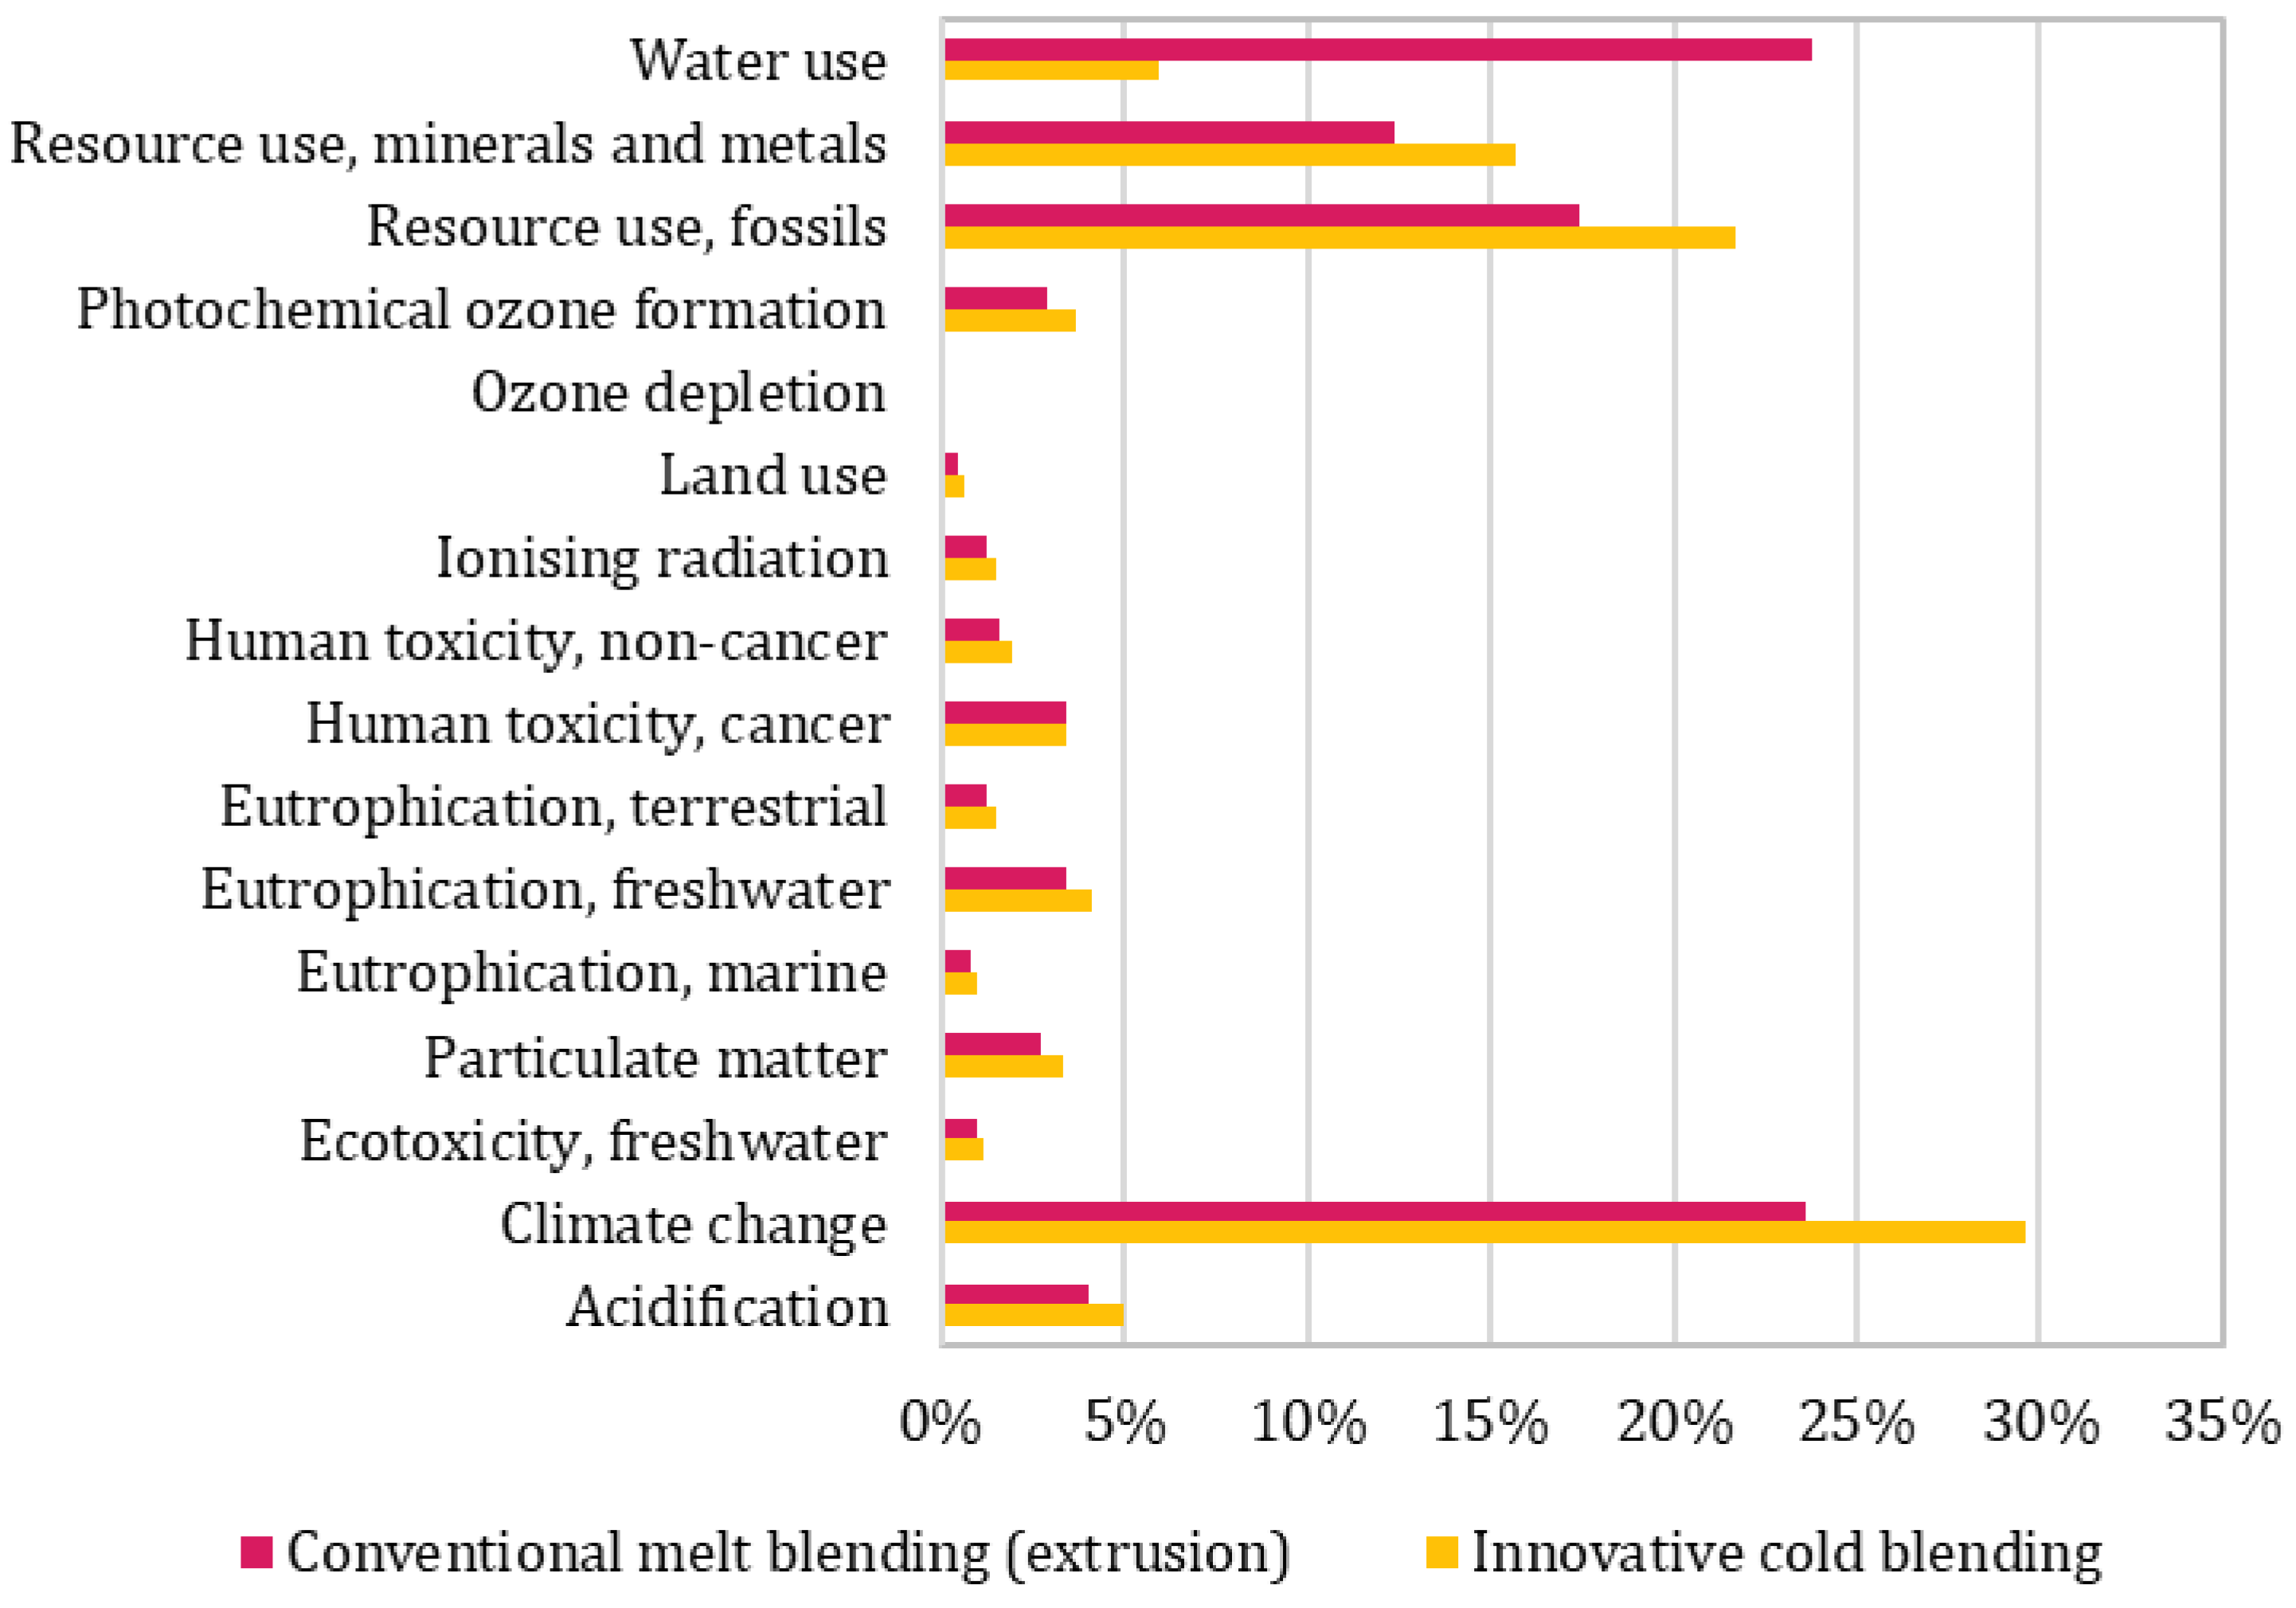
The study was conducted using the SimaPro (https://simapro.com/) software v9.6.03, and the Ecoinvent (https://ecoinvent.org/database/ accessed on 12 March 2025) cut-off database v9.10. The impact assessment was based on the EF 3.1 method [43], as recommended in the PEF method [44]. All the impact categories of the method were assessed in this study. In addition to the characterized values, the normalized values were also determined to calculate and compare the magnitude of their contributions to the impact categories. The normalization stage was performed using normalization factors of the EF method [45], installed in the SimaPro software.

3. Results

The results of the tensile testing are reported in Table 5. The cold processing achieved different properties compared to conventional melt blending. Young’s modulus dropped by −43.4% and the tensile strength by −23.4%, whereas the elongation at break surged by +67.9%. The results of the conventional processing are consistent with previous studies [17], although some differences arose, possibly mainly due to the different processing parameters, i.e., temperature profile and screw rpm. Besides a significant property change, the property variation is restrained in terms of absolute variation in the values. The trend is consistent with the property shift typical of reduced filler amounts in PVOH-based biocomposites [17,18].
The SEM micrographs (Figure 2a,b) indicate that the injection-moulded melt- and cold-blended samples are similar. Nevertheless, the cold-produced samples showed a higher tendency for fibre pullouts and poorer fibre-PVOH wettability. Different production techniques lead to varying fibre reinforcement due to a variable fibre wettability because of the molten (in the melt-blending process) or partially dissolved (in the cold-blended process) state of the PVOH. The statement is supported by Figure 2c compared to Figure 2d, which show the SEM micrographs of melt- and cold-blended granules, respectively. Cold blending differs from melt blending because the polymer particles do not fully embed cellulose fibres, resulting in very distinct phases in the granules. Nevertheless, the high temperature involved in the injection moulding process helped mitigate the wetting differences between the two processes studied, yielding more homogeneous biocomposite products for cold-blended granules.
The TGA analysis curves (Figure 3) showed similar behaviour in the tested temperature range. The samples were dry, with negligible water evaporation. Until almost 250 °C, the cold-blended sample exhibited a higher weight loss compared to the melt-blended sample (15.7% vs. 10.7%, respectively), attributed to the prior heat treatment of the biocomposite in the extruder. Indeed, at temperatures >180 °C, PVOH undergoes a first stage of degradation, i.e., the elimination of hydroxyl groups leading to water loss, as reported in previous literature [46,47].
Most weight loss occurred, however, in the 250–400 °C range, representing around 63% of the total sample weight. The peak in the weight derivative occurred at 315 °C and 318 °C for the cold- and melt-blended granules, respectively. Within this temperature range, PVOH undergoes a second degradation step related to chain scission and cyclization reactions [46,47]. Combined with PVOH degradation, and starting at 200 °C, cellulose undergoes dehydration and depolymerization processes [48,49].
Following the physical characterization of the composites from cold- and melt-blending techniques, the materials were analysed from the LCA perspective; the assessment was considered a functional unit of 1 kg (dry) of produced granules. Figure 4 presents the environmental impact indicators for each phase of conventional melt blending (the full characterization tables are reported in Appendix A.1). The main impacts are caused by the energy input during oven drying and material melt blending, followed by the water used in the material melt blending. The respective averages (±single standard deviation) for these indicators were 39.7 ± 10.9%, 33.7 ± 9.2%, and 19.9 ± 19.5%. The water usage during melt blending showed high variability across different impact categories, ranging from 3.3% to 86.0% for biogenic climate change and water use, respectively.
The results for innovative cold-blending biocomposite production are shown in Figure 5. Here, around 84.8 ± 0.6% of the impact for each category is attributed to the energy required to completely dry the wet granules (including the pre-heating of the oven, this percentage would reach almost 94%). The energy involved in the cold blending represents an average of 5% of the total environmental impacts associated with the system boundaries of S2.
Figure 4 and Figure 5 illustrate the relative impact of all phases for each environmental indicator. However, different impact factors may have different weights from an absolute perspective. Therefore, the authors based the following argumentation on the normalized and weighted values according to the EF 3.1 method (the full tables with weighted impacts are presented in Appendix A.2). The distribution of the resulting weighted environmental impact indicators was generally similar for cold- and melt-blending processes (Figure 6), except for the “Water use indicator”, since water is added as an ingredient to the PMC formulation in the innovative production, without requiring constant water consumption during production. Still, in both cases, the most impactful indicators related to this work were associated with “Climate change”, “Resource use”, and “Water use”.
Comparing the absolute environmental impacts of cold blending to those of conventional melt blending (Figure 7), the former shows significant environmental benefits. The environmental impact indicators dropped by at least −58% for “Resource use, minerals and metals”, reaching a maximum of −92% for “Water use”. Indeed, the cold processing required only 0.3 kg water/kg dry composite, cutting down on the constant water flow required by the extruder used to melt-blend the PMC to keep the heating zone temperature constant.
As already stated, the experimental melt-blending run achieved a production rate of 1.5 kg/h. Assuming constant extruder power consumption at three-fold productivity—to equal the cold-blending production rate—and considering an 8 h shift of continuous production, the environmental benefits of cold blending reduce to half, making melt blending more competitive. Still, the results favour cold-blending production, since the melt blending process with a 3× production rate consumes almost 94× more water and around 1.6× more energy.
The reduction in the residency time during the drying phase (8 h versus 16 h) resulted in an average −23% reduction in the impact indicators compared to the baseline scenario.
For cold blending (i.e., S2), melt blending 3× production rate, and 0.5× (i.e., 8 h) drying time, the outliers (defined as values higher than the upper Tukey fence or lower than the lower Tukey fence) are represented by the “Water use” and “Human toxicity—Cancer” indicators. The 3× production rate cuts down water usage per functional unit, whereas the 0.5× drying time is related to electricity savings per functional unit; thus, both outliers overweight water contamination and use efficiency. Specifically, the “Human toxicity—Cancer” indicator in the EF method is based on a toolbox presented in previous literature [50], which involves the impact analysis of possible chemical emissions, fate, exposure, or effect on humans. Since the main water use here is in closed circuits to maintain the extruders’ temperature, and chemical leakage into water is not anticipated, marginal effects are projected for such an indicator. On the contrary, “Water use” was crucial here, since its minimization was of great interest.
The results in Figure 7 become much more dispersed when considering the effect of the renewable energy mix (i.e., the Norwegian low-voltage electricity) on the baseline scenario and cold blending. The effects on melt blending are broadly dispersed (−66% on average), with low effects (<30%) on the “Resource use, minerals and metals”, “Water use”, and “Human toxicity, non-cancer” indicators. On the contrary, the following indicators achieved an impact drop of >90%: “Climate change”, “Land use”, “Ozone depletion”, and “Resource use, fossils”. Matching this with the weighted data in Figure 6, the highest environmental impact reduction was observed for the “Climate change” and “Resource use, fossils” indicators. The “Resource use, minerals and metals” indicator, despite being one of the highest contributors in the baseline scenario, reduced by a modest −14%. This is consistent with the previous literature reporting that renewable energy production is more mineral-intensive [51]. The results strongly rely on the specific energy mix: Norway relies 92% on hydroelectric power sources, whereas Italy relies just 18% (still representing the second source share after natural gas, with 48%, and before photovoltaics, with 9%). In addition, in both energy mixes, an important contribution to impacts is provided by the distribution network. The contribution of this stage becomes particularly significant for the fossil resource use indicator, accounting for 82% and 84% impacts associated with medium- and low-voltage distribution, respectively. In the ecoinvent database, this phase is modelled with longer transmission distances for the Italian high-voltage lines compared to those in Norway, while mid- and low-voltage energy distribution is assumed to be the same.
Although the gap reduces, in the case of the renewable energy mix, cold processing proves to be the best choice under equal boundary conditions.

4. Discussion

After the Paris Agreement in 2015, the more recent Glasgow Climate Pact adopted in 2021, and the Global Stocktake, which took place in 2023, it is ever important to effectively reduce human activities’ footprint and achieve the goals set back in 2015. From the environmental perspective, and despite recent advancements, a large amount of effort is still needed. Optimizing the impacts of production processes is crucial. Cutting down on the usage of energy, water, and other resources is a must and can help reduce the global warming potential, defined in the “Climate change” indicators and measured as equivalent CO2 kg. In this context, the water-soluble nature of PVOH was beneficial for investigating an alternative processing technology. Besides requiring a final drying step, the cold-blended PMC granules reduced the environmental impacts related to climate change by an average of −62% (Figure 6). Moreover, TGA curves showed how cold processing can slightly reduce early biocomposite degradation caused by the first thermal cycle in the melt extruder.
This study focused on the processing of composites, neglecting the impacts of feedstock procurement. Indeed, the specific supplier location, production process, and transportation means can greatly affect the environmental burden of the PMC. Previous literature has highlighted how material selection greatly affects the overall impact, constituting a large share of the total material or product environmental impact [52,53]. The focus of this work was on the impact reduction during the processing phase, which represents a cumulative share that might be higher than the material one [52,54]. The results showed that, overall, cold processing can greatly contribute to the reduction of environmental impacts, particularly due to the low water usage and low power consumption during composite blending. The present study considered a drying methodology consistent with what happens in the pre-processing of PVOH and cellulose fibres in conventional melt blending. The use of other technologies or equipment, involving, e.g., lower temperatures or higher energy efficiency, might further beneficial in mitigating the environmental impacts. Therefore, desiccators or forced air drying at room temperature might be evaluated. However, possible economic viability considerations for industrial scale-up of alternative drying technologies that involve time-intensive methodologies might represent a logistic bottleneck [55].
Although production occurred at a pilot scale—with a few kilograms produced per hour—the results showed encouraging insights into the potential for further process optimization. By increasing the screw speed in the extruder (melt blender), shear-thinning materials—such as PVOH—can reduce the extruder-specific motor power consumption [56]. As per the attribution methodology for water and energy consumed in melt blending, possible further water and energy savings might be obtained, reducing the gap between the data of conventional versus innovative processing. Moreover, as highlighted elsewhere [57], the actual energy mix obtained from renewable sources fluctuates throughout the day. Therefore, the overall indicators evolve over time, possibly requiring a dynamic electricity mix-based LCA to yield more robust results.

5. Conclusions

This work presented an innovative processing technique to obtain PVOH-based biocomposite granules that may find application in the packaging sector as a substitute for conventional polymers. The process is based on cold processing, which involves less water compared to the melt-blending process and requires lower energetic input, mainly attributable to granule drying. The mechanical properties of the injected composites were similar to those of the injected samples from conventionally processed granules (tensile strength: 9.5 MPa versus 12.4 MPa; Young’s modulus: 242 MPa versus 137 MPa), although the former showed higher elongation at break (22.5% versus 13.4%). The LCA highlighted strong and reliable environmental savings, achieving an average of −62 ± 8% for all impact indicators considered. The effect of different production parameters, drying time, or energetic mix can play a significant role in the LCA results. The highest reduction was observed for the 98.3% renewable energy mix applied to the cold-blended granules, resulting in an average decrease of −90% for each environmental impact indicator compared to the conventional melt-blending technique.

6. Patents

As an outcome of this work, the patent application titled “Metodo/procedimento di estrusione a freddo e granulazione di compositi ecosostenibili e relativo dispositivo” was filed by Nextmaterials (inventor: Prof. emeritus Alberto Cigada) with the Italian Ministry of Enterprises and Made in Italy (patent application ID: 102025000004206, submitted on 28 February 2025).

Author Contributions

Conceptualization, M.P., A.C. and A.M.; methodology, M.V.D. and B.D.C.; validation, F.S., A.M. and L.P.; investigation, A.M., F.S. and A.C.; resources, A.C., B.D.C. and M.P.; data curation, F.S.; writing—original draft preparation, A.M., L.P. and M.V.D.; writing—review and editing, A.M., L.P. and M.V.D.; visualization, A.M.; supervision, A.C. and B.D.C. All authors have read and agreed to the published version of the manuscript.

Funding

This research was partially funded within the MUSA—Multilayered Urban Sustainability Action—project, funded by the European Union—NextGenerationEU, under the National Recovery and Resilience Plan (NRRP) Mission 4 Component 2 Investment Line 1.5: Strenghtening of research structures and creation of R&D “innovation ecosystems”, set up of “territorial leaders in R&D”. Project code: ECS 00000037.

Data Availability Statement

The data presented in this study are available on request from the corresponding author. Most data are contained within the article.

Conflicts of Interest

A.C. is the inventor of a pending patent related to this work, as specified in 6. Patents. All other authors declare no conflicts of interest.

Abbreviations

The following abbreviations are used in this manuscript:
LCALife Cycle Assessment
LCILife Cycle Inventory
PMCPolymeric Matrix Composite
PVOHPolyvinyl alcohol
SEMScanning Electron Microscopy
S1Scenario 1
S2Scenario 2
TGAThermogravimetric Analysis

Appendix A

Appendix A.1

The complete characterization tables for the melt-blending and cold-blending processes are presented in Table A1 and Table A2. For each indicator, the respective values associated with each production phase are reported.
Table A1. Characterized environmental impacts for conventional melt blending. The indicators’ impact is split for each production phase.
IndicatorUnitOven Pre-Heating—EnergyOven Drying—EnergyExtruder Pre-Heating—WaterExtruder Pre-Heating—EnergyMaterial Melt Blending—WaterMaterial Melt Blending—EnergyMaterial Granulation—Energy
Acidificationmol H+eq1 × 10−42 × 10−31 × 10−51 × 10−41 × 10−42 × 10−32 × 10−5
Climate changekg CO2eq3 × 10−26 × 10−12 × 10−33 × 10−22 × 10−25 × 10−15 × 10−3
Climate change—Biogenickg CO2eq1 × 10−42 × 10−34 × 10−61 × 10−44 × 10−52 × 10−32 × 10−5
Climate change—Fossilkg CO2eq3 × 10−26 × 10−12 × 10−33 × 10−22 × 10−25 × 10−15 × 10−3
Climate change—Land use and LU changekg CO2eq6 × 10−61 × 10−44 × 10−66 × 10−64 × 10−59 × 10−51 × 10−6
Ecotoxicity, freshwater—part 1CTUe5 × 10−28 × 10−12 × 10−25 × 10−23 × 10−17 × 10−18 × 10−3
Ecotoxicity, freshwater—part 2CTUe6 × 10−214 × 10−35 × 10−24 × 10−28 × 10−19 × 10−3
Ecotoxicity, freshwater—inorganicsCTUe7 × 10−211 × 10−27 × 10−21 × 10−111 × 10−2
Ecotoxicity, freshwater—organics—p.1CTUe2 × 10−24 × 10−12 × 10−22 × 10−22 × 10−13 × 10−13 × 10−3
Ecotoxicity, freshwater—organics—p.2CTUe1 × 10−22 × 10−19 × 10−49 × 10−39 × 10−31 × 10−12 × 10−3
Particulate matterdisease inc.7 × 10−101 × 10−81 × 10−107 × 10−101 × 10−91 × 10−81 × 10−10
Eutrophication, marinekg Neq2 × 10−54 × 10−42 × 10−62 × 10−52 × 10−53 × 10−43 × 10−6
Eutrophication,
freshwater
kg Peq7 × 10−61 × 10−41 × 10−67 × 10−61 × 10−51 × 10−41 × 10−6
Eutrophication, terrestrialmol Neq2 × 10−44 × 10−32 × 10−52 × 10−42 × 10−43 × 10−34 × 10−5
Human toxicity, cancerCTUh9 × 10−112 × 10−97 × 10−118 × 10−118 × 10−101 × 10−91 × 10−11
Human toxicity, cancer—inorganicsCTUh4 × 10−128 × 10−112 × 10−124 × 10−122 × 10−116 × 10−117 × 10−13
Human toxicity, cancer—organicsCTUh8 × 10−111 × 10−97 × 10−118 × 10−118 × 10−101 × 10−91 × 10−11
Human toxicity,
non-cancer
CTUh4 × 10−107 × 10−91 × 10−104 × 10−101 × 10−96 × 10−97 × 10−11
Human toxicity,
non-cancer—inorganics
CTUh4 × 10−107 × 10−91 × 10−104 × 10−101 × 10−96 × 10−96 × 10−11
Human toxicity,
non-cancer—organics
CTUh3 × 10−114 × 10−109 × 10−132 × 10−119 × 10−124 × 10−104 × 10−12
Ionising radiationkBq U235eq4 × 10−37 × 10−28 × 10−44 × 10−38 × 10−36 × 10−26 × 10−4
Land usePt2 × 10−139 × 10−32 × 10−11 × 10−133 × 10−2
Ozone depletionkg CFC-11eq8 × 10−101 × 10−83 × 10−117 × 10−103 × 10−101 × 10−81 × 10−10
Photochemical ozone
formation
kg NMVOCeq1 × 10−42 × 10−37 × 10−61 × 10−48 × 10−51 × 10−32 × 10−5
Resource use, fossilsMJ5 × 10−194 × 10−25 × 10−14 × 10−189 × 10−2
Resource use, minerals and metalskg Sbeq4 × 10−77 × 10−61 × 10−84 × 10−71 × 10−76 × 10−67 × 10−8
Water usem3 depriv.2 × 10−24 × 10−13 × 10−12 × 10−234 × 10−14 × 10−3
Table A2. Characterized environmental impacts for innovative cold blending. The indicators’ impact is split for each production phase.
IndicatorUnitWaterMaterial Blend Mixing—EnergyMaterial Cold Blending—EnergyOven Pre-Heating—EnergyGranules Oven Drying—Energy
Acidificationmol H+eq5 × 10−71 × 10−51 × 10−42 × 10−42 × 10−3
Climate changekg CO2eq9 × 10−54 × 10−32 × 10−24 × 10−24 × 10−1
Climate change—Biogenickg CO2eq2 × 10−71 × 10−51 × 10−42 × 10−42 × 10−3
Climate change—Fossilkg CO2eq9 × 10−54 × 10−32 × 10−24 × 10−24 × 10−1
Climate change—Land use and LU changekg CO2eq2 × 10−77 × 10−75 × 10−68 × 10−68 × 10−5
Ecotoxicity, freshwater—part 1CTUe1 × 10−35 × 10−34 × 10−26 × 10−26 × 10−1
Ecotoxicity, freshwater—part 2CTUe2 × 10−46 × 10−34 × 10−27 × 10−27 × 10−1
Ecotoxicity, freshwater—inorganicsCTUe5 × 10−48 × 10−35 × 10−21 × 10−19 × 10−1
Ecotoxicity, freshwater—organics—p.1CTUe7 × 10−42 × 10−32 × 10−23 × 10−23 × 10−1
Ecotoxicity, freshwater—organics—p.2CTUe4 × 10−51 × 10−37 × 10−31 × 10−21 × 10−1
Particulate matterdisease inc.5 × 10−127 × 10−115 × 10−109 × 10−109 × 10−9
Eutrophication, marinekg Neq9 × 10−82 × 10−62 × 10−53 × 10−53 × 10−4
Eutrophication,
freshwater
kg Peq5 × 10−88 × 10−76 × 10−61 × 10−59 × 10−5
Eutrophication, terrestrialmol Neq9 × 10−72 × 10−52 × 10−43 × 10−43 × 10−3
Human toxicity, cancerCTUh3 × 10−129 × 10−126 × 10−111 × 10−101 × 10−9
Human toxicity, cancer—inorganicsCTUh7 × 10−145 × 10−133 × 10−126 × 10−125 × 10−11
Human toxicity, cancer—organicsCTUh3 × 10−129 × 10−126 × 10−111 × 10−101 × 10−9
Human toxicity,
non-cancer
CTUh5 × 10−124 × 10−113 × 10−106 × 10−105 × 10−9
Human toxicity,
non-cancer—inorganics
CTUh5 × 10−124 × 10−113 × 10−105 × 10−105 × 10−9
Human toxicity,
non-cancer—organics
CTUh4 × 10−143 × 10−122 × 10−113 × 10−113 × 10−10
Ionising radiationkBq U235eq3 × 10−54 × 10−43 × 10−35 × 10−35 × 10−2
Land usePt4 × 10−42 × 10−21 × 10−13 × 10−12
Ozone depletionkg CFC-11eq1 × 10−128 × 10−116 × 10−101 × 10−99 × 10−9
Photochemical ozone
formation
kg NMVOCeq3 × 10−71 × 10−57 × 10−51 × 10−41 × 10−3
Resource use, fossilsMJ2 × 10−36 × 10−24 × 10−17 × 10−17
Resource use, minerals and metalskg Sbeq5 × 10−104 × 10−83 × 10−76 × 10−75 × 10−6
Water usem3 depriv.1 × 10−23 × 10−32 × 10−23 × 10−23 × 10−1

Appendix A.2

In this section, the full tables showing the weighted values of the aggregated indicators are presented. Table A3 and Table A4 show the weighted values for the conventional melt-blending and innovative cold-blending techniques.
Table A3. Weighted environmental impacts for conventional melt blending. The indicators’ impact is split for each production phase.
IndicatorUnitOven Pre-Heating—EnergyOven Drying—EnergyExtruder Pre-Heating—WaterExtruder Pre-Heating—EnergyMaterial Melt Blending—WaterMaterial Melt Blending—EnergyMaterial Granulation—Energy
AcidificationPt2 × 10−73 × 10−61 × 10−82 × 10−71 × 10−72 × 10−63 × 10−8
Climate changePt9 × 10−72 × 10−56 × 10−89 × 10−77 × 10−71 × 10−52 × 10−7
Ecotoxicity, freshwaterPt3 × 10−86 × 10−71 × 10−83 × 10−81 × 10−75 × 10−76 × 10−9
Particulate matterPt1 × 10−72 × 10−62 × 10−81 × 10−72 × 10−72 × 10−62 × 10−8
Eutrophication, marinePt3 × 10−86 × 10−73 × 10−93 × 10−84 × 10−85 × 10−75 × 10−9
Eutrophication,
freshwater
Pt1 × 10−72 × 10−62 × 10−81 × 10−72 × 10−72 × 10−62 × 10−8
Eutrophication, terrestrialPt5 × 10−88 × 10−75 × 10−95 × 10−85 × 10−87 × 10−78 × 10−9
Human toxicity, cancerPt1 × 10−72 × 10−69 × 10−81 × 10−71 × 10−62 × 10−62 × 10−8
Human toxicity,
non-cancer
Pt6 × 10−81 × 10−62 × 10−86 × 10−82 × 10−79 × 10−71 × 10−8
Ionising radiationPt5 × 10−88 × 10−79 × 10−95 × 10−81 × 10−77 × 10−78 × 10−9
Land usePt2 × 10−83 × 10−79 × 10−102 × 10−89 × 10−93 × 10−73 × 10−9
Ozone depletionPt9 × 10−102 × 10−84 × 10−119 × 10−104 × 10−101 × 10−82 × 10−10
Photochemical ozone
formation
Pt1 × 10−72 × 10−68 × 10−91 × 10−79 × 10−82 × 10−62 × 10−8
Resource use, fossilsPt7 × 10−71 × 10−55 × 10−87 × 10−75 × 10−71 × 10−51 × 10−7
Resource use, minerals and metalsPt5 × 10−79 × 10−61 × 10−85 × 10−72 × 10−77 × 10−68 × 10−8
Water usePt2 × 10−73 × 10−62 × 10−62 × 10−72 × 10−53 × 10−63 × 10−8
Table A4. Weighted environmental impacts for innovative cold blending. The indicators’ impact is split for each production phase.
IndicatorUnitWaterMaterial Blend Mixing—EnergyMaterial Cold Blending—EnergyOven Pre-Heating—EnergyGranules Oven Drying—Energy
AcidificationPt5 × 10−102 × 10−81 × 10−72 × 10−72 × 10−6
Climate changePt3 × 10−91 × 10−77 × 10−71 × 10−61 × 10−5
Ecotoxicity, freshwaterPt4 × 10−104 × 10−93 × 10−85 × 10−84 × 10−7
Particulate matterPt8 × 10−101 × 10−88 × 10−81 × 10−71 × 10−6
Eutrophication, marinePt1 × 10−103 × 10−92 × 10−84 × 10−84 × 10−7
Eutrophication,
freshwater
Pt1 × 10−91 × 10−81 × 10−72 × 10−72 × 10−6
Eutrophication, terrestrialPt2 × 10−105 × 10−94 × 10−86 × 10−86 × 10−7
Human toxicity, cancerPt4 × 10−91 × 10−88 × 10−81 × 10−71 × 10−6
Human toxicity,
non-cancer
Pt7 × 10−106 × 10−94 × 10−88 × 10−87 × 10−7
Ionising radiationPt4 × 10−105 × 10−94 × 10−86 × 10−86 × 10−7
Land usePt4 × 10−112 × 10−91 × 10−83 × 10−82 × 10−7
Ozone depletionPt2 × 10−121 × 10−107 × 10−101 × 10−91 × 10−8
Photochemical ozone
formation
Pt3 × 10−101 × 10−89 × 10−82 × 10−71 × 10−6
Resource use, fossilsPt2 × 10−97 × 10−85 × 10−79 × 10−78 × 10−6
Resource use, minerals and metalsPt6 × 10−105 × 10−84 × 10−77 × 10−76 × 10−6
Water usePt1 × 10−72 × 10−81 × 10−72 × 10−72 × 10−6

References

  1. Circle Economy. In The Circularity Gap Report 2024; Circle Economy Foundation: Amsterdam, The Netherlands, 2025.
  2. Barbier, E.B. The Concept of Sustainable Economic Development. Environ. Conserv. 1987, 14, 101–110. [Google Scholar] [CrossRef]
  3. Purvis, B.; Mao, Y.; Robinson, D. Three Pillars of Sustainability: In Search of Conceptual Origins. Sustain. Sci. 2019, 14, 681–695. [Google Scholar] [CrossRef]
  4. Packaging Waste Statistics. Available online: https://ec.europa.eu/eurostat/statistics-explained/index.php?title=Packaging_waste_statistics (accessed on 14 March 2025).
  5. Lebreton, L.; Slat, B.; Ferrari, F.; Sainte-Rose, B.; Aitken, J.; Marthouse, R.; Hajbane, S.; Cunsolo, S.; Schwarz, A.; Levivier, A.; et al. Evidence That the Great Pacific Garbage Patch Is Rapidly Accumulating Plastic. Sci. Rep. 2018, 8, 4666. [Google Scholar] [CrossRef]
  6. Bakir, A.; Desender, M.; Wilkinson, T.; Van Hoytema, N.; Amos, R.; Airahui, S.; Graham, J.; Maes, T. Occurrence and Abundance of Meso and Microplastics in Sediment, Surface Waters, and Marine Biota from the South Pacific Region. Mar. Pollut. Bull. 2020, 160, 111572. [Google Scholar] [CrossRef]
  7. Roy, P.; Mohanty, A.K.; Misra, M. Microplastics in Ecosystems: Their Implications and Mitigation Pathways. Environ. Sci. Adv. 2022, 1, 9–29. [Google Scholar] [CrossRef]
  8. Ta, A.T.; Pupuang, P.; Babel, S.; Wang, L.P. Investigation of Microplastic Contamination in Blood Cockles and Green Mussels from Selected Aquaculture Farms and Markets in Thailand. Chemosphere 2022, 303, 134918. [Google Scholar] [CrossRef]
  9. What Are Bioplastics? Available online: https://www.european-bioplastics.org/bioplastics/ (accessed on 10 November 2019).
  10. Rotondo, B.; Zych, A.; Marinelli, A.; Santi, R.; Del Curto, B.; Athanassiou, A.; Perotto, G. POMOPLA2: A Bio-Based Material Solution Valorizing Tomato By-Products for Circular Packaging Applications. J. Polym. Sci. 2024, 63, 493–503. [Google Scholar] [CrossRef]
  11. Sharma, R.; Jafari, S.M.; Sharma, S. Antimicrobial Bio-Nanocomposites and Their Potential Applications in Food Packaging. Food Control 2020, 112, 107086. [Google Scholar] [CrossRef]
  12. Pei, P.; Sun, Y.; Zou, R.; Wang, X.; Liu, J.; Liu, L.; Deng, X.; Li, X.; Yu, M.; Li, S. Comparing Four Kinds of Lignocellulosic Biomass for the Performance of Fiber/PHB/PBS Bio-Composites. BioResources 2023, 18, 7154–7171. [Google Scholar] [CrossRef]
  13. Ivorra-Martinez, J.; Verdu, I.; Fenollar, O.; Sanchez-Nacher, L.; Balart, R.; Quiles-Carrillo, L. Manufacturing and Properties of Binary Blend from Bacterial Polyester Poly (3-Hydroxybutyrate-Co-3-Hydroxyhexanoate) and Poly (Caprolactone) with Improved Toughness. Polymers 2020, 12, 1118. [Google Scholar] [CrossRef]
  14. Qiu, Y.; Fu, J.; Sun, B.; Ma, X. Sustainable Nanocomposite Films Based on SiO2 and Biodegradable Poly (3-Hydroxybutyrate-Co -3-Hydroxyhexanoate) (PHBH) for Food Packaging. e-Polymers 2021, 21, 72–81. [Google Scholar] [CrossRef]
  15. Lyu, J.S.; Lee, J.-S.; Han, J. Development of a Biodegradable Polycaprolactone Film Incorporated with an Antimicrobial Agent via an Extrusion Process. Sci. Rep. 2019, 9, 20236. [Google Scholar] [CrossRef]
  16. Lukic, I.; Vulic, J.; Ivanovic, J. Antioxidant Activity of PLA/PCL Films Loaded with Thymol and/or Carvacrol Using ScCO2 for Active Food Packaging. Food Packag. Shelf Life 2020, 26, 100578. [Google Scholar] [CrossRef]
  17. Santi, R.; Cigada, A.; Del Curto, B.; Farè, S. Modulable Properties of PVA/Cellulose Fiber Composites. J. Appl. Biomater. Funct. Mater. 2019, 17, 2280800019831224. [Google Scholar] [CrossRef]
  18. Lee, W.J.; Clancy, A.J.; Kontturi, E.; Bismarck, A.; Shaffer, M.S.P. Strong and Stiff: High-Performance Cellulose Nanocrystal/Poly (Vinyl Alcohol) Composite Fibers. ACS Appl. Mater. Interfaces 2016, 8, 31500–31504. [Google Scholar] [CrossRef]
  19. Cazón, P.; Velazquez, G.; Vázquez, M. Characterization of Mechanical and Barrier Properties of Bacterial Cellulose, Glycerol and Polyvinyl Alcohol (PVOH) Composite Films with Eco-Friendly UV-Protective Properties. Food Hydrocoll. 2020, 99, 105323. [Google Scholar] [CrossRef]
  20. Gholampour, A.; Ozbakkaloglu, T. A Review of Natural Fiber Composites: Properties, Modification and Processing Techniques, Characterization, Applications. J. Mater. Sci. 2020, 55, 829–892. [Google Scholar] [CrossRef]
  21. Chiellini, E.; Cinelli, P.; Imam, S.H.; Mao, L. Composite Films Based on Biorelated Agro-Industrial Waste and Poly (Vinyl Alcohol). Preparation and Mechanical Properties Characterization. Biomacromolecules 2001, 2, 1029–1037. [Google Scholar] [CrossRef]
  22. Arun, R.; Shruthy, R.; Preetha, R.; Sreejit, V. Biodegradable Nano Composite Reinforced with Cellulose Nano Fiber from Coconut Industry Waste for Replacing Synthetic Plastic Food Packaging. Chemosphere 2022, 291, 132786. [Google Scholar] [CrossRef]
  23. Sanjay, M.R.; Madhu, P.; Jawaid, M.; Senthamaraikannan, P.; Senthil, S.; Pradeep, S. Characterization and Properties of Natural Fiber Polymer Composites: A Comprehensive Review. J. Clean. Prod. 2018, 172, 566–581. [Google Scholar] [CrossRef]
  24. Väisänen, T.; Haapala, A.; Lappalainen, R.; Tomppo, L. Utilization of Agricultural and Forest Industry Waste and Residues in Natural Fiber-Polymer Composites: A Review. Waste Manag. 2016, 54, 62–73. [Google Scholar] [CrossRef]
  25. Pham, D.H.; Kumar, B.; Kim, J. Environment-Friendly, High-Performance Lignin-Derived and Polyvinyl Alcohol Blended Resin for All-Green Natural Fiber-Reinforced Composite. Int. J. Precis. Eng. Manuf. Technol. 2025, 12, 607–619. [Google Scholar] [CrossRef]
  26. Muthuraj, R.; Misra, M.; Mohanty, A.K. Injection Molded Sustainable Biocomposites from Poly (Butylene Succinate) Bioplastic and Perennial Grass. ACS Sustain. Chem. Eng. 2015, 3, 2767–2776. [Google Scholar] [CrossRef]
  27. ISO 14040: 2006; Environmental Management—Life Cycle Assessment—Principles and Framework. Available online: https://www.iso.org/standard/37456.html (accessed on 13 June 2024).
  28. Ramesh, M.; Deepa, C.; Kumar, L.R.; Sanjay, M.; Siengchin, S. Life-Cycle and Environmental Impact Assessments on Processing of Plant Fibres and Its Bio-Composites: A Critical Review. J. Ind. Text. 2022, 51, 5518S–5542S. [Google Scholar] [CrossRef]
  29. Tadele, D.; Roy, P.; Defersha, F.; Misra, M.; Mohanty, A.K. A Comparative Life-Cycle Assessment of Talc- and Biochar-Reinforced Composites for Lightweight Automotive Parts. Clean Technol. Environ. Policy 2020, 22, 639–649. [Google Scholar] [CrossRef]
  30. Beigbeder, J.; Soccalingame, L.; Perrin, D.; Bénézet, J.-C.; Bergeret, A. How to Manage Biocomposites Wastes End of Life? A Life Cycle Assessment Approach (LCA) Focused on Polypropylene (PP)/Wood Flour and Polylactic Acid (PLA)/Flax Fibres Biocomposites. Waste Manag. 2019, 83, 184–193. [Google Scholar] [CrossRef]
  31. Ita-Nagy, D.; Vázquez-Rowe, I.; Kahhat, R.; Quispe, I.; Chinga-Carrasco, G.; Clauser, N.M.; Area, M.C. Life Cycle Assessment of Bagasse Fiber Reinforced Biocomposites. Sci. Total Environ. 2020, 720, 137586. [Google Scholar] [CrossRef]
  32. Operato, L.; Vitiello, L.; Aprea, P.; Ambrogi, V.; Salzano de Luna, M.; Filippone, G. Life Cycle Assessment of Poly (Lactic Acid)-Based Green Composites Filled with Pine Needles or Kenaf Fibers. J. Clean. Prod. 2023, 387, 135901. [Google Scholar] [CrossRef]
  33. Miller, S.A.; Lepech, M.D.; Billington, S.L. Application of Multi-Criteria Material Selection Techniques to Constituent Refinement in Biobased Composites. Mater. Des. 2013, 52, 1043–1051. [Google Scholar] [CrossRef]
  34. Wu, Y.; Xia, C.; Cai, L.; Garcia, A.C.; Shi, S.Q. Development of Natural Fiber-Reinforced Composite with Comparable Mechanical Properties and Reduced Energy Consumption and Environmental Impacts for Replacing Automotive Glass-Fiber Sheet Molding Compound. J. Clean. Prod. 2018, 184, 92–100. [Google Scholar] [CrossRef]
  35. Bavasso, I.; Sergi, C.; Valente, T.; Tirillò, J.; Sarasini, F. Recycled Multi-Material Packaging Reinforced with Flax Fibres: Thermal and Mechanical Behaviour. Polymers 2022, 14, 4423. [Google Scholar] [CrossRef] [PubMed]
  36. Uitterhaegen, E.; Parinet, J.; Labonne, L.; Mérian, T.; Ballas, S.; Véronèse, T.; Merah, O.; Talou, T.; Stevens, C.V.; Chabert, F.; et al. Performance, Durability and Recycling of Thermoplastic Biocomposites Reinforced with Coriander Straw. Compos. Part A Appl. Sci. Manuf. 2018, 113, 254–263. [Google Scholar] [CrossRef]
  37. Wu, F.; Misra, M.; Mohanty, A.K. Challenges and New Opportunities on Barrier Performance of Biodegradable Polymers for Sustainable Packaging. Prog. Polym. Sci. 2021, 117, 101395. [Google Scholar] [CrossRef]
  38. Baniasadi, H.; Äkräs, L.; Madani, Z.; Silvenius, F.; Fazeli, M.; Lipponen, S.; Vapaavuori, J.; Seppälä, J. Development and Characterization of Polylactic Acid/Starch Biocomposites—From Melt Blending to Preliminary Life Cycle Assessment. Int. J. Biol. Macromol. 2024, 279, 135173. [Google Scholar] [CrossRef] [PubMed]
  39. ISO 527-2: 2012; Plastics—Determination of Tensile Properties. Part 2: Test Conditions for Moulding and Extrusion Plastics. Available online: https://www.iso.org/standard/56046.html (accessed on 22 April 2025).
  40. ASTM D638-14; Standard Test Method for Tensile Properties of Plastics. Available online: https://store.astm.org/d0638-14.html (accessed on 3 April 2025).
  41. Aliotta, L.; Gigante, V.; Coltelli, M.B.; Cinelli, P.; Lazzeri, A.; Seggiani, M. Thermo-Mechanical Properties of PLA/Short Flax Fiber Biocomposites. Appl. Sci. 2019, 9, 3797. [Google Scholar] [CrossRef]
  42. Faludi, G.; Hári, J.; Renner, K.; Móczó, J.; Pukánszky, B. Fiber Association and Network Formation in PLA/Lignocellulosic Fiber Composites. Compos. Sci. Technol. 2013, 77, 67–73. [Google Scholar] [CrossRef]
  43. Andreasi Bassi, S.; Biganzoli, S.; Ferrara, F.; Amadei, N.; Valente, A.; Sala, A.; Ardente, S. Updated Characterisation and Normalisation Factors for the Environmental Footprint 3.1 Method; Publications Office of the European Union: Luxembourg, 2023. [Google Scholar]
  44. Zampori, L.; Pant, R. Suggestions for Updating the Organisation Environmental Footprint (OEF) Method; Publications Office of the European Union: Luxembourg, 2019. [Google Scholar]
  45. Developer Environmental Footprint (EF). EF Reference Package 3.1. Available online: https://eplca.jrc.ec.europa.eu/LCDN/developerEF.html (accessed on 2 February 2025).
  46. Morancho, J.M.; Salla, J.M.; Cadenato, A.; Fernández-Francos, X.; Ramis, X.; Colomer, P.; Calventus, Y.; Ruíz, R. Kinetic Studies of the Degradation of Poly (Vinyl Alcohol)-Based Proton-Conducting Membranes at Low Temperatures. Thermochim. Acta 2011, 521, 139–147. [Google Scholar] [CrossRef]
  47. Budrugeac, P. Kinetics of the Complex Process of Thermo-Oxidative Degradation of Poly (Vinyl Alcohol). J. Therm. Anal. Calorim. 2008, 92, 291–296. [Google Scholar] [CrossRef]
  48. Mironova, M.; Makarov, I.; Golova, L.; Vinogradov, M.; Shandryuk, G.; Levin, I. Improvement in Carbonization Efficiency of Cellulosic Fibres Using Silylated Acetylene and Alkoxysilanes. Fibers 2019, 7, 84. [Google Scholar] [CrossRef]
  49. Capart, R.; Khezami, L.; Burnham, A.K. Assessment of Various Kinetic Models for the Pyrolysis of a Microgranular Cellulose. Thermochim. Acta 2004, 417, 79–89. [Google Scholar] [CrossRef]
  50. Rosenbaum, R.K.; Bachmann, T.M.; Gold, L.S.; Huijbregts, M.A.J.; Jolliet, O.; Juraske, R.; Koehler, A.; Larsen, H.F.; MacLeod, M.; Margni, M.; et al. USEtox—The UNEP-SETAC Toxicity Model: Recommended Characterisation Factors for Human Toxicity and Freshwater Ecotoxicity in Life Cycle Impact Assessment. Int. J. Life Cycle Assess. 2008, 13, 532–546. [Google Scholar] [CrossRef]
  51. Hertwich, E.G.; Gibon, T.; Bouman, E.A.; Arvesen, A.; Suh, S.; Heath, G.A.; Bergesen, J.D.; Ramirez, A.; Vega, M.I.; Shi, L. Integrated Life-Cycle Assessment of Electricity-Supply Scenarios Confirms Global Environmental Benefit of Low-Carbon Technologies. Proc. Natl. Acad. Sci. USA 2015, 112, 6277–6282. [Google Scholar] [CrossRef]
  52. Fico, D.; Rizzo, D.; De Carolis, V.; Montagna, F.; Palumbo, E.; Corcione, C.E. Development and Characterization of Sustainable PLA/Olive Wood Waste Composites for Rehabilitation Applications Using Fused Filament Fabrication (FFF). J. Build. Eng. 2022, 56, 104673. [Google Scholar] [CrossRef]
  53. David, G.; Croxatto Vega, G.; Sohn, J.; Nilsson, A.E.; Hélias, A.; Gontard, N.; Angellier-Coussy, H. Using Life Cycle Assessment to Quantify the Environmental Benefit of Upcycling Vine Shoots as Fillers in Biocomposite Packaging Materials. Int. J. Life Cycle Assess. 2021, 26, 738–752. [Google Scholar] [CrossRef]
  54. Bianchi, I.; Forcellese, A.; Mancia, T.; Simoncini, M.; Vita, A. Process Parameters Effect on Environmental Sustainability of Composites FFF Technology. Mater. Manuf. Process. 2022, 37, 591–601. [Google Scholar] [CrossRef]
  55. Cinardi, G.; D’Urso, P.R.; Arcidiacono, C.; Muradin, M.; Ingrao, C. A Systematic Literature Review of Environmental Assessments of Citrus Processing Systems, with a Focus on the Drying Phase. Sci. Total Environ. 2025, 974, 179219. [Google Scholar] [CrossRef]
  56. Piron, M.; Bovo, E.; Lucchetta, G.; Manzardo, A. Soft-Sensors to Drive Manufacturing toward Clean Production: LCA Based on Digital Twin. J. Clean. Prod. 2025, 498, 145192. [Google Scholar] [CrossRef]
  57. Naumann, G.; Famiglietti, J.; Schropp, E.; Motta, M.; Gaderer, M. Dynamic Life Cycle Assessment of European Electricity Generation Based on a Retrospective Approach. Energy Convers. Manag. 2024, 311, 118520. [Google Scholar] [CrossRef]
Figure 1. System boundaries and stages included in Scenarios 1 and 2.
Macromol 05 00030 g001
Figure 2. SEM micrographs of injection-moulded samples from (a) melt-blended and (b) cold-blended granules. Arrows indicate some fibre pullouts, whereas the dashed arrow points at a fibre with a low interfacial strength with PVOH. SEM micrographs of biocomposite granules after fracture in liquid nitrogen: (c) melt-blended and (d) cold-blended. (e) Represents the magnified area of the white rectangle in (c), whereas (f) is the magnified area in the white rectangle of (d). Magnification: 1000×, except (b,c), for which a magnification of 250× was used.
Macromol 05 00030 g002
Figure 3. TGA curves and weight derivatives for (a) melt-blended granules and (b) cold-blended granules. (c) TGA overlay of the cold- and melt-blended granules.
Macromol 05 00030 g003aMacromol 05 00030 g003b
Figure 4. Process contribution to the characterization stage in the calculation of impact assessment of conventional melt blending.
Macromol 05 00030 g004
Figure 5. Process contribution to the characterization stage in the calculation of impact assessment of innovative cold blending.
Macromol 05 00030 g005
Figure 6. Environmental impact weighting of the total impact for each composite production method.
Macromol 05 00030 g006
Figure 7. Boxplot of the environmental impact indicators’ reduction compared to the baseline scenario. Cold blending and sensitivity analysis results are reported. Computed data is from the characterization stage. “×” represents the mean value.
Macromol 05 00030 g007
Table 1. Formulations under investigation in this work.
FormulationPVOH
[w%]
CF
[w%]
Water
[w%]
Conventional melt blending70300
Innovative cold blending542323
Table 2. Melt-blending temperature profile (°C).
Zone 1Zone 2Zone 3Zone 4Zone 5Zone 6Zone 7Zone 8
155160165175178180180175
Table 3. LCI to produce the PMC according to Scenario S1.
Input or Output FlowType of ConstituentQuantity of the Constituent (Per Functional Unit)
InputPVOH0.7 kg
InputCellulose fibres0.3 kg
InputOven pre-heating—Electricity0.09 kWh
InputOven drying—Electricity1.65 kWh
InputExtruder pre-heating—Electricity0.09 kWh
InputExtruder pre-heating—Water7.23 L
InputExtruder melt blending—Electricity1.40 kWh
InputExtruder melt blending—Water77.30 L
InputBiocomposite granulation—Electricity0.015 kWh
OutputPVOH-cellulose fibres PMC granules1 kg
OutputWastewaters (untreated)84.53 L
Table 4. LCI to produce the PMC according to Scenario S2.
Input or Output FlowType of ConstituentQuantity of the Constituent (Per Functional Unit)
InputPVOH0.7 kg
InputCellulose fibres0.3 kg
InputTap water0.3 L
InputDry blending—Electricity0.01 kWh
InputCold blending—Electricity0.07 kWh
InputOven pre-heating—Electricity0.125 kWh
InputOven drying—Electricity1.16 kWh
OutputPVOH-cellulose fibres PMC granules1 kg
Table 5. Melt-blending temperature profile (°C) and screw rpm.
Production ProcessYoung’s Modulus (3%) [MPa]Tensile Strength [MPa]Elongation at Break [%]
Conventional melt blending242 ± 3212.4 ± 1.413.4 ± 3.8
Innovative cold blending137 ± 159.5 ± 0.322.5 ± 0.6
Disclaimer/Publisher’s Note: The statements, opinions and data contained in all publications are solely those of the individual author(s) and contributor(s) and not of MDPI and/or the editor(s). MDPI and/or the editor(s) disclaim responsibility for any injury to people or property resulting from any ideas, methods, instructions or products referred to in the content.

