Article

Thermal Evaluation of Biocomposites Made from Poly(Lactic Acid) and Cottonseed Byproducts

1
United States Department of Agriculture, Agricultural Research Service, Southern Regional Research Center, 1100 Allen Toussaint Blvd., New Orleans, LA 70124, USA
2
Mechanical Engineering Department, University of Massachusetts Lowell, Lowell, MA 01854, USA
3
Plastics Engineering Department, University of Massachusetts Lowell, Lowell, MA 01854, USA
4
The HEROES Initiative, Center for Advanced Materials, University of Massachusetts Lowell, Lowell, MA 01854, USA
*
Author to whom correspondence should be addressed.
Macromol 2025, 5(2), 16; https://doi.org/10.3390/macromol5020016
Submission received: 19 February 2025 / Revised: 13 March 2025 / Accepted: 2 April 2025 / Published: 8 April 2025

Abstract

:
Poly(lactic acid) (PLA) is derived from sugar-based materials. While it is a leading sustainable biopolymer, PLA has been integrated with other agricultural coproducts (e.g., lignin, protein, and starch) to reduce its cost and enhance its modulus and biodegradability. Cottonseed oil and meal are the byproducts of the cotton fiber industry. In this work, four biocomposites were formulated with PLA, cottonseed oil, washed cottonseed meal, and plasticizing reagent glycerol with different formulation ratios. The thermal degradation behaviors were examined via thermogravimetric (TG) analysis under air and nitrogen conditions with the neat PLA sample as a control. The thermal decomposition characteristic values were impacted by both the biocomposite formulation and the heating rates of 1, 2, 5, and 10 °C min−1. Results from two kinetic modeling methods that were examined indicated that the activation energy was relatively steady for the neat PLA in the whole degradation process. Generally, the low activation energy values of biocomposites other than PLA under nitrogen conditions implied that these cottonseed byproduct constituents promote the thermal decomposition of these biocomposites. However, the presence of oxygen would confound the thermal decomposition of the biocomposites, as shown by variable activation energy curves with higher values under air conditions. TG-FTIR analysis revealed that the major gaseous compounds were carbonyl, carbon dioxide, carbon monoxide, methane, and water, which were derived from the thermal decomposition of the biocomposites.

1. Introduction

Lactic acid [CH3CH(OH)COOH] is an organic acid that can be derived via fermentation from carbohydrates of agricultural products and byproducts (e.g., molasses, corn, and cottonseed [1,2]. Poly(lactic acid) {PLA, (C3H4O2)n or [–C(CH3)HC(=O)O–]n} is the product of polycondensation of lactic acid and/or ring-opening polymerization of its cyclic dimer lactide {[–C(CH3)HC(=O)O–]2} [3]. As a biodegradable polyester, PLA has attracted considerable research interest in the last couple of decades because of its good processability and properties compared with other agricultural biomass materials. For instance, biocomposite products have been made from PLA blended with cinnamon essential oil [4], corn starch [5], cottonseed byproducts [6,7], distiller’s dried grains with solubles [8], jute fiber [9], rice husk [10], soy hull, and protein [11,12,13], tomato peel, and carotenoids extracts [14,15]. These green biocomposite materials show great potential for food packaging and horticultural and agricultural applications for a sustainable economy.
As PLA is a highly versatile thermoplastic material, it is expected that these PLA-based biocomposites may be sensitive to thermal stability or degradation [16,17]. Thus, the characterization of the thermal stability of PLA composite products is important for developing and managing strategies for processing, potential application, thermal recycling, and the complete life cycle of these products. A comprehensive knowledge of thermal and thermo-oxidative decomposition (degradation) kinetics and characteristics would play a crucial role in determining the processing and recycling conditions of relevant PLA products. Thermogravimetric analysis (TGA) and its differential thermal analysis are frequently used for kinetic studies of thermal decomposition of solid materials [16,18]. While the analyses can be performed with a simple preparation of a small quantity of the sample, relevant kinetic parameters (e.g., apparent activation energy-Ea, pre-exponential factor, reaction order, and decomposition rate) can be calculated by model-fitting methods or model-free methods [18]. Unlike a model-fitting method, a model-free method is based on the isoconversional principle so that it can measure the Ea values as a function of the degree of conversion. Thus, the Ea parameters derived from model-free methods are considered more reliable since there is no need to assume that any reaction mechanism is functional [19]. Two common model-free isoconversional approaches are the Flynn–Wall–Ozawa (FWO) method [20,21] and the Friedman method [22,23]. Derived from the FWO method, lower Ea values for thermo-oxidative and thermal degradation (under nitrogen) of starch/PLA composites implied an accelerated effect on thermal degradation by oxygen [16]. The FWO method was applied to study the local activation energy of a flame-retardant thermoset PLA [24]. In that research, the authors reported that the Ea values of the flame-retardant thermoset PLA were lower than that of the thermoset PLA, in which the conversion of thermal degradation ≤15%. However, the order of Ea values was reversed, with the degradation conversion >15% attributed to the slowdown of the process of thermal degradation by the dehydration charcoal effect of the phosphorous compound in the flame-retardant samples. Similarly, Nam et al. [18] adopted the Friedman and FWO methods to evaluate the effect of a urea additive on the thermal decomposition kinetics of phosphorus-based, cotton nonwoven fabric flame-retardant. The researchers found that the two methods produced consistent results revealing a dual function of urea additive in the thermal decomposition kinetics, depending on its concentration. In a recent work [25], both methods were applied to investigate the thermal kinetics of the pyrolysis of de-oiled neem seeds, which were subjected to thermal analysis in a nitrogen flow at four different heating rates (5, 10, 15, and 20 K min−1). They reported that Ea values were consistently higher from the computation than from the FWO method for both the devolatilization and degradation steps of the pyrolysis.
Thermogravimetry (TG) hyphenated to Fourier transform infrared spectroscopy (TG-FTIR) is an analytic tool to detect the evolving gaseous products of thermal decomposition of biomass samples in the laboratory [26,27]. It provides the unique capability of simultaneous real-time evaluation of the composition and evolution of volatile (i.e., gaseous) functional groups/compounds accompanying the transient mass loss during the laboratory thermal decomposition process of a sample, which cannot be obtained by the TG and FTIR individually. In other words, the TG-FTIR analysis would contribute to a better understanding of the thermal degradation behavior, degradation products, and mechanism. This technology revealed that thermal degradation of PLA and PLA/starch composites yielded mainly the volatile gaseous products of lactide, cyclic oligomers, aldehydes, CO2, CO, and H2O [28,29].
For the valorization of cotton biomass byproducts, PLA composites with some cotton byproducts have been explored by different research groups in the last decade. Sutivisedsak et al. [30] showed that cotton bur and cottonseed hull could be used as the fillers for PLA and low-density polyethylene composites to lower the cost of the composite products. Zhou et al. [31] reported the enhanced mechanical properties of PLA composites based on their in situ crosslinking with maleic anhydride-modified cellulose nanocrystals extracted from cottonseed hulls. Sangeetha et al. [32] isolated nanofibrillated cellulose from waste cotton and applied it to improve the PLA blend’s mechanical properties. Similarly, Biswas et al. [6] formed bilayer PLA–cottonseed protein films for packaging applications by a “solvent casting” method. In a recent work [7], four-component biocomposites were formulated with PLA as the major matrix, with cottonseed meal as a filler, cottonseed oil as a compatibilizer, and glycerol as a plasticizer. As a continuation of the PLA-cotton byproducts composite research and assessment of future applications, this work investigated thermal and thermos-oxidative stability and kinetics of the PLA composites with cottonseed meal and oil. The rationale was to use two model-free isoconversional methods (Friedman and FWO) to examine the degradation kinetics. Therefore, the objectives of this study were to (1) assess degradation mechanisms based on the Ea values of degradation derived from the experiments, (2) monitor the thermal decomposition processes by using TG-FTIR, and analyze the roles of the individual components in thermal and thermo-oxidative degradation. The information and knowledge derived from this work will contribute to the understanding of the degradation process of the PLA–cotton byproduct composites and provide meaningful guidance for targeted stabilization of these composites. This will also be beneficial for the recycling of relevant PLA products for the circular economy.

2. Materials and Methods

2.1. Materials

A PLA material, Ingeo 3251D, was purchased from a commercial entity, Jamplast Inc., (Ellisville, MO, USA). Per the manufacturer’s information, the relevant property parameters were a specific gravity of 1.24, relative viscosity of 2.5, crystalline melt temperature of 155–170 °C, and glass transition temperature of 55–60 °C. Anhydrous glycerol (GLY) was purchased from J. T. Baker Company (Mallinckrodt Baker, Inc., Phillipsburg, NJ, USA). Washed cottonseed meal (WCSM) was made in-house from defatted cottonseed meal as reported previously [33]. Food-grade cottonseed oil (CSO) was purchased from a local market (New Orleans, LA, USA). The biocomposites were made by hot press molding as described before [7]. The compositions of the five products are presented in Table 1, and the products are shown in Figure 1.

2.2. Instrumental Analysis

The thermogravimetric analysis was performed on an SDT 650 thermal gravimetric analyzer (TA Instrument, New Castle, DE, USA) under nitrogen and air, respectively. The analytic parameters were set up based on references from previous publications [18,29]. About 5 mg of the powdered biocomposites were evenly placed on the bottom of a ceramic pan. Flow rates were set at 100 mL min−1 for both balance (N2) and sample (N2 or air). The heating temperature was increased from room temperature (23 °C) to 600 °C. The thermogravimetric data of each sample were collected at four heating ramp rates of 1, 2, 5, and 10 °C min−1. A triplicate analysis was performed for each treatment (condition).
TG-FTIR measurements were carried out for the on-line analysis of the gaseous products formed during thermal degradation in the presence of N2 atmosphere with a TGA analyzer (TGA5500, TA instrument, New Castle, DE, USA) coupled with an FTIR spectrophotometer with DTGS KBr detector (Thermoscientific Nicolet iS50, Waltham, MA, USA). The sample mass was fixed at 9 ± 0.2 mg, and the TGA was heated from room temperature to 600 °C at 10 °C min−1. The sample was purged at 50 mL N2 min−1, and the transfer line and IR cell were kept at 300 °C. The FTIR spectra of the gaseous products were scanned six times from 400 to 4000 cm −1 with a resolution of 8 cm−1 [27].

2.3. Kinetic Calculation

The model-free Friedman and FWO methods were utilized to compute and predict Ea parameters as described before [17,18]. The step-by-step calculation details are listed in [18] with AKTS-Thermokinetics software (version 4.46) [34]. Generally, both methods are based on the following fundamental kinetic equation combined with the Arrhenius expression of the temperature-dependent rate constant.
d α d t = A e x p ( E a / R T ) f ( α )
where α is the conversion of reaction, (W0 − Wt)/(W0 − Wf) (where W0, Wt, and Wf refer to the mass at initial, specific time t, and final times of the reaction conversion, respectively), T is the absolute temperature, A is the preexponential factor, Ea is the activation energy, R is the gas constant, and f(α) is the reaction model.
The Friedman method is a plot of ln(da/dt) as a function of 1/T at a given temperature, which leads to a straight line, the slope of which provides the Ea.
ln d α d t = ln A f α E a / R T
Unlike the derivative da/dt of the Friedman approach, the FWO method adopts an integration approach as follows: l o g β = log A E a R g α 2.315 0.457 E a R T .
β (dT/dt) is the heating rate in the non-isothermal experiment, and g(α) is the relevant integration. The Eα value is obtained from the slope of a linear fit to the plot logβ against 1/T.

3. Results and Discussion

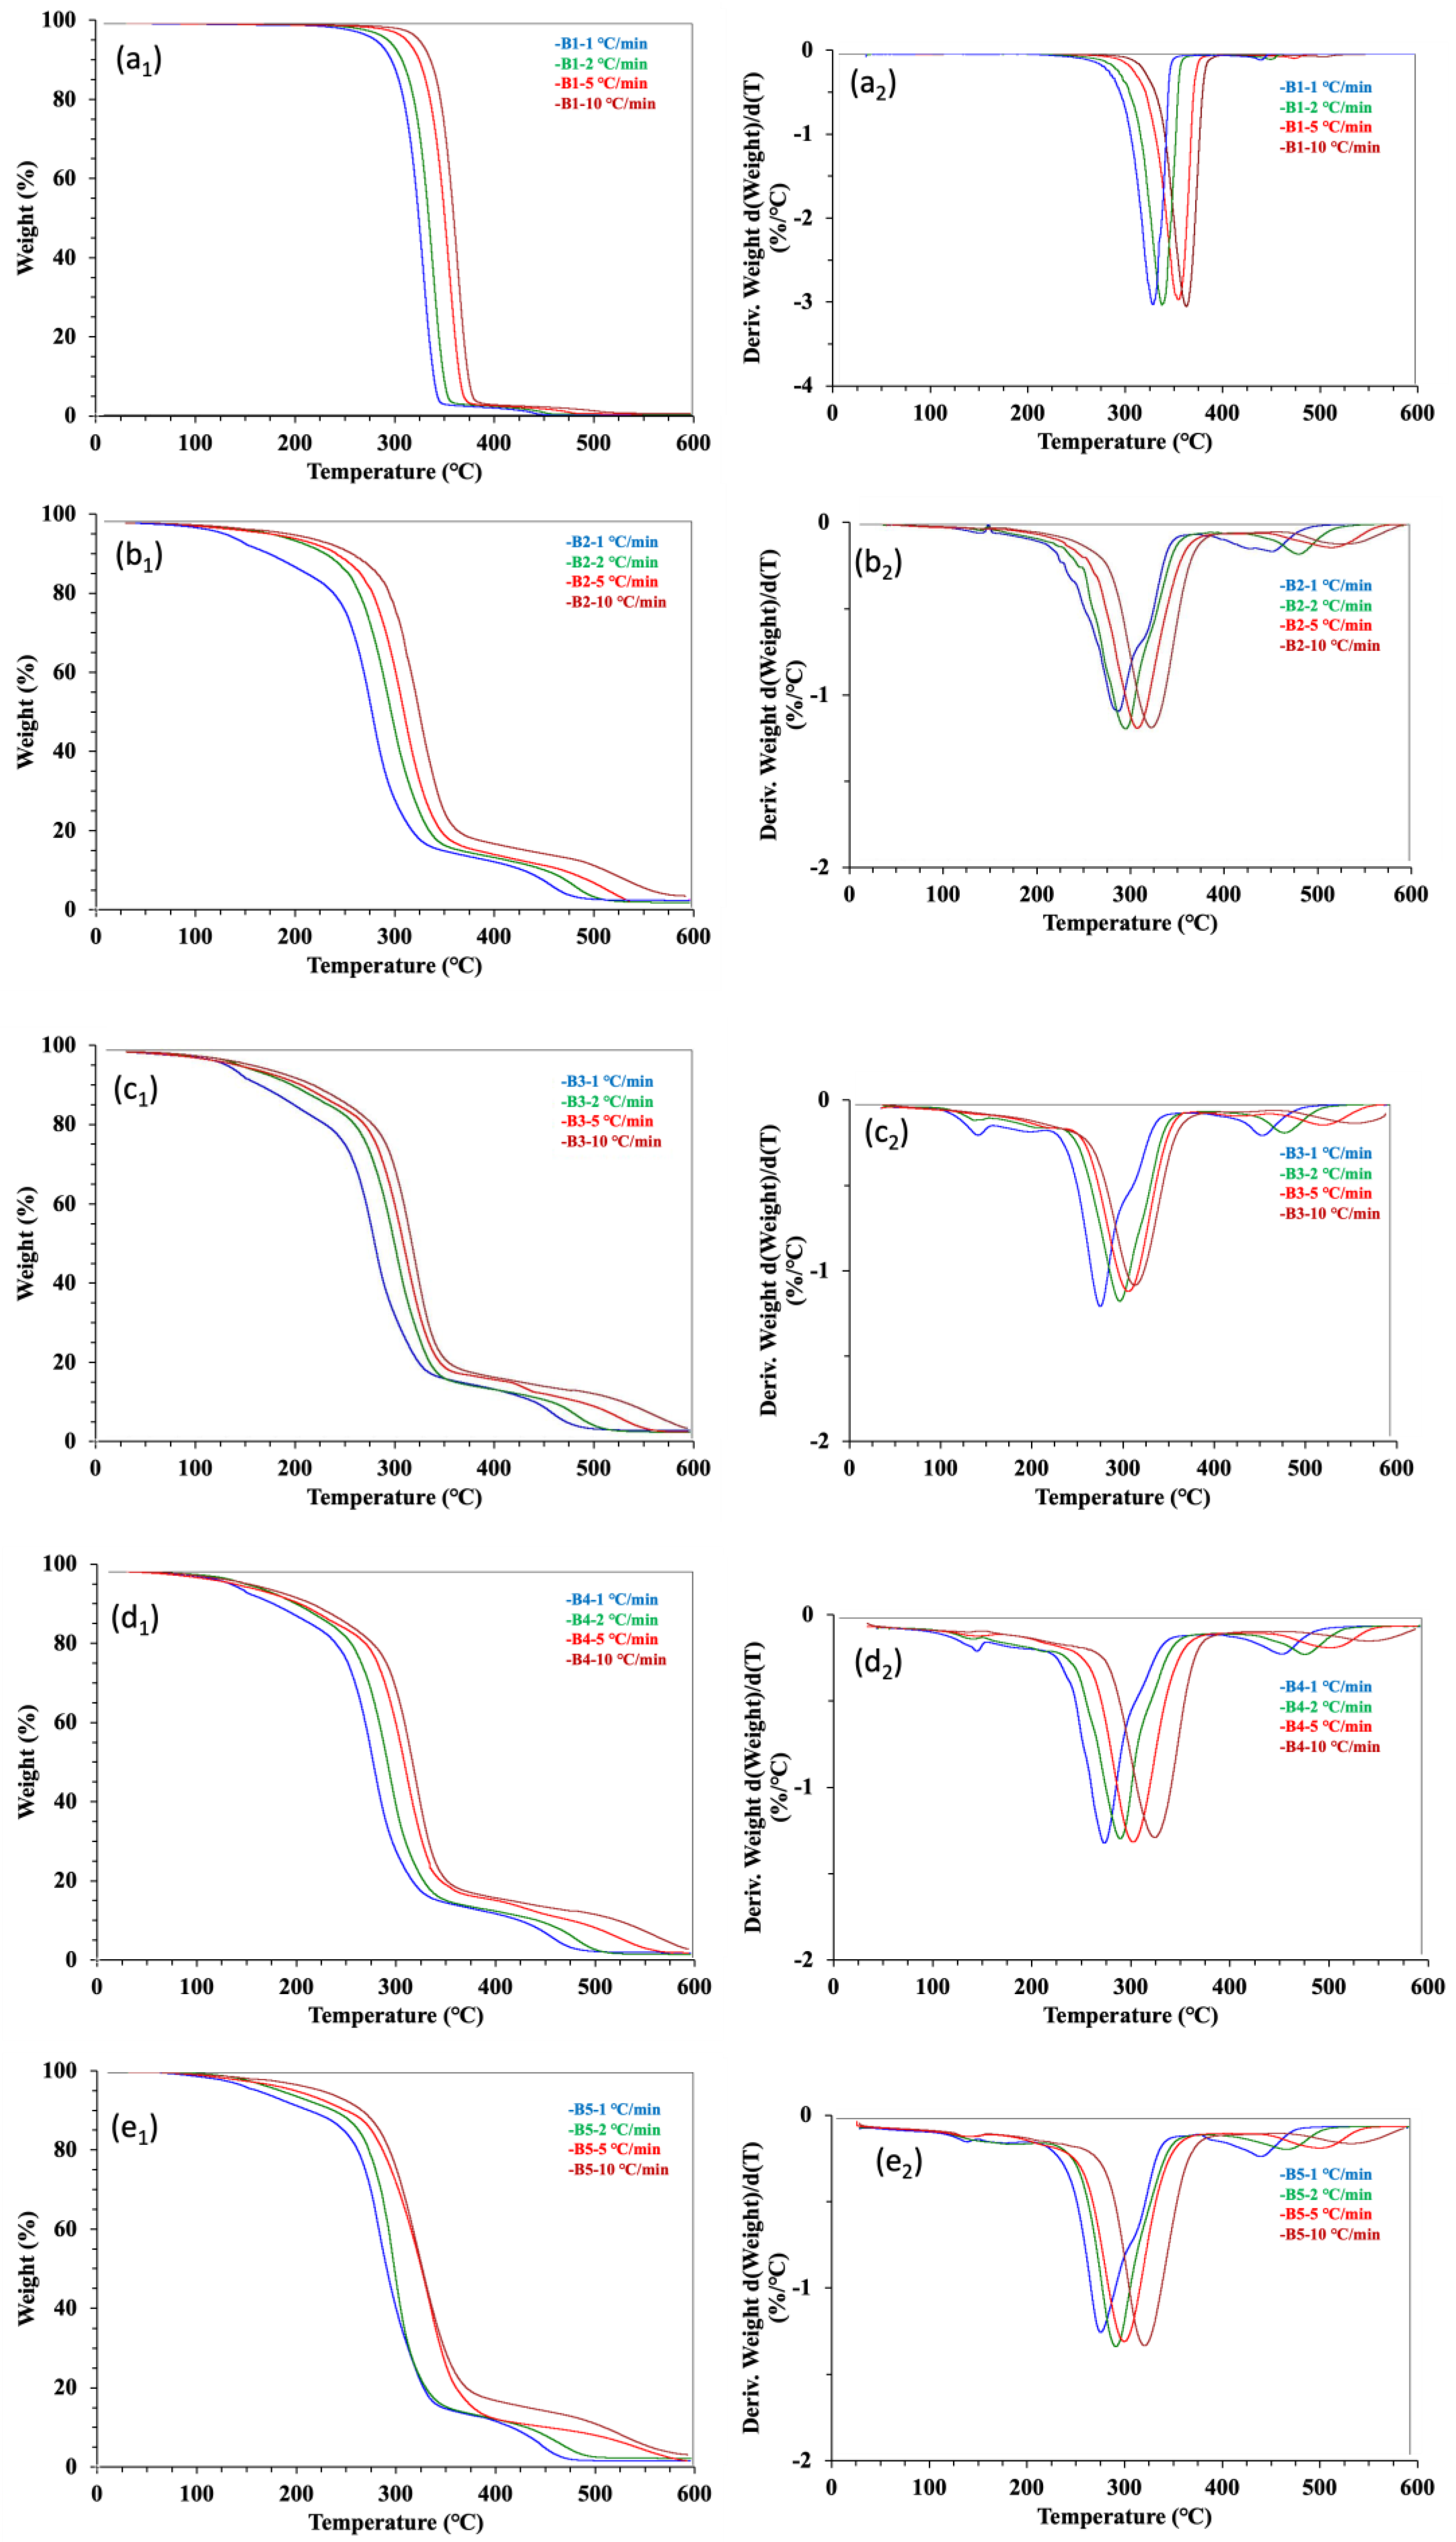
3.1. Thermal Degradation Process

To evaluate the thermal degradation stability, a TG analysis was performed at four heating rates of 1, 2, 5, and 10 °C min−1 in N2 atmosphere. The TG and DTG plots of the five samples are presented in Figure 2. The neat PLA sample B1 yielded smooth TG and DTG curves. The thermogravimetric behaviors of the neat PLA showed the typical one-stage mass loss of the testing samples over the heating temperature range from 50 to 600 °C [17,29]. This stage showed a decomposition with the mass loss of most organic materials occurring from 260 to 300 °C. The third stage was a char/carbonization formation with slight mass loss. Three temperature parameters (To—onset degradation temperature, Tm—maximum mass loss temperature, and Te—end degradation temperature) were applied to separate the three stages of the degradation process. The heating rate affected the thermogravimetric measurements, as higher heating rates made both TG and DTG curves shift to the right (i.e., increasing values of the temperature parameter). The impact of the heating rate was due to the factors of the time–temperature superposition principle, thermal lag, and heat transfer limitations [17]. For clarity, Table 2 lists only the average values of the thermogravimetric parameters measured with the four heating rates. Calculating from the mass loss in the first stage before the To point, the moisture loss of B1 was not obvious (1%) (Table 2), confirming the inherent hydrophobicity of PLA [35]. In the second stage of the main degradation, the rapid decomposition of the sample occurred between 279 and 389 °C, with a maximal decomposition rate of around 343 °C. During the process, about 98% of the mass of B1 was lost, leaving < 1% as the char residues. The quantitative data of the neat PLA sample were consistent with those qualitative observations reported previously [13,36].
One- or two-step processes may be involved in the thermal degradation of PLA-based composites. Two-step thermal decomposition mechanisms were observed with PLA–polypropylene and PLA–spice essential oil biocomposites [17,36,37]. However, a one-step process observed with PLA–soy protein and PLA–starch biocomposites [13,29]. The difference between one- and two-step processes of the two types of PLA composites should partly be due to the evaporable characteristic of the oil component with boiling points in the thermal degradation range. The general characteristics of the thermogravimetric observations of the four cotton-byproduct-contained biocomposite samples (B2 to B5) (Figure 2b–e) were similar to that of the neat PLA sample B1, with a one-step mass loss. This implied the thermal similarity or compatibility of WCSM, CSO, and GLY to PLA in B2 to B5 samples. The impact of the three additives was mainly reflected in the downward shifts in the triple temperature parameters at 30–50 °C (Table 2).
On the other hand, there were no significant differences (p > 0.05) in the triple temperature parameters, indicating that there were fewer impacts from the biocomposite formulations tested in this work. Similarly, the changes in mass loss parameters were also observed for B2 to B5 samples, relative to B1. The changes were more confounded than the temperature parameters. It seemed the chemical compositions of WCSM, CSO, and GLY played a key role in the confounding effect, as WCSM has more diverse organic compounds and also higher mineral contents than CSO and GLY [26,38]. For example, protein, fiber, as well as minerals of the solid additive WCSM could undergo thermal degradation in a range roughly from 240 to 350 °C [39]. GLY and CSO were liquid components with the boiling points around 290 and 230 °C, respectively. Thus, the evaporation of CSO and GLY might have also made certain contributions to the weight loss in B2 to B5 at the temperature lower than 300 °C. This led to a higher % of mass loss at the first stage of the decomposition but also a higher char left at the end of the TG test analysis.

3.2. Thermo-Oxidative Degradation Process

TG analysis under air atmosphere was applied to evaluate the thermos-oxidative degradation stability of the five samples. The TG and DTG curves of the thermos-oxidative degradation were still best characterized by a single-step decomposition process (Figure 3). The TG and DTG curves of the raw materials PLA and WCSM are enclosed in the Supplementary Materials. The PLA showed a neat and fast one-step thermal degradation, but the thermal degradation of the WCSM was more complicated due to the different thermal degradation behaviors of WCSM components (e.g., protein, cellulose, and lignin) [7]. The hot-pressed PLA bar sample showed similar thermogravimetric features of the raw material PLA. On the other hand, the TG and DTG trends in other composite bar samples were affected by the WCSM thermal characteristics. The thermos-oxidative degradation feature of the PLA–cottonseed byproducts composite was consistent with that of the PLA–starch biocomposite [29]. As reported in the literature [17,29], the neat PLA curves in the presence of air atmosphere were nearly identical to those under N2 (Figure 2a), which indicated that atmospheric conditions did not noticeably affect PLA degradation. However, some visual differences were observed between the thermal and thermos-oxidative decomposition of the PLA–cottonseed byproducts when Figure 2 and Figure 3 were compared. First, the DTG curves of the thermos-oxidative degradation showed a shoulder after the major peak, reflecting that the degradation mechanism of the decomposition changed slightly. Second, the third stage of the thermos-oxidative decomposition started later (i.e., higher Te values) and with higher percentages of char residues. The changes in the third-stage parameters were more obvious based on the quantitative data of Te and char (%) in Table 2. This observation was different from that of the PLA–starch biocomposite, in which the residual chars were almost 0% in oxygenated (O2) conditions due to further volatilization of the post-second-stage solid residues [29]. Previously, Nam et al. [34] observed about 60 °C higher Te parameter of brown cotton fiber exposed to air conditions than under N2. It seemed the non-carbohydrate components (e.g., proteins, lignins, and minerals) in WCSM could have reacted with oxygen in the air to form some retarding intermediates/residues, delaying a thorough decomposition of these PLA–cottonseed byproduct composite samples. Another possible affecting factor was the CSO component which contained tocopherol [40]. Acting as an antioxidant and thermal stabilizer [41,42], tocopherol could have led the thermo-oxidation resistance (greater activation energy), and more char formed under oxidizing (air) conditions than under the N2 environment.

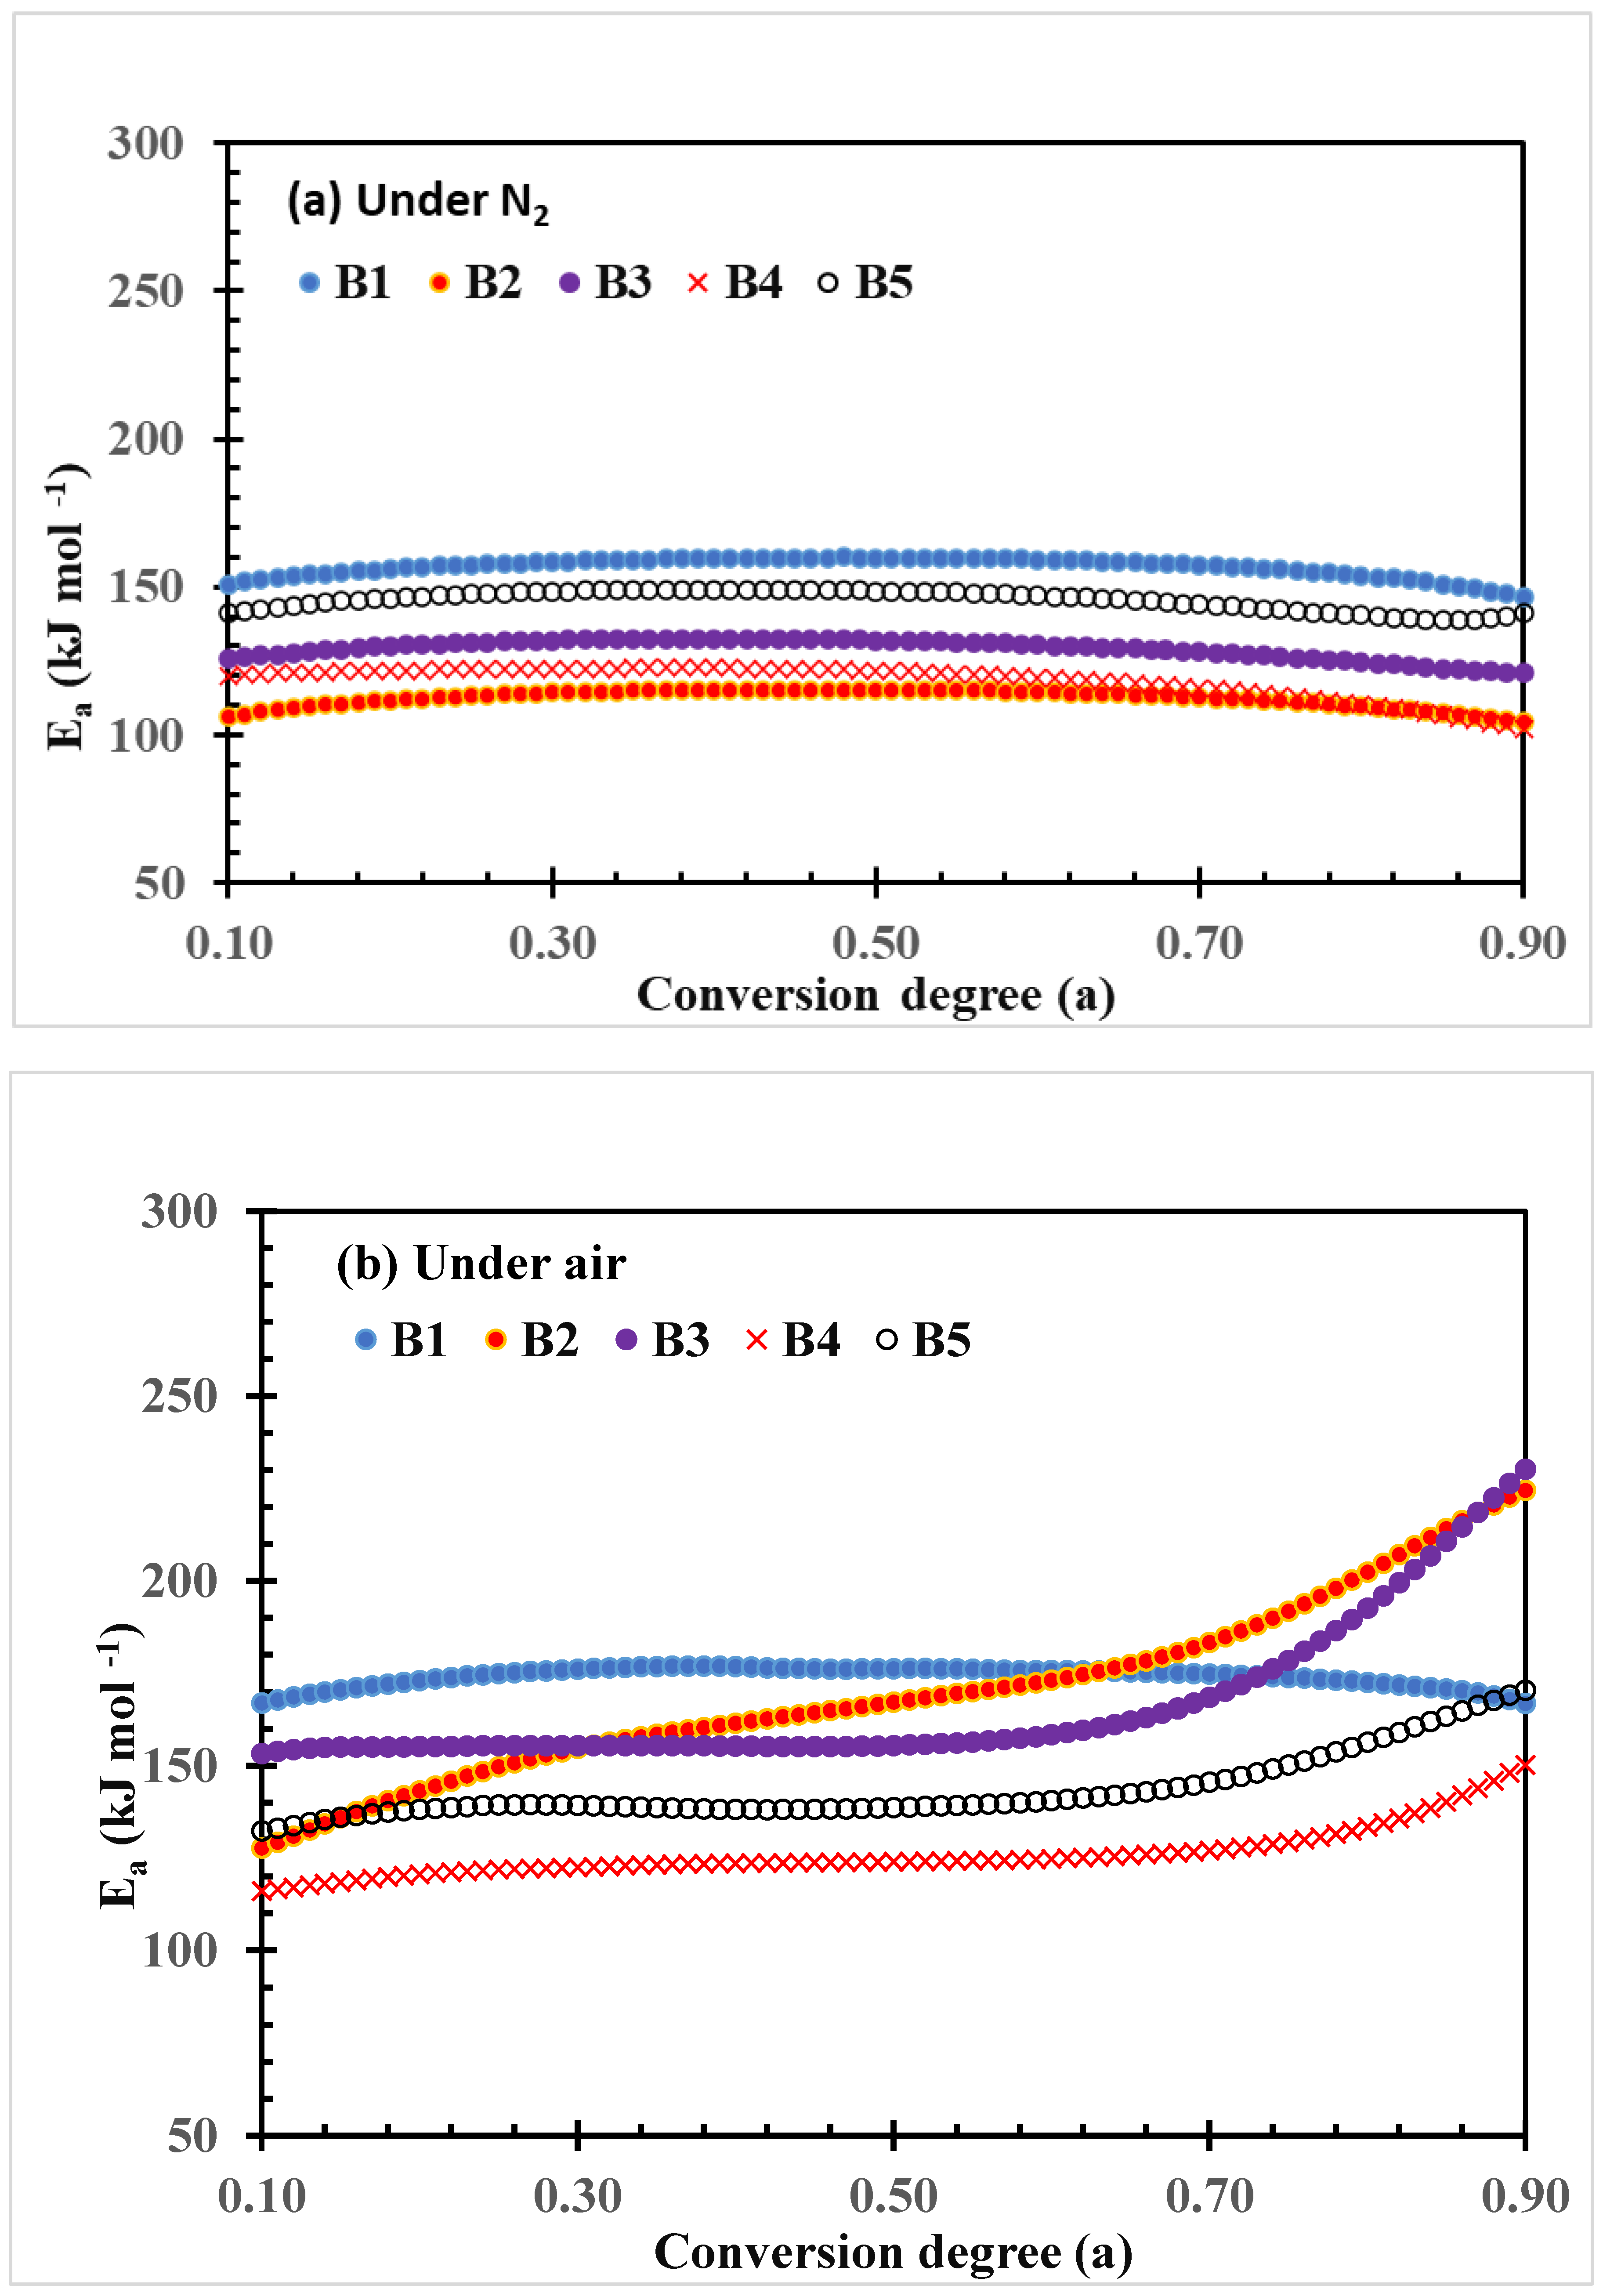
3.3. Thermal and Thermo-Oxidative Decomposition Kinetics

The plots of activation energy (Ea) changes with the conversion degree of thermal decomposition of PLA–cottonseed byproduct biocomposites under N2 and air conditions calculated by the FWO method are shown in Figure 4. The quantitative data of the change, including ranges, averages, and the standard deviations of Ea parameter values, are listed in Table 3. The Ea values of the neat PLA sample B1 are kept unchanged over the conversion in both thermal and thermo-oxidative decomposition processes even though the Ea values of the thermos-oxidative decomposition were higher than those of thermal decomposition under N2 as shown by the plots (Figure 4) or by the three quantitative values (Table 3). This observation implied the relatively steady decomposition processes of neat PLA samples, which also were reported previously [43,44].
However, the range and average parameter in this study (147–160, and 156.8 were higher than the two in Yuzay, Auras [43] (110–120 and 119.0 kJ mol−1), but the standard deviations were quite similar (3.3 vs. 2.9 kJ mol−1), indicating the magnitude of change was roughly the same. On the other hand, Lv et al. [29] reported that upshift values ranging from 146 to 192 kJ mol−1 were recorded under N2 and 126 to 191 kJ mol−1 under O2 conditions. The preparation conditions for testing PLA bars might have been a major factor in the differences in quantitative data, while the trends are generally similar. Under N2 conditions, the Ea plots of other composite samples exhibited similar changing patterns but with lower values during the entire thermal degradation process (Figure 4a and Table 3). The general order of the Ea values is B1 > B5 > B3 > B4 >B2, which indicates that these cottonseed byproduct constituents promoted the thermal decomposition of the PLA composites. In contrast, under air conditions, the Ea plots of the four PLA–cottonseed byproduct samples (B2–B5) were quite different from that of the neat PLA sample B1, characterized by the higher Ea values with increasing conversion degrees (Figure 4b) and greater standard deviations (Table 3). This observation implied some differences in the degradation mechanisms between PLA and PLA–cottonseed byproduct composites under air conditions. It is reasonably assumed that oxygen in the air might have formed certain polymeric or oxide compounds from the cottonseed components during the heating process in which higher Ea was needed for further decomposition. For example, the formation of polymerization compounds was previously reported during the thermal oxidation of cottonseed oil [45]. The greater Ea increases in B2 and B3 compared to B3 and B5 (224 and 230 vs. 150 and 170 kJ mol−1 at the highest ranges) implied that CSO, more than GLY, is a greater factor that is impacting the function, as the CSO was triglycerides of various C-length fatty acids with different boiling points. Previously, Sedek et al. [46] reported that the thermal stability of CSO increased with mixing with other high-boil-point oil products during the frying process. Thermal polymerization of triacylglycerols of CSO under air circumstance could have further complicated the degradation process [47], leading to higher Ea values with high CSO–content composites. In addition, the increase in Ea values after conversion degree 0.70 in Figure 4b implied that possible two-step reaction mechanisms involved the thermo-oxidative degradation of the four composite samples. When dealing with such multiple-degradation steps, Friedman’s analysis may provide more reliable results than FWO.
The plots of Ea parameters changed with the conversion degree of thermal decomposition of PLA–cottonseed byproduct biocomposites calculated per Friedman method are shown in Figure 5. These plots showed a general trend similar to the plots calculated per FWO method (Figure 4). At higher conversion degrees (0.5–0.9), however, the differences in Friedman Ea values between the five samples were greater than the FWO Ea values. This is because the Friedman method is sensitive to experimental noise, so it tends to be numerically unstable because of employing the instantaneous rate value [48]. Das and Tiwari [44] investigated the thermal degradation kinetics of PLA and other plastics with five models. They also found that Friedman showed the largest spread of activation energy (97–120 kJ mol−1 with neat PLA), and the distributed profile is also discontinuous compared to other methods, including the FWO method (113–129 kJ mol−1). Zou et al. [48] reported similar ranges with higher Ea values of PLA from 161 to 188 (average 177.5) kJ mol−1 with the FWO method, but 172 to 196 (average 183.6) kJ mol−1 with the Friedman method. Even though both methods reveal the same trend of activation energies for the whole conversion range from 0.1 to 0.9. In other words, the lower Ea values at the beginning of these degradation processes implied that the initiation of degradation of these composites started at weaker links of the polymer chain and mostly followed side chain scission [44]. On the other hand, those Ea values calculated by each method increased with increasing the conversion degree, which should have indicated that those PLA composites underwent multi-step degradation mechanisms. It means that, in later stages, the degradation of the composite sample B3 and B5 under both N2 and air atmospheres as well as B2 and B4 under air atmosphere followed random chain scission, where the polymer chain breaks at any random position and forms various monomers and oligomers [44].

3.4. TG-FTIR Analysis

For reference, the FTIR spectra of the five composite samples are presented in Supplementary Figure S2. Briefly, the FTIR spectra for neat PLA (B1) and PLA-based biocomposites show a distinct carbonyl peak at 1750 cm−1. In the composite samples B2–B5, a broad hydroxyl (-OH) peak was observed around 3400 cm−1. The hydroxyl peak was more pronounced in sample B5 compared to the other biocomposites due to the higher weight percentage of additives containing hydroxyl groups (e.g., WCSM and glycerol) in this sample. The TG-FTIR spectra of the five samples are shown in Figure 6. In the three-dimensional graphics, the X, Y, and Z axes represent the wavenumber (cm−1), absorbance, and time of the thermal process, respectively. Overall, the highest spectral intensities, the release of gaseous products of thermal decomposition of neat sample B1 PLA was centered around 38 min of the thermal process. The time point of the maximal release of the gaseous products in other composite samples moved ahead between 30 and 35 min. This spectral observation was consistent with the results of Tm and Ea data. Thus, all three sets of data supported the hypothesis that the PLA–cottonseed byproduct composites were more susceptible to thermal decomposition than the neat PLA product.
All the TG-FTIR spectra in Figure 6 exhibited the characteristic strong or weak absorption gradients, at regions of 3000–3500, 2500–3000, 2100–2350, 1850–1600, and 1200–1000 cm−1. As observed in the literature [17,29,48], the typical peaks at 2100–2350 cm−1 were due to the emission of CO2 (around 2354 cm−1) and CO (around 2170 cm−1) gases with the decomposition of hydroxyl end-initiated ester [29]. The broad band in the range of 3000–2700 cm−1 represented hydrocarbon gases mainly CH4. The notable absorption peaks or peak clusters were at 1750, 1380–1445, and 2450–3000 cm−1. Those bands could be assigned functional groups of C=O, aldehyde C–H, and methyl groups, which could be an indication of aldehyde intermediates produced through the degradation of PLA. In addition, the bands at 1100 and 1750 cm−1 (the C–O stretching and C=O stretching of the carbonyl group, respectively) could also indicate that intermediates of lactides molecules, oligomeric rings, and acetaldehyde might have evolved plus carbon monoxide formed by ester interchange and chain hemolysis [17]. The minor peaks over 3500 cm−1 could be attributed to water yielded in the thermal process.
The four PLA–cottonseed byproduct composites showed similar FTIR spectral features of neat PLA samples even though the maximum peat times were different. This similarity indicated that no new gaseous products were formed during the pyrolysis of the PLA–cottonseed byproduct composites. This was at least partly because the gaseous products of the thermal decomposition of cottonseed biomass samples [26] were almost the same as those of PLA. The main differences between the four TG-FTIR spectra of B2–B5 from B1 were the relatively weaker intensities of the peaks in the range of 2000–3000 cm−1 compared to more apparent absorption peaks of B1 in the area. While the band strength of CO2 (around 2354 cm−1) was obvious, the peaks of CO gas (around 2175 cm−1) and CH4 (around 2900 cm−1) were much weaker. This fact indicated that the PLA–cottonseed byproducts composite preferably promoted the generation of CO2 over CH4 and CO. Therefore, the presence of cottonseed byproducts in the composites led to complete burn-out of PLA or these byproducts themselves. No effects of the biomass types on the gaseous products of thermal decomposition of PLA composites were reported with PLA starch [29]. This result confirmed that the non-PLA components did not affect the types of gaseous products of thermal degradation of PLA composites as observed previously with PLA–polypropylene and PLA–starch composites [17,29]. It is worth noting that for the weaker CO and CH4 emission with the composite samples B2 to B5, the neat PLA B1 sample implied an environmental advantage of these PLA–cottonseed byproduct composite products with less secondary pollution after degradation.

4. Conclusions

Poly(lactic acid) (PLA) biocomposites were formulated with cottonseed oil, defatted cottonseed meal, and plasticizing reagent glycerol. Their thermal degradation behaviors were examined under N2 and air conditions by thermogravimetric analysis and kinetic modeling. Inclusion of cottonseed byproducts remarkably reduced the thermal degradation temperature parameters of PLA by 20–50 °C. Two isoconversional kinetic modeling of the thermal degradation of PLA and PLA/cottonseed biocomposites showed that the activation energy was relatively steady for the neat PLA and composite materials based on the whole degradation process under N2 conditions. The general lower activation energy values of the biocomposites compared to the neat PLA implied that these cottonseed byproduct constituents promote the thermal decomposition of these biocomposites. However, unlike the observations under N2 conditions, the inconsistent trend of the changes in activation energy of these biocomposite samples in atmospheric air implied some different decomposition functions and mechanisms of these constituents in thermos-oxidative decomposition. The phenomenon of more variable activation energy curves with higher values indicated that the retarding intermediate materials were formed in the presence of oxygen. The main gaseous products (i.e., carbonyl compounds, carbon dioxide, carbon monoxide, methane, and water) from thermal degradation were similar between neat PLA and PLA–cottonseed byproduct composites. The emission of carbon monoxide and methane was relatively lower in the composite samples than in neat PLA. This detailed study on thermal and thermo-oxidative degradation kinetics of PLA–cottonseed materials could be used to estimate the possible management and recycling of the solid waste of these materials after use.

Supplementary Materials

The following supporting information can be downloaded at https://www.mdpi.com/article/10.3390/macromol5020016/s1, Supplemental Figure S1: TGA and DTG thermograms of raw materials poly(lactic acid) (PLA) and washed cottonseed meal (WCSM), and Supplemental Figure S2: FTIR spectra of 5 samples (B1 to B5) (PDF).

Author Contributions

Project conceptualization, Z.H.; methodology, Z.H., S.N., S.K., M.B.K. and R.N.; data curation, M.B.K., S.N. and Z.H.; investigation, Z.H., S.N., S.K., M.B.K. and R.N.; writing—original draft preparation, Z.H.; review and editing, S.N., S.K., M.B.K. and R.N. All authors have read and agreed to the published version of the manuscript.

Funding

This research received no external funding.

Data Availability Statement

The data presented in this study are available on request.

Acknowledgments

The authors would like to thank Catrina Ford for the preparation of the biocomposite samples. The authors also thank two anonymous reviewers for their insightful comments which have enhanced the scientific significance of this work. Mention of trade names or commercial products is solely to provide specific information and does not imply recommendation or endorsement by USDA. USDA is an equal opportunity provider and employer.

Conflicts of Interest

The authors declare no conflicts of interest.

References

  1. Bai, Z.; Gao, Z.; Sun, J.; Wu, B.; He, B. D-Lactic acid production by Sporolactobacillus inulinus YBS1-5 with simultaneous utilization of cottonseed meal and corncob residue. Bioresour. Technol. 2016, 207, 346–352. [Google Scholar] [CrossRef] [PubMed]
  2. Li, Y.; Wang, L.; Ju, J.; Yu, B.; Ma, Y. Efficient production of polymer-grade D-lactate by Sporolactobacillus laevolacticus DSM442 with agricultural waste cottonseed as the sole nitrogen source. Bioresour. Technol. 2013, 142, 186–191. [Google Scholar] [CrossRef] [PubMed]
  3. Hamad, K.; Kaseem, M.; Ayyoob, M.; Joo, J.; Deri, F. Polylactic acid blends: The future of green, light and tough. Prog. Polym. Sci. 2018, 85, 83–127. [Google Scholar] [CrossRef]
  4. Anuar, H.; Nur Fatin Izzati, A.; Sharifah Nurul Inani, S.; Siti Nur E’zzati, M.; Siti Munirah Salimah, A.; Ali, F.; Manshor, M. Impregnation of cinnamon essential oil into plasticised polylactic acid biocomposite film for active food packaging. J. Packag. Technol. Res. 2017, 1, 149–156. [Google Scholar] [CrossRef]
  5. Zamir, S.S.; Fathi, B.; Ajji, A.; Robert, M.; Elkoun, S. Biodegradation of modified starch/poly lactic acid nanocomposite in soil. Polym. Degrad. Stab. 2022, 199, 109902. [Google Scholar] [CrossRef]
  6. Biswas, A.; Cheng, H.N.; Kuzniar, G.; He, Z.; Kim, S.; Furtado, R.F.; Alves, C.R.; Sharma, B.K. Bilayer films of poly(lactic acid) and cottonseed protein for packaging applications. Polymers 2023, 15, 1425. [Google Scholar] [CrossRef]
  7. He, Z.; Cheng, H.N.; Ford, C.V.; Nam, S.; Fortier, C.; Santiago Cintron, M.; Olanay, O.M.; Uknalis, J. Four-ingredient blends of poly(lactic acid) with cottonseed oil and meal for biocomposite utilization. Macromol 2024, 4, 708–722. [Google Scholar] [CrossRef]
  8. Lu, H.; Madbouly, S.A.; Schrader, J.A.; Srinivasan, G.; McCabe, K.G.; Grewell, D.; Kessler, M.R.; Graves, W.R. Biodegradation behavior of poly(lactic acid)(PLA)/distiller’s dried grains with solubles (DDGS) composites. ACS Sust. Chem. Eng. 2014, 2, 2699–2706. [Google Scholar] [CrossRef]
  9. Zhou, Y.; Chen, C.; Xie, L.; Chen, X.; Xiao, G.; Qin, S.; Guo, J.; He, Y. The combined plasticization of jute and tung oil anhydride for jute fiber reinforced poly(lactic acid) composites. Polym. Polym. Compos. 2021, 29 (Suppl. S9), S1569–S1577. [Google Scholar] [CrossRef]
  10. Wu, C.-S.; Tsou, C.-H. Fabrication, characterization, and application of biocomposites from poly(lactic acid) with renewable rice husk as reinforcement. J. Polymer Res. 2019, 26, 44. [Google Scholar] [CrossRef]
  11. Rahman, M.M.; Dey, A.; Yodo, N.; Lee, C.W.; Grewell, D. Soybean by-products bioplastic (polylactic acid)-based plant containers: Sustainable development and performance study. Sustainability 2023, 15, 5373. [Google Scholar] [CrossRef]
  12. Liu, B.; Jiang, L.; Zhang, J. Extrusion foaming of poly(lactic acid)/soy protein concentrate blends. Macromol. Mater. Eng. 2011, 296, 835–842. [Google Scholar] [CrossRef]
  13. Yang, S.; Madbouly, S.A.; Schrader, J.A.; Srinivasan, G.; Grewell, D.; McCabe, K.G.; Kessler, M.R.; Graves, W.R. Characterization and biodegradation behavior of bio-based poly(lactic acid) and soy protein blends for sustainable horticultural applications. Green Chem. 2015, 17, 380–393. [Google Scholar]
  14. Stoll, L.; Rech, R.; Flôres, S.H.; Nachtigall, S.M.B.; de Oliveira Rios, A. Poly(acid lactic) films with carotenoids extracts: Release study and effect on sunflower oil preservation. Food Chem. 2019, 281, 213–221. [Google Scholar] [CrossRef]
  15. Kocak, E.; Cetin, M.S.; Kizilirmak Esmer, O.; Karahan Toprakci, H.A. Effects of tomato peel extract on morphological, chemical, thermal, and mechanical properties of poly (lactic acid). Iran. Polymer J. 2023, 32, 1135–1148. [Google Scholar]
  16. Lv, S.; Liu, X.; Gu, J.; Jiang, Y.; Tan, H.; Zhang, Y. Microstructure analysis of polylactic acid-based composites during degradation in soil. Int. Biodeterior. Biodegrad. 2017, 122, 53–60. [Google Scholar] [CrossRef]
  17. Karimpour-Motlagh, N.; Khonakdar, H.A.; Jafari, S.M.A.; Mahjub, A.; Panahi-Sarmad, M.; Kasbi, S.F.; Shojaei, S.; Goodarzi, V.; Arjmand, M. Influence of polypropylene and nanoclay on thermal and thermo-oxidative degradation of poly (lactide acid): TG-FTIR, TG-DSC studies and kinetic analysis. Thermochim. Acta 2020, 691, 178709. [Google Scholar]
  18. Nam, S.; Condon, B.D.; White, R.H.; Zhao, Q.; Yao, F.; Cintrón, M.S. Effect of urea additive on the thermal decomposition kinetics of flame retardant greige cotton nonwoven fabric. Polymer Degrad. Stabili. 2012, 97, 738–746. [Google Scholar]
  19. Çepelioğullar, Ö.; Haykırı-Açma, H.; Yaman, S. Kinetic modelling of RDF pyrolysis: Model-fitting and model-free approaches. Waste Manag. 2016, 48, 275–284. [Google Scholar] [CrossRef]
  20. Ozawa, T. A new method of analyzing thermogravimetric data. Bull. Chem. Soc. Jpn. 1965, 38, 1881–1886. [Google Scholar] [CrossRef]
  21. Flynn, J.H.; Wall, L.A. General treatment of thermogravimetry of polymers. J. Res. Nat. Bur. Stand. 1966, 70, 487–523. [Google Scholar]
  22. Friedman, H.L. Kinetics of thermal degradation of char-forming plastics from thermogravimetry. Application to a phenolic plastic. J. Polym. Sci. Part C Polym. Symp. 1964, 6, 183–195. [Google Scholar] [CrossRef]
  23. Chrysafi, I.; Ainali, N.M.; Bikiaris, D.N. Thermal degradation mechanism and decomposition kinetic studies of poly (lactic acid) and its copolymers with poly (hexylene succinate). Polymers 2021, 13, 1365. [Google Scholar] [CrossRef] [PubMed]
  24. Li, Y.; Qiang, Z.; Chen, X.; Ren, J. Understanding thermal decomposition kinetics of flame-retardant thermoset polylactic acid. RSC Adv. 2019, 9, 3128–3139. [Google Scholar]
  25. Aly, S.T.; Mahmoud, F.E.Z.; Sorour, M.A.; Abadir, M.F.; Saidy, M.I.E. Kinetics of pyrolysis of de-oiled neem seeds (Azadirachta indica). Biomass Conv. Bioref. 2025, 15, 7809–7826. [Google Scholar] [CrossRef]
  26. He, Z.; Nam, S.; Zhang, H.; Olanya, O.M. Chemical composition and thermogravimetric behaviors of glanded and glandless cottonseed kernels. Molecules 2022, 27, 316. [Google Scholar] [CrossRef]
  27. Nam, S.; Condon, B.D.; Liu, Y.; He, Q. Natural resistance of raw cotton fiber to heat evidenced by the suppressed depolymerization of cellulose. Polymer Degrad. Stabili. 2017, 138, 133–141. [Google Scholar] [CrossRef]
  28. Li, C.; Liu, Q.; Gong, W.; Zhou, Z.; Yao, Z.; Meng, X. Study on the atomic scale of thermal and thermo-oxidative degradation of polylactic acid via reactive molecular dynamics simulation. Thermochim. Acta 2022, 709, 179144. [Google Scholar] [CrossRef]
  29. Lv, S.; Zhang, Y.; Tan, H. Thermal and thermo-oxidative degradation kinetics and characteristics of poly(lactic acid) and its composites. Waste Manag. 2019, 87, 335–344. [Google Scholar]
  30. Sutivisedsak, N.; Cheng, H.; Dowd, M.; Selling, G.; Biswas, A. Evaluation of cotton byproducts as fillers for poly(lactic acid) and low density polyethylene. Ind. Crop. Prod. 2012, 36, 127–134. [Google Scholar]
  31. Zhou, L.; He, H.; Li, M.-C.; Huang, S.; Mei, C.; Wu, Q. Enhancing mechanical properties of poly(lactic acid) through its in-situ crosslinking with maleic anhydride-modified cellulose nanocrystals from cottonseed hulls. Ind. Crop. Prod. 2018, 112, 449–459. [Google Scholar] [CrossRef]
  32. Sangeetha, V.; Varghese, T.; Nayak, S.K. Isolation and characterisation of nanofibrillated cellulose from waste cotton: Effects on thermo-mechanical properties of polylactic acid/MA-g-SEBS blends. Iran. Polym. J. 2019, 28, 673–683. [Google Scholar] [CrossRef]
  33. He, Z.; Klasson, K.T.; Wang, D.; Li, N.; Zhang, H.; Zhang, D.; Wedegaertner, T.C. Pilot-scale production of washed cottonseed meal and co-products. Mod. Appl. Sci. 2016, 10, 25–33. [Google Scholar] [CrossRef]
  34. Nam, S.; Baek, I.-S.; Hillyer, M.B.; He, Z.; Barnaby, J.Y.; Condon, B.D.; Kim, M.S. Thermosensitive textiles made from silver nanoparticle-filled brown cotton fiber. Nanoscale Adv. 2022, 4, 3725–3736. [Google Scholar] [CrossRef]
  35. Lv, S.; Gu, J.; Cao, J.; Tan, H.; Zhang, Y. Effect of annealing on the thermal properties of poly (lactic acid)/starch blends. Inter. J. Biol. Macromol. 2015, 74, 297–303. [Google Scholar] [CrossRef]
  36. Mandal, D.K.; Bhunia, H.; Bajpai, P.K. Thermal degradation kinetics of PP/PLA nanocomposite blends. J. Thermoplast. Compos. Mater. 2019, 32, 1714–1730. [Google Scholar] [CrossRef]
  37. Noori, N.; Khanjari, A.; Rezaeigolestani, M.; Karabagias, I.K.; Mokhtari, S. Development of antibacterial biocomposites based on poly(lactic acid) with spice essential oil (Pimpinella anisum) for food applications. Polymers 2021, 13, 3791. [Google Scholar] [CrossRef]
  38. He, Z.; Zhang, H.; Olk, D.C. Chemical composition of defatted cottonseed and soy meal products. PLoS ONE 2015, 10, e0129933. [Google Scholar] [CrossRef]
  39. He, Z.; Nam, S.; Tewolde, H.; Ford, C.V.; Dhandapani, R.; Barretto, R.; Wang, D. Morphologic features and thermal characteristics of nine cotton biomass byproducts. Biomass 2025, 5, 12. [Google Scholar] [CrossRef]
  40. He, Z.; Nam, S.; Klasson, K.T. Oxidative stability of cottonseed butter products under accelerated storage conditions. Molecules 2023, 28, 1599. [Google Scholar] [CrossRef]
  41. Dintcheva, N.T.; Arrigo, R.; Gambarotti, C.; Carroccio, S.; Filippone, G.; Cicogna, F.; Guenzi, M. α-Tocopherol-induced radical scavenging activity in carbon nanotubes for thermo-oxidation resistant ultra-high molecular weight polyethylene-based nanocomposites. Carbon 2014, 74, 14–21. [Google Scholar] [CrossRef]
  42. Arora, S.; Bagoria, R.; Kumar, M. Effect of alpha-tocopherol (vitamin E) on the thermal degradation behavior of edible oils: Multiple-heating rate kinetics. J. Therm. Anal. Calorim. 2010, 102, 375–381. [Google Scholar] [CrossRef]
  43. Yuzay, I.E.; Auras, R.; Soto-Valdez, H.; Selke, S. Effects of synthetic and natural zeolites on morphology and thermal degradation of poly(lactic acid) composites. Polymer Degrad. Stabili. 2010, 95, 1769–1777. [Google Scholar] [CrossRef]
  44. Das, P.; Tiwari, P. Thermal degradation kinetics of plastics and model selection. Thermochim. Acta 2017, 654, 191–202. [Google Scholar] [CrossRef]
  45. Steel, C.J.; Dobarganes, M.C.; e Gorduras, D.L.d.Ó. Formation of polymerization compounds during thermal oxidation of cottonseed oil, partially hydrogenated cottonseed oil and their blends. Grasas Y Aceites 2006, 57, 284–291. [Google Scholar] [CrossRef]
  46. Sedeek, S.; El-Ghobashy, R.; Tawfik, M. Thermal stability of cottonseed oil mixed with jojoba or castor oil during frying process. J. Biol. Chem. Environ. Sci. 2012, 7, 39–56. [Google Scholar]
  47. Kmiecik, D.; Fedko, M.; Siger, A.; Kulczyński, B. Degradation of tocopherol molecules and its impact on the polymerization of triacylglycerols during heat treatment of oil. Molecules 2019, 24, 4555. [Google Scholar] [CrossRef]
  48. Zou, H.; Yi, C.; Wang, L.; Liu, H.; Xu, W. Thermal degradation of poly (lactic acid) measured by thermogravimetry coupled to Fourier transform infrared spectroscopy. J. Therm. Anal. Calorim. 2009, 97, 929–935. [Google Scholar] [CrossRef]
Figure 1. The biocomposite bars made of PLA and cottonseed byproducts based on the formulations of Table 1.
Macromol 05 00016 g001
Figure 2. TGA and DTG thermograms of five samples tested at four heating rates under a N2 atmosphere. The B1 to B5 represents the biocomposite bars made from PLA and cottonseed byproducts of different mass ratios. Panel (a1e1) correlates to the TGA graphs, while Panel (a2e2) are the DTG curves.
Macromol 05 00016 g002
Figure 3. TGA and DTG thermograms of 5 samples tested at four heating rates under atmospheric air. Panel (a1e1) are correlated to the TGA graphs and Panel (a2e2) are the DTG curves.
Macromol 05 00016 g003
Figure 4. Plots of FWO activation energy (Ea) vs. conversion degree of thermal decomposition of PLA–cottonseed byproduct biocomposites under nitrogen and air conditions.
Macromol 05 00016 g004
Figure 5. Plots of Friedman activation energy (Ea) vs. conversion degree of thermal decomposition of PLA–cottonseed byproduct biocomposites under nitrogen and air conditions.
Macromol 05 00016 g005
Figure 6. TG-FTIR spectra of five samples (a) B1 (b) B2 (c) B3 (d) B4, and (e) B5 exposed to thermal degradation.
Macromol 05 00016 g006
Table 1. Weight-based ratios of PLA–cottonseed byproduct composites.
LabelPLA
(Matrix)
WCSM
(Filler)
CSO
(Compatibilizer)
GLY
(Plasticizer)
B1100000
B2802088
B38020154
B48020158
B580201515
Table 2. Comparison of degradation parameters of five samples measured under N2 and air atmospheres. Data are presented as the average values of four heating rates.
(a) Temperature (T) parameters 1
To (°C)Tm (°C)Te (°C)
N2AirN2AirN2Air
B1278.5 a 2280.3 a342.6 a343.3 a388.8 a396.8 a
B2233.2 b223.3 b296.5 b301.7 b345.1 b375.3 ab
B3245.7 b245.0 b298.1 b303.0 b341.4 b372.1 ab
B4240.0 b243.7 b296.6 b294.2 b347.8 b364.3 b
B5247.5 b242.4 b305.1 b307.1 b340.1 b373.5 ab
(b) Mass loss (WL) and residual char parameters 1
WLo (%)WLm (%)WLe (°C)Char (%)
N2AirN2AirN2AirN2Air
B11.0 d 20.7 d65.9 a59.0 a98.2 a97.7 a0.9 c1.4 b
B26.7 c9.1 c55.8 b47.9 b84.7 b84.5 cd2.3 ab6.2 ab
B316.4 ab18.7 a62.5 ab54.6 ab84.8 b84.4 d3.7 a7.5 a
B413.7 b14.2 b61.1 ab56.0 ab87.5 b86.3 bc1.9 ab5.9 ab
B511.2 b12.9 b57.2 ab49.1 b84.5 b87.4 b1.7 ab5.3 ab
1: The suffix letters of T and WL parameters are o onset decomposition; m = maximal decomposition rate; e = end or final decomposition. 2: The different letters in the same column indicate the values differ significantly at p = 0.05.
Table 3. The range of change of Ea parameter values (kJ mol−1) of the thermal decomposition of PLA–cottonseed byproduct biocomposites with the averages and the standard deviations in parentheses (A ± SD).
Under N2Under Air
FWOFriedmanFWOFriedman
B1147–160
(156.8 ± 3.3)
114–159
(145.1 ± 12.1)
166–177
(174.0 ± 2.7)
138–179
(167.5 ± 11.6)
B2104–115
(112.4 ± 3.0)
75–119
(104.9 ± 13.6)
128–224
(170.2 ± 24.0)
144–253
(170.2 ± 31.5)
B3122–133
(129.1 ± 3.4)
104–134
(120.9 ± 10.6)
153–230
(166.5 ± 20.0)
154–276
(186.6 ± 41.5)
B4102–123
(118.2 ± 5.6)
66–121
(102.7 ± 19.0)
116–150
(125.9 ± 6.9)
119–187
(135.2 ± 18.6)
B5139–149
(145.6 ± 3.3)
123–161
(140.8 ± 10.5)
132–170
(154.3 ± 9.1)
133–191
(154.3 ± 19.6)
Disclaimer/Publisher’s Note: The statements, opinions and data contained in all publications are solely those of the individual author(s) and contributor(s) and not of MDPI and/or the editor(s). MDPI and/or the editor(s) disclaim responsibility for any injury to people or property resulting from any ideas, methods, instructions or products referred to in the content.

