1. Introduction
The increasing global demand for sustainable and carbon-neutral materials has led to a surge in research focused on bio-based polymers derived from renewable resources [
1,
2,
3,
4,
5]. Wood biomass is the largest renewable resource available to humans that is non-edible [
6,
7]. Wood and related products are widely utilized across various industries, but shaping and processing inevitably generate significant quantities of offcuts and scrap, leading to substantial waste. In particular, the disposal of wood waste from industries such as musical instrument manufacturing poses environmental challenges but also presents opportunities for value-added utilization.
The potential for repurposing wood waste varies depending on the size and type of offcuts, with larger pieces finding more immediate applications, while smaller offcuts often face limited options beyond burning as fuel. In particular, small-sized offcut wood has no application except burning as fuel. Yamaha announced that they could use some offcut wood pieces to rebuild a musical instrument, such as a piano or guitar [
8]. But this was only true for big offcut pieces. Many manufacturing companies are considering alternative practical applications for the offcut wood that they generate, to reduce waste and promote environmentally friendly production. For instance, wooden musical instrument manufacturers are increasingly adopting environmentally conscious production practices by employing precise computer-controlled CNC (computer numerical control) machining to minimize the wood waste generated during shaping. Additionally, they are using FSC (Forest Stewardship Council)-certified wood, which is sourced from forests managed in ways that are environmentally sound, socially beneficial, and economically viable [
9,
10,
11].
The amount of waste wood generated by the musical instrument industry has increased due to the COVID-19 pandemic. With more time to dedicate to playing instruments, demand surged [
12,
13]. The used market, in particular, has seen significant growth, rising from USD 1.4 billion in 2020 to reach a point whereby it is projected to reach USD 2.1 billion by 2025 [
14,
15]. In addition, other wooden musical instruments such as piano, violin, and bass could generate a considerable amount of high-quality wood waste during manufacturing and at the end of their lifecycle. This waste, rich in cellulose, hemicellulose, and lignin, presents an ideal feedstock for reborn bio-based materials [
16].
The liquefaction of wood, a process that converts solid biomass into a liquid form, has emerged as a promising technique for utilizing lignocellulosic materials [
17,
18,
19,
20,
21]. Wood liquefaction technology offers the potential to effectively utilize biomass resources that have been difficult to use, including various waste biomasses. Unlike plastics, which can be easily shaped, wood is typically more challenging to modify without cutting. By converting wood into a liquid polyol form, this process facilitates the transformation of wood into new materials, expanding its application potential. By applying this method to musical instrument offcut wood waste, we aim to create a renewable precursor to polyurea synthesis. Polyurea has garnered significant attention due to its versatile properties, including high durability and wide range of applications [
22,
23,
24]. While there is significant interest in utilizing biomass components in such high-performance resins, products incorporating these elements are currently absent in the market. Therefore, there is little research focusing on bio-based polyurea [
25]. Beyond its biodegradability, which has garnered significant attention as a bio-based material, polyurea’s exceptional durability, particularly from the perspective of long-term carbon fixation, is likely to become increasingly important in the future development of bioplastics. In this study, comprehensive investigations were executed regarding the synthesis of bio-based polyurea using the liquefied wood as a polyol component and the characterization of the mechanical and thermal properties of the resulting polyurea.
2. Materials and Methods
2.1. Materials
All offcut wood samples were supplied by Fujigen Co., Ltd. (Nagano, Japan). Fujigen manufactures acoustic and electric guitars and other string musical instruments in Nagano prefecture, Japan. In total, three different supplied wood samples, maple, mahogany, and rosewood, were used for this research.
For the liquefaction process, polyethylene glycol 400 (PEG400), glycerol, and sulfonic acid were obtained from Wako Pure Chemical Industries, Ltd. (Osaka, Japan). In the synthesis of polyurea, aside from the liquefied products, cyanate resin (STABiO, Mitsui Chemicals, Inc., Tokyo, Japan) and polyamine (Unitika Ltd., Osaka, Japan) were utilized. All other reagents were of analytical grade (Wako Pure Chemical Industries, Ltd., Osaka, Japan) and were used as received, without further purification.
2.2. Preparation of Wood Meals
Fine wood meal samples with particle sizes less than 250 μm were prepared using the following procedure. Initially, the raw wood was sectioned using a saw, followed by coarse grinding with a blender (WB-1, 700 W, OSAKA CHEMICAL, Osaka, Japan). The fine wood meal was further milled to a 250 μm particle size using an impact grinder (MF 10.2, IKA, Staufen, Germany). Then, the samples were dried in an oven setting temperature at 105 °C for 1 h. Subsequently, the samples were defatted via Soxhlet extraction at 110 °C for 6 h, employing 50 mL ethanol and 100 mL benzene mixture solvent. After Soxhlet extraction, the wood meals were vacuum-filtered and dried in an oven thoroughly.
2.3. Estimating the Content of Lignin and Holocellulose (Klason Lignin and Wise Method)
The holocellulose and lignin contents were assessed according to a procedure described in a previous study [
26]. The lignin content was quantified using the Klason lignin method. Specifically, 1.0 g of the wood sample was treated with 15 mL of 72% sulfuric acid in a 50 mL beaker, with periodic stirring. After four hours, the mixture was transferred to a 1 L flask, which was then diluted with 560 mL of ultrapure water. The flask, equipped with a condenser, was heated in an oil bath at 110 °C for four hours. The resulting mixture was filtered through a glass filter (1GP16, AS ONE Co., Ltd., Osaka, Japan) and rinsed first with hot water, followed by rinsing with ultrapure water. The remaining solid was collected as lignin.
The holocellulose content was determined using the Wise method. In this procedure, 2.5 g of wood sample was placed into a 300 mL flask containing 150 mL of ultrapure water, 1.0 g of sodium chlorite, and 0.20 mL of acetic acid. The flask was heated in a water bath at 75 °C with occasional stirring. Additional portions of 1.0 g sodium chlorite and 0.2 mL acetic acid were added three times at four-hour intervals. The mixture was then filtered through a glass filter (1GP100, AS ONE Co., Ltd., Osaka, Japan) and washed with ultrapure water followed by acetone. The remaining solid residue was identified as holocellulose.
2.4. Elemental Analysis of Wood Meals Using a CHN Analyzer
To examine the organic constituents of the wood samples, an Organic Micro Element Analyzer (CHN analyzer; MT-5, Yanaco Co., Ltd., Kyoto, Japan) was employed. The analysis was performed under the following furnace temperature conditions: 950 °C for the combustion furnace, 850 °C for the oxidation furnace, and 550 °C for the reduction furnace, with helium serving as the carrier gas. Antipyrine was utilized as the standard reference material for calibration in this study [
27].
2.5. Liquefaction of Wood Meals
A 500 mL three-neck reaction flask, fitted with a stirrer and a reflux condenser, was used for the experiment. The flask was loaded with 10 g of wood meal and 40 g of the mixed solvent, as outlined in
Table 1. The reaction vessel was then immersed in an oil bath preheated to 150 °C. The reaction commenced upon the addition of the catalyst (H
2SO
4) to the flask. Liquefied products were collected at various intervals—5, 15, 30, 90, 180, and 300 min—and placed in pre-weighed vials for residue content analysis. For evaluating the residue content, the process was carried out following
Section 2.6. To halt the liquefaction process, the vials were rapidly cooled in cold water. Following the cessation of the reaction, 20 mL of methanol was added to dissolve the liquefied product, and the pH was adjusted to 7.0 using 3 mol/L of NaOH. The mixture was then filtered to remove all salts, and the methanol was evaporated. The resulting liquefied products derived from the offcut wood samples were obtained. All liquefaction conditions used in this study are detailed in
Table 1. The experimental conditions were primarily set based on the findings and methodologies established in our previous laboratory studies [
28].
2.6. Characterization of the Liquefied Wood
To check the liquefaction progress, the functional groups of the liquefied wood samples were analyzed by using Fourier-transform infrared spectroscopy (FT-IR) (JASCO Co., Ltd., Tokyo, Japan). Attenuated total reflection (ATR) FT-IR was utilized to identify the functional groups within the liquefied product samples [
29].
For residue quantification, 10 mL of methanol was added to the vial containing the liquefied product, which was then thoroughly mixed. The mixture sample was filtered using a vacuum pump and paper filters (ADVANTEC C5, Toyo Roshi Kaisha, Ltd., Ehime, Japan). The collected residue was subsequently dried in an oven at 105 °C for 24 h. The percentage of residue was calculated using Equation (1).
where W1 represents the weight ratio of the residue in the liquefied sample taken, and W0 represents the weight ratio of wood in the initial sample.
The average molecular weights of the liquefied wood samples were determined using a gel permeation chromatography (GPC) system. The system was equipped with a column (KF-802, Shodex, Co., Ltd., Tokyo, Japan), an HPLC pump (PU-2080, JASCO Co., Ltd., Tokyo, Japan), a column thermostat (CO-2060, Jasco, Co., Ltd., Tokyo, Japan), and a refractive index detector (RID) (RI-2031, Jasco, Co., Ltd., Tokyo, Japan). The analytical conditions, consistent with our previous research, are detailed in
Table 2 [
12]. Precisely 10 mg of the liquefied wood samples was diluted with 2.5 mL of tetrahydrofuran (THF) before analysis by GPC.
The hydroxyl value of the liquefied wood is a critical parameter for knowing the proper mixture for the synthesis, as it influences the mechanical properties of the resulting resin. The acid number and hydroxyl values of the liquefied wood were measured following the method adapted from Ertas et al. [
30]. The hydroxyl value was calculated based on the measured acid values. Both the hydroxyl and acid values were determined by titration, with a blank titration conducted using the same procedure.
To measure the viscosity of liquefied wood products, a Brookfied DV-1 viscometer (AMETEK Brookfield, MA, USA) was used. The measurement temperature was controlled with a water bath to 23 ± 1 °C before the measurement. The value was read after a 1 min rotation of the spindle.
2.7. Preparation of the Polyurea Film Samples
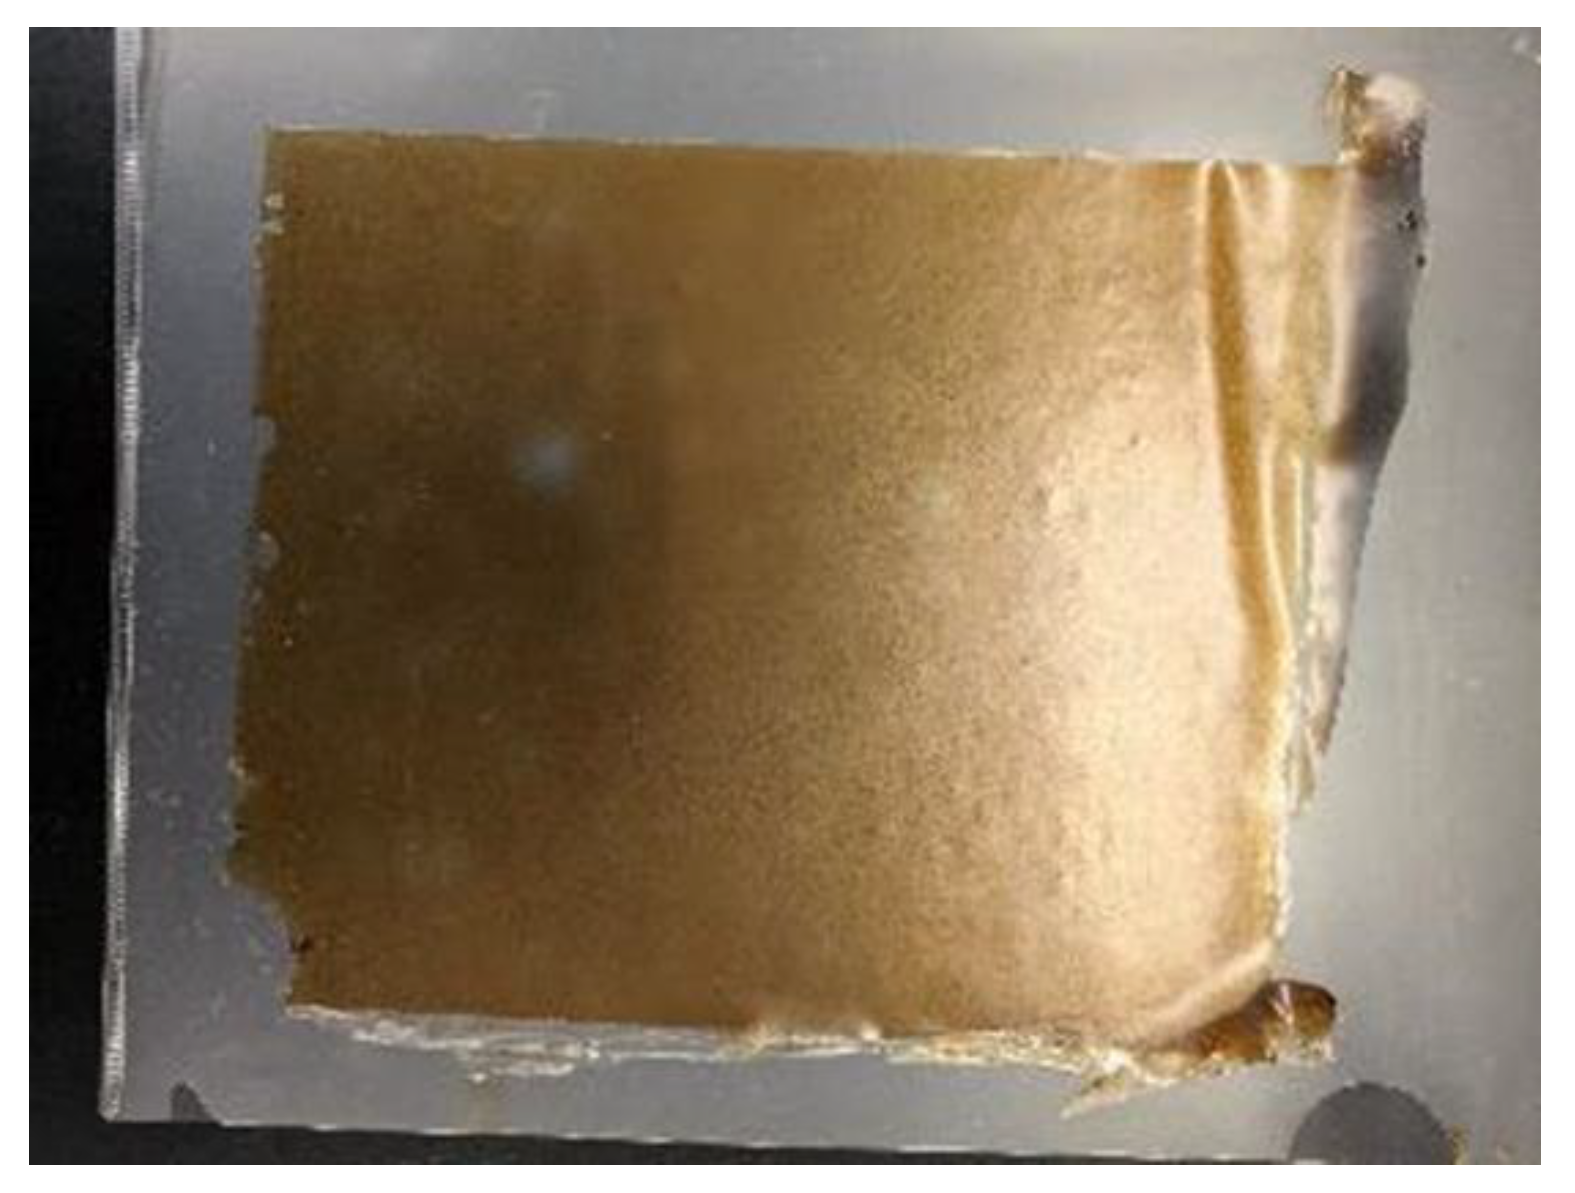
To fabricate the polyurea films, a press molding method was employed using 100 μm PTFE spacers. Initially, cyanate resin and liquefied products were accurately measured and mixed at 600 rpm for 1 min to ensure homogeneity. Subsequently, polyamine was added to the mixture, and the stirring continued at 600 rpm for an additional 30 s. The molar ratio of cyanate groups to hydroxyl groups to amino groups was maintained at 2:1:1 throughout this study. The resulting mixture was subjected to degassing with a vacuum pump for 5 min at least to eliminate any entrapped air bubbles. Following degassing, the mixture was cast onto a polypropylene (PP) substrate. Another PP sheet was placed on top, and the assembly was sandwiched between 5 mm thickness glass plates with the PTFE spacers to ensure a uniform film thickness. The assembly was then left at room temperature under pressure overnight before being placed in an oven preheated to 80 °C. The films were further cured for 48 h at this temperature. The final thickness of the polyurea films ranged between 100 and 200 μm. An image of the synthesized polyurea film in this study is shown in
Figure 1.
2.8. Differential Thermal Analysis (TG-DTA)
The thermal decomposition characteristics of polyurea films were evaluated using simultaneous thermogravimetry and differential thermal analysis (TG-DTA) with a DTG-60 device (Shimadzu Corporation, Kyoto, Japan). The measurements were conducted at a ramp rate of 10 °C/min in a nitrogen atmosphere [
31].
2.9. Tensile Strength Test for Polyurea Films
The tensile strength test was performed following JIS K7127(ISO 527-3) [
32]. Specimens were cut from the film with a sharp knife. After being cut, the edge of each specimen was abrasive and was smoothened. The precision universal testing machine AGX-100kNV (Shimadzu Corporation, Kyoto, Japan) was used for the tensile strength test. The test speed was set to 100 mm/min. The strain data were calculated for both grip positions. The stress was calculated using Equation (2).
where σ is the tensile stress (MPa); F is the maximum tensile force (N); and A is the specimen’s cross-sectional area (mm
2).
2.10. Scanning Electron Microscopy (SEM) of Polyurea Film
The morphology of the polyurea film was examined using scanning electron microscopy (SEM) with an S-2400 instrument (HITACHI High-Tech, Tokyo, Japan). Prior to imaging, the samples were coated with a thin layer of osmium to prevent surface charging during SEM analysis. The SEM was operated at an accelerating voltage of 15 kV, and images were captured at a magnification of 1000×.
3. Results and Discussion
3.1. Componential Analysis of Offcut Wood from Musical Instruments
The results of the componential analysis are shown in
Table 3. The ash content varies significantly depending on the soil in which the wood is grown and the type of wood. Furthermore, each wood sample’s component amounts as the results of the Wise and Klason lignin methods are shown in
Table 4.
All wood samples contain the main elements of holocellulose and lignin; they are not significantly different. Thus, all wood meals were mixed and used for the liquefaction process.
3.2. Optimize the Liquefaction Condition
In this study, the optimization of the liquefaction process efficiency was conducted by analyzing the residue content, aiming for a target residue level of less than 15 wt% [
33]. Achieving a low residue content is crucial in the effective utilization of woody biomass in various applications. The results, which detail the effects of different acid catalyst concentrations, PEG and glycerol mixture ratios, and liquefaction temperatures, are presented in
Figure 2a–c. These parameters were systematically varied to identify the optimal conditions that minimize residue and enhance the overall efficiency of the liquefaction process.
The amount of acid catalyst had a clear impact on the residue content. Notably, using 1 wt% catalyst meant that significantly more time was required to reduce the residue content to below 15%. However, the difference between 3% and 10% was minimal, and an excessive amount of acid led to recondensation, which increased the residue content after 300 min. This finding aligns with observations by Adriano do Couto Fraga et al. [
34], who noted that recondensation during the liquefaction process occurs when cellulose and lignin are present simultaneously, and it tends to increase as the reaction progresses, especially during prolonged liquefaction.
As shown in
Figure 2, adding 10% glycerol to the solvent mixture did not significantly affect the efficiency of the liquefaction process. Furthermore,
Figure 3 demonstrates that while higher liquefaction temperatures can accelerate the process, they also promote recondensation. This was evident from the formation of a gel in the liquefied product at 170 °C. In this study, a liquefaction temperature of 150 °C seemed more favorable, as it resulted in a liquefied product with better viscosity, a point that will be discussed in more detail later.
3.3. Evaluating the Functional Groups of the Liquefied Products with Fourier-Transform Infrared Spectroscopy (FT-IR)
To evaluate which functional groups the liquefied products of functional groups contain, FT-IR was carried out. The typical FT-IR spectra of the liquefied products are shown in
Figure 3. The liquefaction conditions comprised a 3 wt% acid catalyst, PEG/glycerol (7:3), a liquefaction temperature of 150 °C, and a 300 min reaction time.
The presence of the C-O peak at 1090 cm
−1, which is attributed to cellulose, the peak at 1450 cm
−1 associated with the benzene ring of lignin, and the OH peak at 3400 cm
−1 indicate that the structural components were partially preserved during the liquefaction process. Therefore, these peaks can be found in the FT-IR spectra of wood meal shown in
Figure 3.
3.4. Measurement of the Molecular Weight of the Liquefied Products with Gel Permeation Chromatography (GPC)
GPC measurements were performed to compare the molecular weight of the liquefied products with different acid amounts, liquefaction temperatures, and liquefaction times. The results are shown in
Figure 4a–c, with different comparisons. The basic liquefaction condition comprised a 3% acid amount, PEG/glycerol (7:3), a liquefaction temperature of 150 °C, and a liquefaction time of 300 min for the commonly expected changing parameters.
According to
Figure 4a, a longer liquefaction time seemed to be involved in the recondensation of the liquefied product. In addition, the PEG400 peak for 300 min liquefaction became smaller than that for 180 min liquefaction. This suggested that more PEG400 was consumed for excess liquefaction at 300 min. In addition, from
Figure 4b, it is clear that increasing the amount of acid catalyst intensified the recondensation reaction and led to a greater consumption of PEG400. Especially with 10% acid catalyst, the peak of the liquefied product broadened, indicating a wider molecular weight distribution. And
Figure 4c reveals that only the PEG (9:1) liquefied product exhibited a peak associated with recondensation. Additionally, the peak for glycerol was significantly smaller compared to other conditions. This suggests that the glycerol content in the PEG400 mixture should be more than 10% to prevent recondensation.
3.5. Hydroxyl Value and Viscosity in Various Liquefied Products
The results for the hydroxyl value measurements and viscosity are shown in
Table 5, below. The value is the average calculated from two samples.
The results showed that a longer liquefaction time and high acid amount could lead to a low hydroxyl value and high viscosity. The liquefied products with a 1 wt% acid amount had a very low viscosity but did not contain as much woody biomass due to a high residue content. In addition, as the GPC results suggest, the liquefied product with a 10 wt% acid amount showed a significantly high viscosity compared to the others. The molecules of recondensation contributed to this high viscosity. Accounting for the process of producing biopolymers, a lower viscosity would be preferred for synthesis. From this point of view, the liquefaction condition with a 3 wt% acid amount, more than 10% glycerol in the mixture solvent, and a shorter liquefaction time seems to achieve a good balance.
3.6. FT-IR Spectra of Polyurea Films with Different Liquefied Products
To check for the complete reaction of cyanate and polyamine and polyol, FT-IR was carried out. The disappearance of the cyanate peak at 2260 cm
−1 in the FT-IR spectrum, along with the appearance of characteristic polyurea peaks at 1690 cm
−1 for isocyanurate and 1510 cm
−1 for amide II, suggests the successful formation of polyurea. The typical polyurea film FT-IR spectra are shown in
Figure 5.
3.7. Tensile Strength and the Elongation of Polyurea Films Derived from Liquefied Products
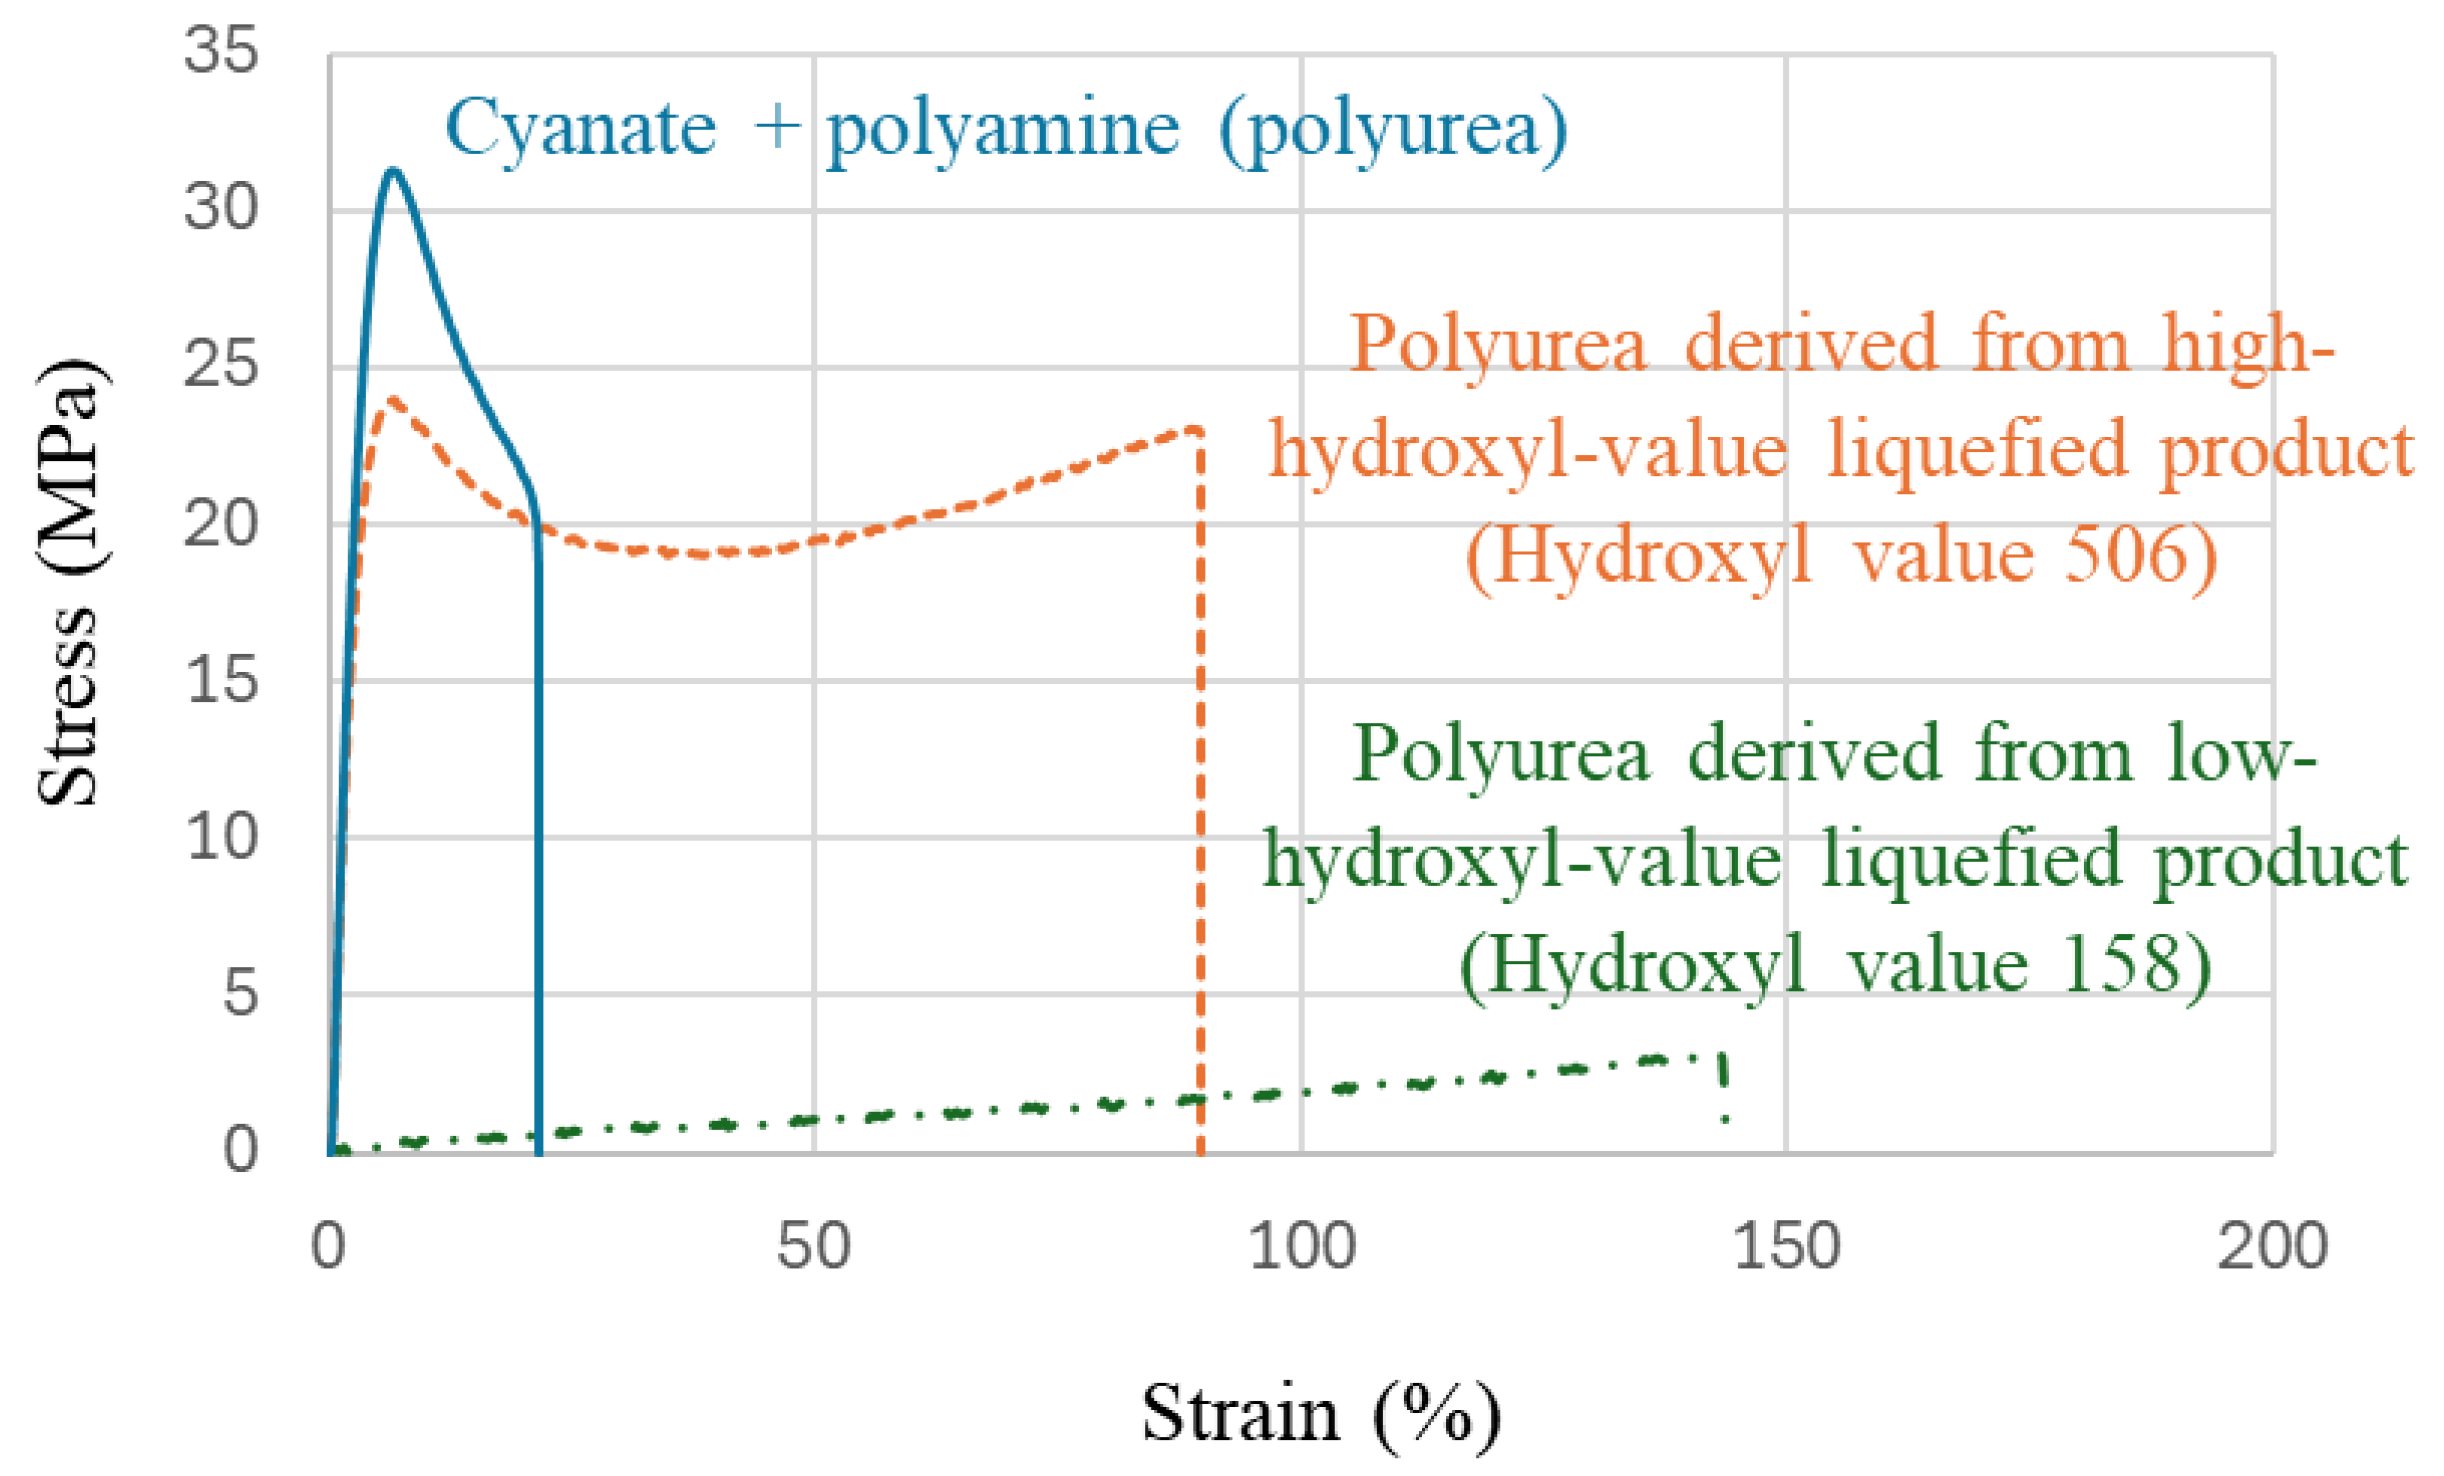
The typical stress–strain (S-S) curves of polyurea films in this study are shown in
Figure 6. To compare the polyurea without the liquefied product, only cyanate and polyamine were mixed and made into a film.
A significant change in tensile properties was observed around a hydroxyl value of approximately 300. Polyurea films with a hydroxyl value below 300 exhibited flexible, rubber-like properties with high strain, while those with a hydroxyl value above 300 demonstrated high tensile strength. Additionally, polyurea films composed of cyanate and polyamine only, without the inclusion of liquefied products, displayed similar high-strength properties to those films with high hydroxyl values. It is noteworthy that this critical hydroxyl value of 300 coincides with the hydroxyl value of 280 for the main liquefaction solvent PEG400, suggesting that structural changes within the films may influence the observed properties. In this study, the polyurethane urea film made with liquefied wood with a hydroxyl value of 506 exhibited a tensile strength of 25 MPa. Although the strength was slightly lower compared to polyurethane urea films without liquefied wood, the resulting film showed greater elongation, indicating the production of a robust and flexible material.
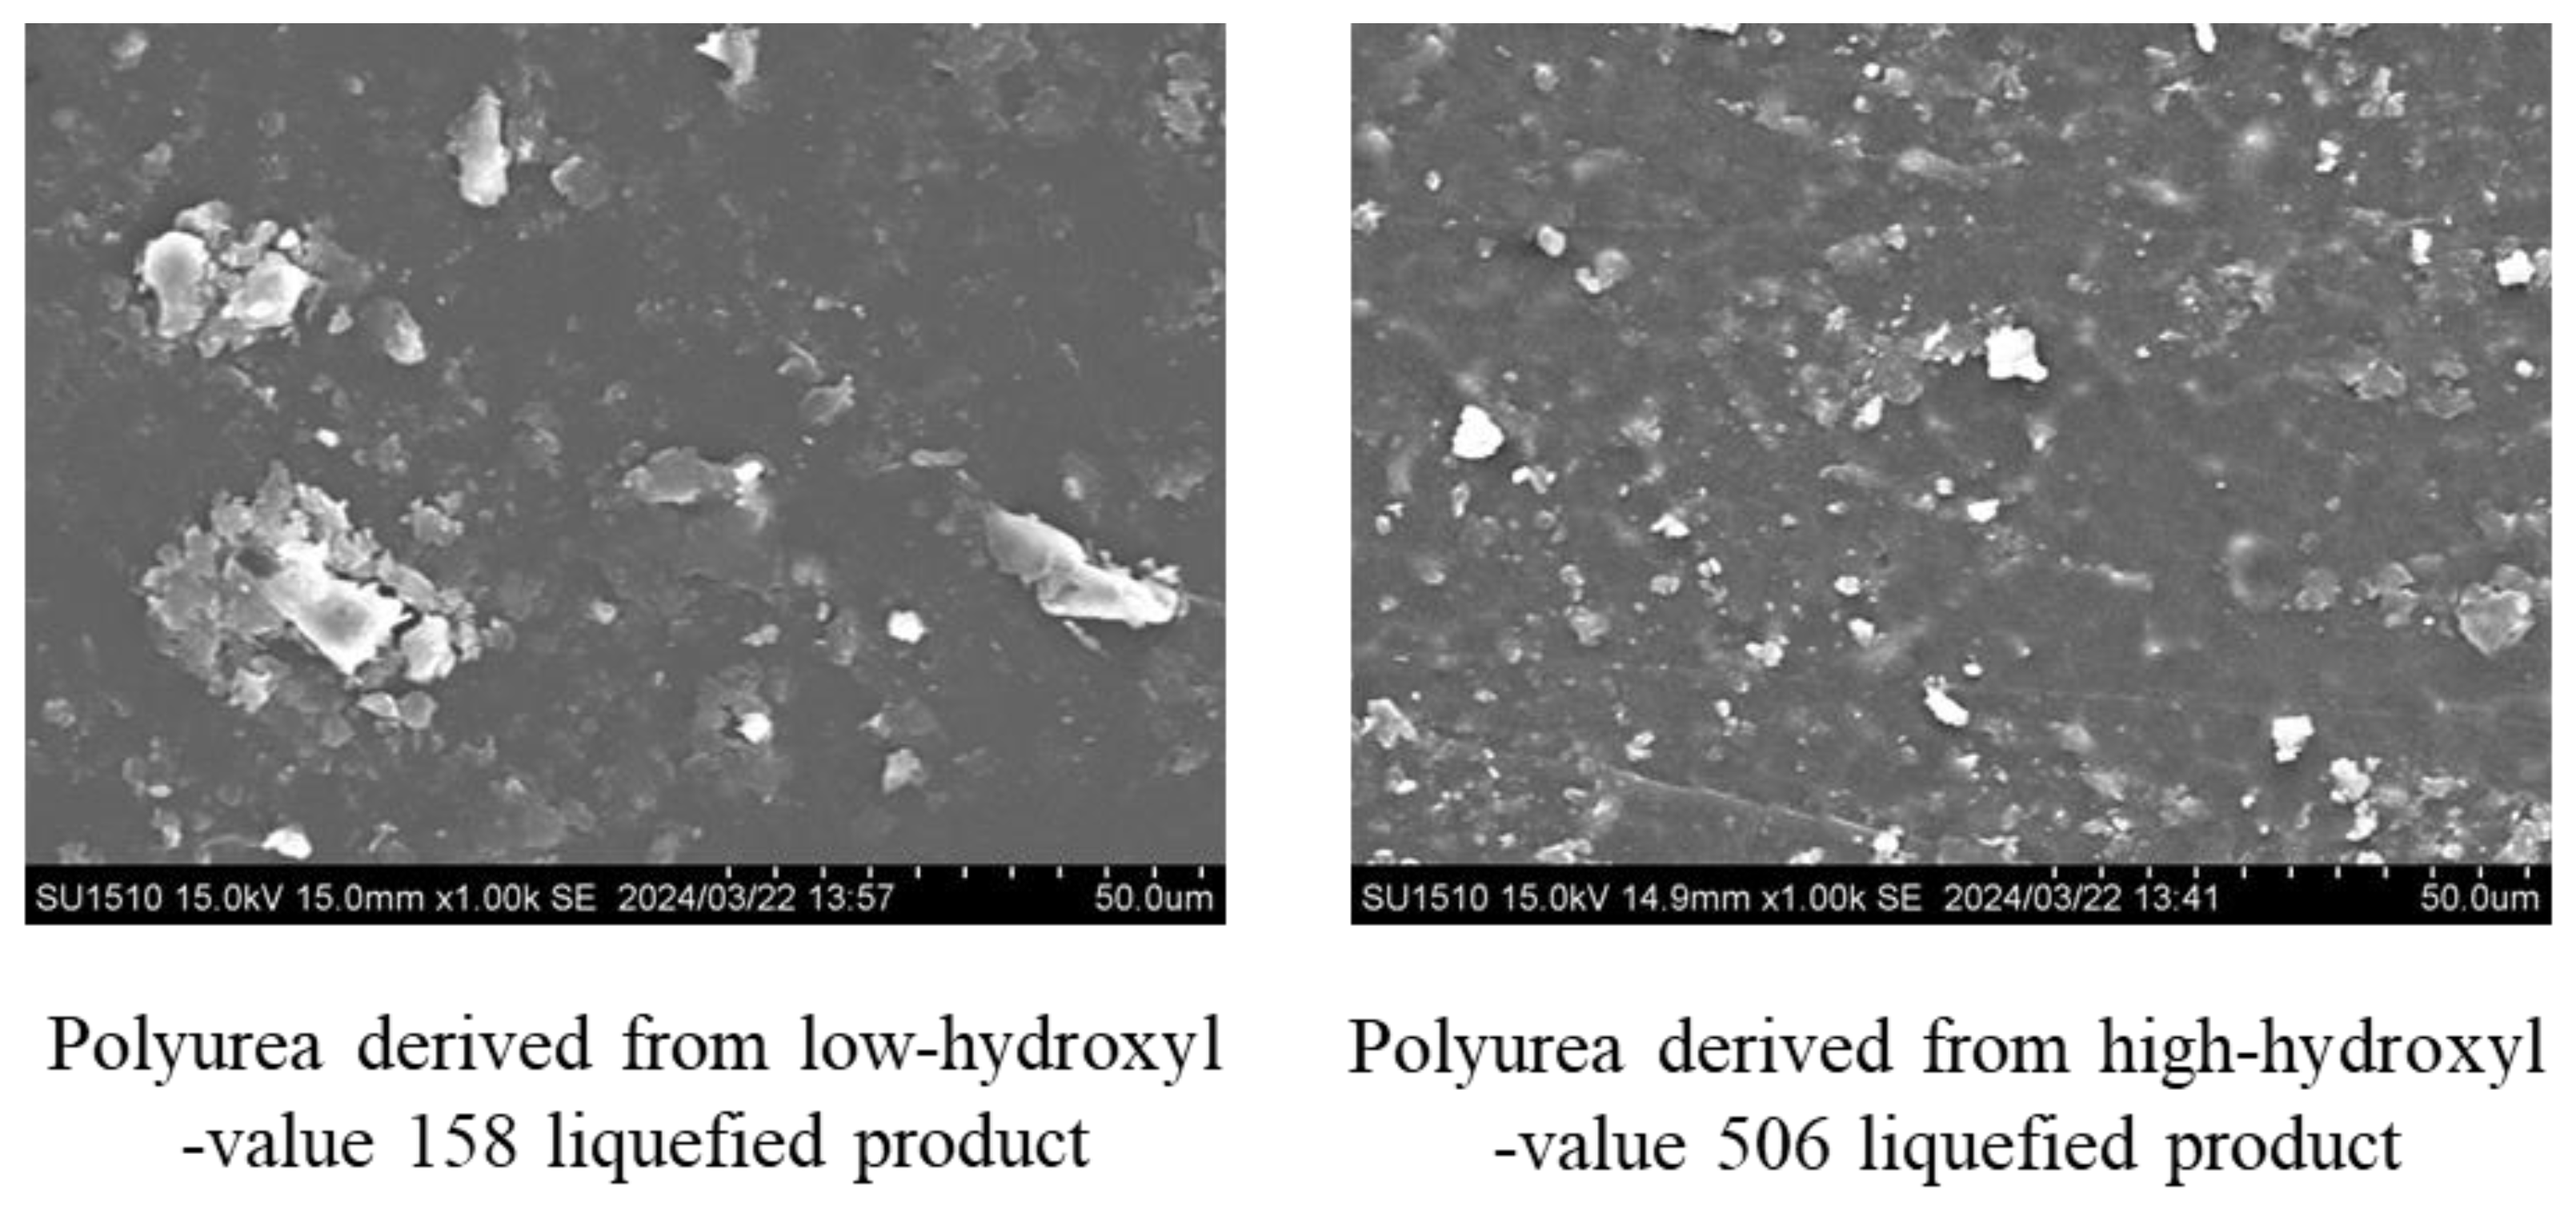
3.8. Morphology of Polyurea Films with Scanning Electron Microscopy (SEM)
To investigate the morphology of polyurea films derived from liquefied products, scanning electron microscopy was carried out. Typical SEM images are shown in
Figure 7.
In polyurea samples with lower hydroxyl values, large aggregations were observed on the surface. On the other hand, in samples with higher hydroxyl values, smaller aggregations appeared. As the hydroxyl value increased, the size of these aggregations decreased correspondingly. Notably, in polyurea samples that did not contain liquefied wood, no aggregations were present and the surface was exceptionally smooth. The SEM image is shown in
Figure 8 for polyurea film without liquefied products.
As a result, when the hydroxyl value of the liquefied product falls below that of PEG400, there is reduced cross-linking between the liquefied product and cyanate resin, resulting in the soft segment becoming dominant during tensile testing. Simultaneously, the lower hydroxyl value reduces the compatibility with the hydrophilic PEG400, leading to an increased aggregation size. Consequently, it is hypothesized that the size of the aggregations observed in SEM analysis is inversely proportional to the hydroxyl value.
3.9. Thermal Properties of Polyurea Films
The results of TG-DTA are shown in
Table 6, below. To compare the sample without the liquefied product, the data contain only cyanate and polyamine, which were mixed and made into a film. Td5 and Td10 are defined by the temperatures to obtain 5 wt% and 10 wt% weight loss from the start, respectively.
Compared to Sample 1 (which did not contain the liquefied product), none of the samples showed inferior thermal durability. However, the residue content at 600 °C was slightly lower than that of polyurea in Sample 1. This difference is likely due to the components derived from woody biomass, which generally cannot withstand temperatures as high as 600 °C. As a result, the polyurea containing woody biomass produced less residue than the polyurea without it.
4. Conclusions
This study explored the potential of utilizing the offcut wood generated from musical instrument manufacturing by creating novel materials through the liquefaction of wood. It was found that bio-based polyurea could be successfully produced using liquefied products, and the mechanical and thermal properties of the polyurea were investigated. A significant finding was that the physical properties of the polyurea changed dramatically around a hydroxyl value of 300. Below this value, the polyurea exhibited rubber-like characteristics, while, above it, the material demonstrated high tensile strength. These changes in properties are likely related to the density of urea linkages. Furthermore, compared to polyurea without liquefied products, the tensile strength and thermal stability were comparable, suggesting that it is possible to control various properties of polyurea while incorporating biomass-derived components.


 ,
, 


