
Causal Effect Analysis of the Relationship Between Relative Bird Abundance and Deforestation in Mexico
 , and
, and
Simple Summary
Abstract
1. Introduction
2. Materials and Methods
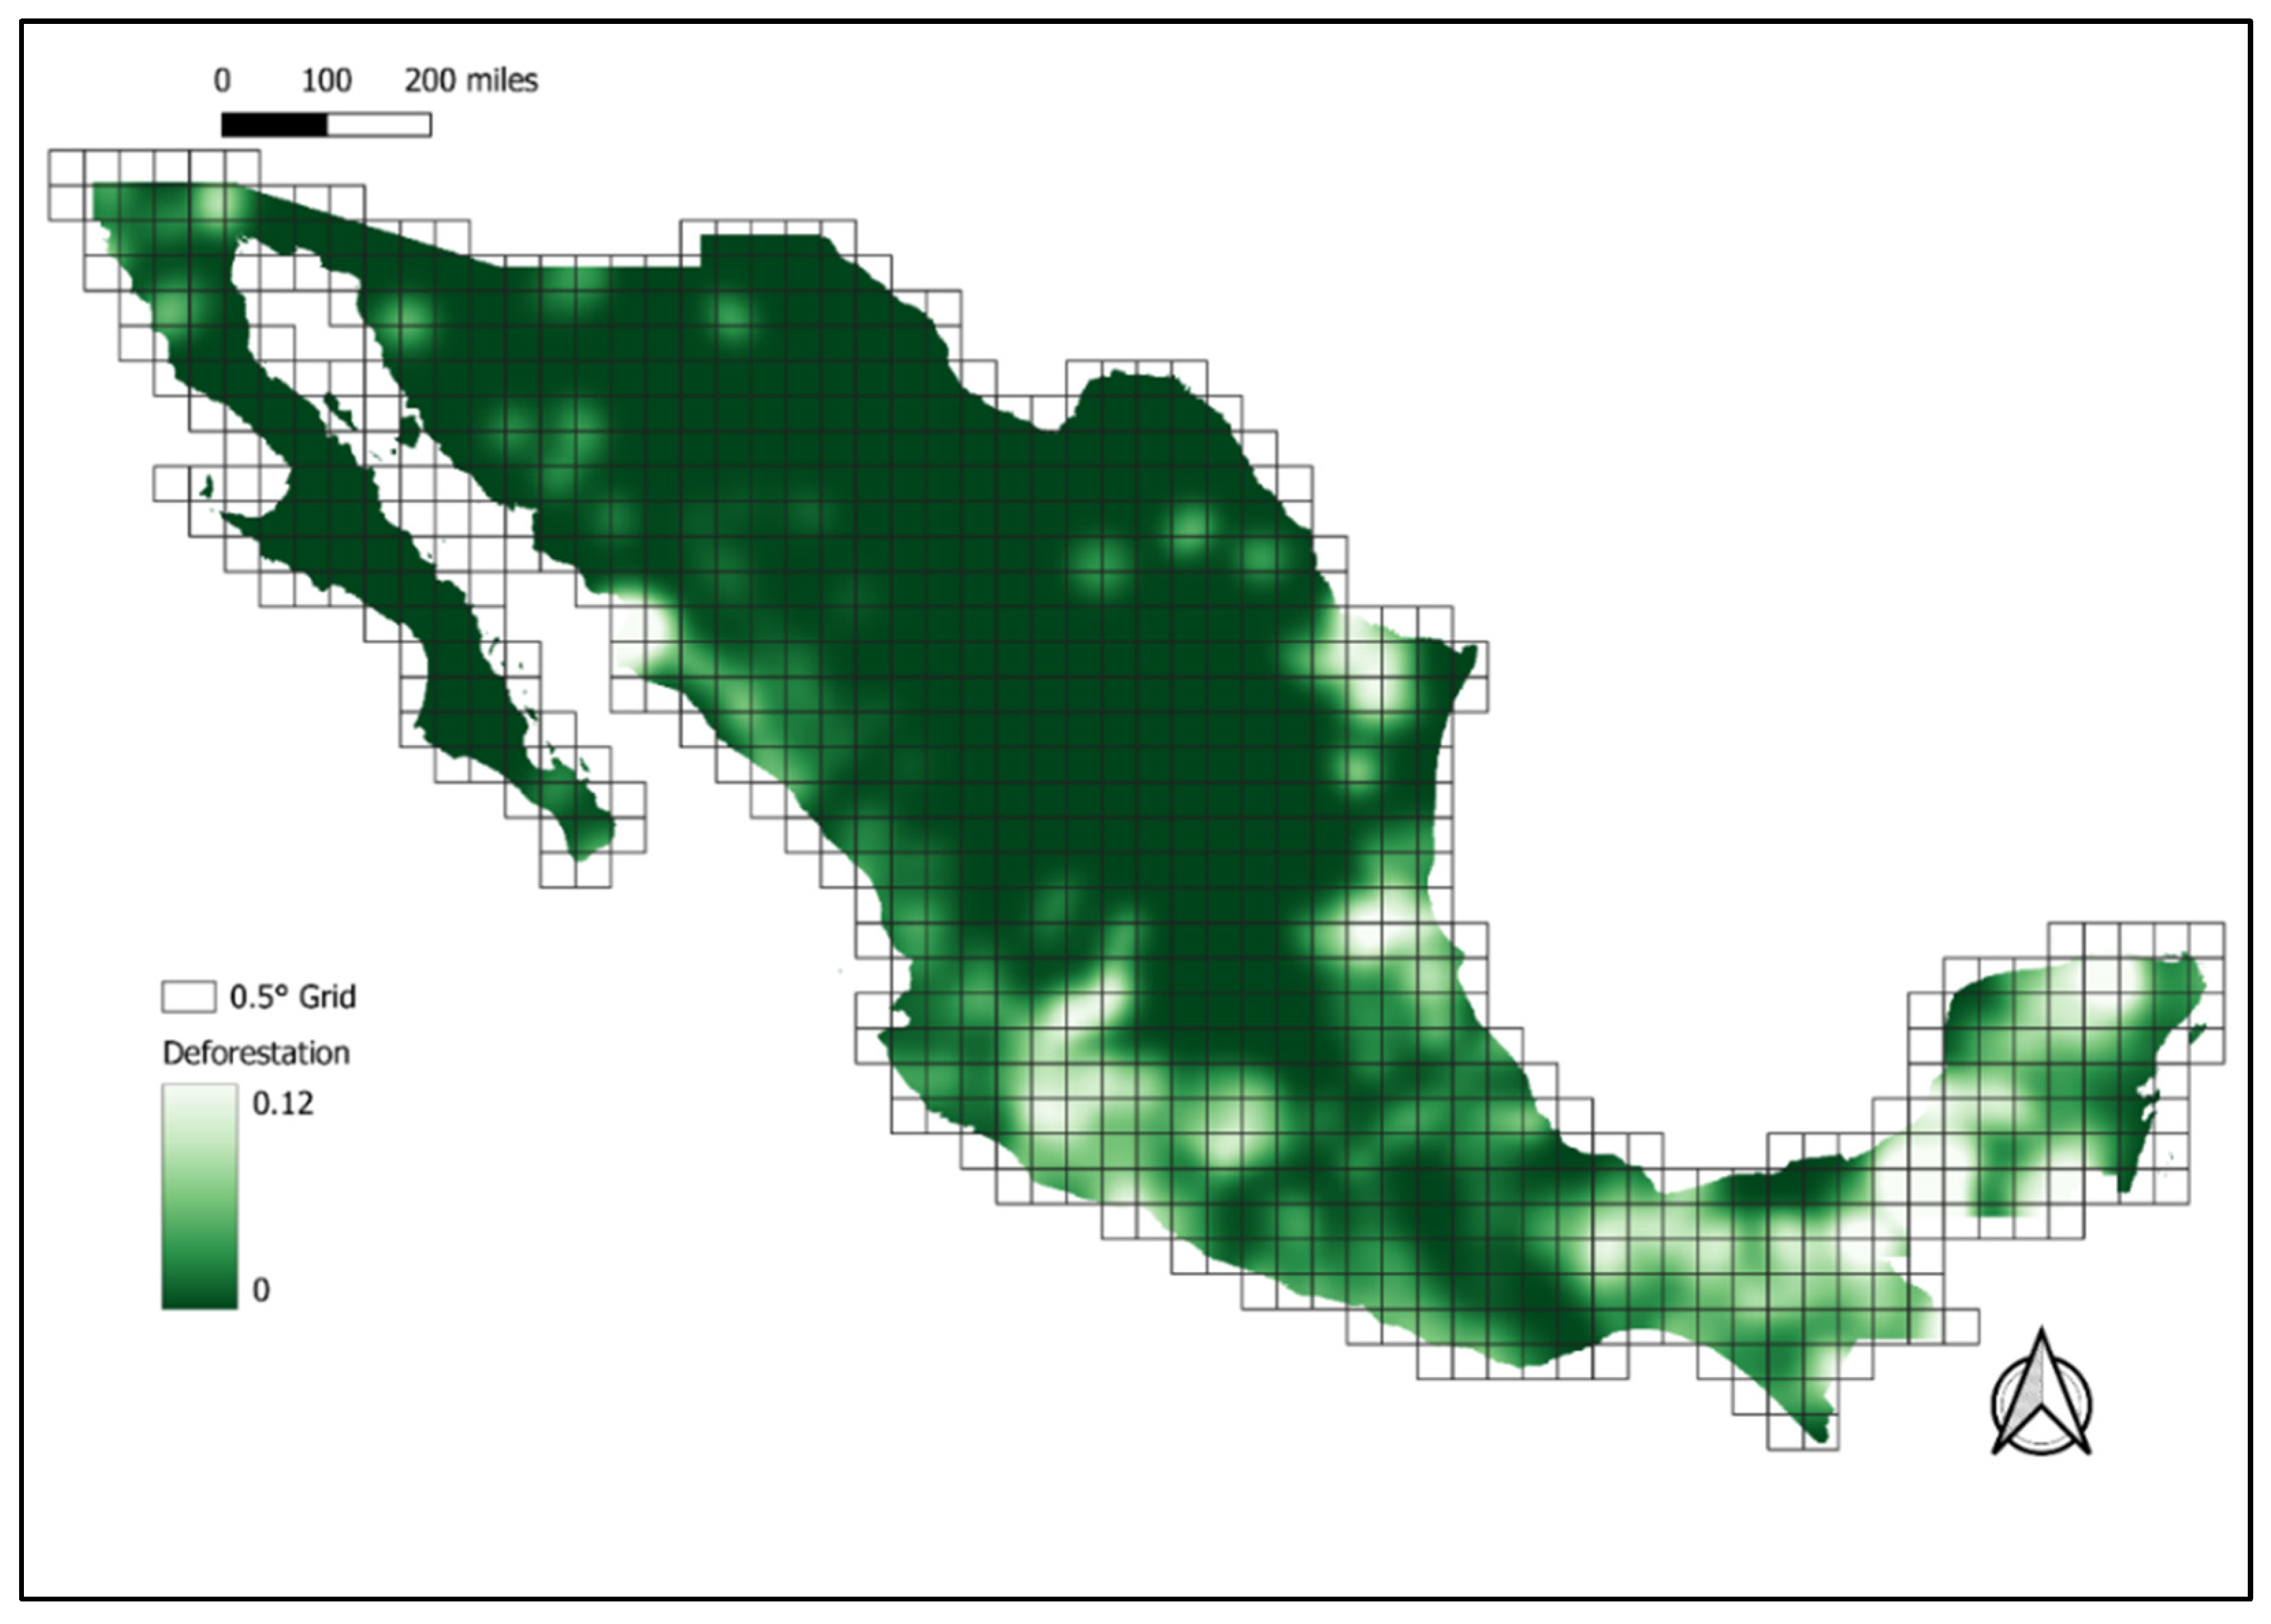
2.1. Study Area
2.2. Description of Variables
2.2.1. Species Selection
2.2.2. Outcome Variable: Relative Abundance of Birds
2.2.3. Treatment Variable: Deforestation
2.2.4. Control Variables
2.3. Specification of Causal Effect Models
3. Results
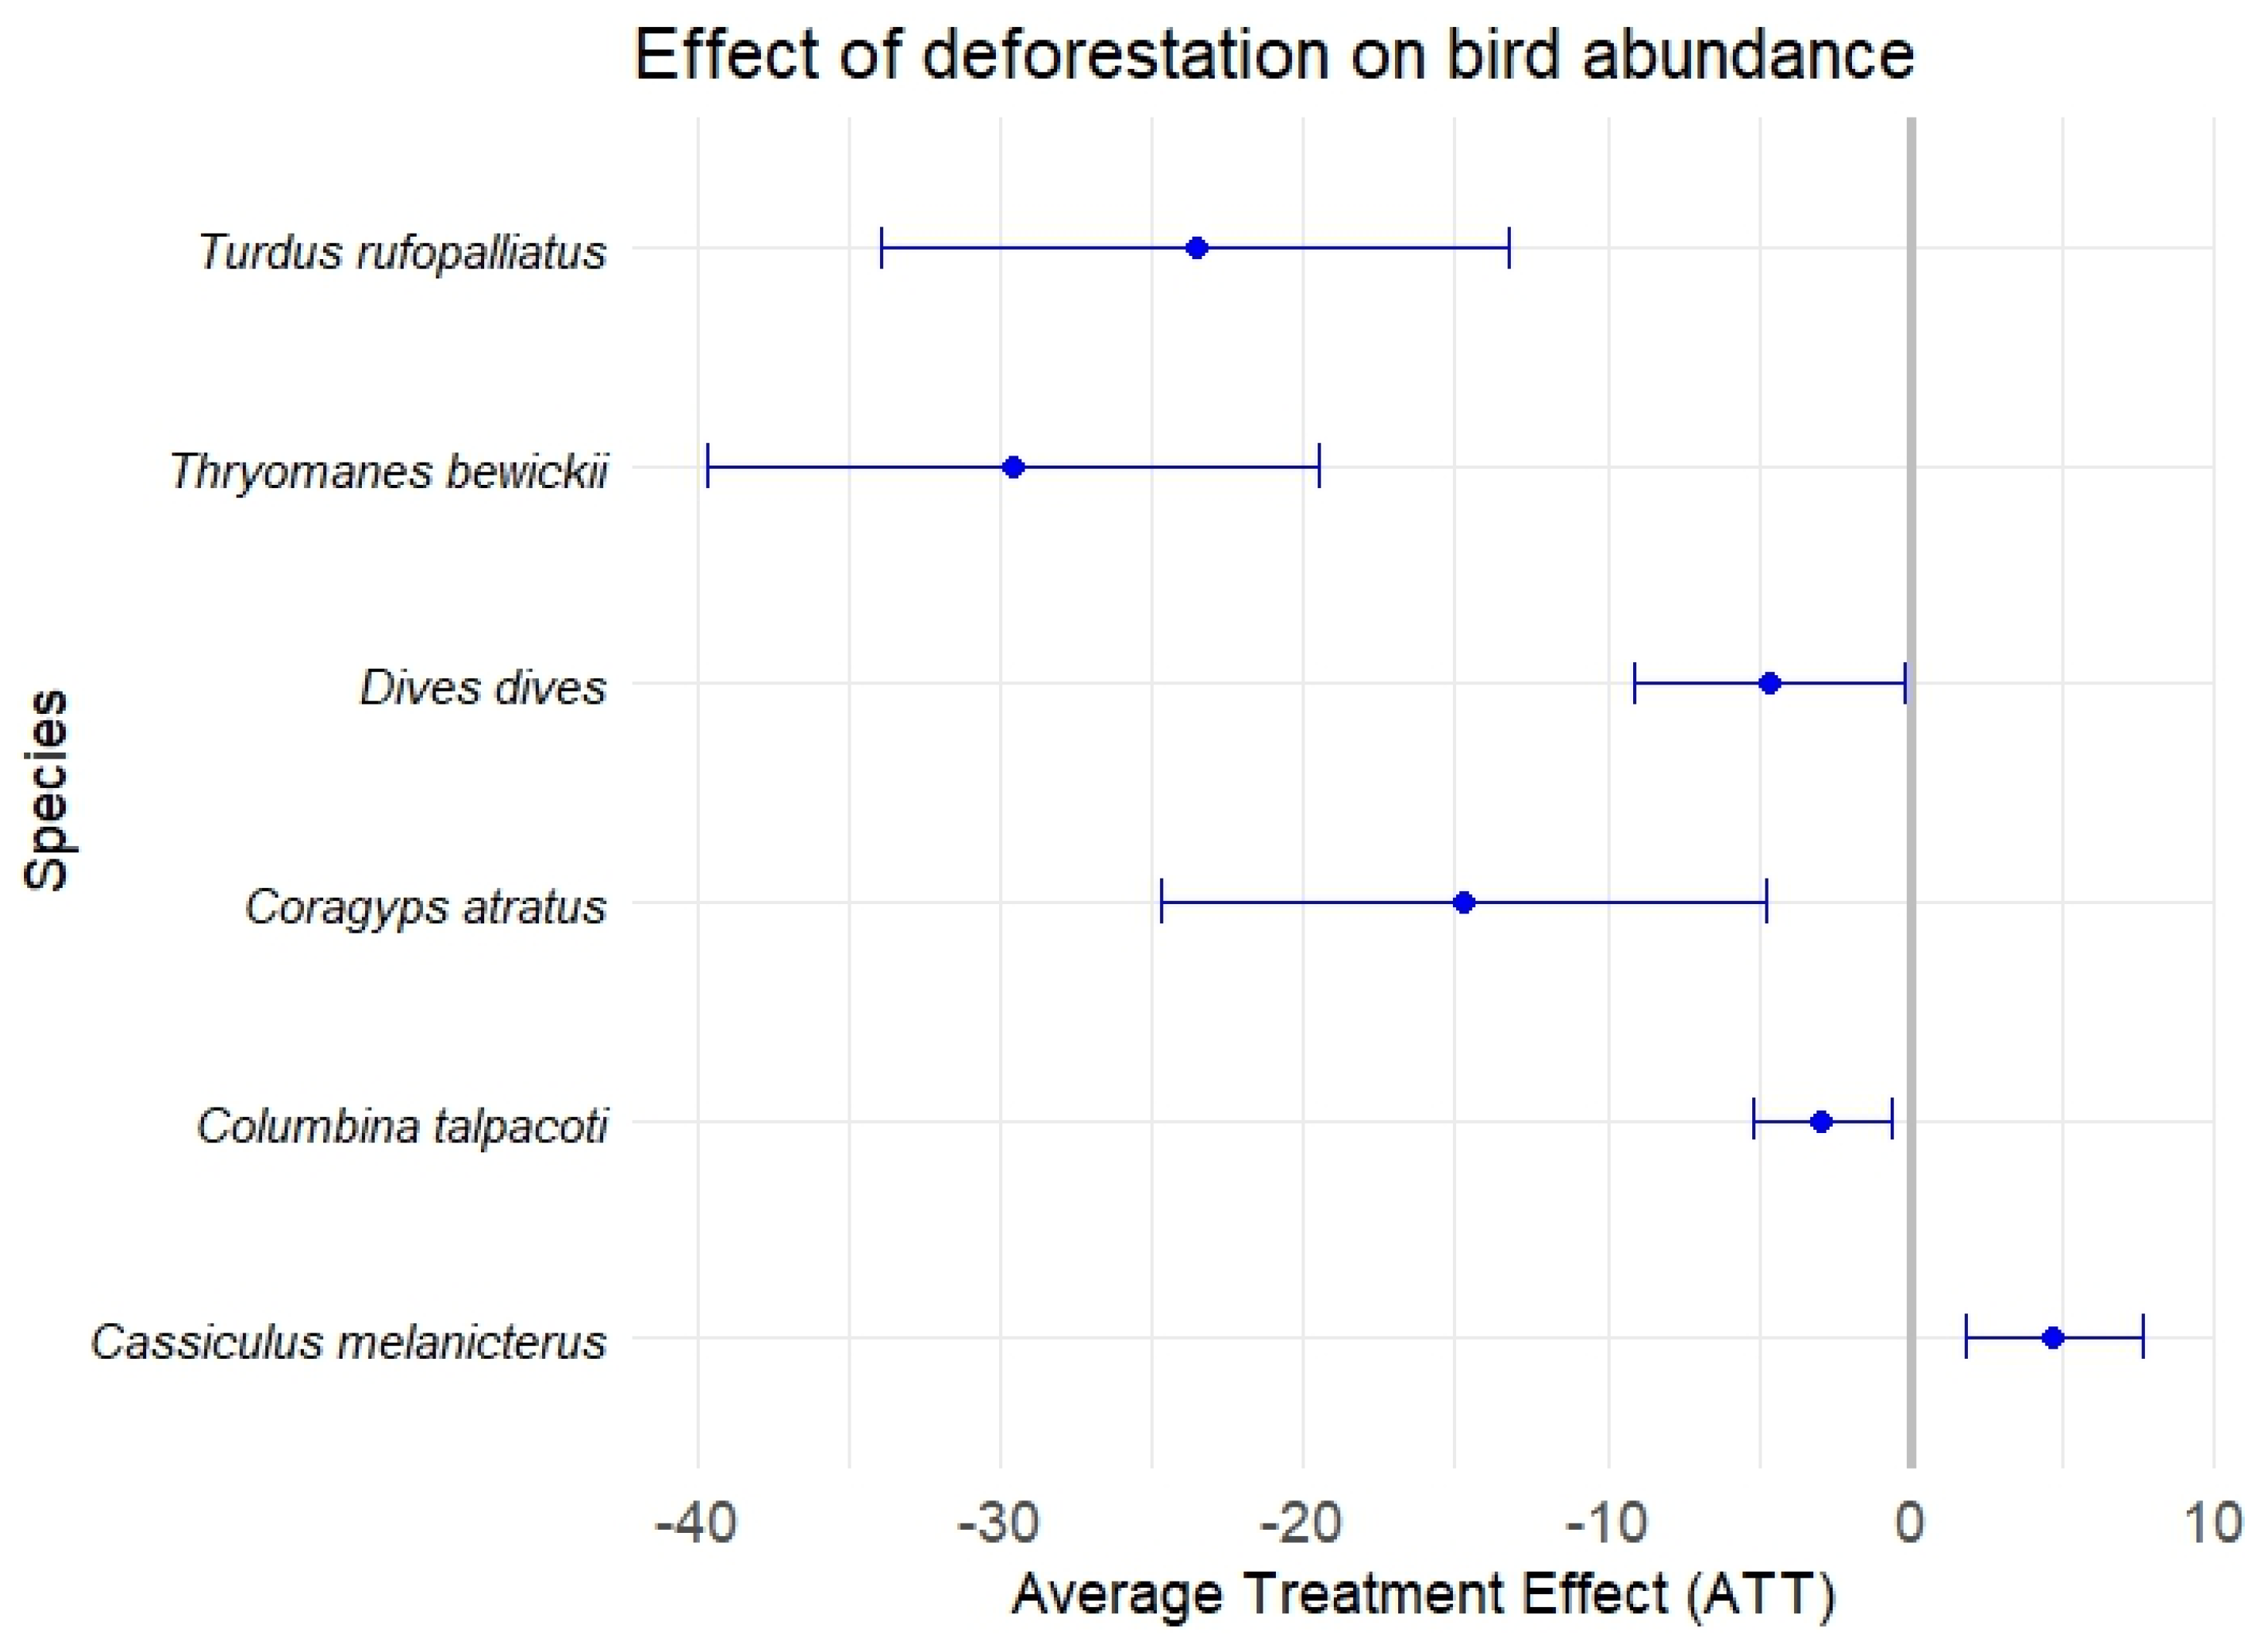
Results of Causal-Effect Models
4. Discussion
5. Conclusions
Supplementary Materials
Author Contributions
Funding
Institutional Review Board Statement
Data Availability Statement
Acknowledgments
Conflicts of Interest
Abbreviations
| GBIF | Global Biodiversity Information Facility |
| GLMM | Generalized Linear Mixed Model |
| OLS | Ordinary Least Squares |
| U.S. | United States |
| PSM | Propensity Score Matching |
| ERM | Extended Regression Model |
| AOS | American Ornithological Society |
| INEGI | Instituto Nacional de Estadística y Geografía |
| CONAFOR | Comisión Nacional Forestal |
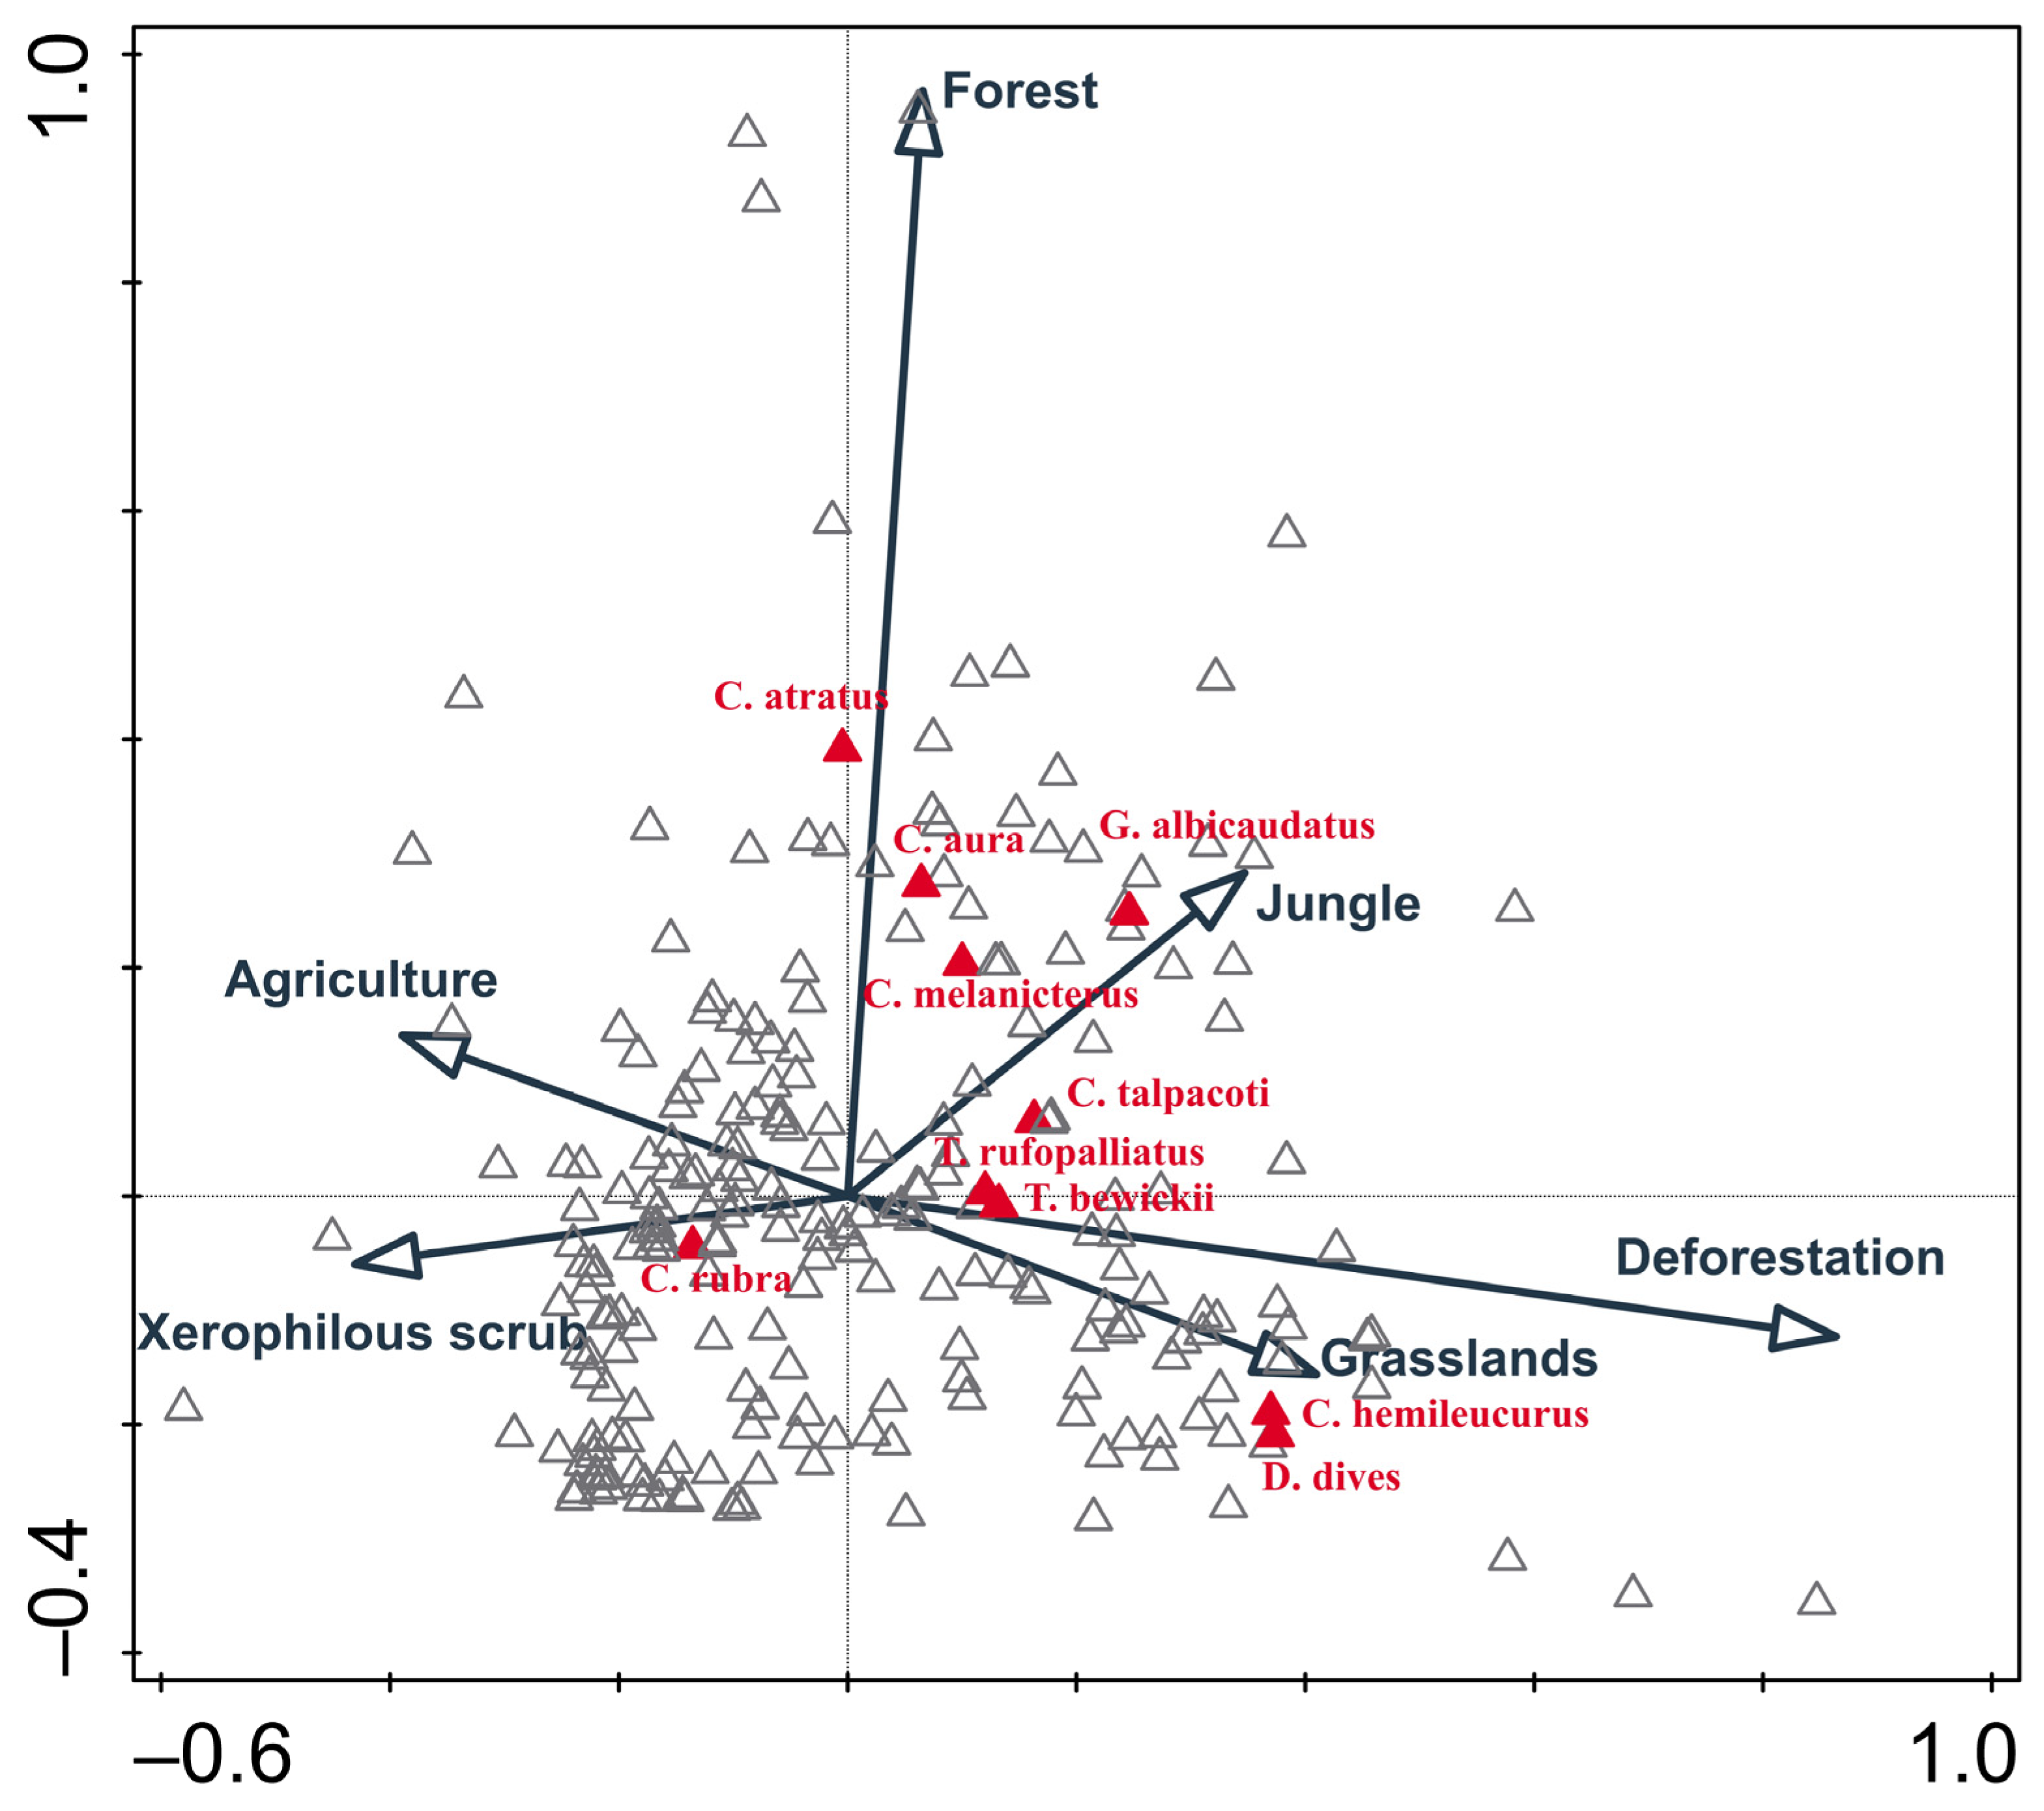
| CCA | Canonical Correspondence Analysis |
| IUCN | International Union for Conservation of Nature |
| PA | Natural Protected Areas |
| CONANP | Comisión Nacional de Áreas Naturales Protegidas |
| CONABIO | Comisión Nacional para el Conocimiento y Uso de la Biodiversidad |
| ATT | Average Treatment Effect on the Treated |
| ZTM | Zona de Transición Méxicana |
| CL | Confidence Level |
Appendix A. Canonical Correspondence Analysis Overview
References
- SMF-CONAFOR. Deforestación. Sistema Nacional de Monitoreo Forestal. Available online: https://snmf.cnf.gob.mx/deforestacion/ (accessed on 13 February 2025).
- Negret, P.J.; Maron, M.; Fuller, R.A.; Possingham, H.P.; Watson, J.E.; Simmonds, J.S. Deforestation and bird habitat loss in Colombia. Biol. Conserv. 2021, 257, 109044. [Google Scholar] [CrossRef]
- Vargas-Cárdenas, F.; Arroyo-Rodríguez, V.; Morante-Filho, J.C. Landscape forest loss decreases bird diversity with strong negative impacts on forest species in a mountain region. Persp. Ecol. Conserv. 2022, 20, 386–393. [Google Scholar] [CrossRef]
- Sullivan Brian, L.; Phillips, T.; Dayer, A.A.; Wood, C.L.; Farnsworth, A.; Iliff, M.J.; Davies, I.J.; Wiggins, A.; Fink, D.; Hochachka, W.M.; et al. Using open access observational data for conservation action: A case study for birds. Biol. Conserv. 2017, 208, 5–14. [Google Scholar] [CrossRef]
- Matuoka, M.A.; Benchimol, M.; Morante-Filho, J.C. Tropical forest loss drives divergent patterns in functional diversity of forest and non-forest birds. Biotropica 2020, 52, 738–748. [Google Scholar] [CrossRef]
- Oostra, V.; Gomes, L.G.; Nijman, V. Implications of deforestation for the abundance of restricted-range bird species in a Costa Rican cloud-forest. Bird Conserv. Int. 2008, 18, 11–19. [Google Scholar] [CrossRef]
- Brown, W.P.; Sullivan, P.J. Avian community composition in isolated forest fragments: A conceptual revision. Oikos 2005, 111, 1–8. [Google Scholar] [CrossRef]
- Chen, W.; Flatnes, J.E.; Miteva, D.A.; Klaiber, H.A. The Impact of Deforestation on Nature-Based Recreation: Evidence from Citizen Science Data in Mexico. Land Econ. 2022, 98, 22–40. [Google Scholar] [CrossRef]
- Menger, J.; Magnusson, W.E.; Anderson, M.J.; Schlegel, M.; Pe’er, G.; Henle, K. Environmental characteristics drive variation in Amazonian understorey bird assemblages. PLoS ONE 2017, 12, e0171540. [Google Scholar] [CrossRef] [PubMed]
- Kéry, M.; Schaub, M. Bayesian Population Analysis Using WinBUGS: A Hierarchical Perspective; Academic Press: London, UK, 2012. [Google Scholar]
- Liang, Y.; Rudik, I.; Zou, E.Y.; Johnston, A.; Rodewald, D.; Kling, C.L. Conservation cobenefits from air pollution regulation: Evidence from birds. Proc. Natl. Acad. Sci. USA 2020, 117, 30900–30906. [Google Scholar] [CrossRef] [PubMed]
- Pearson, C.E.; Ormerod, S.J.; Symondson, W.O.; Vaughan, I.P. Resolving large-scale pressures on species and ecosystems: Propensity modelling identifies agricultural effects on streams. J. Appl. Ecol. 2016, 53, 408–417. [Google Scholar] [CrossRef] [PubMed]
- Claassen, R.; Savage, J.; Loesch, C.; Breneman, V.; Williams, R.; Mulvaney, B.; Fairbanks, T. Additionality in grassland easements to provide migratory bird habitat in the Northern Plains. J. Agric. Resour. Econ. 2017, 42, 291–309. [Google Scholar]
- QGIS.org. QGIS Geographic Information System (Version 3.32.1). Open Source Geospatial Foundation. 2023. Available online: https://qgis.org (accessed on 10 September 2023).
- CONAFOR Estimación de la tasa de Deforestación Bruta en México para el Periodo 2001–2018 Mediante el Método de Muestreo. Documento Técnico. Jalisco, México. 2020. Available online: https://www.gob.mx/conafor/documentos/estimacion-de-la-tasa-de-deforestacion-bruta-en-mexico-para-el-periodo-20012018-mediante-el-metodo-de-muestreo (accessed on 29 June 2023).
- eBird Basic Dataset. Version: EBD_relJul-2022; Cornell Lab of Ornithology: Ithaca, New York, USA, July 2022. Available online: https://www.ebird.org/science/download-ebird-data-products (accessed on 9 July 2022).
- GBIF.org. GBIF Occurrence Download. 30 October 2024. Available online: https://doi.org/10.15468/dl.bwbv77 (accessed on 30 October 2024).
- Chesser, R.T.; Billerman, S.M.; Burns, K.J.; Cicero, C.; Dunn, J.L.; Hernández-Baños, B.E.; Jiménez, R.A.; Johnson, O.; Kratter, A.W.; Mason; et al. Check-List of North American Birds (Online). American Ornithological Society. 2024. Available online: https://checklist.americanornithology.org/taxa/ (accessed on 25 August 2024).
- INEGI. Uso del Suelo y Vegetación. [Conjunto de Datos Geoespaciales]. Instituto Nacional de Estadística y Geografía. Available online: https://www.inegi.org.mx/temas/usosuelo/#mapas (accessed on 20 December 2024).
- ter Braak, C.J.F.; Šmilauer, P. Canoco Reference Manual and User’s Guide: Software for Ordination, Version 5.0; Microcomputer Power: Ithaca, NY, USA, 2012. [Google Scholar]
- e-Birds. Explorar—eBird. Available online: https://ebird.org/explore (accessed on 6 January 2025).
- CONANP. Áreas Naturales Protegidas de México: Delimitación y Distribución. Comisión Nacional de Áreas Naturales Protegidas. Sistema de Información Geográfica|gob.mx|CONANP. Available online: https://sig.conanp.gob.mx/Shape (accessed on 18 December 2024).
- CONABIO. Provincias Biogeográficas Mexicanas 2017. [ESRI Shapefile]. Comisión Nacional para el Conocimiento y Uso de la Biodiversidad. Geoportal del Sistema Nacional de Información Sobre Biodiversidad [17,159]—CONABIO. Available online: http://www.conabio.gob.mx/informacion/gis/ (accessed on 19 December 2024).
- Huérfano Torres, C. Evaluación de la Avifauna y Deforestación Colombiana en zonas Afectadas por el Postconflicto. Bachelor’s Thesis, Universidad de los Andes, Bogotá, Colombia, 2021. [Google Scholar]
- Clerici, N.; Salazar, C.; Pardo-Díaz, C.; Jiggins, C.D.; Richardson, J.E.; Linares, M. Peace in Colombia is a critical moment for Neotropical connectivity and conservation: Save the northern Andes–Amazon biodiversity bridge. Conserv. Lett. 2019, 12, 1–7. [Google Scholar] [CrossRef]
- Laurance, W.F.; Vasconcelos, H.L. Agroforestry and biodiversity conservation in tropical landscapes. In Ecological Effects of Habitat Fragmentation in the Tropics, 1st ed.; Schroth, G., da Fonseca, G.A.B., Harvey, C.A., Gascon, C., Vasconcelos, H.L., Izac, A.M.N., Eds.; Island Press: Washington, DC, USA, 2004; pp. 33–49. [Google Scholar]
- Nascimento, H.E.M.; Laurance, W.F. Biomass dynamics in amazonian forest fragments. Ecol. Appl. 2004, 14, 127–138. [Google Scholar] [CrossRef]
- Martínez-Morales, M.A.; Zuria, I.; Chapa-Vargas, L.; MacGregor-Fors, I.; Ortega-Álvarez, R.; Romero-Águila, E.; Carbó, P. BIODIVERSITY RESEARCH: Current distribution and predicted geographic expansion of the Rufous-backed Robin in Mexico: A fading endemism? Divers. Distrib. 2010, 16, 786–797. [Google Scholar] [CrossRef]
- Lomáscolo, S.B.; Monmany, A.C.; Malizia, A.; Martin, T.E. Flexibility in nest-site choice and nesting success of Turdus rufiventris (Turdidae) in a montane forest in northwestern Argentina. Wilson J. Ornithol. 2010, 122, 674–680. [Google Scholar] [CrossRef]
- Howes, B.; González-Suárez, M.; Jensen, H.J.; dos Anjos, L.; Develey, P.F.; Hatfield, J.H.; Morante-Filho, J.C.; Uezu, A.; Banks-Leite, C. Deforestation alters species interactions. Nat Sci. 2023, 3, e20220027. [Google Scholar] [CrossRef]
- Davis, H. Forest disturbance has negative consequences for the persistence of Jamaica’s threatened and endangered bird species in Cockpit Country. J. Caribb. Ornithol. 2017, 30, 57–68. [Google Scholar] [CrossRef]
- ter Braak, C.J.F. Canonical Correspondence Analysis: A New Eigenvector Technique for Multivariate Direct Gradient Analysis. Ecology 1986, 67, 1167–1179. [Google Scholar] [CrossRef]


| Variable | Description | Source | Measurement Unit |
|---|---|---|---|
| Records | Raw record, which represents the number of individuals observed in the period 2016–2018 for each selected species (Cardellina rubra, Campylopterus hemileucurus, Cassiculus melanicterus, Cathartes aura, Columbina talpacoti, Coragyps atratus, Dives dives, Geranoaetus albicaudatus, Thryomanes bewickii, and Turdus rufopalliatus.) | eBird and GBIF [16,17] 2016–2018. | Continuous variable |
| Whatchers | Number of watchers/collectors per selected species present in each grid cell during the period 2016–2018. | eBird and GBIF [16,17] 2016–2018. | Continuous variable |
| R_abundance | Relative abundance estimated by fixed-effects panel data regression for each selected species (Campylopterus hemileucurus, Cathartes aura, Columbina talpacoti, Dives dives, Geranoaetus albicaudatus, Thryomanes bewickii, and Turdus rufopalliatus) | Own estimate based on eBird and GBIF data [16,17] 2016–2018. | Continuous variable |
| Def | Mean gross deforestation rate per grid cell during the period 2016–2018. | CONAFOR, 2020 [15] | Continuous variable |
| Wdef | Spatially lagged deforestation rate based on a first-order queen contiguity matrix. | CONAFOR, 2020 [15] | Continuous variable |
| Defo | Binary variable that takes a value of 1 if the gross deforestation rate in the grid cell is ≥4% to ≤12% during the period 2001–2018 and 0 otherwise. | CONAFOR, 2020 [15] | Dichotomous variable |
| PA | Binary variable that takes a value of 1 if the grid cell has at least one federal protected area, and 0 otherwise (updated to 2024 with 204 PA). | CONANP, 2024 [21] | Dichotomous variable |
| Bioregion | Indicates the bioregion to which each grid cell belongs (Nearctic = 1, Mexican transition zone = 2, and Neotropical = 3). If the grid cell comprises more than one bioregion, it is classified as the bioregion with the highest percentage of area. | CONABIO [23] | Categorical variable |
| Landscape | Percentage of land use (xeric, forests, agricultural, tropical forests, grasslands) related to vegetation cover per grid cell. | INEGI [19] | Continuous variable |
| Scope | Variable | Mean | Std. Dev. | Min. | Max. | No. of Grid Cells |
|---|---|---|---|---|---|---|
| Records | R_C.rubra | 36.24 | 59.71 | 1 | 287 | 24 |
| R_C.hemileucurus | 11.83 | 11.4 | 1 | 59 | 14 | |
| R_C.melanicterus | 39.97 | 90.23 | 1 | 588 | 43 | |
| R_C.aura | 36.62 | 73.77 | 1 | 828 | 393 | |
| R_C.talpacoti | 37.92 | 86.85 | 1 | 1124 | 135 | |
| R_C.atratus | 42.22 | 84.17 | 1 | 799 | 269 | |
| R_D.dives | 51.04 | 94.53 | 1 | 685 | 113 | |
| R_G.albicaudatus | 9.49 | 14.06 | 1 | 93 | 42 | |
| R_T.bewickii | 46.33 | 198.05 | 1 | 2061 | 90 | |
| R_T.rufopalliatus | 53.85 | 138.7 | 1 | 1183 | 82 | |
| Collectors (Colle) | C_C.rubra | 25.96 | 44.29 | 1 | 162 | 24 |
| C_C.hemileucurus | 18.88 | 21.8 | 1 | 116 | 14 | |
| C_C.melanicterus | 28.12 | 57.56 | 1 | 239 | 43 | |
| C_C.aura | 44.04 | 85.35 | 1 | 828 | 393 | |
| C_C.talpacoti | 48.1 | 178.41 | 1 | 3183 | 135 | |
| C_C.atratus | 33.77 | 59.62 | 1 | 441 | 269 | |
| C_D.dives | 65.92 | 132.28 | 1 | 1699 | 113 | |
| C_G.albicaudatus | 9.37 | 13.85 | 1 | 93 | 42 | |
| C_T.bewickii | 34.79 | 104.11 | 1 | 992 | 90 | |
| C_T.rufopalliatus | 41 | 92.74 | 1 | 651 | 82 | |
| Relative abundance | A_C.rubra | 41.04 | 14.58 | 29 | 108 | 8 |
| (R_abundance) | A_C.hemileucurus | 13.29 | 3.17 | 8 | 18 | 5 |
| A_C.melanicterus | 29.09 | 6.98 | 19 | 68 | 43 | |
| A_C.aura | 6.39 | 15.63 | 1 | 130 | 131 | |
| A_C.talpacoti | 11.74 | 9.52 | 1 | 81 | 45 | |
| A_C.atratus | 18.66 | 32.69 | 1 | 239 | 90 | |
| A_D.dives | 22.99 | 15.87 | 1 | 117 | 38 | |
| A_G.albicaudatus | 1.17 | 0.78 | 1 | 4 | 14 | |
| A_T.bewickii | 12.61 | 59.48 | 1 | 556 | 30 | |
| A_T.rufopalliatus | 7.82 | 19.34 | 1 | 145 | 27 | |
| Landscape | Xeric | 1.95 | 4.88 | 0 | 47.38 | 807 |
| Grasslands | 8.6 | 14.15 | 0 | 77.73 | 807 | |
| Forests | 7.93 | 14.39 | 0 | 80.26 | 807 | |
| Agriculture | 4.34 | 8.53 | 0 | 78.84 | 807 | |
| Tropical forest | 4.41 | 9.22 | 0 | 71.06 | 807 | |
| Anthropogenic | Def | 0.02 | 0.03 | 0 | 0.12 | 807 |
| Defo | 0.2 | 0.4 | 0 | 1 | 807 | |
| Protection status | PA | 0.54 | 0.5 | 0 | 1 | 807 |
| Biogeographic | Bioregions | 1.71 | 0.76 | 1 | 3 | 807 |
| Relative Abundance | Grid Cells | |||
|---|---|---|---|---|
| Species | Treatment | Control | Treatment | Control |
| Cardellina rubra | 119 (12.08%) | 866 (87.92) | 3 (12.5%) | 21 (87.5%) |
| Campylopterus hemileucurus | 95 (51.08%) | 91 (48.92%) | 7 (50%) | 7 (50%) |
| Cassiculus melanicterus | 358 (28.62%) | 893(71.38%) | 11 (25.58%) | 32 (74.42%) |
| Cathartes aura | 477 (19%) | 2033 (81%) | 98 (24.94%) | 295 (75.06%) |
| Columbina talpacoti | 576 (36.34%) | 1009 (63.66%) | 56 (41.48%) | 79 (58.52%) |
| Coragyps atratus | 1423 (28.56%) | 3559(71.44%) | 95 (35.58%) | 172 (64.42%) |
| Dives dives | 1268 (48.8%) | 1330 (51.19%) | 60 (53.1%) | 53 (46.9%) |
| Geranoaetus albicaudatus | 316 (34.35%) | 604 (65.65%) | 53 (30.81%) | 119 (69.19%) |
| Thryomanes bewickii | 39 (3.44%) | 1096 (96.56%) | 11 (12.22%) | 79 (87.78%) |
| Turdus rufopalliatus | 68 (10.61%) | 573 (98.39%) | 16 (19.51%) | 66 (80.49%) |
| Variable | Cardellina rubra | Campylopterus hemileucurus | Cassiculus melanicterus | Cathartes aura | Columbina talpacoti |
|---|---|---|---|---|---|
| Outcome Equation (8): Deforestation | −1.03 | −1.35 | 4.71 ** | 0.82 * | −2.94 ** |
| (9.96) | (2.92) | (1.49) | (0.47) | (1.16) | |
| ZTM | −17.50 | - | - | −4.01 *** | - |
| (17.24) | ( - ) | ( - ) | (1.4) | ( - ) | |
| Neotropical | −36.53 ** | - | - | −4.38 *** | - |
| (17.24) | ( - ) | ( - ) | (1.67) | ( - ) | |
| PA | −0.88 | 2.05 | 2.12 | 0.82 *** | - |
| (7.72) | (3.15) | (2.26) | (0.27) | ( - ) | |
| Inverse Mills ratio | −22.76 ** | −13.04 ** | 8.63 | −8.08 *** | 12.24 *** |
| (10.80) | (5.13) | (6.05) | 1.54 | (2.46) | |
| Constant | 100.79 *** | 40.1 *** | 1.02 | 14.26 *** | 20.28 *** |
| (18.88) | (9.68) | (6.83) | (1.00) | (3.52) | |
| Selection Equation (5): Watchers | 0.00006 *** | 0.00007 *** | 0.00004 *** | 0.001 *** | 0.0002 *** |
| (0.00002) | (0.00001) | (0.00001) | (0.00005) | (0.00001) | |
| ZTM | 0.12 | - | - | 0.18 * | 1.53 *** |
| (0.53) | ( - ) | ( - ) | (0.09) | (0.18) | |
| Neotropical | 1.68 *** | - | - | 0.31 *** | 0.84 *** |
| (0.43) | ( - ) | ( - ) | (0.11) | (0.21) | |
| Constant | −2.48 *** | −2.92 *** | −2.48 *** | −0.93 *** | −2.27 *** |
| (0.23) | (0.29) | (0.24) | (0.06) | (0.16) | |
| corr(e.selection, e.abundance) | - | - | - | - | −0.94 *** |
| ( - ) | ( - ) | ( - ) | ( - ) | (0.02) | |
| Pseudo R2 | 0.33 | 0.22 | 0.08 | 0.54 | 0.38 |
| AIC | 155.60 | 262.54 | 316.55 | 527.0 | 457.90 |
| BIC | 179.06 | 281.31 | 335.33 | 551.03 | 481.37 |
| Log likelihood | −847.30 | −2402.86 | −1014.4 | −1781.59 | −679.9 |
| Wald Chi2 (dof) | 973.11 | 3.18 | 15.44 | 40.88 | 6.70 |
| Prob > Chi2 | 0.00 | 0.36 | 0.00 | 0.00 | 0.03 |
| Durbin score (p-value) | 0.70 | 0.95 | 0.81 | 0.67 | 0.21 |
| Wu–Hausman (p-value) | 0.74 | 0.95 | 0.82 | 0.67 | 0.22 |
| Treated observations | 24 | 42 | 43 | 393 | 135 |
| Variable | Coragyps atratus | Dives dives | Geranoaetus albicaudatus | Thryomanes bewickii | Turdus rufopalliatus |
|---|---|---|---|---|---|
| Outcome Equation (8): Deforestation | −14.34 *** | −4.23 ** | 0.07 | −29.59 *** | −23.53 *** |
| (5.38) | (2.1) | (0.26) | (5.13) | (5.28) | |
| ZTM | 14.78 *** | - | −0.09 | - | −17.52 ** |
| (5.45) | ( - ) | (0.38) | ( - ) | (8.04) | |
| Neotropical | 3.9 | - | −0.27 | - | −44.56 |
| (6.15) | ( - ) | (0.39) | ( - ) | (6.59) | |
| PA | - | - | - | −7.23 | 2.49 |
| ( - ) | ( - ) | ( - ) | (10.13) | (6.59) | |
| Bioregion | - | −11.63 *** | - | - | - |
| ( - ) | (3.72) | ( - ) | ( - ) | ( - ) | |
| Inverse Mills ratio | −82.68 *** | −20.38 ** | 0.15 | −129.52 *** | −79.91 ** |
| (17.07) | (4.31) | (0.23) | (44.31) | (33.55) | |
| Constant | 14.21 *** | −34.82 *** | 0.96 | 115.07 *** | 105.47 *** |
| (4.58) | (10.53) | (0.64) | (1.61) | (7.83) | |
| Treatment Equation (7): WDEF | - | 25.7 *** | - | - | -- |
| ( - ) | (2.57) | ( - ) | ( - ) | ( - ) | |
| Bioregion | - | 0.36 *** | - | - | - |
| ( - ) | (0.08) | ( - ) | ( - ) | ( - ) | |
| Constant | - | −3.83 *** | - | - | - |
| ( - ) | 0.35 | ( - ) | ( - ) | ( - ) | |
| Selection Equation (5): Watchers | 0.0002 *** | 0.00008 *** | 0.00008 *** | 0.00006 *** | 0.00006 *** |
| (0.00002) | (0.00001) | (0.00001) | (0.00002) | (0.00001) | |
| ZTM | 1.07 *** | - | 0.43 ** | −0.37 *** | 0.48 *** |
| (0.16) | ( - ) | (0.19) | (0.18) | (0.19) | |
| Neotropical | 0.63 *** | - | 0.35 | 0.2 | 0.64 *** |
| (0.19) | ( - ) | (0.23) | (0.19) | (0.21) | |
| Constant | −1.45 *** | −1.76 *** | −2.11 *** | −1.36 *** | −1.89 *** |
| (0.11) | (0.15) | (0.15) | (0.1) | (0.14) | |
| corr(e.selection, e.abundance) | - | - | - | - | - |
| ( - ) | ( - ) | ( - ) | ( - ) | ( - ) | |
| corr(e.Defo, e.abundance) | - | - | - | - | - |
| ( - ) | ( - ) | ( - ) | ( - ) | ( - ) | |
| corr(e.Defo, e.selection) | - | - | - | - | - |
| ( - ) | ( - ) | ( - ) | ( - ) | ( - ) | |
| Pseudo R2 | 0.23 | 0.23 | 0.18 | 0.12 | 0.08 |
| AIC | 797.4 | 385.37 | 281.19 | 506.97 | 496.46 |
| BIC | 820.86 | 401.57 | 304.66 | 530.43 | 519.93 |
| Log likelihood | −2382.73 | −2353.09 | −185.05 | −2750.73 | −1397.42 |
| Wald Chi2 (dof) | 5404.01 | 12.18 | 0.61 | 648 | 928.01 |
| Prob > Chi2 | 0 | 0.002 | 0.89 | 0 | 0 |
| Durbin score p-value | 0.1076 | 0.0337 | 0.8454 | 0.7319 | 0.7906 |
| Wu–Hausman p-value | 0.1104 | 0.0355 | 0.8557 | 0.7398 | 0.7976 |
| Montiel–Pflueger weak instrument test (tau 5% = 37.418) | - | Effect. F statistic: 163.54 | - | - | - |
| Treated observations | 267 | 113 | 42 | 90 | 82 |
Disclaimer/Publisher’s Note: The statements, opinions and data contained in all publications are solely those of the individual author(s) and contributor(s) and not of MDPI and/or the editor(s). MDPI and/or the editor(s) disclaim responsibility for any injury to people or property resulting from any ideas, methods, instructions or products referred to in the content. |
© 2025 by the authors. Licensee MDPI, Basel, Switzerland. This article is an open access article distributed under the terms and conditions of the Creative Commons Attribution (CC BY) license (https://creativecommons.org/licenses/by/4.0/).
Share and Cite
Beteta-Hernández, C.I.; Zuria, I.; Garcillán, P.P.; Beltrán-Morales, L.F.; Moreno, M.d.C.B.; Avilés-Polanco, G. Causal Effect Analysis of the Relationship Between Relative Bird Abundance and Deforestation in Mexico. Birds 2025, 6, 36. https://doi.org/10.3390/birds6030036
Beteta-Hernández CI, Zuria I, Garcillán PP, Beltrán-Morales LF, Moreno MdCB, Avilés-Polanco G. Causal Effect Analysis of the Relationship Between Relative Bird Abundance and Deforestation in Mexico. Birds. 2025; 6(3):36. https://doi.org/10.3390/birds6030036
Chicago/Turabian StyleBeteta-Hernández, Claudia Itzel, Iriana Zuria, Pedro P. Garcillán, Luis Felipe Beltrán-Morales, María del Carmen Blázquez Moreno, and Gerzaín Avilés-Polanco. 2025. "Causal Effect Analysis of the Relationship Between Relative Bird Abundance and Deforestation in Mexico" Birds 6, no. 3: 36. https://doi.org/10.3390/birds6030036
APA StyleBeteta-Hernández, C. I., Zuria, I., Garcillán, P. P., Beltrán-Morales, L. F., Moreno, M. d. C. B., & Avilés-Polanco, G. (2025). Causal Effect Analysis of the Relationship Between Relative Bird Abundance and Deforestation in Mexico. Birds, 6(3), 36. https://doi.org/10.3390/birds6030036