Article

Bird Community Structure Changes as Araucaria Forest Cover Increases in the Highlands of Southeastern Brazil

by
Carla Suertegaray Fontana
1,2,*,
Lucilene Inês Jacoboski
1,3,
Jonas Rafael Rodrigues Rosoni
4,
Juliana Lopes da Silva
1,
Filipe Augusto Pasa Bernardi
5,
Pamela Eliana Malmoria
6,
Christian Beier
7 and
Sandra Maria Hartz
1
1
Population and Community Ecology Laboratory, Federal University of Rio Grande do Sul (UFRGS), Porto Alegre 91501-970, RS, Brazil
2
Graduate Program in Animal Biodiversity, Federal University of Santa Maria (UFSM), Santa Maria 97105-900, RS, Brazil
3
National Center for Research and Conservation of Wild Birds (CEMAVE/ICMBio), Cabedelo 58108-012, PB, Brazil
4
Conservation Biology Lab., Center for Applied Ecology (CECOAL-CONICET), Corrientes 3400, COR, Argentina
5
Independent Researcher, Caxias do Sul 95032-620, CXJ, Brazil
6
Department of Ecology, Genetics and Evolution & IEGEBA-CONICET, FCEN, University of Buenos Aires, Ciudad Universitaria, Buenos Aires C1428EGA, Bs.As., Argentina
7
Graduate Program in Ecology and Evolution of Biodiversity, School of Health and Life Sciences, Pontifical Catholic University of Rio Grande do Sul (PUCRS), Porto Alegre 90619-900, RS, Brazil
*
Author to whom correspondence should be addressed.
Birds 2025, 6(3), 37; https://doi.org/10.3390/birds6030037
Submission received: 10 May 2025 / Revised: 6 July 2025 / Accepted: 10 July 2025 / Published: 16 July 2025

Simple Summary

The Araucaria Forest, renowned for its towering conifers and high biodiversity, is typically found in southern Brazil as a mosaic interwoven with native grasslands, creating a patchwork landscape of forested and open habitats. Most of this special forest has been destroyed—less than 1% remains—making it urgent to understand how to protect the organisms that depend on it. This study investigated how different proportions of Araucaria Forest and grassland affect bird communities. We studied birds along five trails with different amounts of forest, finding that the kinds of birds changed a lot as forest cover increased. Interestingly, while there were more types of birds where the forest was patchier, the ecological roles birds play in nature, like spreading seeds or eating insects, were more varied where there was less forest cover. The main conclusion is that having a mix of forest and grassland helps keep bird diversity high and supports many different ecological roles. This means that preserving both forests and open areas is important, not just for birds but for the health of the whole ecosystem. These findings can help guide better land management and conservation, benefiting both nature and people who rely on healthy environments.

Abstract

The Brazilian Araucaria Forest (AF) now covers only 1% of its original extent due to significant degradation, making conservation a challenge. The AF occurs in a mosaic alongside grassland and Atlantic Forest ecosystems, influencing bird species’ distribution through ecological processes. We compared the composition and functional diversity of the bird community along a gradient of AF cover in a protected area (Pró-Mata Private Natural Heritage Reserve) in southern Brazil. Bird sampling was conducted using MacKinnon lists along five trails with different histories of vegetation suppression, based on forest cover estimates from landscape imagery. Birds were functionally classified based on morphological and ecological traits. We recorded 191 bird species in total. We found higher bird richness in trails with less forest cover, while functional diversity responded inversely to vegetation cover. Bird species composition shifted from more open-habitat specialists to more forest specialists with the increasing forest cover and vegetation structural complexity. These findings highlight the ecological importance of maintaining vegetation heterogeneity, as vegetation mosaics enhance avian species richness and support a broader range of functional traits and ecosystem processes. We recommend the conservation of Araucaria Forest–grassland mosaics as a strategic approach to support multidimensional biodiversity and sustain key ecological functions in southern Brazil.

1. Introduction

The Brazilian Atlantic Forest is one of the world’s most biodiverse yet threatened hotspots [1,2]. Its vegetation loss is both severe and spatially uneven, with native cover ranging from 65% to 97% loss across Brazilian states. In the southernmost region, only 13.5% of this native vegetation remains [3]. This region comprises a mosaic of Araucaria Forest and native grasslands—together known as the Araucaria Forest–grassland mosaic [4]—which harbors exceptional biodiversity, including the critically endangered conifer Araucaria angustifolia [5]. Despite their ecological importance, these ecosystems are among the most threatened in Brazil [6], yet they support high levels of plant and animal diversity, including endemic and threatened bird species (e.g., Long-tailed Cinclodes (Cinclodes pabsti), Vinaceous-breasted Amazon (Amazona vinacea), Black-and-white Monjita (Heteroxolmis dominicana), Black-fronted Piping-Guan (Pipile jacutinga)) [7,8].
Since European colonization, the Araucaria Forest has declined to less than 1% of its original area, while grasslands have been degraded by unsustainable land use, climate change, and suppression of natural disturbances such as grazing and fire [2]. These pressures promote woody plant encroachment, a process that transforms open habitats and alters vegetation structure [9]. This structural shift has cascading effects on biodiversity, reshaping animal communities and disrupting ecological interactions. Studies on various taxonomic groups across forest fragments and successional gradients consistently report changes in community composition related to vegetation cover, spatial distribution, altitude, and successional stage (e.g., [10,11,12,13]).
Birds are ideal indicators of ecological change due to their sensitivity to habitat structure and their key ecosystem functions, such as seed dispersal, pollination, and invertebrate control [14,15]. Functional traits determine how species respond to environmental variation, and certain trait combinations may constrain species to specific successional stages or habitat types [16,17,18]. As forest succession progresses, the structural attributes of vegetation—such as canopy height, understory density, and vertical layering—typically increase, resulting in greater habitat heterogeneity. These structural shifts directly affect the availability of foraging substrates, nesting sites, and refuge areas, thereby influencing not only the richness and composition of bird species but also their functional diversity [19,20]. These dynamics offer a unique opportunity to explore how successional gradients in the Araucaria Forest–grassland mosaic shape bird community organization [21].
Because not all species contribute equally to ecosystem functioning, understanding functional diversity—the range of ecological roles played by species—is crucial for predicting ecosystem responses and informing conservation strategies [22,23]. Numerous studies have demonstrated that forest successional stages exert a strong influence on avian community structure, with later stages typically supporting higher species richness, greater functional trait diversity, and more specialized guilds due to increased habitat complexity and resource heterogeneity [19,24]. In early successional habitats, bird assemblages are often dominated by generalist and disturbance-tolerant species, whereas advanced stages tend to harbor forest-dependent taxa with distinct ecological roles and narrower niche requirements [25,26]. Functional diversity metrics such as functional dispersion have proven particularly sensitive to these gradients, capturing shifts in trait composition that are not always reflected in taxonomic richness alone [25,27]. These patterns underscore the importance of evaluating multiple dimensions of biodiversity when assessing the ecological consequences of succession and habitat restoration, especially in heterogeneous landscapes such as the Araucaria Forest–grassland mosaic.
This study aims to assess how a gradient of grassland-to-forest cover influences bird community structure in an Araucaria Forest–grassland mosaic, focusing on functional diversity and species composition. We hypothesize that (1) bird species composition and richness vary along the grassland–forest gradient; and (2) functional diversity of bird communities is influenced by the gradient of forest cover in the highlands of southern Brazil. We predicted that (1) open-habitat specialist species will be gradually replaced by forest specialists as forest cover increases, reflecting the shift in habitat availability; (2) the species richness will increase with the forest cover, as forests present more available niches due to structural complexity of vegetation; and (3) functional diversity peaks at intermediate levels of forest cover, reflecting maximum structural heterogeneity and resource availability as predicted by other studies [28,29]. By integrating multiple dimensions of biodiversity, this study aims to inform conservation planning in threatened ecosystems of southern Brazil—particularly within the ecological corridor that connects our study site with Aparados da Serra and Serra Geral National Parks.

2. Materials and Methods

2.1. Study Area

The study was conducted in the Pró-Mata Private Natural Heritage Reserve (RPPN Pró-Mata), a 3100-hectare conservation unit under permanent private ownership and management, primarily aimed at preserving biological diversity [30]. The reserve is located on the Araucaria Plateau, between coordinates 29°26′17″ S and 50°08′14″ W to 29°34′42″ S and 50°14′18″ W, in the municipality of São Francisco de Paula, in the northeastern region of the state of Rio Grande do Sul, Brazil. Altitudes range from 800 to 950 m. The average annual temperature is 14.5 °C, with average maximum and minimum temperatures of 20.3 °C and 9.9 °C, respectively. The region experiences high annual rainfall, averaging 2252 mm [31].
The RPPN encompasses remnants of both primary and regenerating forests within the Atlantic Forest domain, along with grassland formations. The site represents an ecotonal region characterized by the convergence of three key vegetation types: (1) South Brazilian Highland grasslands (Campos de Cima da Serra, CCS), which have been protected from cattle grazing and fire since 1994; (2) Mixed Ombrophilous Forest (Araucaria Forest), found at higher elevations (~900 m a.s.l.); and (3) Dense Ombrophilous Forest (Atlantic Forest), occurring at lower elevations (<700 m) [32].
Biodiversity studies have been ongoing at the site for over 30 years, ever since it was established as a research center, making it one of the most intensively studied areas in southern Brazil [33]. Prior to its acquisition for conservation and research, the area was subject to anthropogenic use, including timber processing, illegal extraction of native vegetation and Araucaria seeds, and livestock grazing, during which some of the original forest was degraded (CSF personal information).
Bird surveys were conducted along five pre-existing trails within RPPN Pró-Mata. These trails, previously studied and documented [34], exhibit distinct phytophysiognomies due to variations in floristic composition, land use history, and stages of ecological succession, which expresses the grassland–forest gradient found at this portion of the Atlantic Forest Biome [12]. To simplify the description of successional stages, trails were classified along a forest cover gradient, from low (grassland) to nearly complete forest cover (see Table 1 and Table 2 and Figure 1 for details).
Forest cover along each trail was estimated using supervised classification in QGIS v. 3.36 [35], utilizing the Dzetsaka v. 3.70 plugin [36] and Landsat-8 satellite imagery. A buffer of 100 m on either side of each trail’s centerline was used for these calculations to minimize local variation, particularly from transitions between Araucaria Forest and grasslands, while avoiding the inclusion of Atlantic Forest on the slopes (sensu [4]).
The gradient of forest cover identified along the trails corresponded well with the successional stages previously described for the region. This correspondence allowed us to qualitatively characterize the vegetation structure along each trail and infer that trails with less forest cover represented earlier successional stages, and trails with more forest cover represented advanced stages of succession as described in the RPPN Pró-Mata Management Plan [34] and by Baaske [37]. In these sources, relatively undisturbed areas are categorized as Grassland, Araucaria Forest, or Atlantic Forest, while anthropogenically modified areas are classified by successional stage (initial, intermediate, or advanced). Considering that all trails likely experienced some degree of anthropogenic disturbance, we adopted this same successional classification. However, to better reflect the forest cover gradient, we subdivided two of the intermediate categories, resulting in five distinct vegetation stages. For consistency with the literature, we grouped these into three broader successional categories in our analysis.
The original names of the trails are retained, as they are well-known to students, researchers, and local residents, and are also clearly signposted throughout the reserve. The trails and their surrounding 100 m buffers defined the study sites (see Figure 1A–C; Table 1 and Table 2).

2.2. Bird Sampling

Bird sampling was conducted between the years 2021 and 2024 considering the warmest months (spring and summer, n = 4) and the coldest months (autumn and winter, n = 3). Each of the trails was sampled seven times under weather conditions favorable to birdwatching. Bird sampling was conducted using the MacKinnon List (ML) method [38,39,40]. This method involves recording all bird species encountered along a fixed path in the chronological order of detection, forming lists or “samples” of a predetermined number of species. In our study, we opted for lists of 15 species. This number was selected based on a pilot design considering list lengths between 10 and 20 species, with 15 proving to be more representative of the highly diverse avifauna in our study area, which supports over 220 species (Fontana et al., unpublished data).
Each 15-species list provides a standardized sample of the local bird community. The ML method allows for the estimation of relative abundance indices by calculating the proportion of lists in which each species occurs [41].
Sampling on the trails was carried out from December 2021 to January 2024. At each of the seven expeditions, we search for birds in all the study trails with two to three experienced researchers censusing and one researcher taking notes. with a minimum total effort of 777 h of observation (observers/hours/trails). They were assisted by printed and digital bird identification guides, vocalization records, photographs published in applications and digital platforms (e.g., Merlin Bird ID).

2.3. Birds Functional Traits

To calculate functional diversity, traits of bird species were obtained from two databases: AVONET [42] and Elton Traits 1.0 [43]. Three traits of the bird species that are directly related to how birds interact with their environment and use resources were chosen: tarsal length, diet and foraging stratum (Table S6). The length of the tarsus is related to locomotion, so it has a strong influence on the mode of foraging [44]. Diet, on the other hand, determines which trophic resources are used by a species and, therefore, their function in the ecosystem [45]. Finally, the foraging stratum determines the type and place where a resource is consumed by each of the species, for example, a predominantly frugivorous bird that forages in the understory will disperse different seeds from a bird of the same trophic group that forages in the canopy of a forest [46].

2.4. Data Analysis

2.4.1. Overall Diversity

We assessed species richness through the rarefaction and extrapolation method implemented in the iNEXT package [47], based on sample size. This analysis was performed in R software version 4.4.0 [48], using the full set of species occurrence data obtained from standardized sampling. The resulting curves represent the number of species accumulated across sampled lists and were grouped by site. Confidence intervals at the 95% level were calculated using 999 bootstrap replicates [49].
A general overview of species abundance was obtained based on the number of lists in which each species was recorded, that is, its frequency across lists. Accordingly, the relative abundance index was calculated using the List Frequency Index (LFI), which consisted of dividing the number of lists in which each species occurred by the total number of lists obtained at the end of the sampling period [40]. To evaluate differences in species composition among sites, we performed a PERMANOVA (Permutational Multivariate Analysis of Variance) [50] using the Jaccard dissimilarity index and 9999 permutations using the adonis2 function. This method tests whether the variation in community composition among groups is greater than expected by chance, based on dissimilarity matrices. It allows formal statistical testing of the effect of site differences on community structure, directly addressing our main hypothesis. In addition, we conducted a Non-Metric Multidimensional Scaling (NMDS) ordination using the metaMDS function to visually explore patterns in species composition. NMDS is an ordination technique that represents multivariate data in a reduced dimensional space, preserving the rank order of dissimilarities among samples. While it does not test hypotheses statistically, it provides a visual representation that complements and helps interpret PERMANOVA results. To identify which species contributed to the observed patterns in the NMDS, we applied the envfit function with 9999 permutations. Species with p-values < 0.05 were considered significantly associated with the ordination space, indicating a strong relationship with changes in community structure (see Table S1). For these analyses, the vegan package version 2.6-6 was used [51].

2.4.2. Functional Diversity

For the functional characterization of bird species, taxa identified only at the genus level were excluded, as it is not possible to functionally characterize a species based solely on its genus, thus ensuring data accuracy. As a result, eight of the sampled species lists were reduced to fourteen identified species. The Functional Diversity Index (FD) proposed by [52] was calculated, which is a measure of functional diversity that quantifies functional variation within a community. This index is based on the average of the functional distances between all species in the community, where functional distance refers to the dissimilarity between species based on their traits. These distances represent how functionally distinct species are from one another, and are calculated in a multidimensional trait space. The greater the functional distance between two species, the more they differ in their ecological roles. To calculate this index, the dbFD function was used [27] from the FD package [27]. Subsequently, a functional dendrogram was calculated using the Gower distance. Considering that FD is an index dependent on species richness, we calculated the standardized effect size of functional diversity (sesFD), which removes the effect of richness. This is carried out by comparing the observed FD value of each community to a null distribution generated from random assemblages with the same species richness, but with species identities randomly reshuffled [53]. This approach allows us to assess whether functional diversity is higher or lower than expected given the number of species in the community. Thus, for the calculation of sesFD, the null taxa.labels model was used, which maintains the species richness in each community. For this test, 9999 permutations were used. The multidimensional functional diversity index FDis (Functional Dispersion) was also calculated. The FDis measure the distribution of species traits in a multidimensional space and representing how functionally diverse a community is. The FDis index is the average distance of the feature in the multidimensional space of a single species to the centroid of all species and are independent of species richness [27,54]. In this study, the index was calculated using presence/absence data and thus reflects the distribution of species in functional space. The functional composition of communities was also assessed using Community-Weighted Means (CWM), which represent the average trait values in a community. With the results of sesFD and FDis for each community, Univariate Analysis of Variance (ANOVA) was performed followed by Tukey’s test. Through Tukey’s test, it is possible to evaluate the contrasts between each of the sampled sites, through comparisons between the means, thus indicating the significance values of p. For these analyses, the FD, spicy, ade4 and tidyverse packages were used. All analyses were performed using R software version 4.4.0 [55].

3. Results

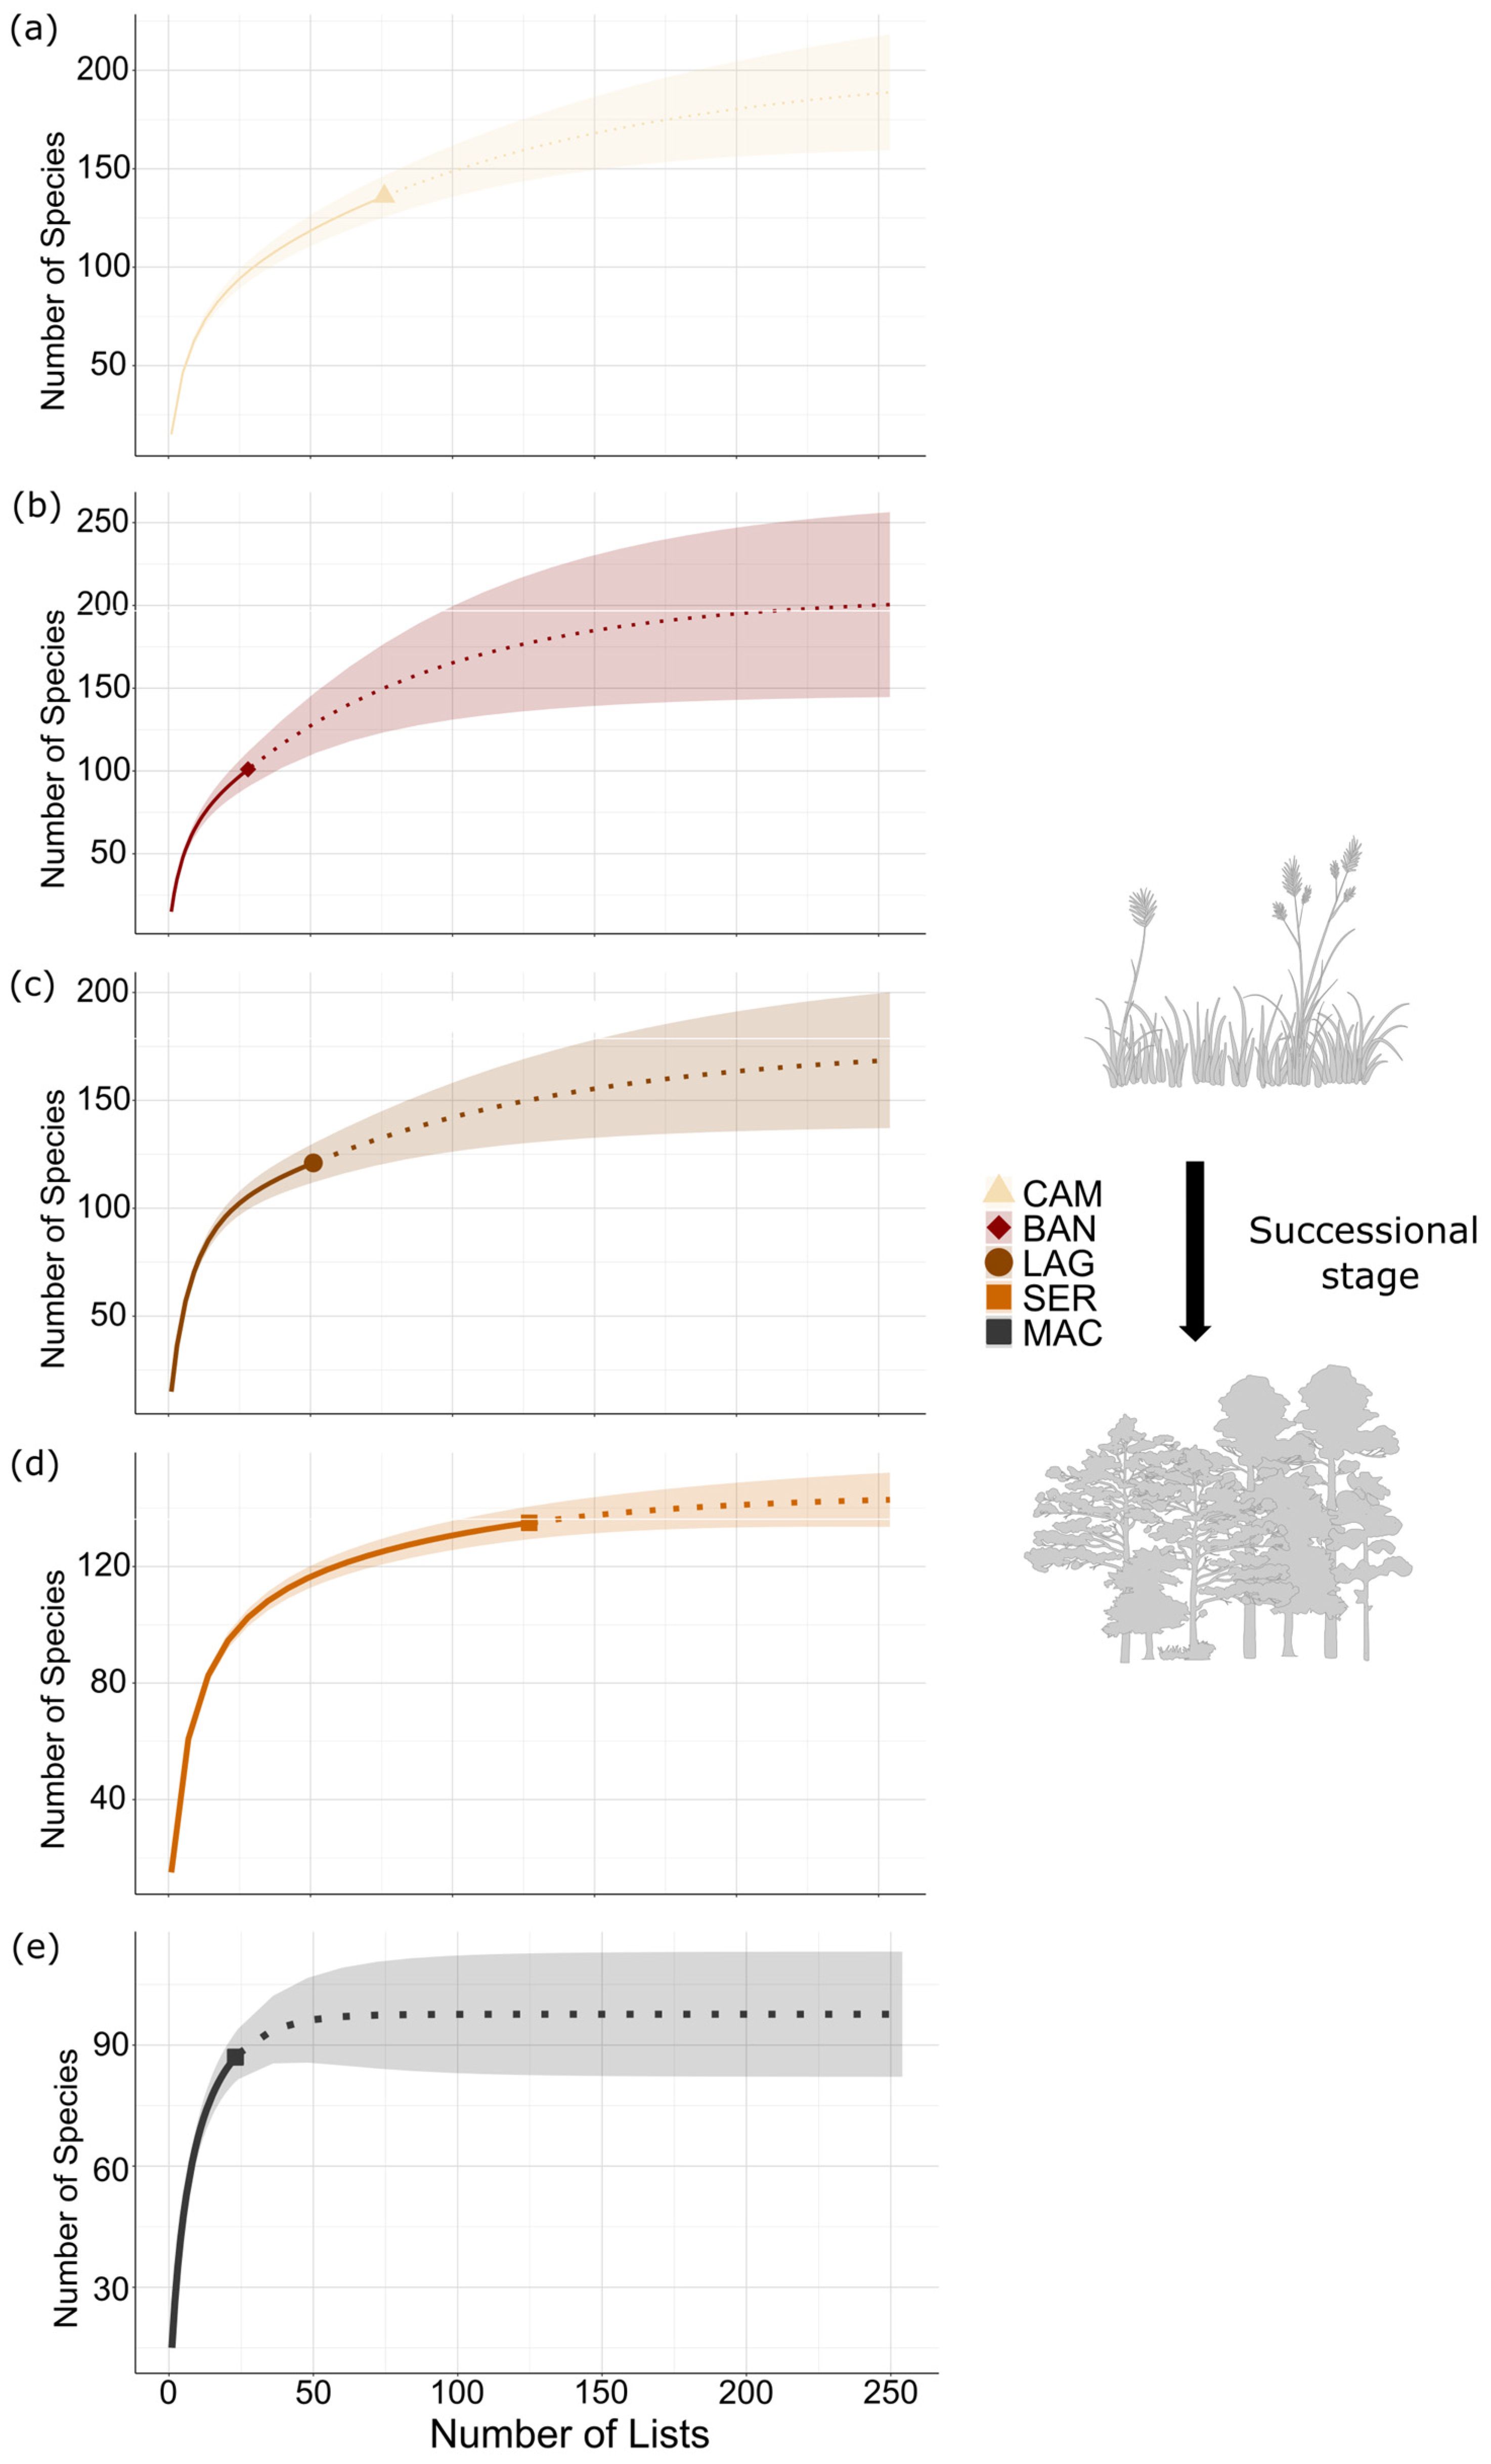
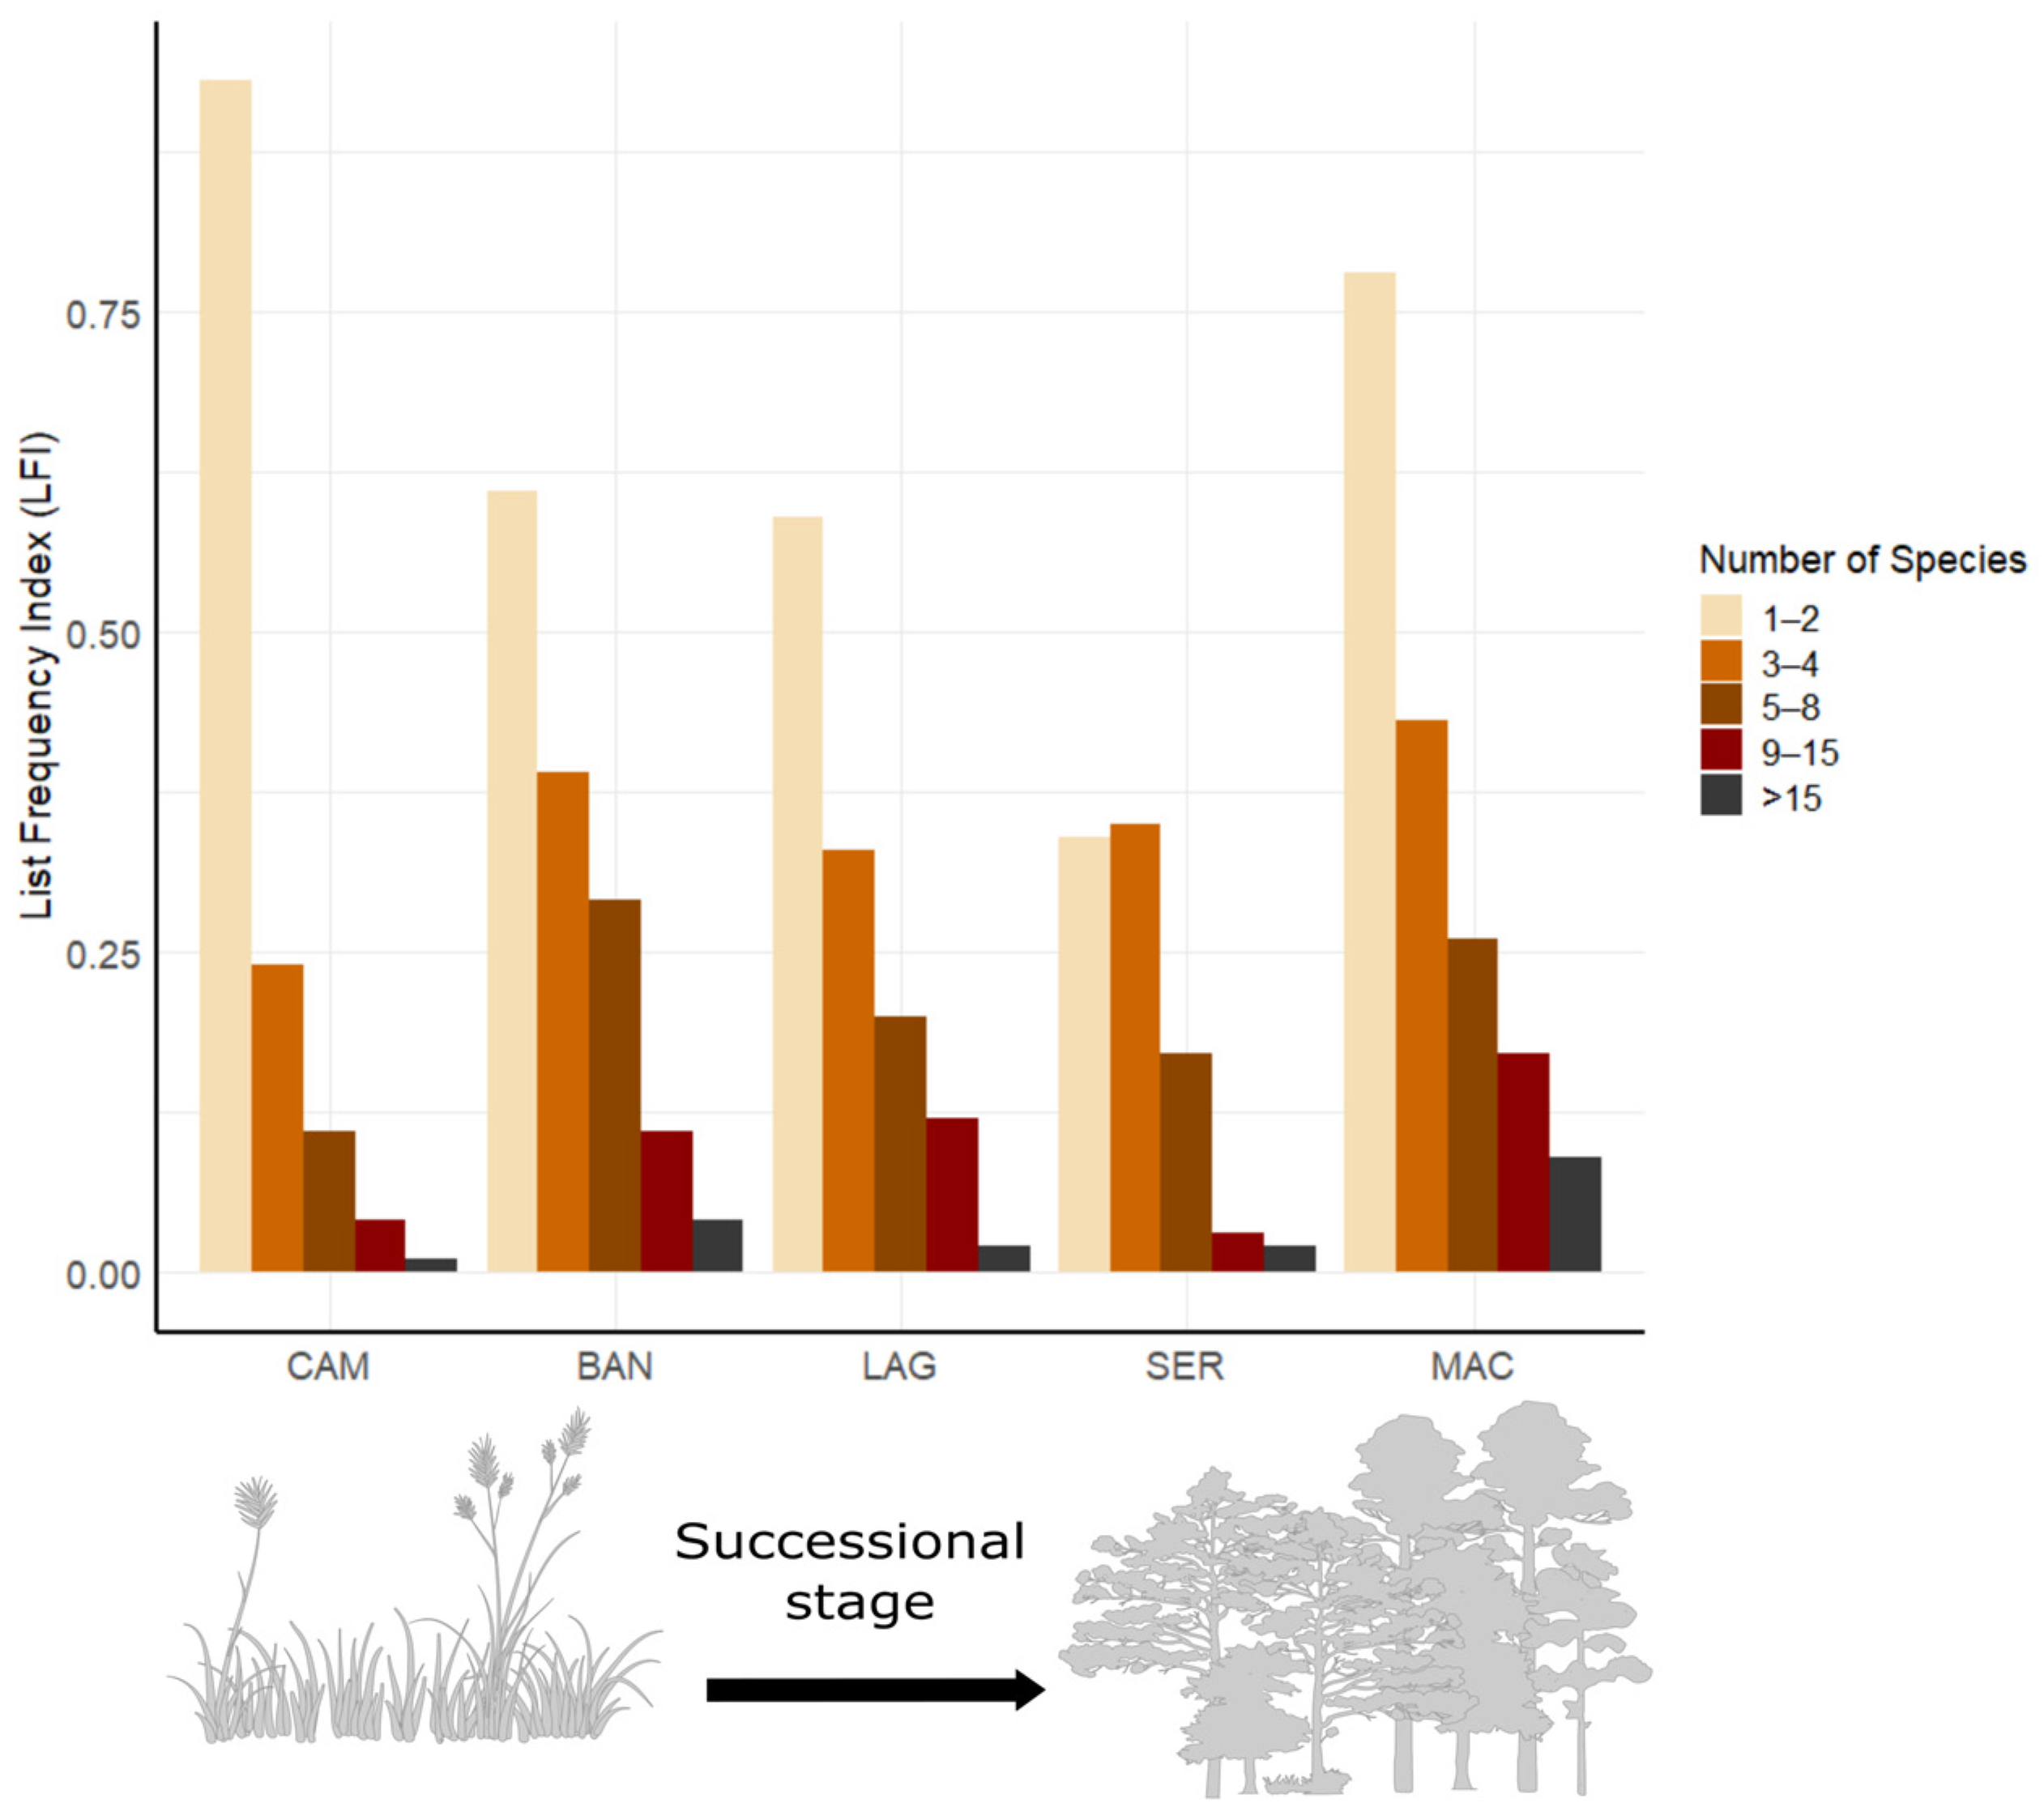
3.1. Overall Diversity
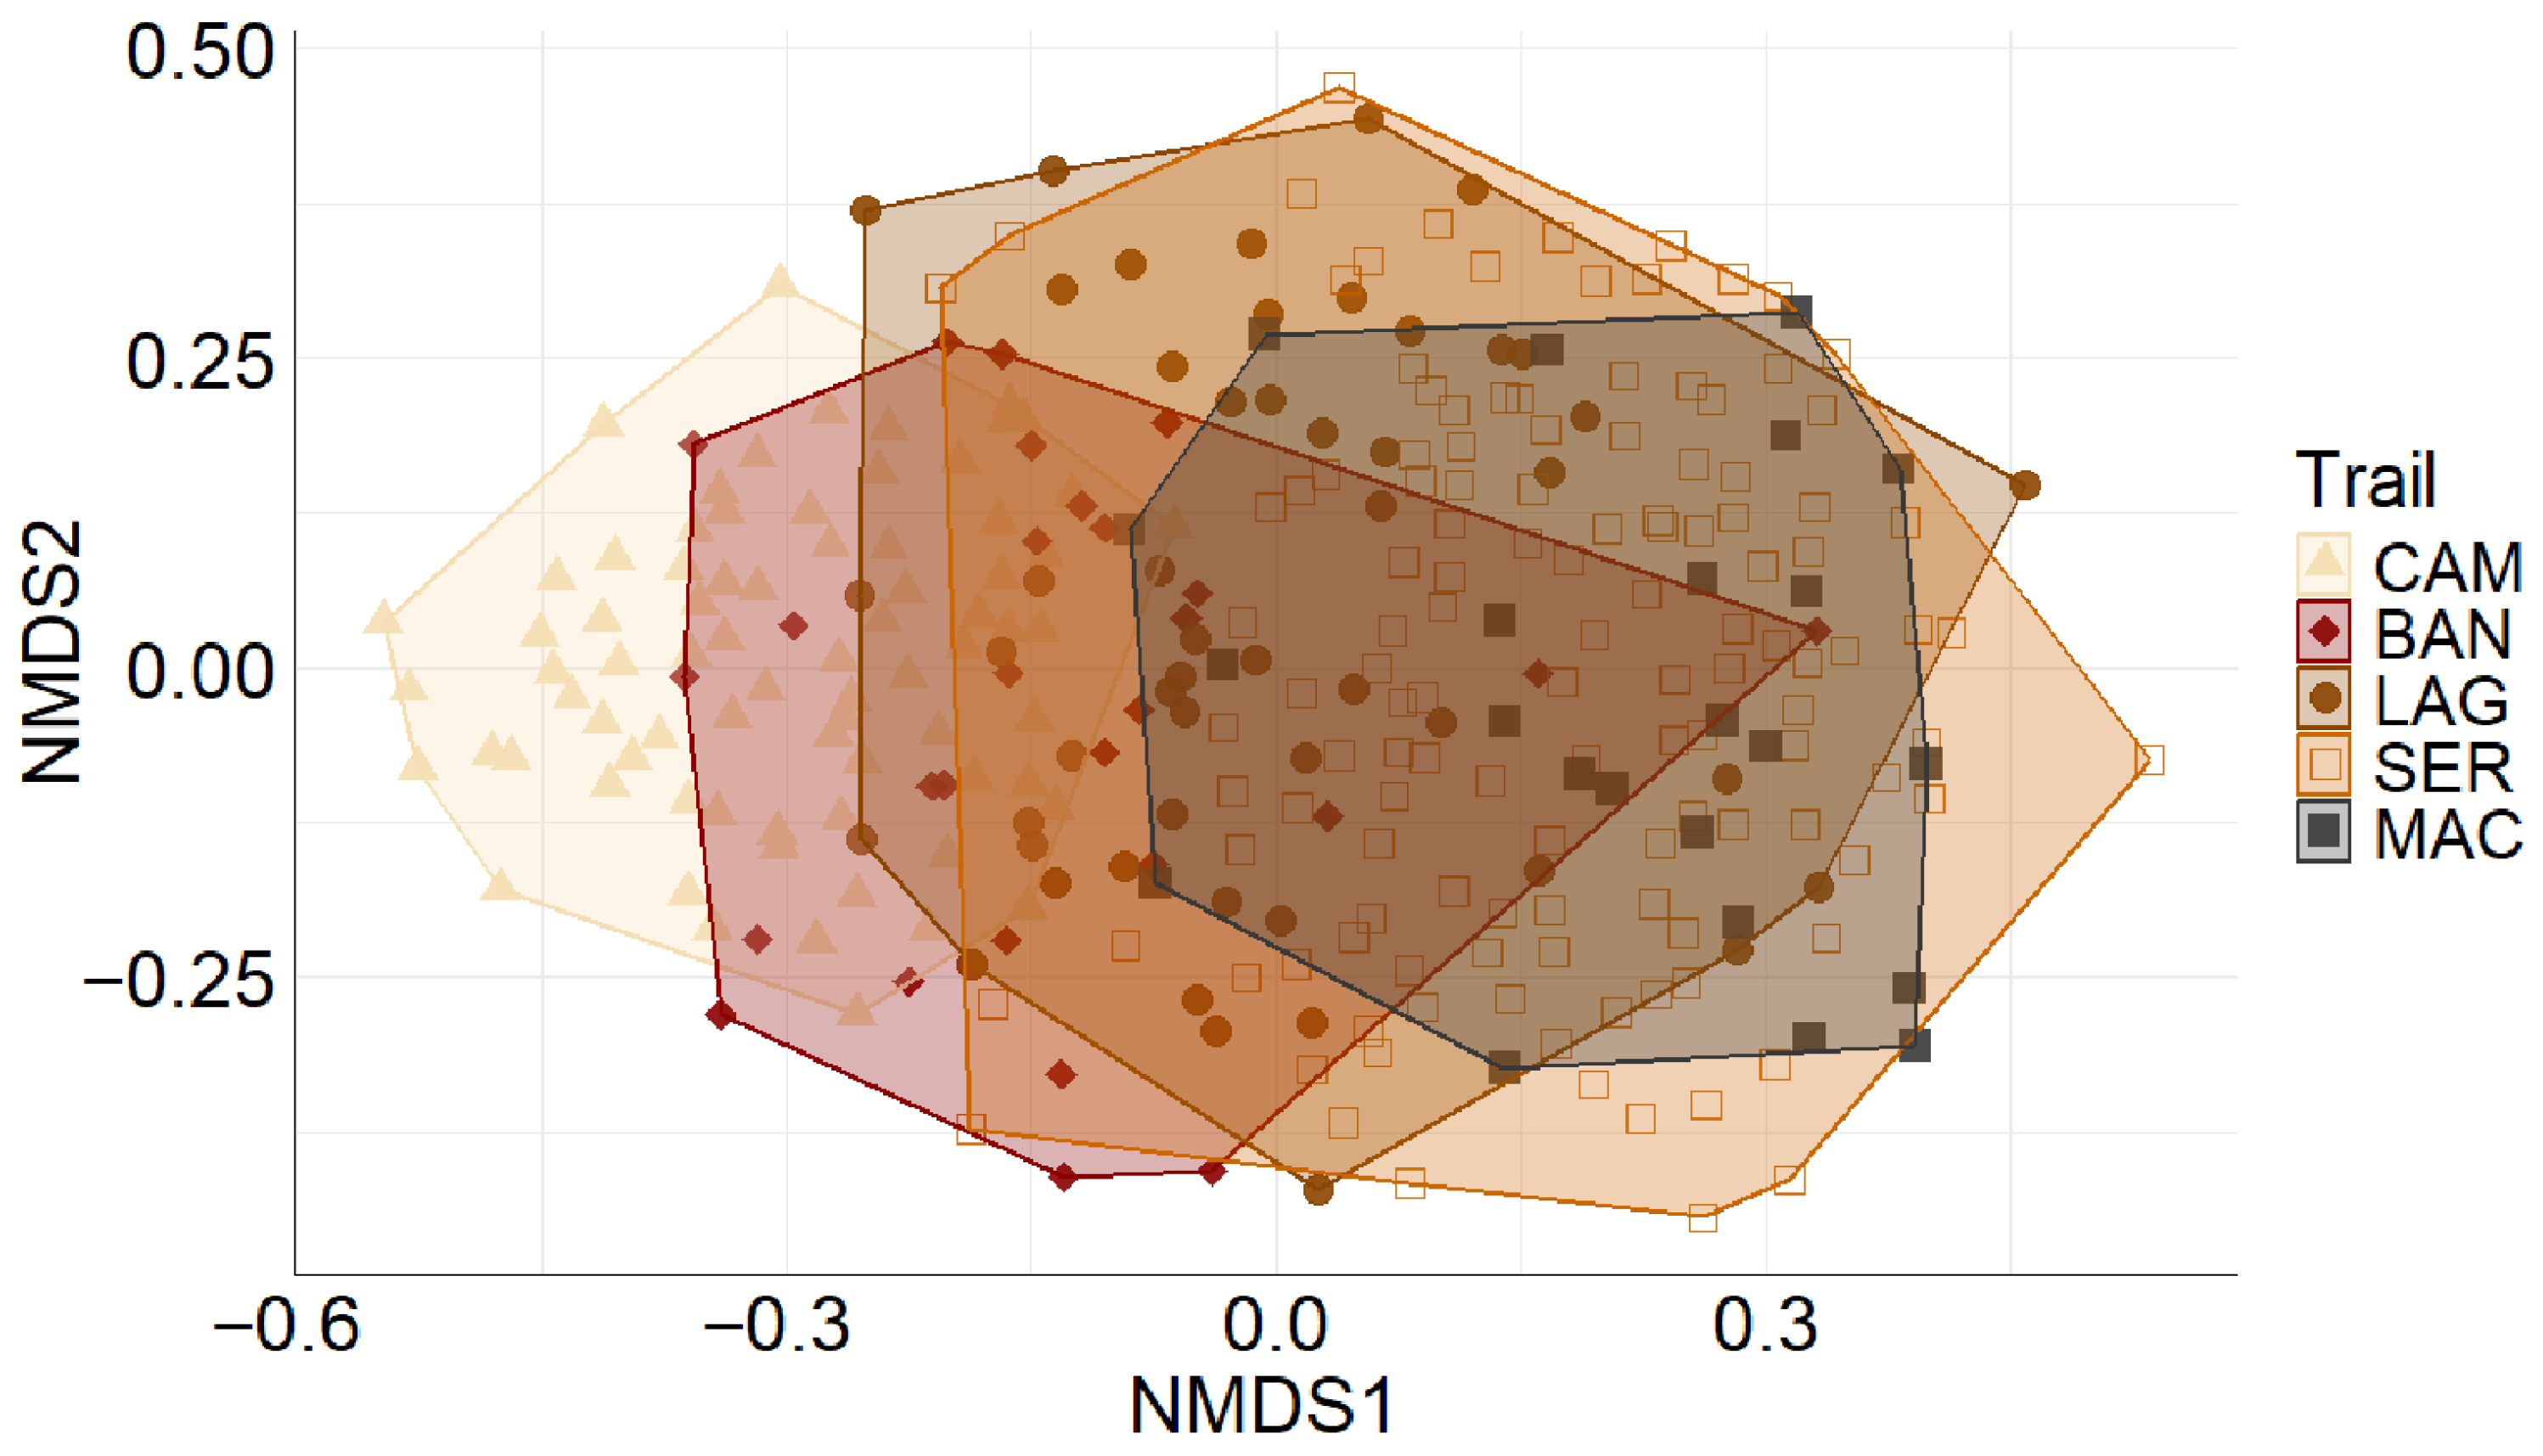
A total of 191 bird species were recorded over the sampling period (n = 305 MacKinnon lists), representing approximately 85% of the bird richness previously reported for the Pró-Mata Reserve (Fontana et al., unpublished data). Among the species recorded, four are globally threatened and eight are considered threatened at local level [7,8]. Of these, three are forest-dependent species and one is associated with grasslands (Table S1).
The species accumulation curves showed different patterns among the five trails (Figure 2a–e, Table 3). Only the MAC trail reached an asymptote, while SER showed a trend toward stabilization but continued to increase slightly. In contrast, the accumulation curves for LAG, BAN, and particularly CAM exhibited a clear upward trend, indicating that additional sampling effort is needed for a more complete inventory on those trails.
Of the 191 species, 46 were recorded across all five trails, including common species typically found in secondary forest formations, such as Rufous-browed Peppershrike (Cyclarhis gujanensis), Olivaceous Elaenia (Elaenia mesoleuca), and Gray-throated Warbling Finch (Microspingus cabanisi). Forest-specialist species like Speckle-breasted Antpitta (Cryptopezus nattereri), Brown Tinamou (Crypturellus obsoletus), and Azure Jay (Cyanocorax caeruleus) were also broadly distributed. In contrast, 56 species were found exclusively on a single trail, with CAM hosting the highest number of exclusive species (n = 24). These included species commonly found in more fragmented landscapes and even urban areas, e.g., Blue-black Grassquit (Volatinia jacarina), Great Kiskadee (Pitangus sulphuratus), Grassland Yellow-Finch (Sicalis luteola), and Eared Dove (Zenaida auriculata), but which are rare in the RPPN. Their presence likely contributed to the high species richness observed on the CAM trail (136 species). SER exhibited comparable richness (135 species), while the lowest richness was found on the MAC trail (87 species), which is in the most preserved and densely forested area (Table 3). As expected, intermediate sites such as represented by BAN (5 exclusive species) and LAG (6 exclusive species) hosted fewer unique species, with bird communities composed primarily of generalist species associated with both grasslands and forests. Notably, the most exclusive species from BAN and LAG were raptors (Accipitriformes or Falconiformes) with sporadic or erratic occurrences in the reserve.
Only six species were recorded in more than 100 lists, with the White-browed Warbler (Myiothlypis leucoblephara) being the most frequent (161 lists), followed by the Diademed Tanager (Stephanophorus diadematus) (149 lists) and the Rufous-collared Sparrow (Zonotrichia capensis) (119 lists). Conversely, 91 species were detected in fewer than 10 lists, many of which were grassland-associated species—such as the threatened Black-and-white Monjita and the least concern Grassland Yellow-Finch, both recorded only twice. A complete list of species and their frequency indices is provided in Table S2. The LFI provided a complementary perspective on species rarity and frequency across the different trails (Figure 3). Groups composed of few species (e.g., 1–2 or 3–4 species) tended to exhibit higher LFI values, indicating species that were consistently present in the lists. In contrast, groups with a larger number of species (>15 species) showed lower LFI values, suggesting that these species were recorded less frequently and could be considered rare, occasional, or difficult to detect. This pattern was particularly evident on the MAC trail, which showed the highest proportion of species with low frequency (LFI < 0.25). On the other hand, only a few species reached high LFI values, indicating consistent presence in the samples and a possible association with specific successional stages.

3.2. Composition

Species composition differed significantly between the sampled sites (PERMANOVA, F(4, 304) = 6.93, p = 0.0001). The greatest differences recorded were between the Campo trail initial successional stage (CAM) and advanced successional stage (Macuco and Serraria) (Figure 4). On the CAM trail, some of the species that contributed significantly to differentiating the composition of the communities were Long-tailed Reed Finch (Donacospiza albifrons), Lesser Grass-Finch (Emberizoides ypiranganus) and Rufous-collared Sparrow. On the other hand, species such as Short-tailed Antthrush (Chamaeza campanisona), Speckle-breasted Antpitta, White-throated Spadebill (Platyrinchus mystaceus) and Rufous-capped Spinetail (Synallaxis ruficapilla) were more strongly associated with the more advanced stages of forest succession (SER and MAC) (Table S3).

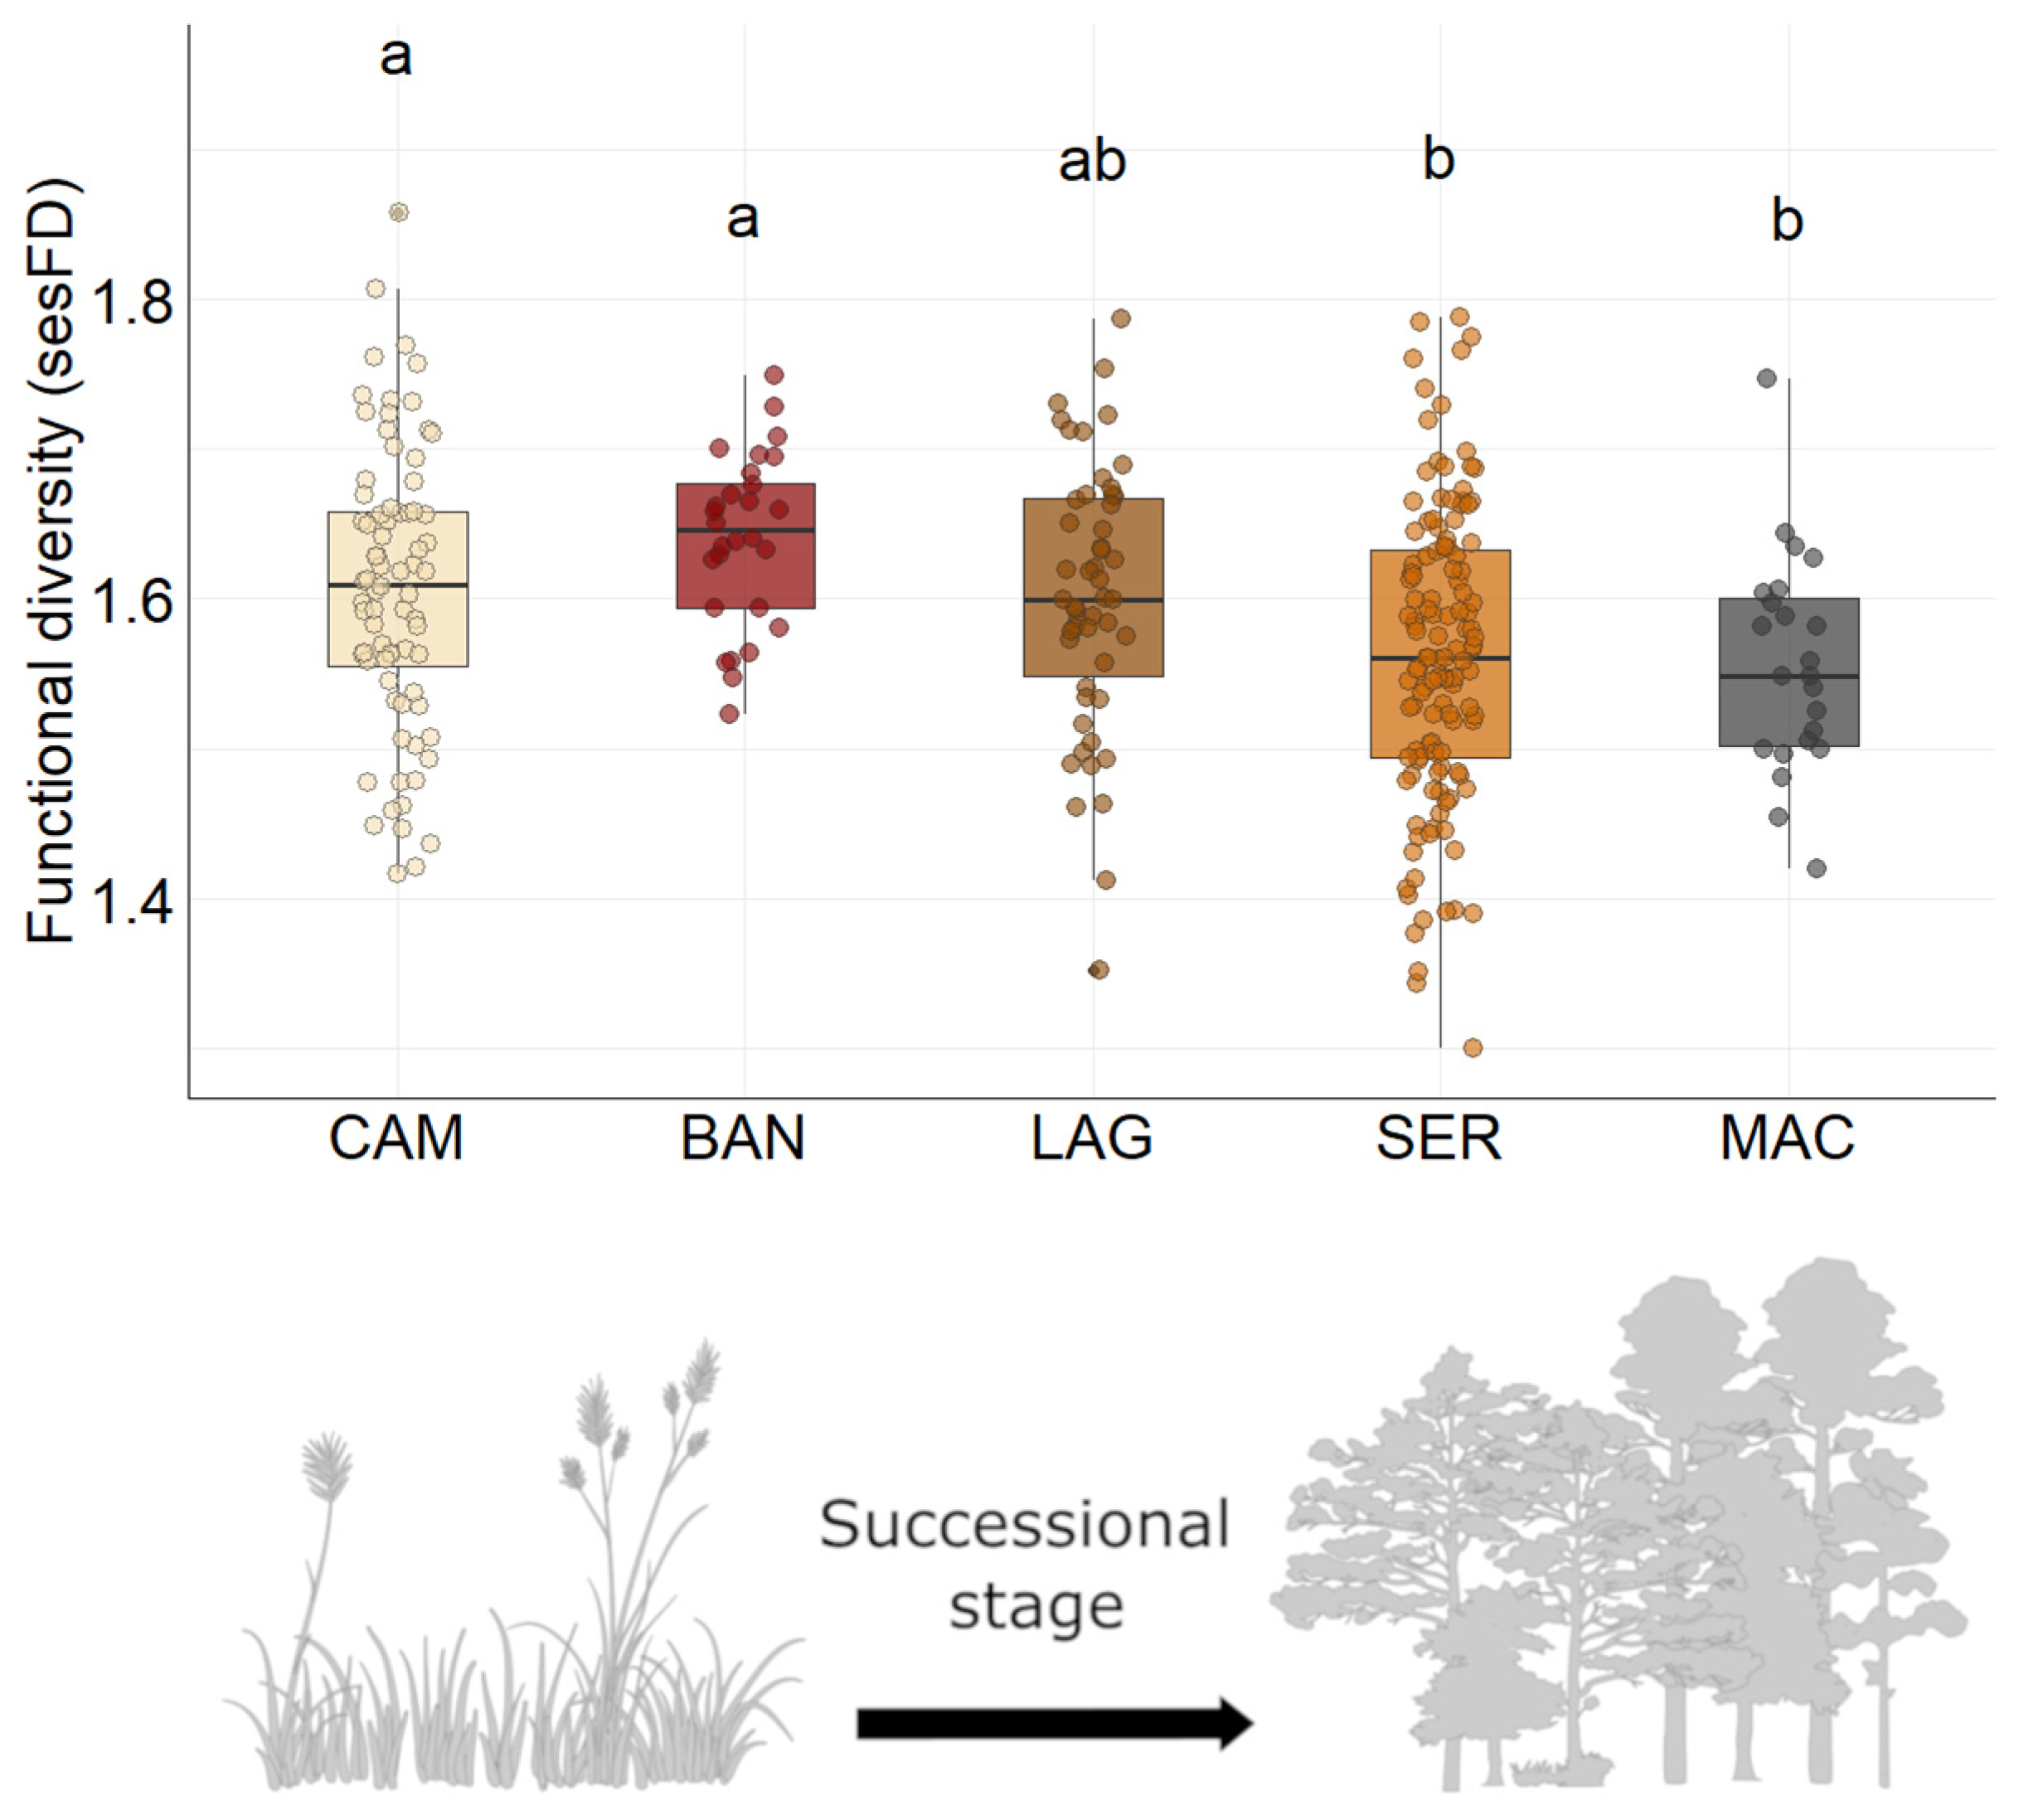
3.3. Bird Functional Diversity

There were significant differences between the sites, with greater functional diversity in the sites in the initial succession stage, where the percentage of forest cover is lower (Figure 5, Table 2 and Table S4). The multidimensional index of functional diversity FDis showed some significant differences between the trails (Figure 6). The sites in the initial and intermediate successional stages showed the highest values. The functional composition did not differ significantly between the environments (F(4, 300) = 0.759, p = 0.55) (Table S5).

4. Discussion

4.1. Bird Species Composition and Richness

We found that species richness varied among the studied sites, with a higher richness observed in areas at earlier successional stages, where forest cover is lower. This result contrasts with our initial hypothesis, which predicted a positive relationship between forest cover and species richness, with higher values expected in areas representing intermediate to advanced successional stages. Studies in the Atlantic Forest have shown contrasting patterns of bird richness and diversity across successional stages. For instance, bird richness and diversity were reported to be similar between initial and intermediate stages, but higher in advanced areas, highlighting the importance of conservation efforts, particularly those near old-growth forests and conservation units [19]. In contrast, other research observed higher diversity in the initial stage, followed by intermediate and advanced stages [12]. In general, the presence of more species in more advanced areas is related to greater structural heterogeneity within forests (e.g., canopy cover, density of trees) that affect food availability, nesting sites, microclimate characteristics, vulnerability to predators, and bird dispersal ability [56], apud [57]. The greater richness of birds observed in the CAM, followed by SER may be associated with the presence of species belonging to different stages of the successional gradient, due to the presence of some forest fragments within these trails. In other words, on these trails there is a structural mosaic with patches of vegetation in different stages of succession. This heterogeneity favors the simultaneous occurrence of species typical of open areas, as well as species dependent on forest vegetation. Thus, the occurrence of birds with different ecological requirements may explain the greater richness found in CAM and SER. On the other hand, the lower richness of species found in MAC reflects the lower structural diversity in terms of vegetation characteristics in this trail, but in this trail, the occurrence of specialist species is recurrent, such as Rufous-tailed Antthrush (Chamaeza ruficauda) and Solitary Tinamou (Tinamus solitarius), in addition to the presence of species typical of the Atlantic Forest such as Blue-naped Chlorophonia (Chlorophonia cyanea) and Star-throated Antwren (Rhopias gularis), which denotes the importance of the complementarity of different stages of forests to bird assemblage.
Early successional stages such as those observed in the CAM and BAN tracks present a heterogeneous mosaic of vegetation patches in different successional stages, harboring distinct biological communities, evidencing that where ecological succession has advanced over time, the presence of typical early-succession bird species has decreased (as observed by our NMDS and PERMANOVA results). For example, on the CAM trail some species typical of open areas (e.g., Great Pampa-Finch (Embernagra platensis) and Long-tailed Reed Finch), are rapidly replaced as the percentage of forest cover increases. Results from a study conducted in the same phytophysiognomic region showed that the composition of bird communities in a successional gradient also differed significantly between the early and advanced successional stages [19]. Similarly, [12] also observed that the initial stage is the most differentiated in the composition of its avifauna concerning the others. Reference [21] found habitat specialization and degree of threat of bird species greater in habitats in early succession.
The observation that most species are relatively rare, with only a few being common, is often cited as one of the few ecological generalities [48]. In our study, the LFI revealed a consistent pattern: a small number of species appeared across many lists and in nearly all trails, suggesting a community structure dominated by a few common species. This pattern highlights the value of simple diversity indices in detecting ecological trends, especially in distinguishing the balance between species commonness and rarity. As Matthews et al. (2014) [58] argue, understanding species abundance distributions is critical for applied ecological fields such as conservation planning and biological control.
However, our findings should be interpreted with caution. The rapid monitoring method employed (MacKinnon lists) has known limitations, particularly in its inability to accurately measure species abundance. What we present here is an estimate of relative abundance, inferred from the frequency of species occurrences across multiple lists. For further discussion on the strengths and limitations of this approach, see [40,41,59].
Despite these methodological constraints, the approach proved effective in delivering rapid, actionable insights for local ecological assessments, especially in protected areas that lack comprehensive baseline data and require informed management strategies to ensure long-term conservation. This was clearly illustrated by the case of the studied RPPN. The results on species diversity and community composition offer valuable guidance for designing targeted conservation actions in the Araucaria Forest being also applied to the Atlantic Forest, particularly in its southern range.

4.2. Functional Diversity

Confirming our functional diversity hypothesis, bird communities in the initial (CAM, BAN) and intermediate successional (LAG) stages showed the greatest functional diversity. This pattern may be related to the fact that these habitats exhibit intermediate structural characteristics between grasslands and forests, allowing the coexistence of species associated with both open areas and forest environments. Results found by [60] in the same region of this study identified a high proportion of frugivorous birds in forest fragments inserted in areas of initial succession. Other studies in fragmented forest landscapes have demonstrated that insectivory by birds is higher at the edges of forest fragments than inland due to greater availability and detectability of prey at the edges ([61,62]). The heterogeneity of vertical vegetation structures in successional mosaics allows for a greater diversity of functionally different bird species [63]. In fact, in the CAM and BAN trails there is a higher incidence of edges and a vertical structuring of the vegetation in several layers, which can facilitate the presence of different functional groups of birds. In this sense, the structural heterogeneity of vegetation in the early successional stages may influence bird preferences according to the available microhabitats. As a consequence, there is an increase in the diversity of functional traits present in these communities. Habitats with high functional diversity are usually associated with more heterogeneous plant structures, such as succession mosaics, forest edges, or areas with mixed vegetation ([62,64]). This pattern suggests that more heterogeneous habitats support species with complementary ecological functions [54], such as foragers in different strata, seed dispersers, and arthropod predators, contributing to greater functional diversification of the community. In addition, variation in the structural complexity of vegetation can modulate ecological interactions, influencing everything from intra and interspecific competition to the availability of functional niches along the successional gradient ([27,65]). Low bush density in the understory of inland forests may result in poor prey detectability and foraging efficacy for insectivorous birds [62]. In the MAC trail this is quite evident, there is less vertical stratification of the vegetation and less luminosity. These results indicate that the functional diversity of bird communities changes throughout the different stages of ecological succession, suggesting that changes in the availability of resources provided by habitat throughout this process favor different functional groups [64].
Our results indicate that the structuring of the vegetation in the different trails is a determining factor in the configuration of the functional diversity of bird communities, reinforcing the importance of environmental heterogeneity in the maintenance of the ecological processes associated with these systems. Regarding functional dispersion (FDis), the BAN, CAM and LAG trails showed higher values compared to MAC and SER. A higher FDis demonstrates that the bird community on these trails has greater dispersion of functional traits, which may favor the ecological resilience of the community. In this way, ecosystems with high FDis are generally more effective in maintaining ecological functions even under disturbances [27]. This means that species exploit different resources and occupy diverse ecological niches, reducing direct competition and increasing the efficiency of resource use.
In turn, such functional complementarity may enhance key ecological processes—such as seed dispersal—thereby facilitating the expansion of woody vegetation over grasslands and promoting ecological succession. That is, birds not only respond to changes in vegetation, but actively modify the environment through seed dispersal and insect predation [66]. Another study, conducted with the plant community in the same area studied here, demonstrated that the understory species of forests in the early stage of succession were more similar to the upper stratum of late forests than to their own, suggesting a rotation of species throughout the successional process [67]. The same authors also observed that the early and late Araucaria forests differed significantly in species composition, but that the regenerating stratum of the early forests already showed greater similarity with the more advanced forests, especially in terms of functional traits [67]. Our results for birds follow the same pattern: although species composition changes along successional stages, functional composition (i.e., trait composition) remains relatively stable across the gradient. In contrast, functional diversity (i.e., trait diversity) is higher in early successional stages, likely due to greater vegetation heterogeneity in these areas. In this sense, although the overall set of traits is similarly represented across stages, the higher functional diversity observed in early succession suggests that key ecological processes mediated by birds—such as seed dispersal, invertebrate control, and pollination—are likely maintained more efficiently during the initial stages of succession.

4.3. Study Limitations

This study was conducted in the aftermath of the COVID-19 pandemic (2020 onward), during a period when both financial resources and available personnel were limited. As a result, we were unable to implement more widely used bird survey methods such as point counts or line transects. These conventional approaches, while robust, typically require substantial time, trained personnel, and funding, which are factors that are especially challenging in tropical regions, where bird communities are characterized by high species richness, low detection rates, and complex vegetation structures. Given these constraints, we adopted the MacKinnon Lists (ML) method, which was specifically designed for use in species-rich tropical environments. The ML technique is a rapid, cost-effective approach in which observers record bird species in consecutive lists of a fixed number of species. Although originally developed to estimate species richness, subsequent studies have demonstrated that the method can also yield reliable abundance indices, even under varying observer expertise and environmental conditions (e.g., [41]). A key advantage of ML is that sampling units (i.e., lists) are independent of time spent, distance traveled, or the experience level of the observer. This makes the method less sensitive to spatial and temporal variation in detectability compared to more traditional techniques [39].
Fieldwork was also constrained by unpredictable weather conditions, which are particularly variable in our study area. Seasonal and site-level replications required consistent weather conditions, making the planning and execution of surveys difficult. In addition, several of the trails used in the study were of difficult access and required maintenance to ensure accessibility—an effort that demanded considerable time and resources, especially for the less frequently visited areas such as those with more vegetation cover (Advanced Succession). Even with the aforementioned difficulties, we were able to achieve seasonal replicates (7) of each of our trails at the same time and period of the years of sampling, reaching species accumulation curves that tend to stabilize, especially in areas with greater forest cover and more advanced successional stages. We agree with this, as we were avoiding bias due to year, circadian period and weather.
To optimize our effort and ensure ecological relevance, we relied on pre-existing and previously studied trails for bird surveys. These trails had been characterized in earlier studies for vegetation structure and plant community composition, allowing us to classify successional stages based on established literature. This integration of prior vegetation data with our avian survey was essential for addressing our ecological questions under the limitations we faced.

5. Conclusions

Our results demonstrate that the early and intermediate stages of ecological succession in our study site harbor bird communities with greater richness and functional diversity, possibly due to the heterogeneous structure of these habitats, which combine elements of open grasslands and forest formations. The heterogeneity of vertical vegetation structures in successional mosaics allows for a greater diversity of functionally different bird species (e.g., [63]). This structural diversity favors the coexistence of species with different ecological traits, reflected in greater functional amplitude. In addition, the results highlight the relevance of areas in different successional stages for the maintenance of functional diversity and ecological processes associated with birds. Conservation strategies should therefore consider the potential benefits of protecting successional mosaics to preserve not only the richness of species, but also the functionality of ecosystems. This is particularly relevant for protected areas and their surrounding landscapes—such as our study site—that are ecologically connected to National Parks and contribute to the maintenance of natural ecological corridors.

Supplementary Materials

The following supporting information can be downloaded at: https://www.mdpi.com/article/10.3390/birds6030037/s1. Table S1: List of bird species recorded using the Mackinnon List method across five trails in the RPPN Pró-Mata, Rio Grande do Sul, Brazil. Table S2: List Frequency Index (LFI) calculated based on the frequency of bird species recorded using the Mackinnon List method across five trails in the RPPN Pró-Mata, Rio Grande do Sul, Brazil. Table S3: Correlation values of bird species with NMDS axes. Table S4: Results of Tukey’s test comparing functional diversity means across different trails. Table S5: Tukey’s test results for FDis by comparing the means between the different trails. Table S6: Trait values for all bird species identified in the study area. References [42,43] are cited in the supplementary materials.

Author Contributions

Conceptualization C.S.F. and S.M.H.; Fieldwork, C.S.F., L.I.J., J.L.d.S., J.R.R.R., F.A.P.B., P.E.M. and C.B.; data Curation C.S.F., J.L.d.S., J.R.R.R., F.A.P.B. and P.E.M.; Data Analysis L.I.J., J.R.R.R. and F.A.P.B.; writing—original draft-preparation C.S.F. and L.I.J.; writing—review and editing, C.S.F., L.I.J., F.A.P.B., J.L.d.S., J.R.R.R., P.E.M. and C.B.; resources, C.S.F. and S.M.H.; project administration, C.S.F. and S.M.H. All authors have read and agreed to the published version of the manuscript.

Funding

CSF and SMH were funded by National Council for Scientific and Technological Development (CNPq) fellowship (process 08700/2022-8 and 305549/2018-9, respectively). PEM had a Technical Support scholarship from CNPq (process 381347/2021-4). CB had a doctoral scholarship from CNPq (process 140521/2019-4). This work was granted by the Program of Ecological Research of long duration at RPPN Pró-Mata to Nelson Ferreira Fontoura. It was funded by MCTI—CNPq (process 441590/2020-9) and FAPERGS (process 21/2551-0000775-3).

Institutional Review Board Statement

Not applicable.

Data Availability Statement

The raw data supporting the conclusions of this article will be made available by the authors on request.

Acknowledgments

We appreciate the logistical and staff support from RPPN Pró-Mata and Instituto do Meio Ambiente PUCRS for our field work. Our thanks extend to Carmem Luiza Mazzini Tavares and Fernando Azevedo Faria who helped in a winter field trip of August of 2022.

Conflicts of Interest

The authors declare no conflicts of interest.

References

  1. Myers, N.; Mittermeier, R.A.; Mittermeier, C.G.; Fonseca, G.A.B.; Kent, J. Biodiversity hotspots for conservation priorities. Nature 2000, 403, 853–858. [Google Scholar] [CrossRef] [PubMed]
  2. Wilson, O.J.; Mayle, F.E. A conservation assessment of Brazil’s iconic and threatened Araucaria Forest-Campos mosaic. Biol. Conserv. 2024, 296, 110650. [Google Scholar] [CrossRef]
  3. Fundação SOS Mata Atlântica. Atlas dos Remanescentes Florestais da Mata Atlântica: Período 2019/2020; Relatório técnico; Fundação SOS Mata Atlântica; Instituto Nacional de Pesquisas Espaciais–INPE: São Paulo, Brazil, 2021; 73p. [Google Scholar]
  4. Overbeck, G.E.; Vélez-Martin, E.; Menezes, L.S. Placing Brazil’s grasslands and savanas on the map of science and conservation. Perspect. Plant Ecol. Evol. Syst. 2022, 56, 125687. [Google Scholar] [CrossRef]
  5. Thomas, P. Araucaria angustifolia. The IUCN Red List of Threatened Species 2013, e.T32975A2829141. Available online: https://www.iucnredlist.org/species/32975/2829141 (accessed on 14 April 2025).
  6. Carlucci, M.B.; Jarenkow, J.A.; Duarte, L.S.; Pillar, V.D.P. Conservação da Floresta com Araucária no Extremo Sul do Brasil. Nat. Conserv. 2011, 9, 111–114. [Google Scholar] [CrossRef]
  7. BirdLife International. The IUCN Red List of Threatened Species. Available online: https://www.iucnredlist.org/ (accessed on 28 April 2025).
  8. Rio Grande do Sul. Decreto Nº. 51.797, de 8 de setembro 2014. Diário Oficial do Estado do Rio Grande do Sul, Porto Alegre, Brazil. Available online: https://www.diariooficial.rs.gov.br/ (accessed on 24 April 2025).
  9. Suhs, R.B.; Giehl, E.L.H.; Peroni, N. Preventing traditional management can cause grassland loss within 30 years in southern Brazil. Sci. Rep. 2020, 10, 783. [Google Scholar] [CrossRef] [PubMed]
  10. Linzmeier, A.M.; Ribeiro-Costa, C.S.; Marinoni, R.C. Fauna de Alticini (Newman) (Coleoptera, Chrysomelidae, Galerucinae) em diferentes estágios na Floresta com Araucária do Paraná, Brasil: Diversidade e estimativa de riqueza de espécies. Rev. Bras. Entomol. 2006, 50, 101–109. [Google Scholar] [CrossRef]
  11. Conte, C.E.; Rossa-Feres, D.C. Riqueza e distribuição espaço-temporal de anuros em um remanescente de Floresta de Araucária no sudeste do Paraná. Rev. Bras. Zool. 2007, 24, 1025–1037. [Google Scholar] [CrossRef]
  12. Kaminski, N.; Angelo, A.C.; Nicola, P.A. A influência do gradiente sucessional e da frutificação de Merostachys aff. multiramea em uma comunidade de aves da Floresta com Araucária. Iheringia Sér. Zool. 2016, 106, e2016002. [Google Scholar] [CrossRef]
  13. Siqueira, P.R. Influência da cobertura florestal nas comunidades de aves e funções ecossistêmicas. Ph.D. Thesis, Universidade Federal de Minas Gerais (UFMG), Belo Horizonte, MG, Brazil, 3 February 2023. Available online: http://hdl.handle.net/1843/55608 (accessed on 7 May 2025).
  14. Sekercioglu, C.H. Increasing awareness of avian ecological function. Trends Ecol. Evol. 2006, 21, 464–471. [Google Scholar] [CrossRef] [PubMed]
  15. Luck, G.W.; Smallbone, L.T.; Sheffield, K.J. Enviromental and socio-economic factors related to urban bird communities. Austral Ecol. 2013, 38, 111–120. [Google Scholar] [CrossRef]
  16. Mouillot, D.; Graham, N.A.J.; Villéger, S. A functional approach reveals community responses to disturbances. Trends Ecol. Evol. 2013, 28, 167–177. [Google Scholar] [CrossRef] [PubMed]
  17. Chapman, P.M.; Tobias, J.A.; Edwards, D.P.; Davies, R.G. Contrasting impacts of land-use change on phylogenetic and functional diversity of tropical forest birds. J. Appl. Ecol. 2017, 55, 1604–1614. [Google Scholar] [CrossRef]
  18. Smith, D.A.E.; Si, X.; Smith, Y.C.E.; Kalle, R.; Ramesh, T.; Downs, C.T. Patterns of avian diversity across a decreasing patch-size gradient in a critically endangered subtropical forest system. J. Biogeogr. 2018, 45, 2118–2132. [Google Scholar] [CrossRef]
  19. Casas, G.; Darski, B.; Ferreira, P.M.A.; Kindel, A.; Müller, S.C. Habitat Structure Influences the Diversity, Richness and Composition of Bird Assemblages in Successional Atlantic Rain Forests. Trop. Conserv. Sci. 2016, 9, 503–524. [Google Scholar] [CrossRef]
  20. Shen, Y.; Estrada-Villegas, S.; Umaña, M.N.; Goodale, E.; Robinson, S.; Quan, Q.; Zhang, Q. Differences in mixed-species bird flocks across forest succession: Combining network analysis and trait-based ecology related to the fast-slow continuum. Funct. Ecol. 2024, 38, 1236–1249. [Google Scholar] [CrossRef]
  21. Reif, J.; Marhoul, P.; Koptík, J. Bird communities in habitats along a successional gradient: Divergent patterns of species richness, specialization and threat. Basic Appl. Ecol. 2013, 14, 423–431. [Google Scholar] [CrossRef]
  22. Cadotte, M.W.; Carscadden, K.; Mirotchnick, N. Beyond species: Functional diversity and the maintenance of ecological processes and services. J. Appl. Ecol. 2011, 48, 1079–1087. [Google Scholar] [CrossRef]
  23. Martínez-Núñes, C.; Martínez-Prentice, R.; García-Navas, V. Protected area coverage of vulnerable regions to conserve functional diversity of birds. Conserv. Biol. 2023, 37, e14131. [Google Scholar] [CrossRef] [PubMed]
  24. Mikolaiczik, N.M.; Barreto, M.S.; Hartmann, M.T.; Hartmann, P.A. Bird fauna in secondary forest stages: A study in a southern Brazilian protected area. Oecologia Aust. 2019, 23, 261–279. [Google Scholar] [CrossRef]
  25. Melo, M.A.; Silva, M.A.G.; Piratelli, A.J. Improvement of vegetation structure enhances bird functional traits and habitat resilience in an area of ongoing restoration in the Atlantic Forest. Ann. Braz. Acad. Sci. 2020, 92, e20191241. [Google Scholar] [CrossRef] [PubMed]
  26. Carello, C.A.; Yanco, S.W. Early successional habitat supports unique avian communities dominated by wintering migrants in a premontane tropical forest. J. Trop. Ecol. 2023, 39, e22. [Google Scholar] [CrossRef]
  27. Laliberté, E.; Legendre, P. A distance-based framework for measuring functional diversity from multiple traits. Ecology 2010, 91, 299–305. [Google Scholar] [CrossRef] [PubMed]
  28. Cleary, D.F.R.; Boyle, T.J.B.; Setyawati, T.; Anggraeni, C.D.; Van Loon, E.E.; Menken, S.B.J. Bird species and traits associated with logged and unlogged forest in Borneo. Ecol. Appl. 2007, 17, 1184–1197. [Google Scholar] [CrossRef] [PubMed]
  29. Jacoboski, L.I.; Debastiani, V.J.; Mendonça-Lima, A.; Hartz, S.M. How do diversity and functional nestedness of bird communities respond to changes in the landscape caused by eucalyptus plantations? Commun. Ecol. 2016, 17, 107–113. [Google Scholar] [CrossRef]
  30. Souza, J.L.; Côrte, D.A.A.; Ferreira, L.M. Perguntas e Respostas sobre Reserva Particular do Patrimônio Natural; Ministério do Meio Ambiente, Instituto Chico Mendes de Conservação da Biodiversidade: Brasília, Brazil, 2012; 75p. Available online: https://www.gov.br/icmbio/pt-br/servicos/servicos-do-icmbio-no-gov.br/crie-sua-rppn/perguntaserespostasrppn1.pdf (accessed on 24 April 2025).
  31. Backes, A.; Fernandes, A.V.; Zeni, D.J. Produção de folhedo em uma floresta com Araucaria angustifolia no sul do Brasil. Pesq. (Bot.) 2000, 50, 97–117. [Google Scholar]
  32. Marchiori, J.N.C. Fitogeografia do Rio Grande do Sul, Enfoque Histórico e Sistemas de Classificação, 1st ed.; EST Edições: Porto Alegre, Brasil, 2002; 118p, ISBN 9788575170143. [Google Scholar]
  33. Pró-Mata: Pesquisa. Available online: https://www.pucrs.br/ima/pro-mata/pesquisa/ (accessed on 26 June 2025).
  34. Pontifícia Universidade Católica do Rio Grande do Sul (PUCRS)-Instituto do Meio Ambiente. Plano de Manejo do Centro de Pesquisas e Conservação da Natureza PRÓ-MATA. 2011. 258p. Available online: https://www.pucrs.br/ima/wp-content/uploads/sites/116/2019/07/plano-de-manejo-2011.pdf (accessed on 15 April 2025).
  35. QGIS Development Team. QGIS Geographic Information System (Version 3.36). Windows. 2024. Available online: https://qgis.org (accessed on 24 April 2025).
  36. Karasiak, N. Dzetsaka QGIS Classification Plugin. 2016. Available online: https://plugins.qgis.org/plugins/dzetsaka/ (accessed on 24 April 2025).
  37. Baaske, R. Vegetationskartierung des Forschungsgebietes Pró-Mata, Rio Grande do Sul, Brasilien, unter Verwendung von CIR-Luftbildern; Fachhochschule Rottenburg: Rottenburg, Germany, 2001; 129p. [Google Scholar]
  38. MacKinnon, J.; Phillipps, K. The Birds of Borneo, Sumatra, Java and Bali: The Greater Sunda Islands, 1st ed.; Oxford University Press: Oxford, UK, 1993; 491p. [Google Scholar] [CrossRef]
  39. Bibby, C.J.; Burgess, N.D.; Hill, D.A.; Mustoe, S.H. Bird Census Techniques; Academic Press: London, UK, 2000; 132p. [Google Scholar]
  40. Von Matter, S.; Straube, F.; Accordi, I.; Piacentini, V.Q.; Cândido, J.F., Jr.; Ribon, R. Amostragem de aves pelo método de listas de Mackinnon. In Ornitologia e Conservação: Ciência Aplicada, Técnicas de Pesquisa e Levantamento, 1st ed.; Technical Books Editora: Rio de Janeiro, Brazil, 2010; Volume 1, pp. 33–44. ISBN 978-85-61368-04-3. [Google Scholar]
  41. MacLeod, R.; Herzog, S.K.; Maccormick, A.; Ewing, S.R.; Bryce, R.; Evans, K.L. Rapid monitoring of species abundance for biodiversity conservation: Consistency and reliability of the MacKinnon lists technique. Biol. Conserv. 2011, 144, 1374–1381. [Google Scholar] [CrossRef]
  42. Tobias, J.A.; Sheard, C.S.; Pigot, A.L.; Devenish, A.J.M.; Yang, J.; Sayol, F.; Neate-Clegg, M.H.C.; Alioravainen, N.; Weeks, T.L.; Barber, R.A.; et al. AVONET: Morphological, ecological and geographical data for all birds. Ecol. Lett. 2022, 25, 581–597. [Google Scholar] [CrossRef] [PubMed]
  43. Wilman, H.; Belmaker, J.; Simpson, J.; de la Rosa, C.; Rivadeneira, M.M.; Jetz, W. EltonTraits 1.0: Species-level foraging attributes of the world’s birds and mammals. Ecology 2014, 95, 2027. [Google Scholar] [CrossRef]
  44. Fitzpatrick, S. Patterns of morphometric variation in birds’ tails: Length, shape and variability. Biol. J. Linn. Soc. 1997, 62, 145–162. [Google Scholar] [CrossRef]
  45. Felice, R.N.; Tobias, J.A.; Pigot, A.L.; Goswami, A. Dietary niche and the evolution of cranial morphology in birds. Proc. R. Soc. B 2019, 286, 20182677. [Google Scholar] [CrossRef] [PubMed]
  46. Quitián, M.; Santillán, V.; Bender, I.M.A.; Espinosa, C.I.; Homeier, J.; Böhning-Gaese, K.; Schleuning, M.; Neuschulz, E.L. Functional responses of avian frugivores to variation in fruit resources between natural and fragmented forests. Funct Ecol. 2019, 33, 399–410. [Google Scholar] [CrossRef]
  47. Hsieh, T.C.; Ma, K.H.; Chao, A. iNEXT: iNterpolation and EXTrapolation for Species Diversity. 2024. Available online: https://cran.r-project.org/web/packages/iNEXT/iNEXT.pdf (accessed on 15 April 2025).
  48. McGill, B.J.; Etienne, R.S.; Gray, J.S.; Alson, D.; Anderson, M.J.; Benecha, H.K.; Dornelas, M.; Enquist, B.J.; Green, J.L.; He, F.; et al. Species abundance distributions: Moving beyond single prediction theories to integration within an ecological framework. Ecol. Lett. 2007, 10, 995–1015. [Google Scholar] [CrossRef] [PubMed]
  49. Chao, A.; Gotelli, N.J.; Hsieh, T.C.; Sander, E.L.; Ma, K.H.; Colwell, R.K.; Ellison, A.M. Rarefaction and extrapolation with Hill numbers: A framework for sampling and estimation in species diversity studies. Ecol. Monogr. 2014, 84, 45–67. [Google Scholar] [CrossRef]
  50. Anderson, M.J. A new method for non-parametric multivariate analysis of variance. Austral Ecol. 2008, 26, 32–46. [Google Scholar] [CrossRef]
  51. Oksanen, J.; Simpson, G.L.; Blanchet, F.G.; Kindt, R.; Legendre, P.; Minchin, P.R.; O’Hara, R.B.; Solymos, P.; Stevens, M.H.H.; Szoecs, E.; et al. Vegan: Community Ecology Package. 2024. Available online: https://cran.r-project.org/package=vegan (accessed on 25 April 2025).
  52. Petchey, O.L.; Gaston, K.J. Functional diversity (FD), species richness and community composition. Ecol. Lett. 2002, 5, 402–411. [Google Scholar] [CrossRef]
  53. Swenson, N.G. Functional and Phylogenetic Ecology in R, 1st ed.; Springer Science & Business Media: New York, NY, USA, 2014. [Google Scholar] [CrossRef]
  54. Villéger, S.; Manson, N.W.H.; Mouillot, D. New multidimensional functional diversity indices for a multifaceted framework in funcitional ecology. Ecology 2008, 89, 2290–2301. [Google Scholar] [CrossRef] [PubMed]
  55. R Development Core Team. R Software Version 4.4.0; R Development Core Team: Vienna, Austria, 2024. [Google Scholar]
  56. Mason, D.J.; Thiollay, J.-M. Tropical Forestry and the Conservation of Neotropical Birds: Conserving Wildlife in Logged Tropical Forests; Fimbel, R.A., Robinson, J., Grajal, A., Eds.; Columbia University Press: New York, NY, USA, 2001. [Google Scholar] [CrossRef]
  57. Oliveira, J.; Almeida, S.M.; Florêncio, F.P.; Pinho, J.B.; Oliveira, D.M.M.; Ligeiro, R.; Rodrigues, D.J. Environmental structure affects taxonomic diversity but not functional structure of understory birds in the southwestern Brazilian Amazon. Acta Amaz. 2019, 49, 232–241. [Google Scholar] [CrossRef]
  58. Matthews, T.J.; Whittaker, R.K. On the species abundance distribution in applied ecology and biodiversity management. J. Appl. Ecol. 2014, 52, 443–454. [Google Scholar] [CrossRef]
  59. O’Dea, N.; Watson, J.E.M.; Whittaker, R.J. Rapid assessment in conservation research: A critique of avifaunal assessment techniques illustrated by Ecuadorian and Madagascan case study data. Divers. Distrib. 2004, 10, 55–63. [Google Scholar] [CrossRef]
  60. Hartz, S.M.; Pinheiro, G.C.; Mendonça-Lima, A.; Duarte, L.S. The Potential Role of Migratory Birds in the Expansion of Araucaria Forest. Nat. Conserv. 2012, 10, 52–56. [Google Scholar] [CrossRef]
  61. Gonzalez-Gomez, P.L.; Estades, C.F.; Simonetti, J.A. Strengthened insectivory in a temperate fragmented forest. Oecologia 2006, 148, 137–143. [Google Scholar] [CrossRef] [PubMed]
  62. Barbaro, L.; Giffard, B.; Charbonnier, Y.; van Halder, I.; Brockerhoff, E.G. Bird functional diversity enhances insectivory at forest edges: A transcontinental experiment. Divers. Distrib. 2014, 20, 149–159. [Google Scholar] [CrossRef]
  63. Karpińska, O.; Kamionka-Kanclerska, K.; Czortek, P.; Dyderski, M.K.; Czeszczewik, D. Mechanisms shaping the functional diversity of birds’ composition in the primeval forest ecosystem of the Białowieża National Park. Eur. J. For. Res. 2024, 143, 1015–1033. [Google Scholar] [CrossRef]
  64. Borges, S.H.; Tavares, T.R.S.; Crouch, N.M.A.; Baccaro, F. Sucessional trajetories of bird assemblages in amazonian secondary forests: Perspectives from complementary biodiversity dimensions. For. Ecol. Manag. 2021, 483, 118731. [Google Scholar] [CrossRef]
  65. Matuoka, M.A.; Benchimol, M.; Morante-Filho, J.C. Tropical forest loss drives divergent patterns in functional diversity of forest and non-forest birds. Biotropica 2020, 52, 738–748. [Google Scholar] [CrossRef]
  66. Schleuter, D.; Daufresne, M.; Massol, F.; Argillier, C. A user’s guide to functional diversity indices. Ecol. Monogr. 2010, 80, 469–484. [Google Scholar] [CrossRef]
  67. Vicente-Silva, J.; Bergamin, R.S.; Zanini, K.J.; Pillar, V.D.; Müller, S.C. Assembly patterns and functional diversity of tree species in a successional gradient of Araucaria forest in Southern Brazil. Nat. Conserv. 2016, 14, 67–73. [Google Scholar] [CrossRef]
Figure 1. Map of the study area within the Pró-Mata Private Natural Heritage Reserve (RPPN), located in the municipality of São Francisco de Paula, in the northeast region of the State of Rio Grande do Sul (RS), Brazil. The trails and their 100 m buffers (sites) are represented on the RPPN map, displaying vegetation cover types in a general overview (A), in detail (B) and the proportion of forest cover (C) in the trails CAM = 15%, BAN = 45%, LAG = 82%, SER = 88% and MAC = 97%. Adapted from Pró-Mata Management Plan [34].
Birds 06 00037 g001
Figure 2. Species accumulation curves based on presence–absence (incidence) data from five trails at RPPN Pró-Mata, Rio Grande do Sul, Brazil. Solid and dashed lines represent interpolated and extrapolated estimates, respectively, obtained using the rarefaction and extrapolation method with 95% confidence intervals. Symbols represent the observed number of species as a function of the number of MacKinnon lists. CAM: Campo (a), BAN: Bananeiras (b), LAG: Lago (c), SER: Serraria (d), MAC: Macuco (e).
Birds 06 00037 g002
Figure 3. Frequency of occurrence of species in the lists across five trails at RPPN Pró-Mata, Rio Grande do Sul, Brazil. Successional Gradient (assumed as a percentual of forest cover) from left to right. Campo: CAM—Initial (IN); Bananeiras: BAN (IN), Lago: LAG—intermediate (IT), Serraria: SER—Advanced succession (AS), Macuco: MAC (AS). The index shown is the List Frequency Index (LFI), which represents the proportion of lists in which each species was recorded.
Birds 06 00037 g003
Figure 4. Nonmetric multidimensional scaling (NMDS) based on Jaccard’s dissimilarity matrix, representing the composition of bird communities between the different sampling sites. Each point represents a sampling unit (MacKinnon list) and the colors and symbols indicate the different sites. The polygons delimit the groupings of samples from each site; closer points indicate more similar communities. CAM: Campo, BAN: Bananeiras, LAG: Lago, SER: Serraria, MAC: Macuco.
Birds 06 00037 g004
Figure 5. Boxplot of functional diversity among the different sites along a forest cover gradient, from less cover or initial stage of succession (IN, left) to more forest cover, advanced succession stage (AS, right). The central line of each box represents the median, and the dots represent the values of each sampling unit. The letters above the boxes indicate statistically significant differences between the sites based on Tukey’s test (p < 0.05). CAM: Campo, BAN: Bananeiras, LAG: Lago, SER: Serraria, MAC: Macuco.
Birds 06 00037 g005
Figure 6. Boxplot of the functional dispersion (FDis) among the different sites along a forest cover gradient, from less cover or initial stage of succession (IN, left) to more forest cover, advanced succession stage (AS, right). The central line of each box represents the median, and the dots represent the values of each sampling unit. The letters above the boxes indicate statistically significant differences between sites based on Tukey’s test (p < 0.05). CAM: Campo, BAN: Bananeiras, LAG: Lago, SER: Serraria, MAC: Macuco.
Birds 06 00037 g006
Table 1. Description of the studied trails at RPPN Pró-Mata, Rio Grande do Sul, Brazil, including dominant vegetation, successional stage classification and estimated forest cover.
Trail CodeTrail NameVegetation and Habitat CharacteristicsSuccessional StageForest Cover (%)
CAMCampo TrailDominated by grassland with Baccharis shrubs, rocky outcrops, poorly drained herbaceous-shrub zones, and occasional forest patches with Araucaria. Some forest strips border the area.Initial (IN)15%
BANBananeiras TrailGrassland with dominant Baccharis, poorly drained herbaceous-shrub areas, patches of early successional trees, and cloud forest. Includes mature forest patches with bamboo along hill slopes.Early to Intermediate (IN)45%
LAGLago TrailMixed Araucaria Forest and bamboo. Begins in advanced stage, transitions to intermediate along slopes with shallow soils, and ends in early successional vegetation near a large artificial lake with wetlands.Intermediate to Late (IT)82%
SERSerraria TrailPredominantly Araucaria Forest with areas of intermediate succession due to past timber extraction. Includes exotic species (Citrus, Hydrangea) and Pinus. Advanced segments with epiphytes and wet habitats.Intermediate to Advanced (AS)90%
MACMacuco TrailMature Araucaria Forest with near-primary characteristics: tall old trees (e.g., Cedro, large Araucaria), abundant epiphytes (e.g., Bromeliaceae), sparse understory, and few younger bamboo patches.Advanced (AS)~100%
Table 2. Descriptive information about each of the trails at RPPN Pró-Mata, Rio Grande do Sul, Brazil, surveyed for birds in the years of 2021–2024. Campo: CAM—Initial (IN); Bananeiras: BAN (IN); Lago: LAG—intermediate (IT); Serraria: SER—Advanced succession (AS), Macuco: MAC (AS).
Trail IDTrail Length (m)Buffer Area 100 (m2)Forest Cover (m2)
CAM/IN6046983,808148,096
BAN/IN2202417,088187,136
LAG/IT2439455,68371,90
SER/AS54311,062,272930,688
MAC/AS1139245,888238,912
Table 3. Number of lists, observed and extrapolated bird species richness, and number of exclusive species by trail at RPPN Pró-Mata, Rio Grande do Sul, Brazil. CAM = Campo; BAN = Bananeiras; LAG = Lago; SER = Serraria; MAC = Macuco. Each trail was repeated seven times (in brackets). CI = 95% confidence interval (lower and upper limits). Species richness was extrapolated to 254 lists per trail. # = Number of.
Trail Code# MacKinnon Lists (n)Richness
Observed
Richness
Extrapolated
# Exclusive spp.Sp/Total spp. (%)
CAM (7)76136 (CI: 124.4–146.6)189 (CI: 159.4–218.3)2768.6
BAN (7)28101 (CI: 90.4–111.6)200 (CI: 144.6–256.3)562.4
LAG (7)51121 (CI: 112.0–130.0)169 (CI: 137.1–200.1)663.4
SER (7)127135 (CI: 129.4–140.6)143 (CI: 133.6–152.2)1670.2
MAC (7)2387 (CI: 80.9–93.1)98 (CI: 82.1–113.1)345.5
Disclaimer/Publisher’s Note: The statements, opinions and data contained in all publications are solely those of the individual author(s) and contributor(s) and not of MDPI and/or the editor(s). MDPI and/or the editor(s) disclaim responsibility for any injury to people or property resulting from any ideas, methods, instructions or products referred to in the content.

