1. Introduction
Misdiagnosed fractures in plain radiographs can lead to delayed treatment, long-term disability and reduced quality of life [
1]. Artificial intelligence (AI)-based software has shown promise in reducing the number of missed fractures [
1,
2]; however, given that AI software is frequently updated, its performance should be evaluated regularly to avoid overreliance and to ensure that new software versions do not compromise diagnostic accuracy [
3].
Hospitals worldwide, including the Nordic countries, have started integrating AI into clinical practice [
4,
5,
6,
7]. At Lillebaelt Hospital, University Hospitals of Southern Denmark, a total of 148,690 radiographic examinations were performed in 2024 [
8]. To address the issue of missed fractures, the hospital implemented an AI-based software for automatic detection of trauma-related findings across the appendicular skeleton. The manufacturer reports that the current version achieves 94% accuracy and an 86% reduction in missed fractures, based on data from 319 cases from the Kettering General Hospital in the UK [
9].
Several studies have demonstrated that AI can achieve high sensitivity and specificity for fracture detection on radiographs [
2,
10,
11,
12]. In addition, AI has been shown to reduce workload, support routine tasks and shorten reading time by 27%, according to a meta-analysis published in 2024 [
13]. Radiology is the medical field with the most extensive application of AI [
14], reflected by the recent increase in AI-related publications from 100–150 per year to 700–800 per year [
15].
However, the use of AI in clinical settings may also raise important concerns. Algorithms often function as “black boxes” and do not provide insights into how decisions are made [
16]. Also, performance may vary if training data is not representative of the investigated population [
17]. Overreliance on AI may lead to false reassurance, and because AI tools are continuously updated, it is essential to determine whether new versions improve or compromise diagnostic performance.
The aim of this study was to compare the diagnostic performance of two different software versions (v1 and v2) of an AI-based algorithm for detecting hand and ankle fractures on radiographs, using the reporting radiographers’ diagnostic report as the reference standard. In addition, the study aimed to assess the influence of AI output on diagnostic decisions.
2. Materials and Methods
2.1. AI Software and Image Management
The AI software used in this study was RBfracture (Radiobotics, Copenhagen, Denmark), a CE-marked class IIa medical device [
18]. RBfracture is a clinical decision-supporting tool designed to assist clinicians with diagnoses such as fractures, lipohemarthroses, effusions and dislocations when there is a clinical suspicion of a new fracture. Two versions of the AI software, 1.8.1 (v1) and 2.1.1 (v2), were investigated. Radiographic images were acquired in the emergency departments at Lillebaelt Hospital (Kolding and Vejle), University Hospitals of Southern Denmark.
Medical imaging data was anonymised, and radiographs were reviewed using a DICOM viewer. For this study, Weasis medical viewer (version 4.6.3; Weasis Team, Geneva, Switzerland) was primarily used, with cross-checking performed in either Bee Dicom Viewer (version 2.6.2; Sainuo United Medical Technology, Beijing, China) for macOS or MicroDicom (version 2025.3; MicroDicom Ltd., Sofia, Bulgaria) for Windows.
2.2. Study Design
This diagnostic accuracy study was designed in accordance with the STARD guidelines (Standards for Reporting Diagnostic Accuracy Studies) [
19]. See
Supplementary Table S1.
2.3. Study Population and Materials
All radiographic examinations were acquired in 2023 as part of routine clinical diagnostics at Lillebaelt Hospital, Vejle and Kolding. Inclusion criteria were as follows: (i) patients aged ≥ 18 years; (ii) clinical suspicion of hand or ankle fracture; and (iii) availability of complete hand or ankle radiographs with a diagnostic report. Exclusion criteria were as follows: (i) patients < 18 years; (ii) examinations performed as follow-up of older fractures; (iii) examinations with inconclusive or insufficient reports by reporting radiographers; or (iv) missing v1 AI-generated output. Each examination comprised multiple projections, acquired according to routine imaging protocols. To ensure random selection within each anatomical group, all examinations were assigned a unique computer-generated random number in Microsoft Excel. The list was then sorted by this value, and the first 100 examinations in each group were selected, reaching a total of 200 patients.
Fractures were defined according to the radiographers’ report and included displaced fractures, non-displaced fractures and avulsion fractures. Although all fracture types were eligible for inclusion, the available descriptions did not allow for a consistent classification of fracture morphology across the dataset. Information on patient comorbidities was not available, and image acquisition parameters were not standardised for the purpose of this study.
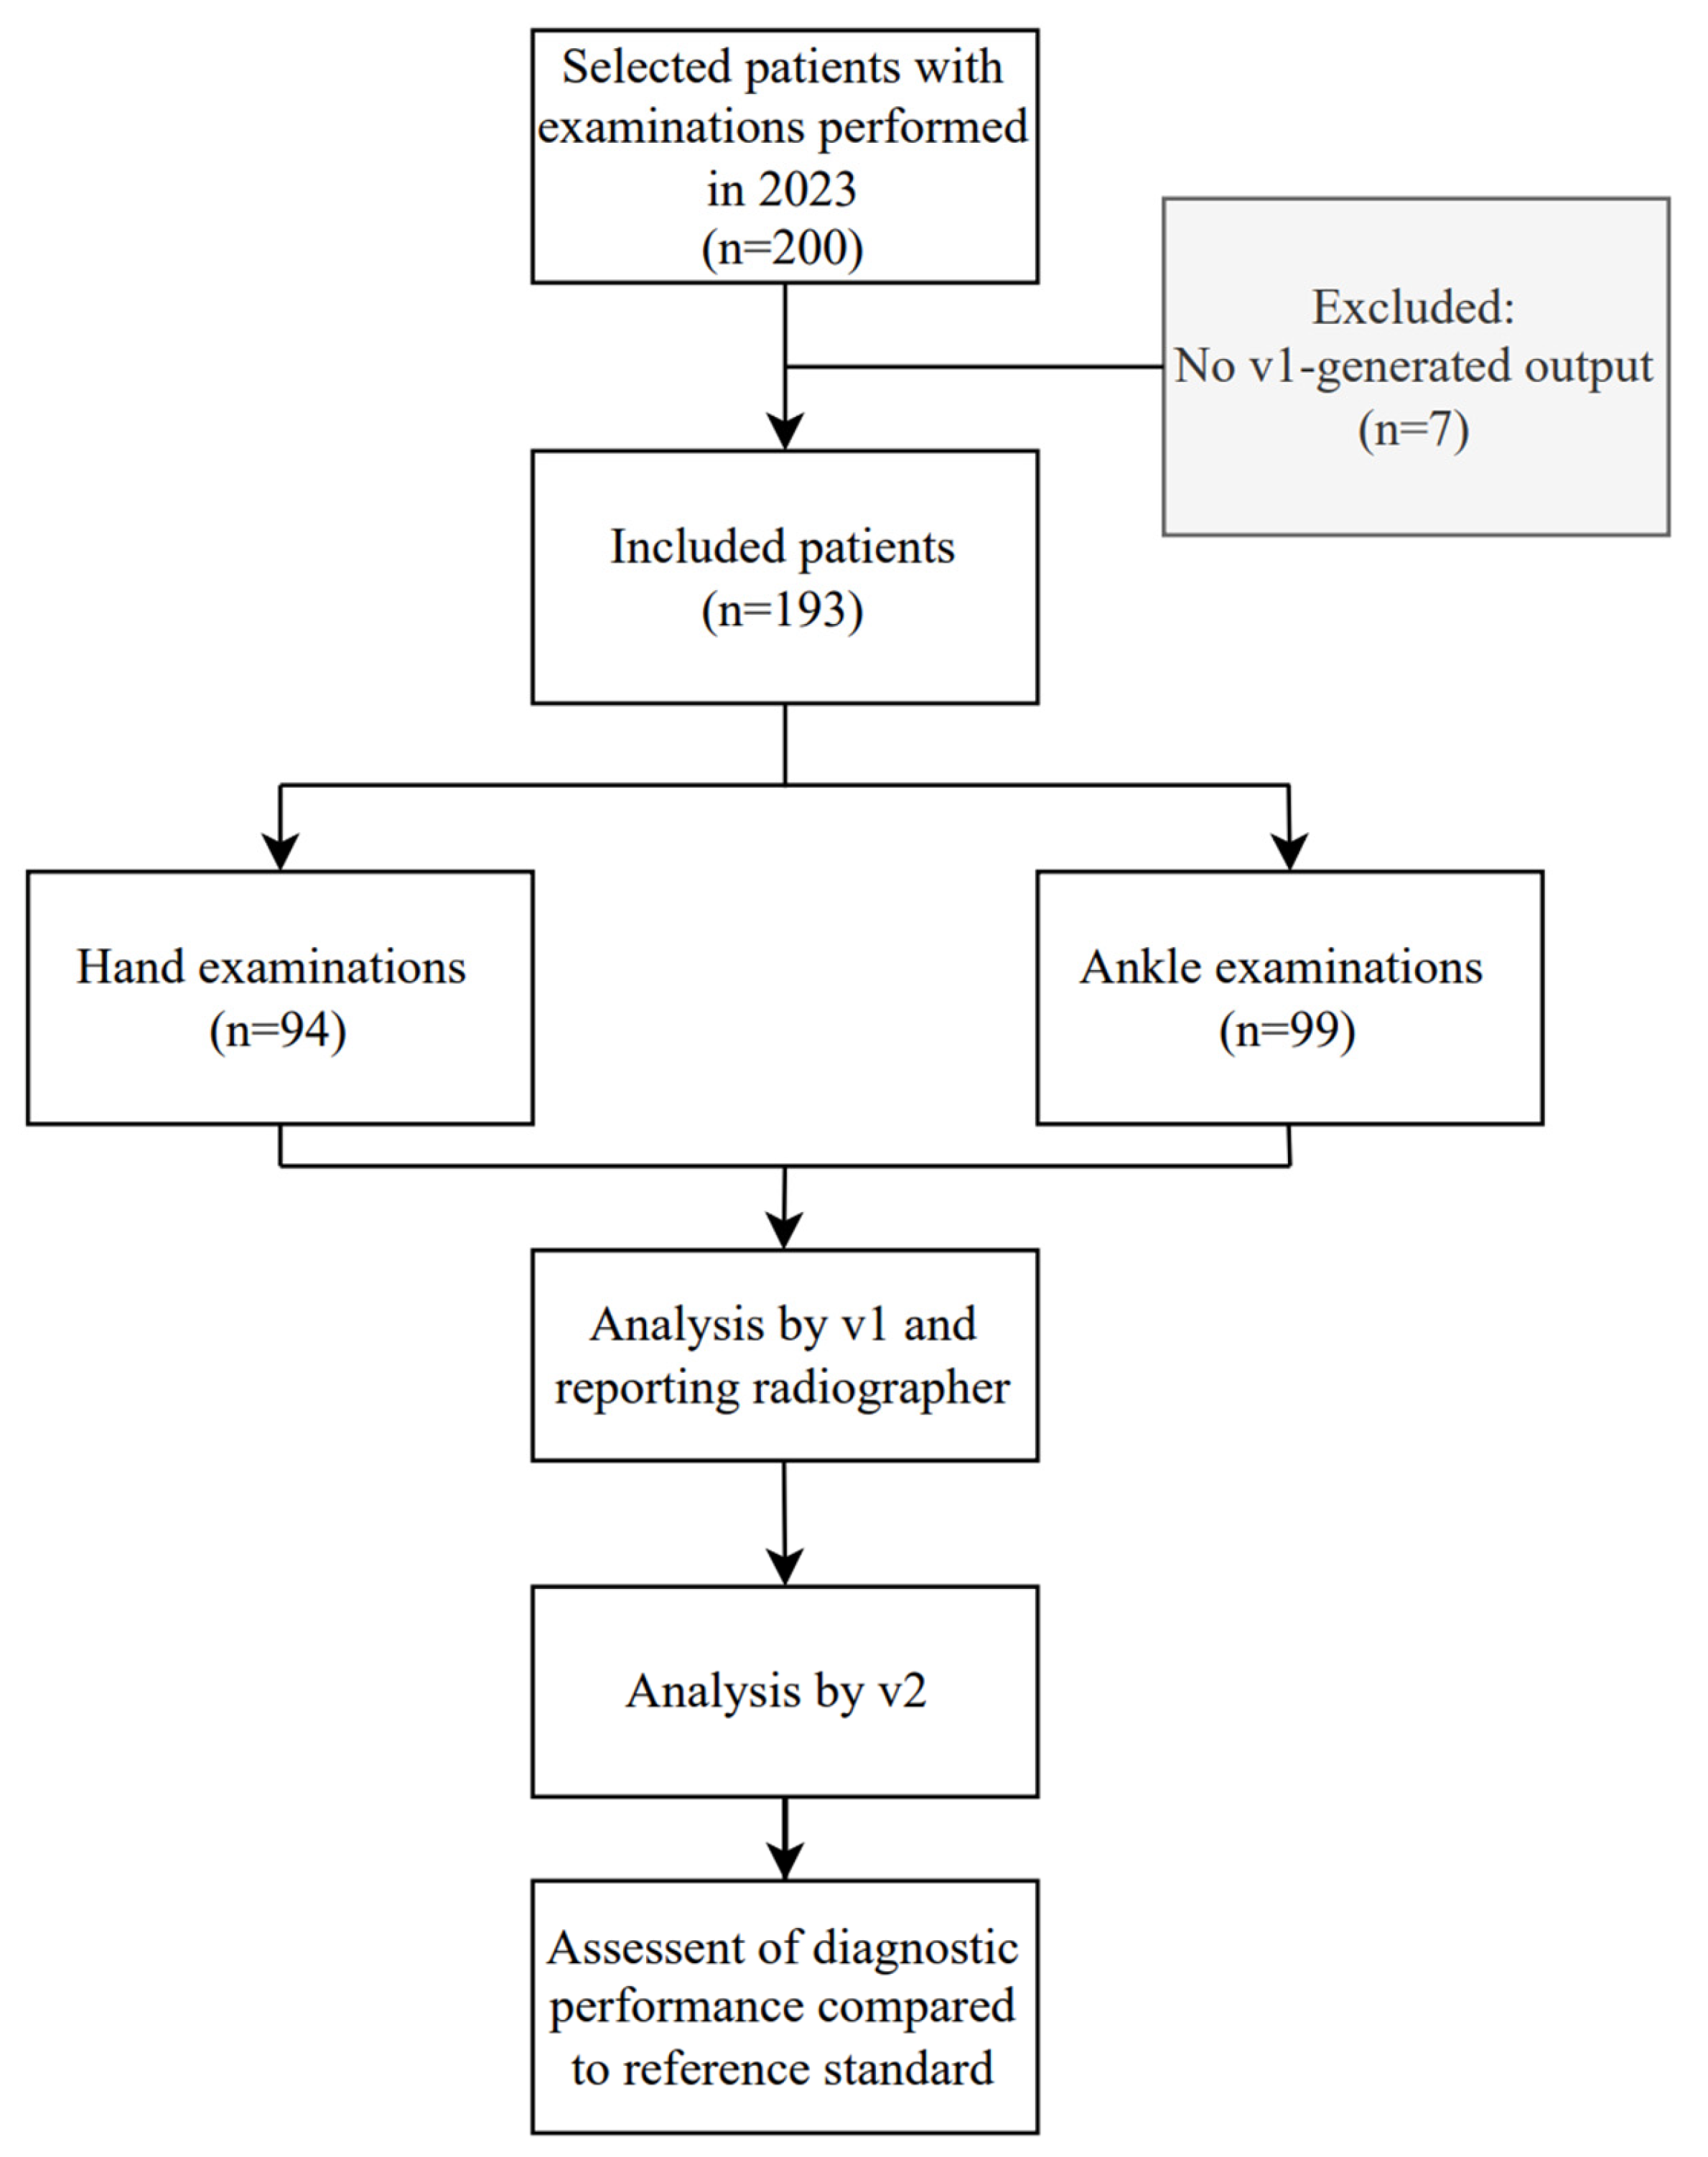
At the time of image acquisition in 2023, RBfracture v1 was used as part of routine clinical diagnostics. Seven patients were excluded due to missing v1 AI-generated output, resulting in a final dataset of 193 patients: 94 hand examinations and 99 ankle examinations (
Figure 1). Hand radiographs comprised the distal radius and ulna, carpal bones and phalanges, while ankle radiographs included the distal tibia and fibula, malleolar region and foot [
20].
2.4. Study Procedure
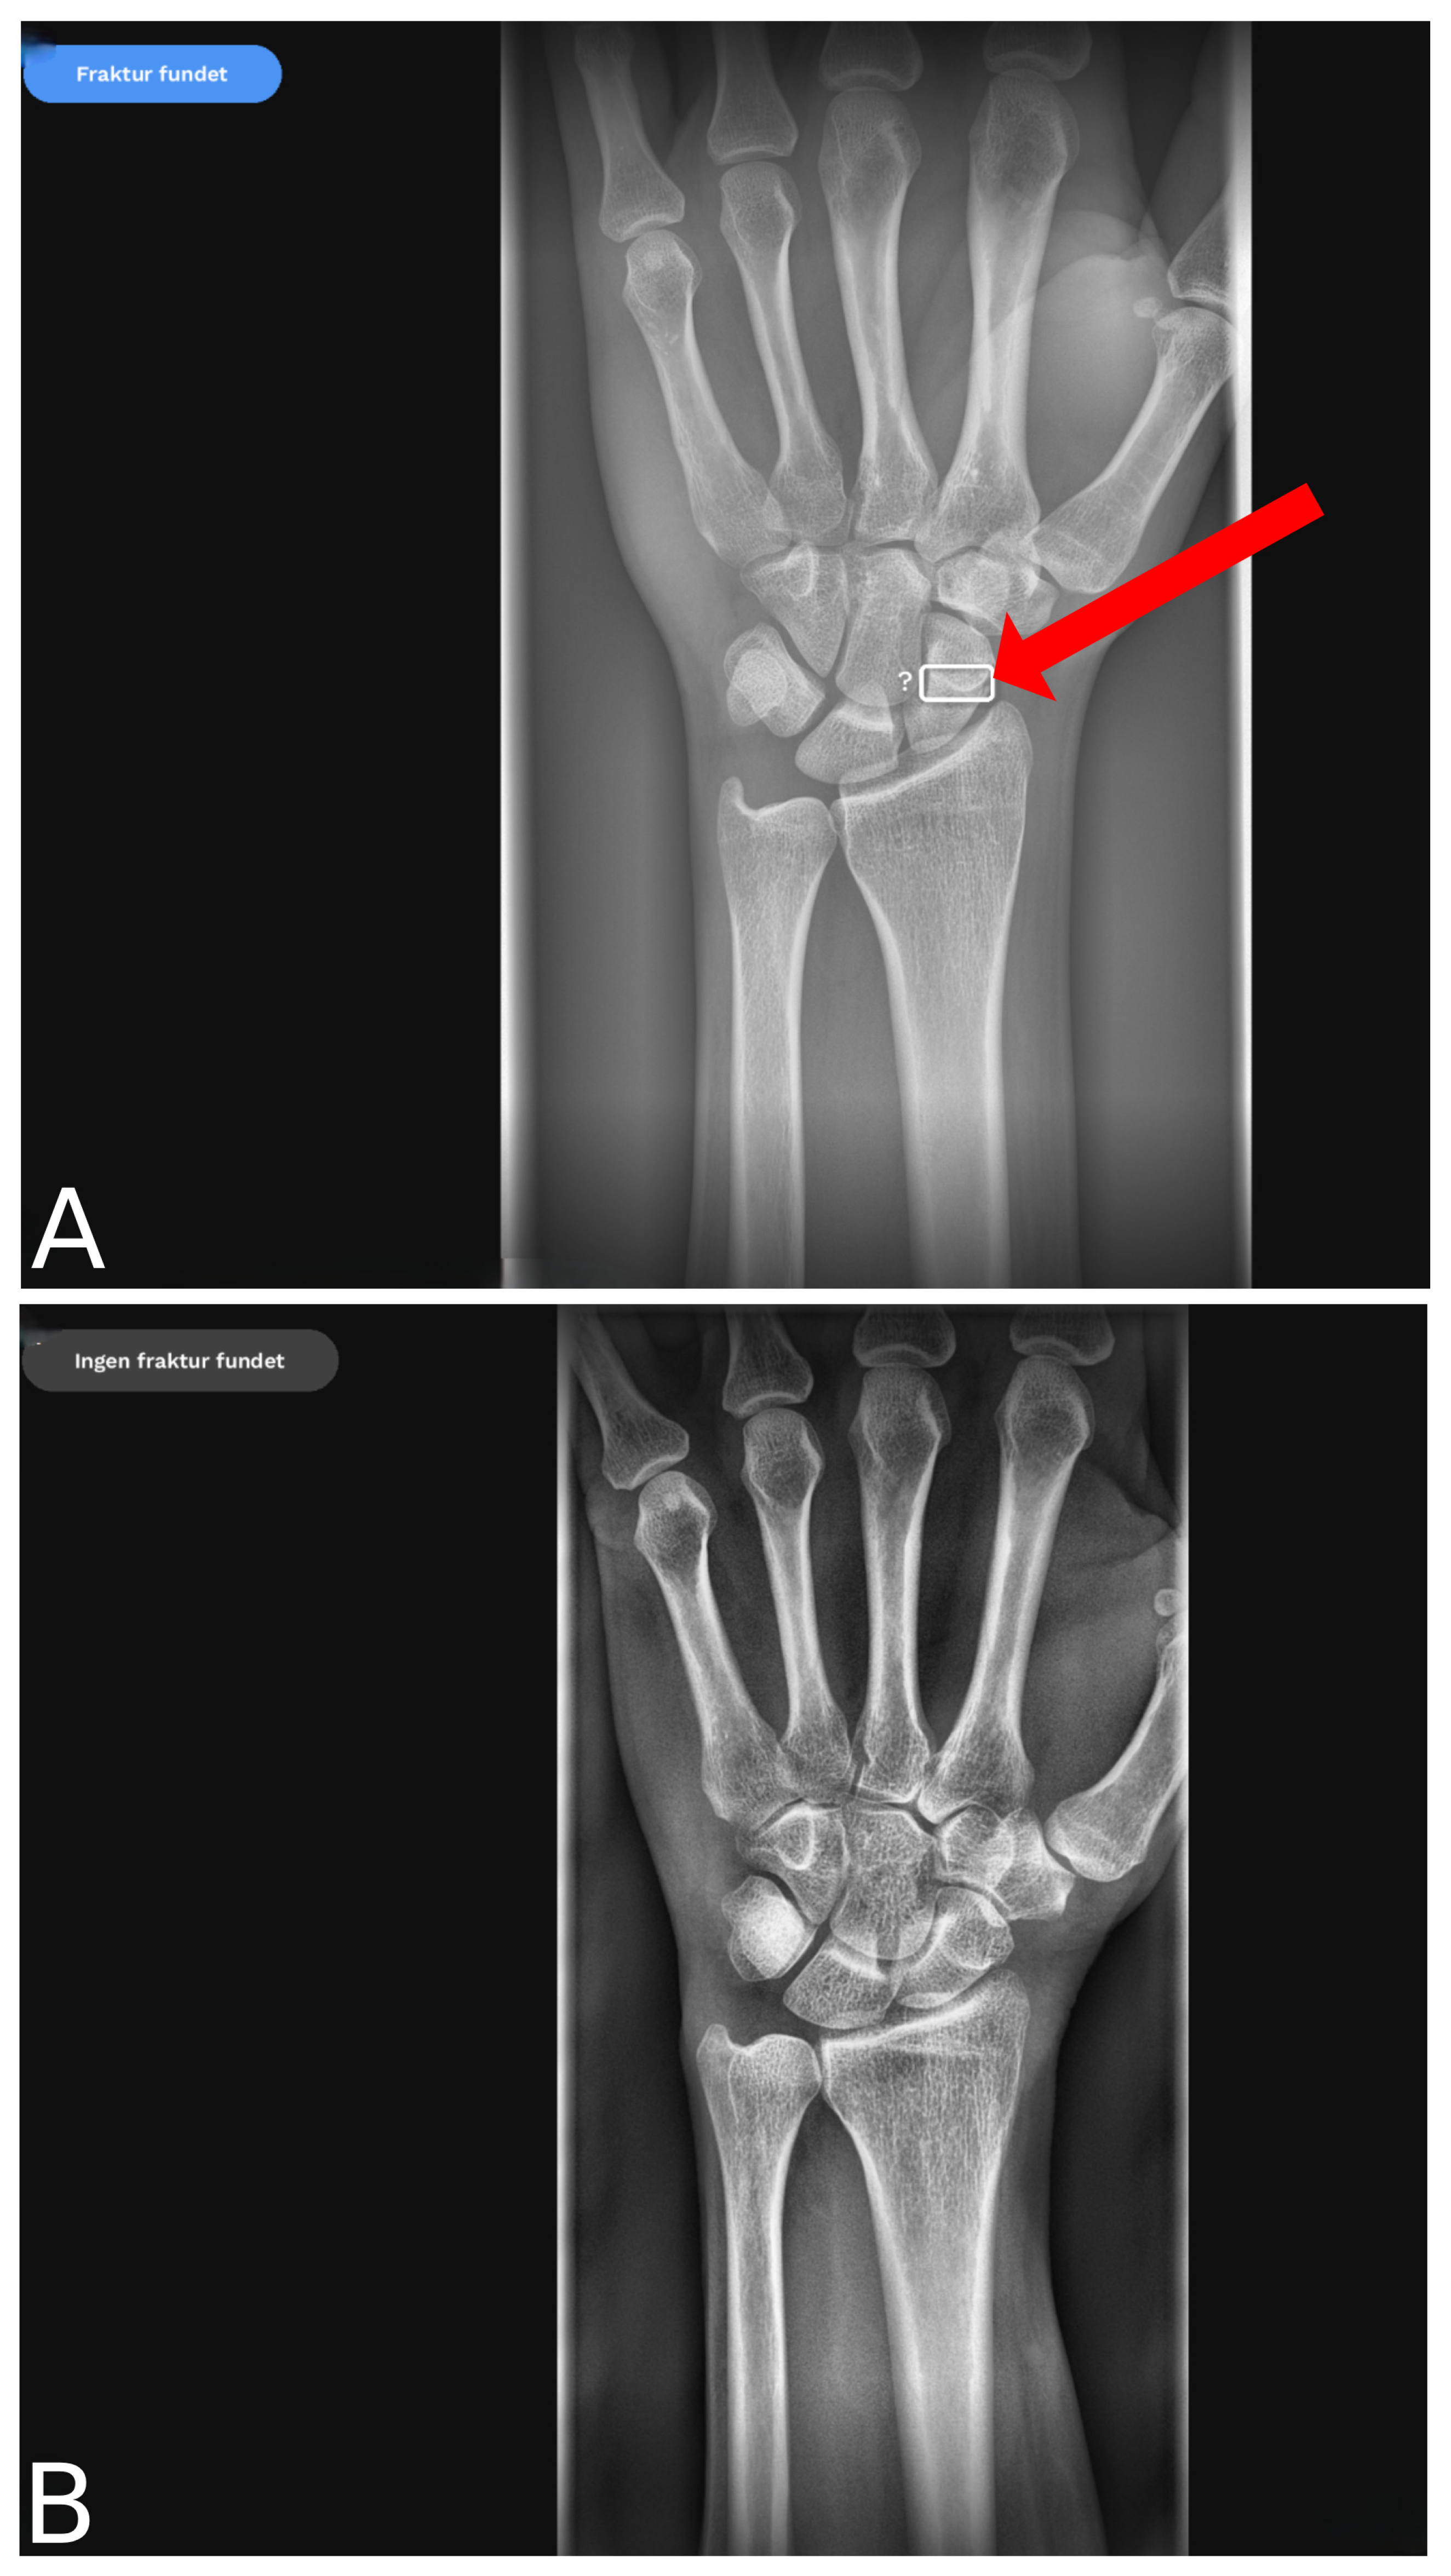
During image acquisition in 2023, all radiographic examinations were analysed by v1 as part of the usual workflow. v1 produced an output image with AI-generated analysis, providing an output for each projection (
Figure 2). Examinations were then analysed by a reporting radiographer, i.e., a radiographer who has completed an additional two-year advanced competency programme [
21]. The v1 output was available during this analysis and could be used as decision support before the reporting radiographer finalised the report. Each radiographic examination was assessed by one reporting radiographer. Detailed information regarding the exact number of radiographers involved, individual years of experience, or specific reporting workflow characteristics was not systematically recorded.
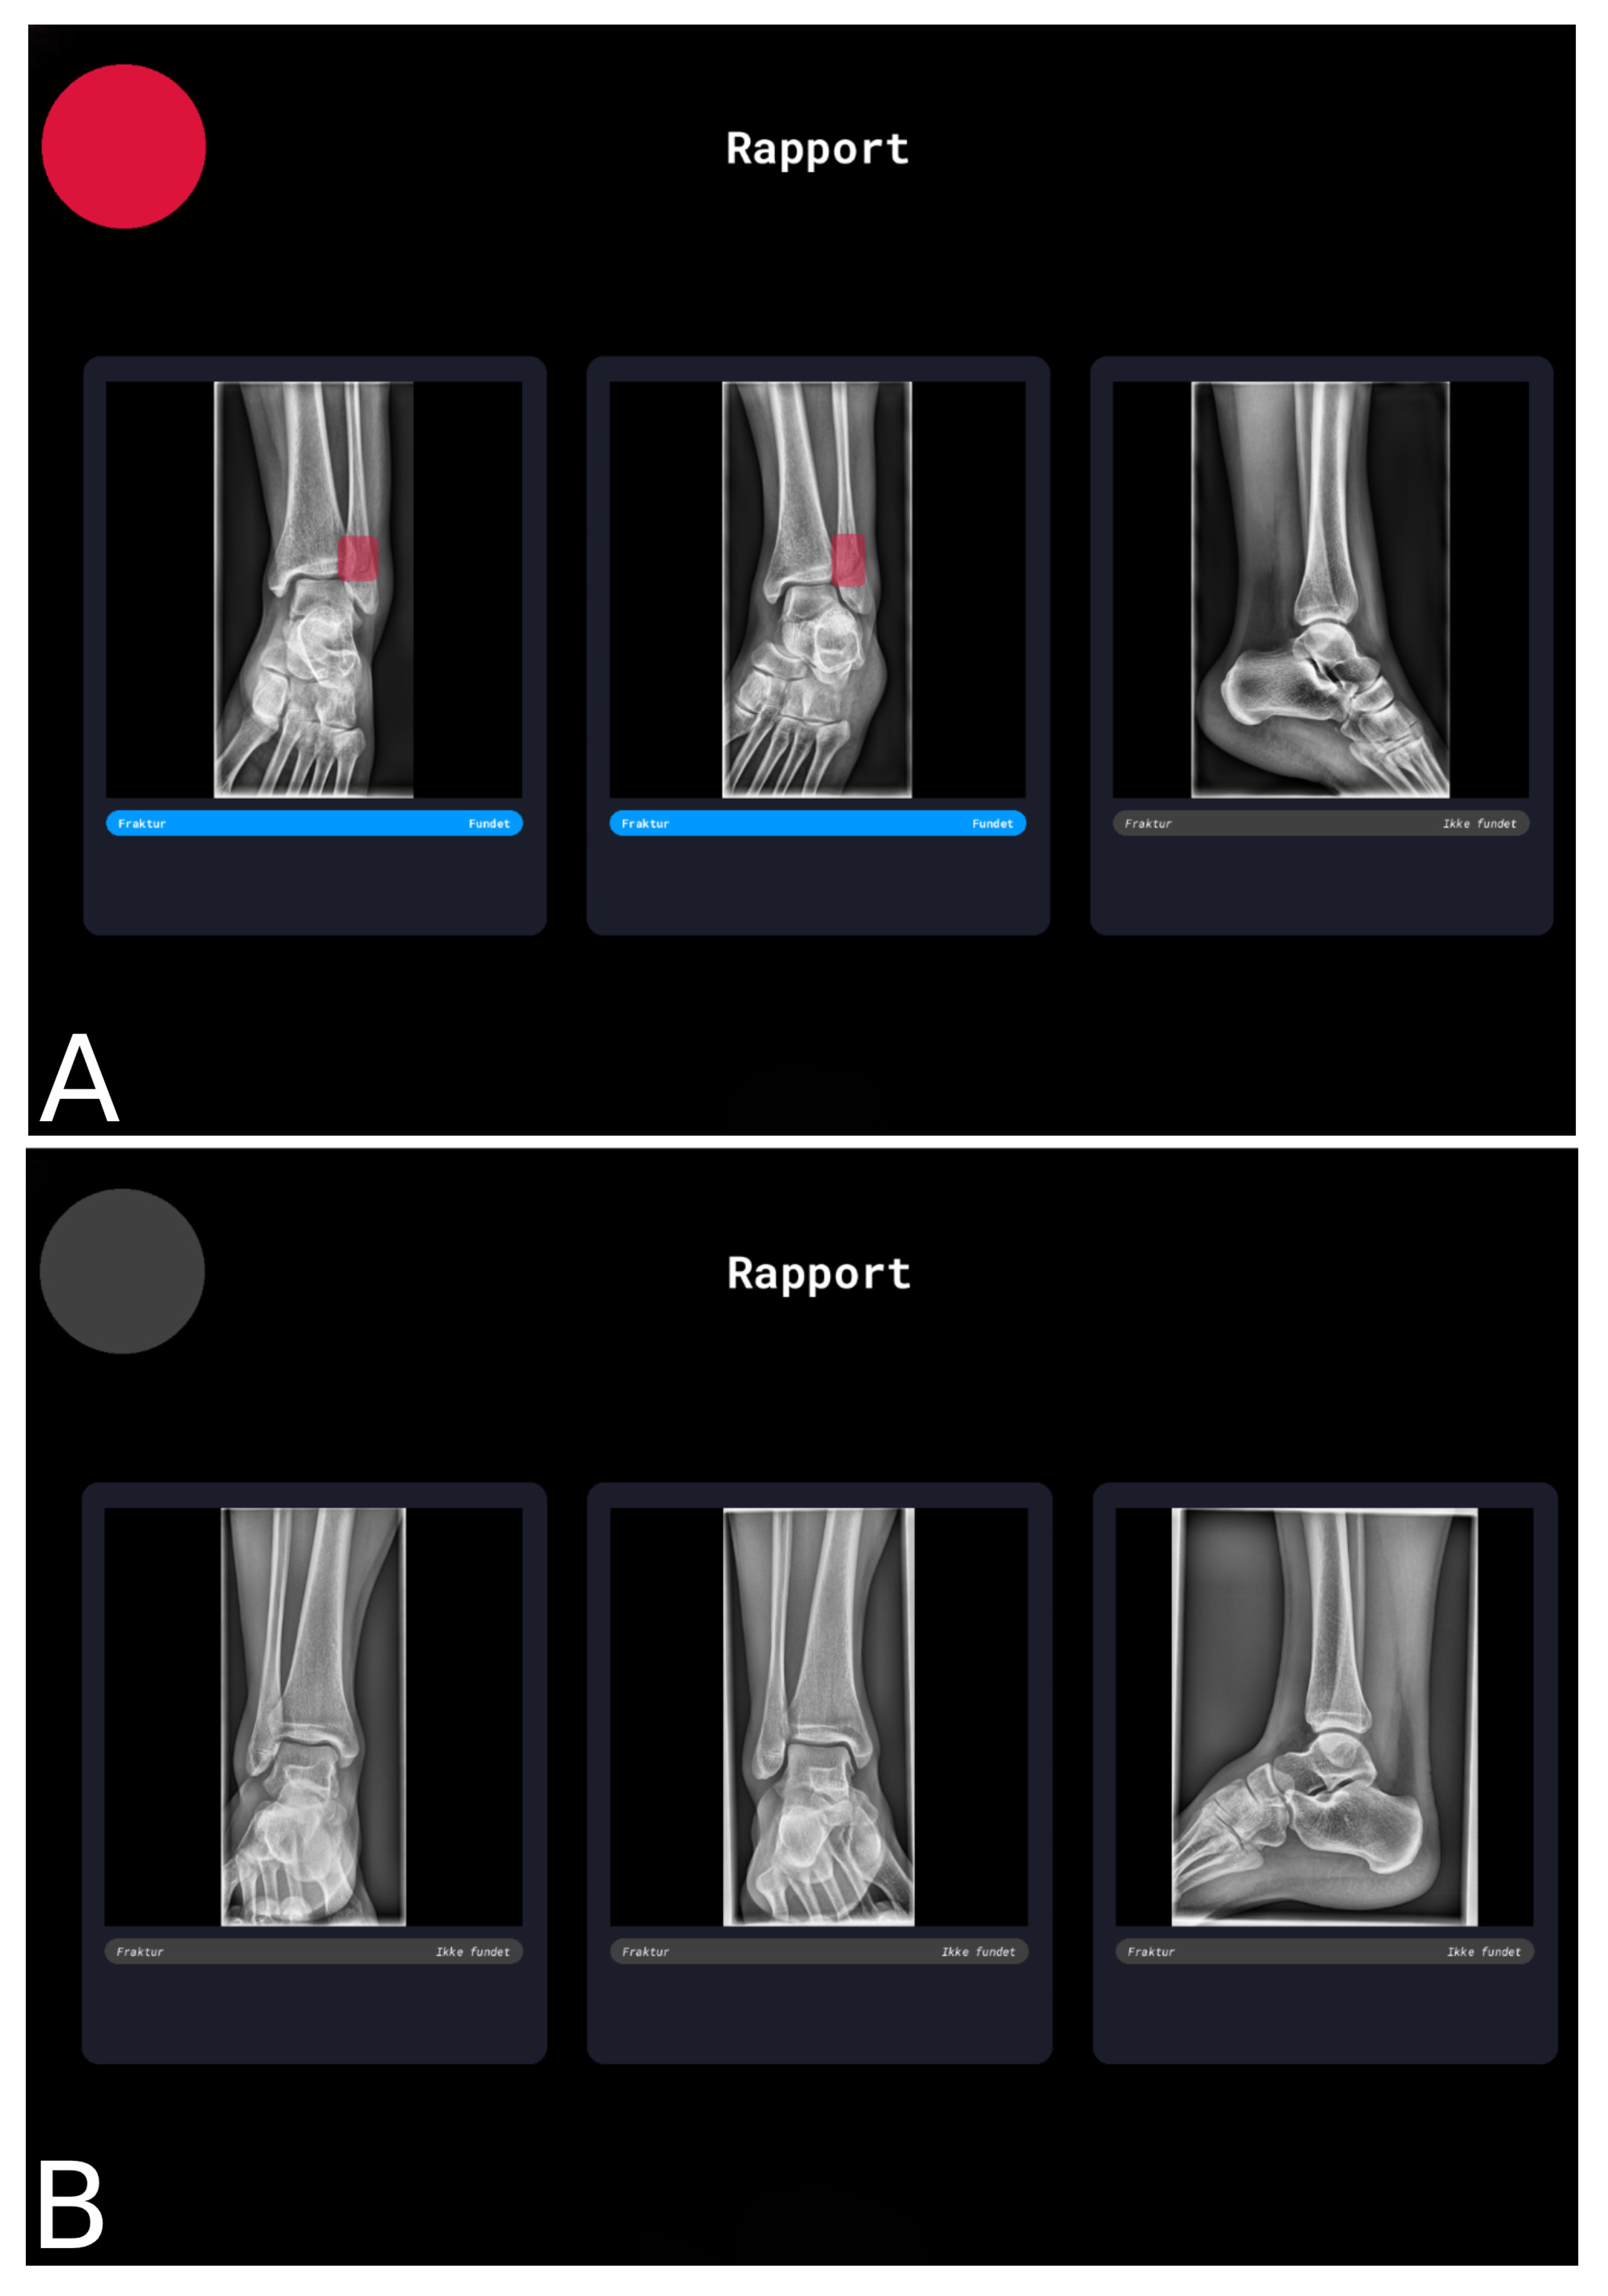
In May 2025, the radiographs were re-evaluated for the present study using v2. In this version, a summary image was generated that integrated all projections from the examination, displaying the AI-generated output (
Figure 3).
The AI outputs were interpreted by reviewing the output images, and results from both v1 and v2 were compared with the original radiographer reports, which served as the reference standard for evaluating algorithm performance.
2.5. Analysis
AI outputs from both software versions classified each radiograph as positive, negative or inconclusive for the presence of a fracture. The system does not provide further details on the likelihood of a fracture. For the analysis, inconclusive outputs were treated as negative to obtain a binary outcome for the diagnostic accuracy analyses. To evaluate the robustness of this approach, an additional sensitivity analysis was performed, in which inconclusive outputs were classified as positive. Data tabulation and initial descriptive analyses were calculated in Microsoft Excel (version 16.101.2) and cross-checked in R, while all statistical analyses were performed in R using RStudio (version 2025.05.1 + 513).
2.5.1. Overall Performance
Diagnostic performance was quantified using sensitivity, specificity, positive predictive value (PPV), negative predictive value (NPV) and accuracy, calculated by the following formulas:
where TP are true positives and FN are false negatives.
where TN are true negatives.
where FP are false positives.
where TN are true negatives.
Comparison of sensitivity, specificity and accuracy between the versions was performed in R using McNemar’s chi-squared test for paired binary outcomes, restricted to reference positive for sensitivity and reference negative for specificity; accuracy was assessed across all samples. A significance level of 0.05 was used for all statistical tests. Comparisons of differences in performance metrics were conducted in R using bootstrap percentile confidence intervals (1000 resamples), as these measures may not be normally distributed. Calculation was performed by resampling patients at the examination level, thereby preserving the paired structure between v1 and v2.
2.5.2. Exploratory Subgroup Analyses
To further investigate the difference between the versions, exploratory subgroup analyses were performed. Potential demographic and anatomical variations were assessed by stratifying the data by sex (male and female), age groups (18–30, 31–60 and 61–99 years) and anatomical location (hand and ankle). Diagnostic accuracy metrics were calculated in R for each subgroup.
To assess whether visible bandages or casts affected algorithm performance, all such examinations were excluded to form a modified dataset. Diagnostic performance metrics were recalculated using R, and differences in accuracy between the original and modified datasets were compared descriptively.
2.5.3. Influence of AI
Finally, to assess the influence of AI on radiographers, cases with disagreement between v2 and the original radiographer report were re-evaluated by a single reporting radiographer. The radiographer decided whether to revise or maintain the original reports, and the number of revised cases was recorded using Microsoft Excel. Disagreement with v1 was not reassessed, as v1 findings were already available to the radiographers upon initial assessment.
3. Results
A total of 193 patients were included (82 males [42%], 111 females [58%], with an age range of 18–99 years; mean age = 50 years). Clinical diagnoses included fractures, dislocations, effusions, arthrosis, chondrocalcinosis, traumatic amputations and non-pathological findings.
3.1. Overall Performance
Of the 193 examinations, 88 (46.6%) contained one or more fractures according to the reference standard. The remaining 105 examinations were classified as negative. v1 identified 90 positive, 85 negative and 18 inconclusive examinations, whereas v2 identified 85 positive, 108 negative and zero inconclusive.
Compared with v1, v2 demonstrated higher diagnostic performance. Overall, v2 achieved a sensitivity of 0.909, specificity 0.952, PPV 0.941, NPV 0.925 and accuracy 0.933, compared with 0.818, 0.828, 0.800, 0.844 and 0.824 for v1. The largest improvements were observed for PPV (difference 0.14, 95% CI 0.06–0.21), followed by specificity (difference 0.12,
p = 0.002) and accuracy (difference 0.11,
p < 0.001). Sensitivity increased by 0.09, but this difference did not reach statistical significance (
p = 0.061). Detailed diagnostic metrics are shown in
Table 1 and
Table 2.
In the additional sensitivity analysis in which inconclusive results were treated as positive, absolute performance metrics differed from the primary analysis, but the relative performance between AI versions remained unchanged (
Supplementary Table S2).
3.2. Exploratory Subgroup Analyses
3.2.1. Anatomical Location
Diagnostic performance was higher for ankle radiographs than for hand radiographs across both AI versions. Within each anatomical location, v2 consistently demonstrated a numerically higher sensitivity, specificity, PPV, NPV and accuracy compared with v1 (
Table 3).
3.2.2. Sex
Overall diagnostic performance was generally higher for radiographs from female patients than from male patients. Across both sex categories, v2 outperformed v1 in all evaluated metrics (
Table 3).
3.2.3. Age Groups
Across all age strata, v2 demonstrated higher accuracy than v1. In the 31–60 and 61–99 age groups, v2 showed improvement across all diagnostic metrics. In contrast, in the youngest age group (18–30 years), v1 demonstrated higher sensitivity, specificity and NPV than v2, whereas PPV and accuracy were higher for v2. Both AI versions performed best in the youngest patient group and poorest in the oldest patient group (
Table 3).
3.2.4. Bandages/Casts
After excluding 20 examinations containing visible bandages or casts, 173 radiographs remained for analysis. v2 continued to demonstrate higher diagnostic performance than v1 across all evaluated metrics in this modified dataset (
Table 3). Overall diagnostic accuracy differed only marginally between the original dataset and the modified dataset without visible casts for both AI versions (
Supplementary Table S3), with absolute differences in accuracy of 0.008 for v1 and 0.002 for v2.
3.3. Radiographer Reassessment of Discordant Cases
A total of 15 examinations were re-evaluated due to discrepancies between v2 and the original radiographer′s report. Following reassessment, the radiographer revised the initial interpretation in 8 of the 15 cases, while 7 of the 15 evaluations remained unchanged. In most instances, the interpretation was revised from positive to negative. Reassessment was not performed for v1, as v1 outputs were available during original reporting.
4. Discussion
This study compared two versions of RBfracture AI software for detecting fractures in hand and ankle radiographs and demonstrated high overall diagnostic performance. We found that v2 outperformed v1 in the overall performance metrics, with exploratory subgroup analyses showing only minor variations but a consistently favourable pattern. Additionally, more than half of the cases with disagreement between the AI output and the reporting radiographer’s initial interpretation resulted in a revised interpretation.
Previous studies have assessed RBfracture software in clinical settings and have reported diagnostic accuracies comparable to those observed in the present study. Ziegner et al. reported a sensitivity of 92%, a specificity of 83% and an accuracy of 87% for fracture detection across the axial skeleton [
12]. Chan et al. demonstrated a specificity of 95.5% in fractures across the body in an emergency setting [
22]. These studies evaluated a single software version, whereas the present study compared two versions. To our knowledge, no previous studies have compared two versions of RBfracture software.
Several factors may explain the improved performance of v2. For instance, v1 appeared more likely to classify radiographs containing osteosynthesis material as inconclusive, whereas v2 more often provided a definitive classification. However, the presence of osteosynthetic material was not systematically recorded in the present study. Interestingly, excluding radiographs with casts resulted in only small performance differences, suggesting that improvement cannot be explained solely by cast handling. As the distribution of fracture types was not assessed, fracture type-specific analyses were not feasible. Therefore, it cannot be determined whether the improved performance observed in v2 is related to the detection of specific fracture patterns. Furthermore, as radiographs were acquired under routine clinical conditions and information on bone density and acquisition parameters was unavailable, it remains unclear whether the improved performance of v2 reflects enhanced fracture detection or increased robustness to variations in radiographic attenuation, particularly in older patients.
The handling of inconclusive outputs from v1 represents an important methodological consideration. Inconclusive results do not provide a definitive diagnosis and offer limited clinical utility, as they neither confirm nor exclude the presence of a fracture. To enable statistical analysis, inconclusive results were classified into a binary outcome. Reclassification of inconclusive results as positive affected the absolute diagnostic performance, but the comparative advantage of v2 over v1 was preserved. Accordingly, inconclusive outputs were classified as negative, acknowledging the inherent limitation of the analysis. The absence of inconclusive results in v2, despite analysis of the same radiographs, suggests improved algorithm robustness.
The higher predictive values observed by v2 may have practical relevance in emergency situations with a high patient load, where AI-based systems could help prioritise cases and reduce workflow pressure. Nevertheless, the continued need for human verification underscores that AI should complement, rather than replace, radiological expertise. The reassessment of discordant cases indicates that AI output may influence radiographers’ interpretations. However, as reassessment was performed without an independent reference standard, it remains unclear whether the observed changes reflect improved diagnostic accuracy or decision modification following exposure to AI output. This analysis should therefore be interpreted as an assessment of decision modification rather than diagnostic improvement.
One potential advantage of AI in diagnostic imaging is its immunity to the “satisfaction of search” effect, in which detection of one abnormality reduces the likelihood of identifying additional ones. Berbaum et al. demonstrated this phenomenon by showing reduced diagnostic accuracy when simulated lesions were added to chest radiographs [
23]. At the same time, excessive reliance on AI introduces the risk of automation bias, defined by Khera et al. as the tendency to over-rely on assistive technologies, potentially leading to inappropriate diagnostic changes when the algorithm is incorrect [
24].
This study has several strengths. It focused on two anatomical locations—hand and ankle—that are common fracture sites [
17] and can be diagnostically challenging, making them suitable for evaluating diagnostic accuracy. Additionally, the dataset represents a real-world case mix from routine clinical practice across two hospitals, increasing heterogeneity and thereby enhancing external validity.
Several limitations should be acknowledged. The overall sample size was relatively modest, and the number of discordant cases was small, particularly after stratification into subgroups. As a result, the subgroup analyses were exploratory in nature, and their findings should be interpreted with caution. A key structural methodological limitation of this study is the reference standard, which was based on reporting radiographers who had access to v1 output during initial reporting. This may have introduced incorporation bias [
25], as the AI output from v1 could have influenced the radiographer’s interpretation. Consequently, the diagnostic performance of v1 may have been overestimated, thereby attenuating the observed performance differences between the two versions and potentially underestimating the performance gap. The use of multiple reporting radiographers with varying levels of expertise reflects routine clinical practice but may have introduced inter-reader variability, which should be considered when interpreting the results. Also, as the number of reporting radiographers was not assessed, it is unclear whether the same individuals contributed at both the original assessment and reassessment. This may have influenced the likelihood of changing diagnoses and the reassessment outcomes. Furthermore, as the reference standard was human-derived, diagnostic errors such as missed or occult fractures cannot be entirely excluded. The reference standard was also based on reports from reporting radiographers rather than radiologists. Although this reflects routine clinical practice in Denmark [
26], it differs from many other healthcare systems. However, previous studies have demonstrated comparable diagnostic accuracy between reporting radiographers and consulting radiologists in musculoskeletal imaging, suggesting that this approach is unlikely to have introduced substantial bias [
27].
The observed performance differences between software versions highlight the clinical relevance of algorithm updates. These changes may not be apparent in routine clinical use unless systematically evaluated. It may therefore be recommended to perform local performance assessments following the implementation of new versions. Future studies are needed to validate these observed findings between v1 and v2 and examine if these findings are seen in other anatomical regions.




 ,
,