
Impact of Microdosimetric Modeling on Computation of Relative Biological Effectiveness for Carbon Ion Radiotherapy
 ,
,  , , ,
, , , 
Simple Summary
Abstract
1. Introduction
2. Materials and Methods
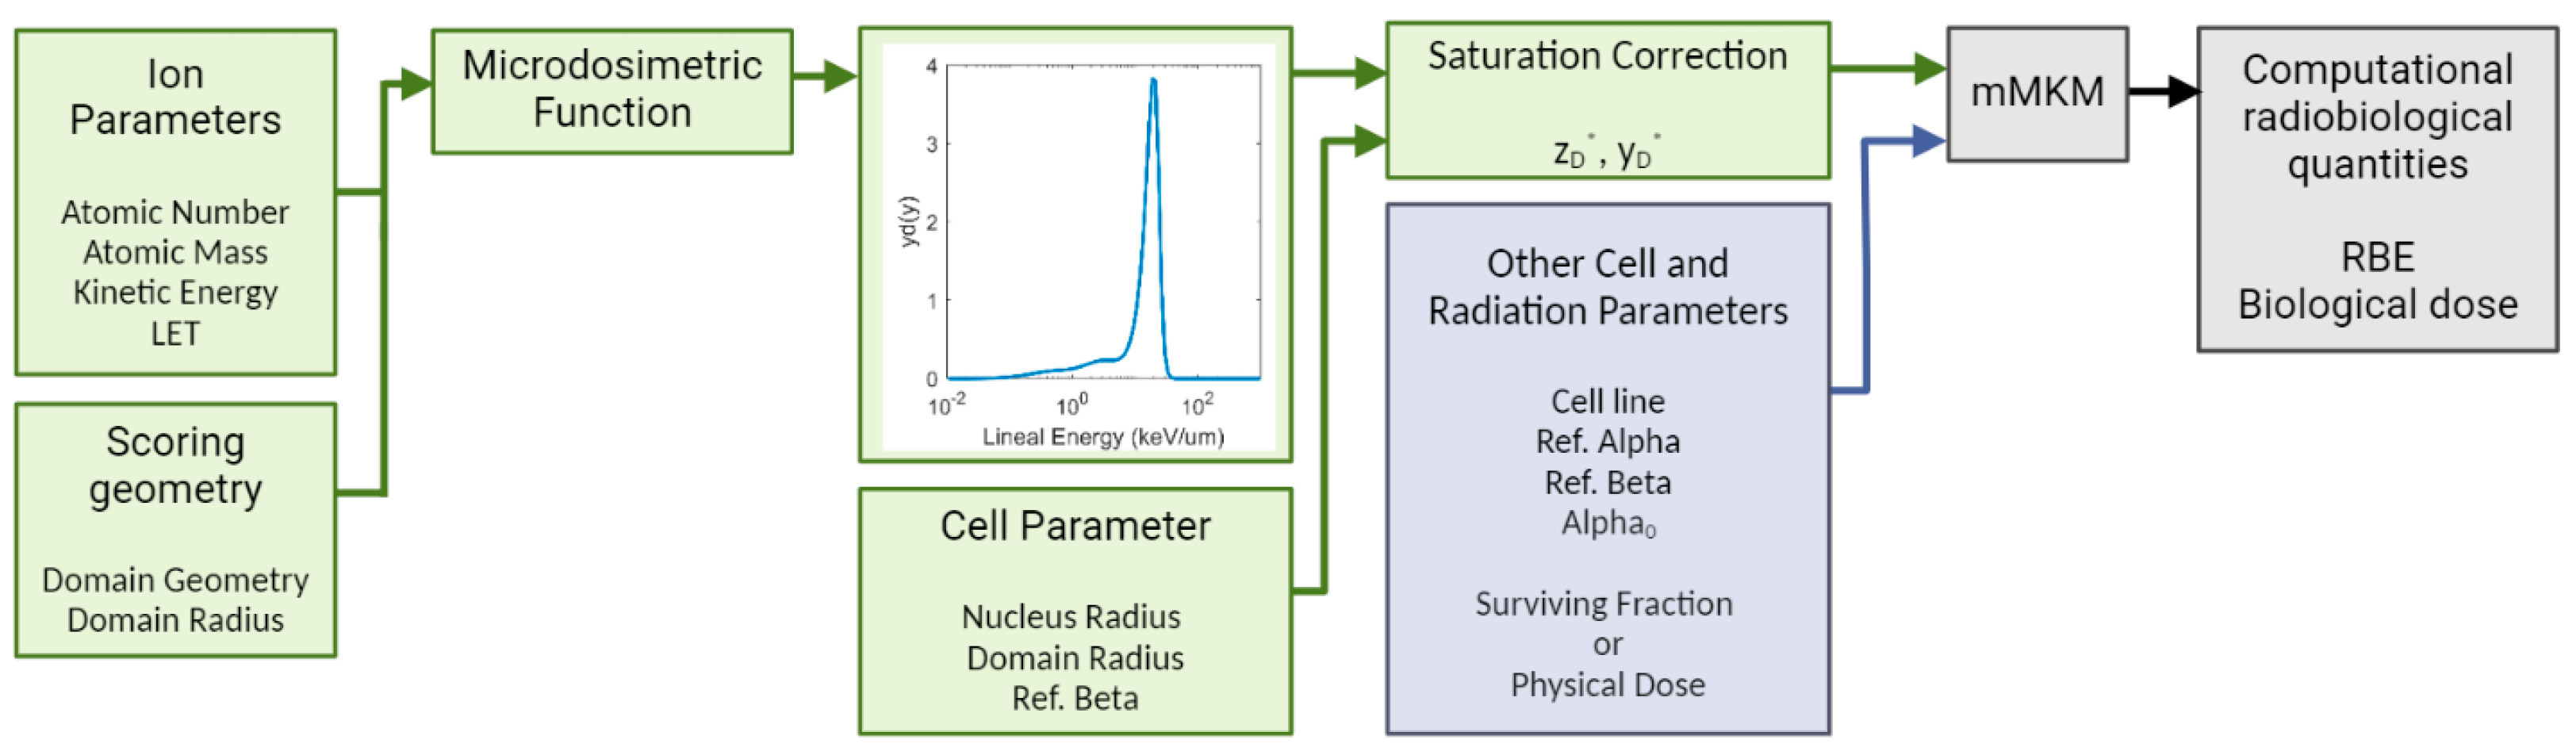
2.1. Study Overview
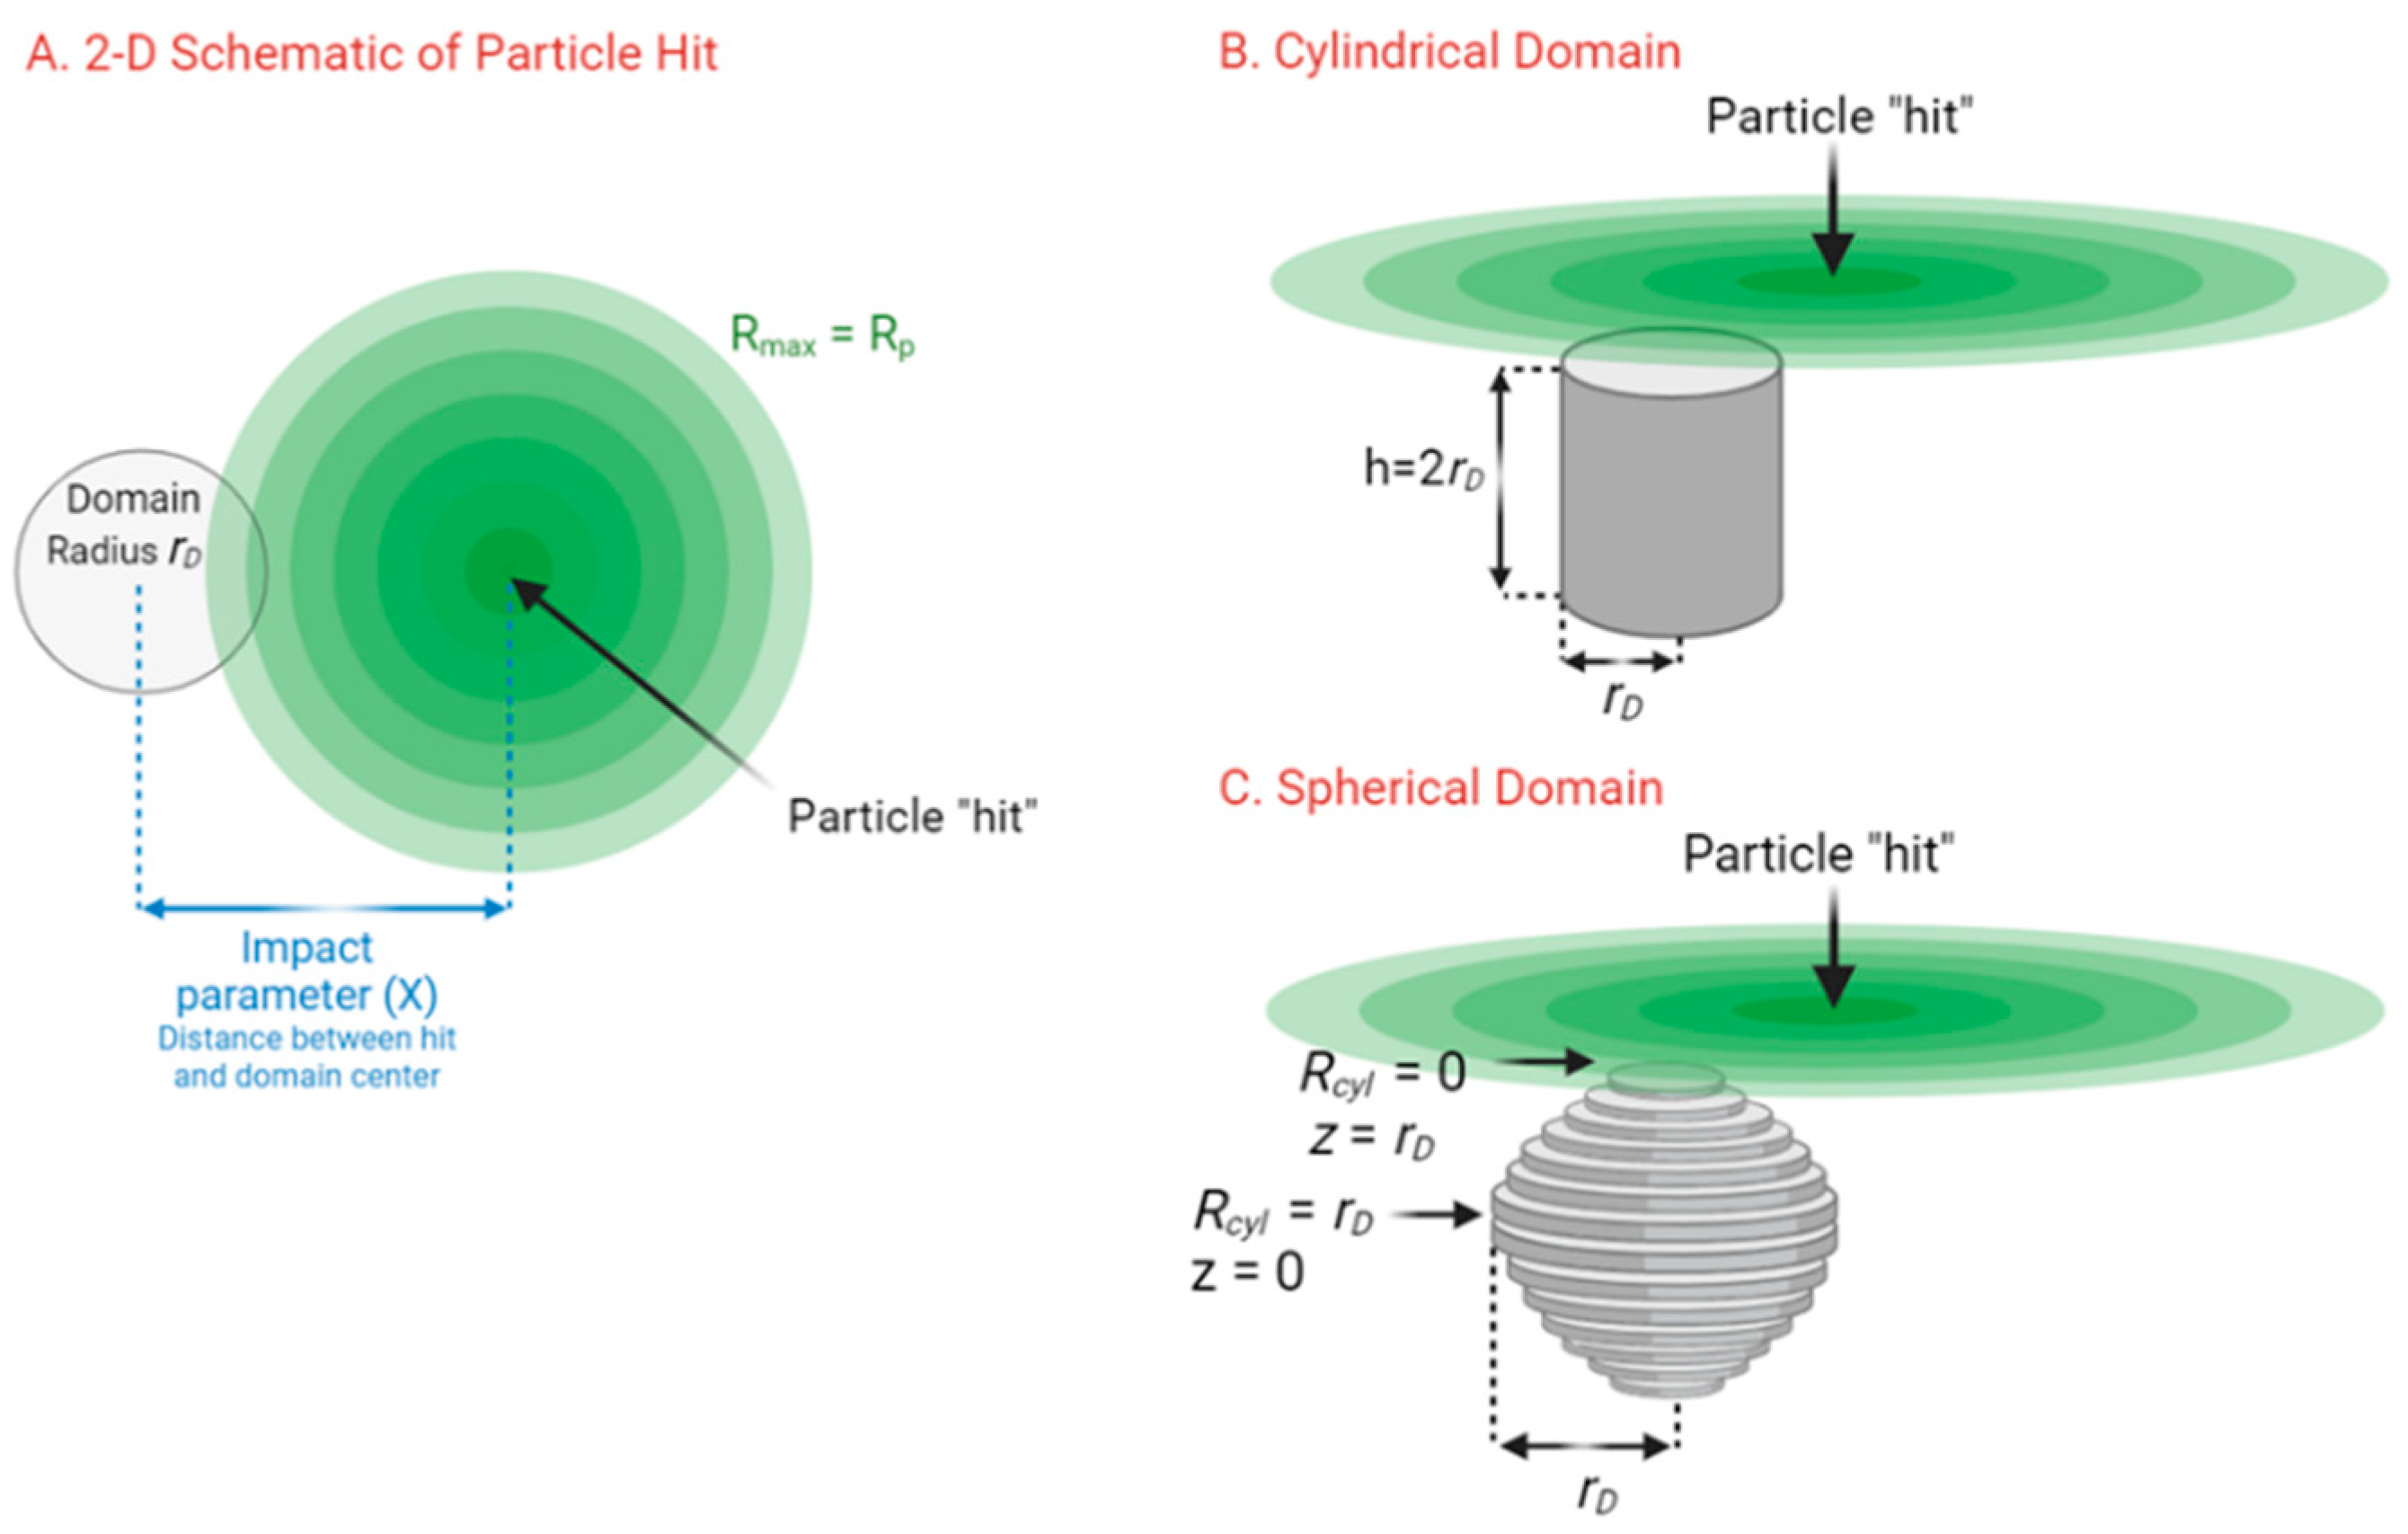
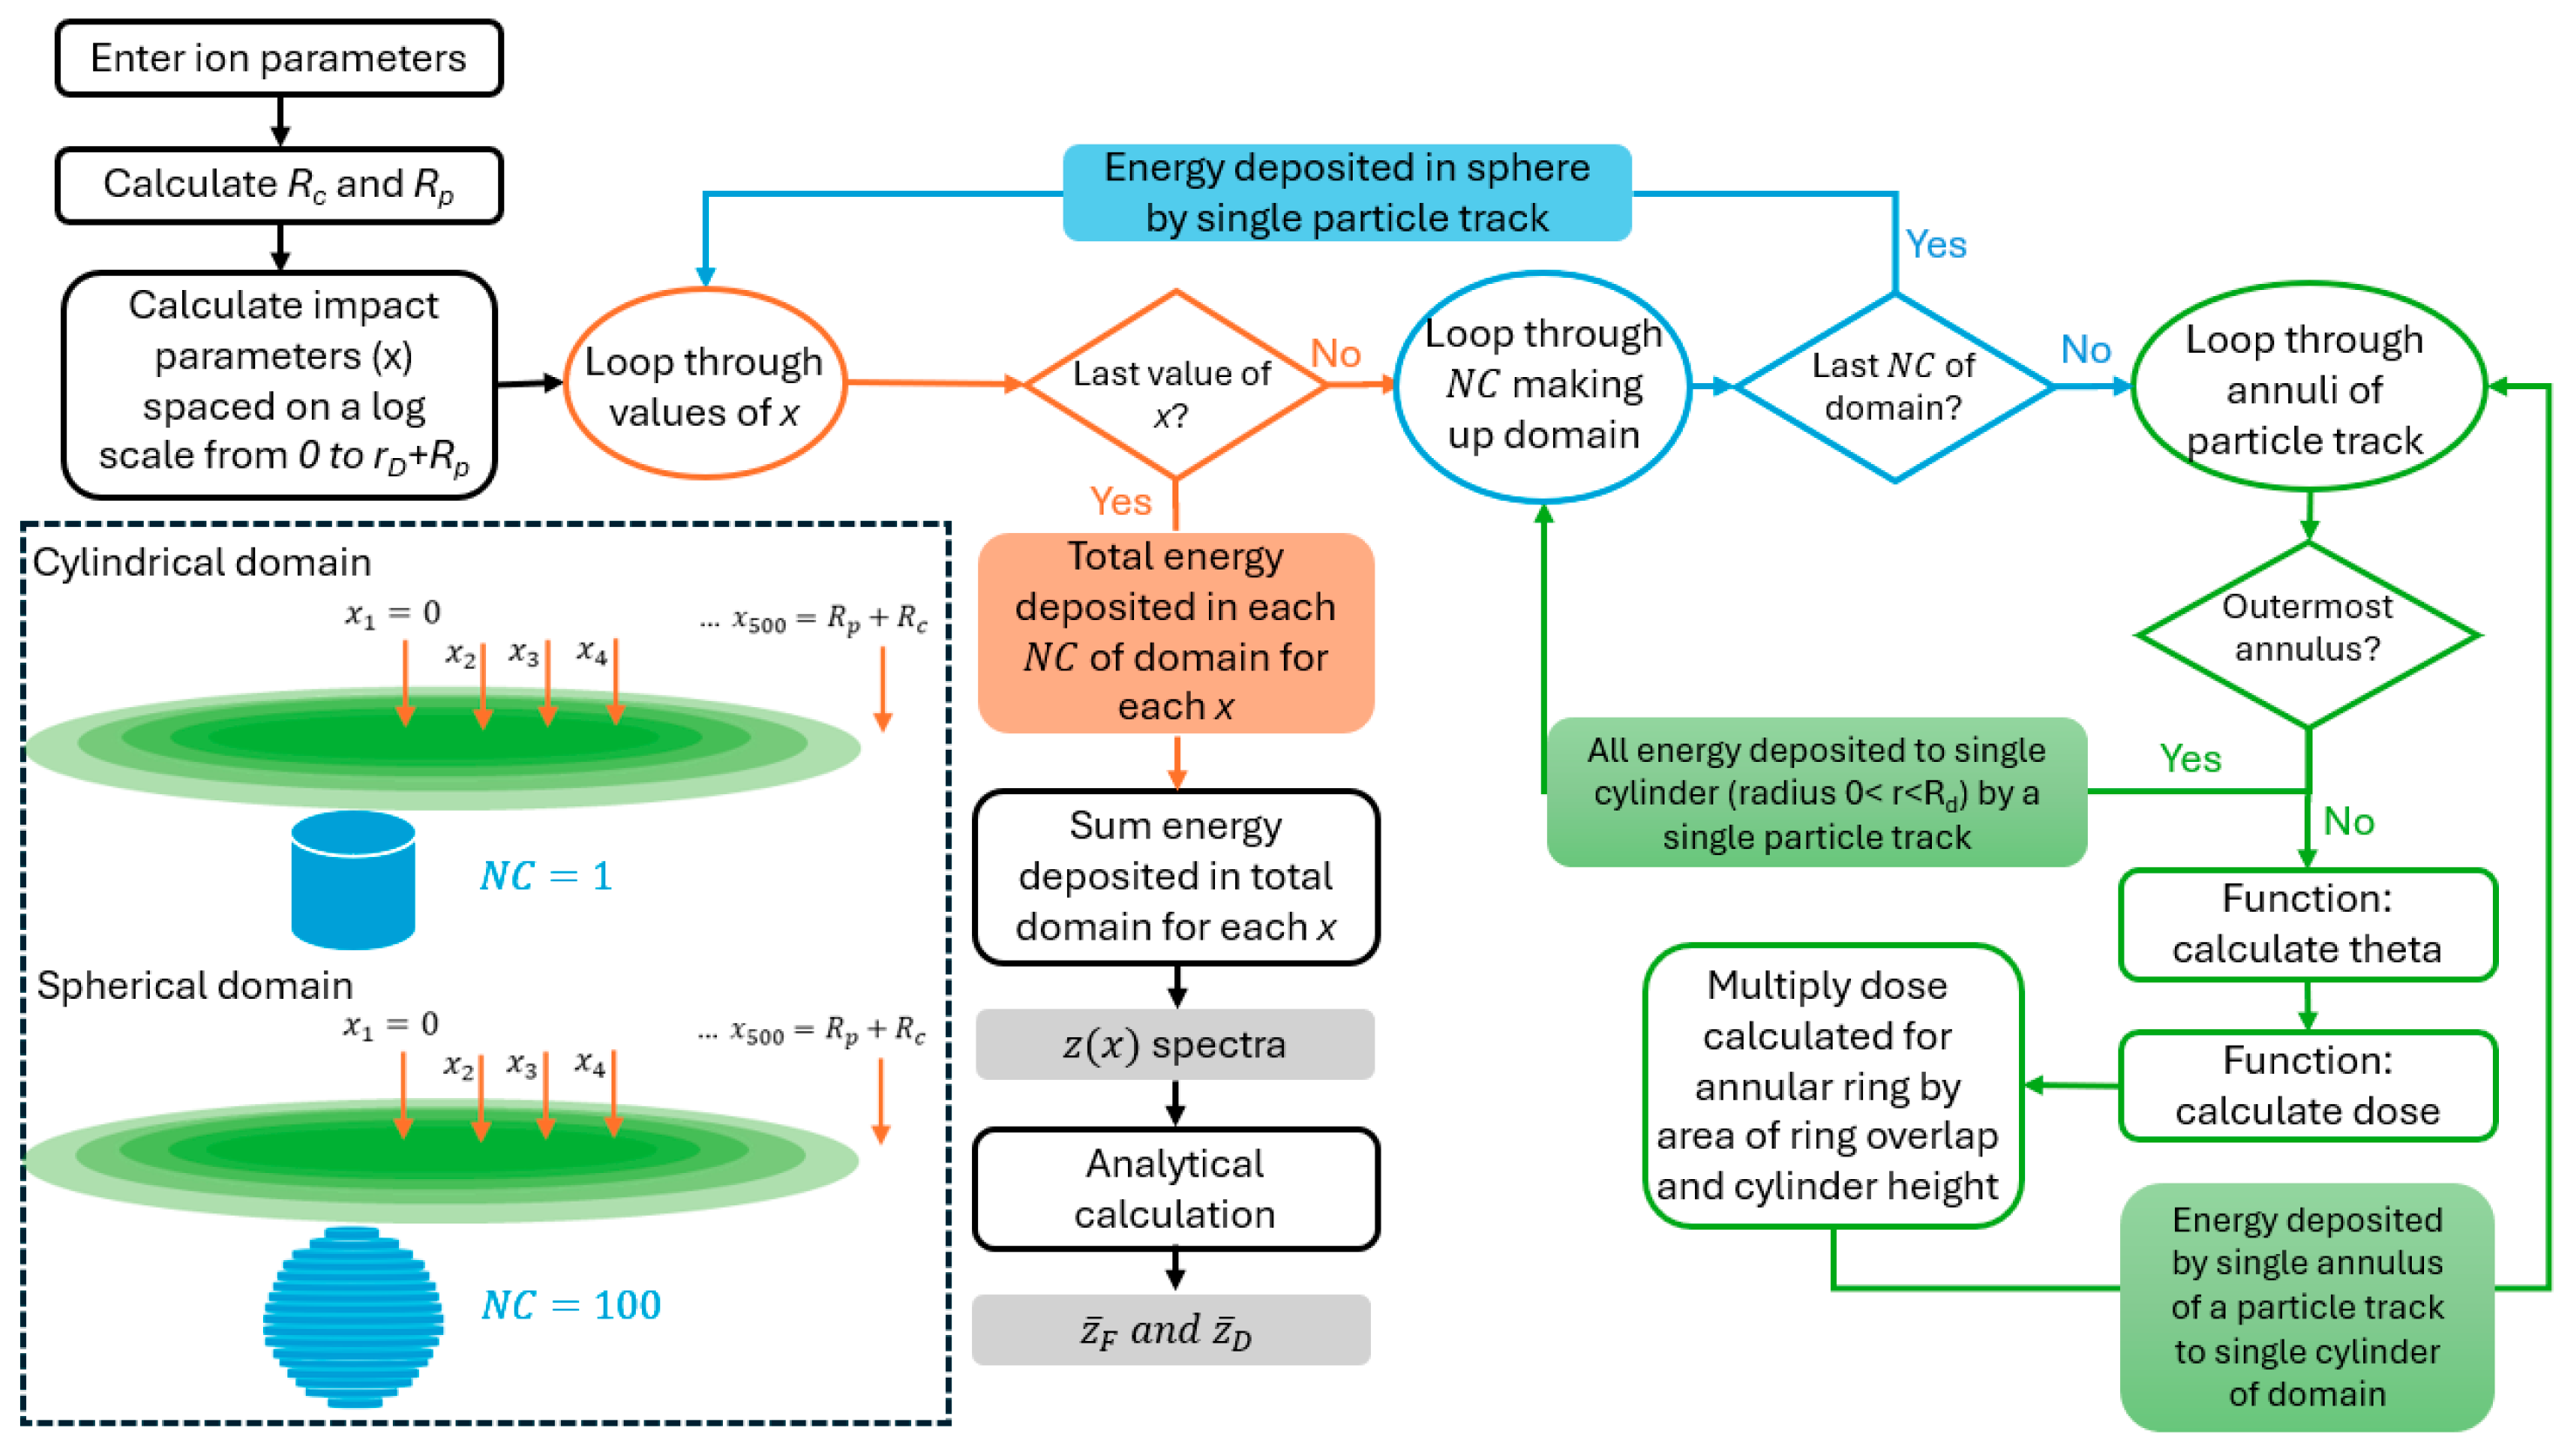
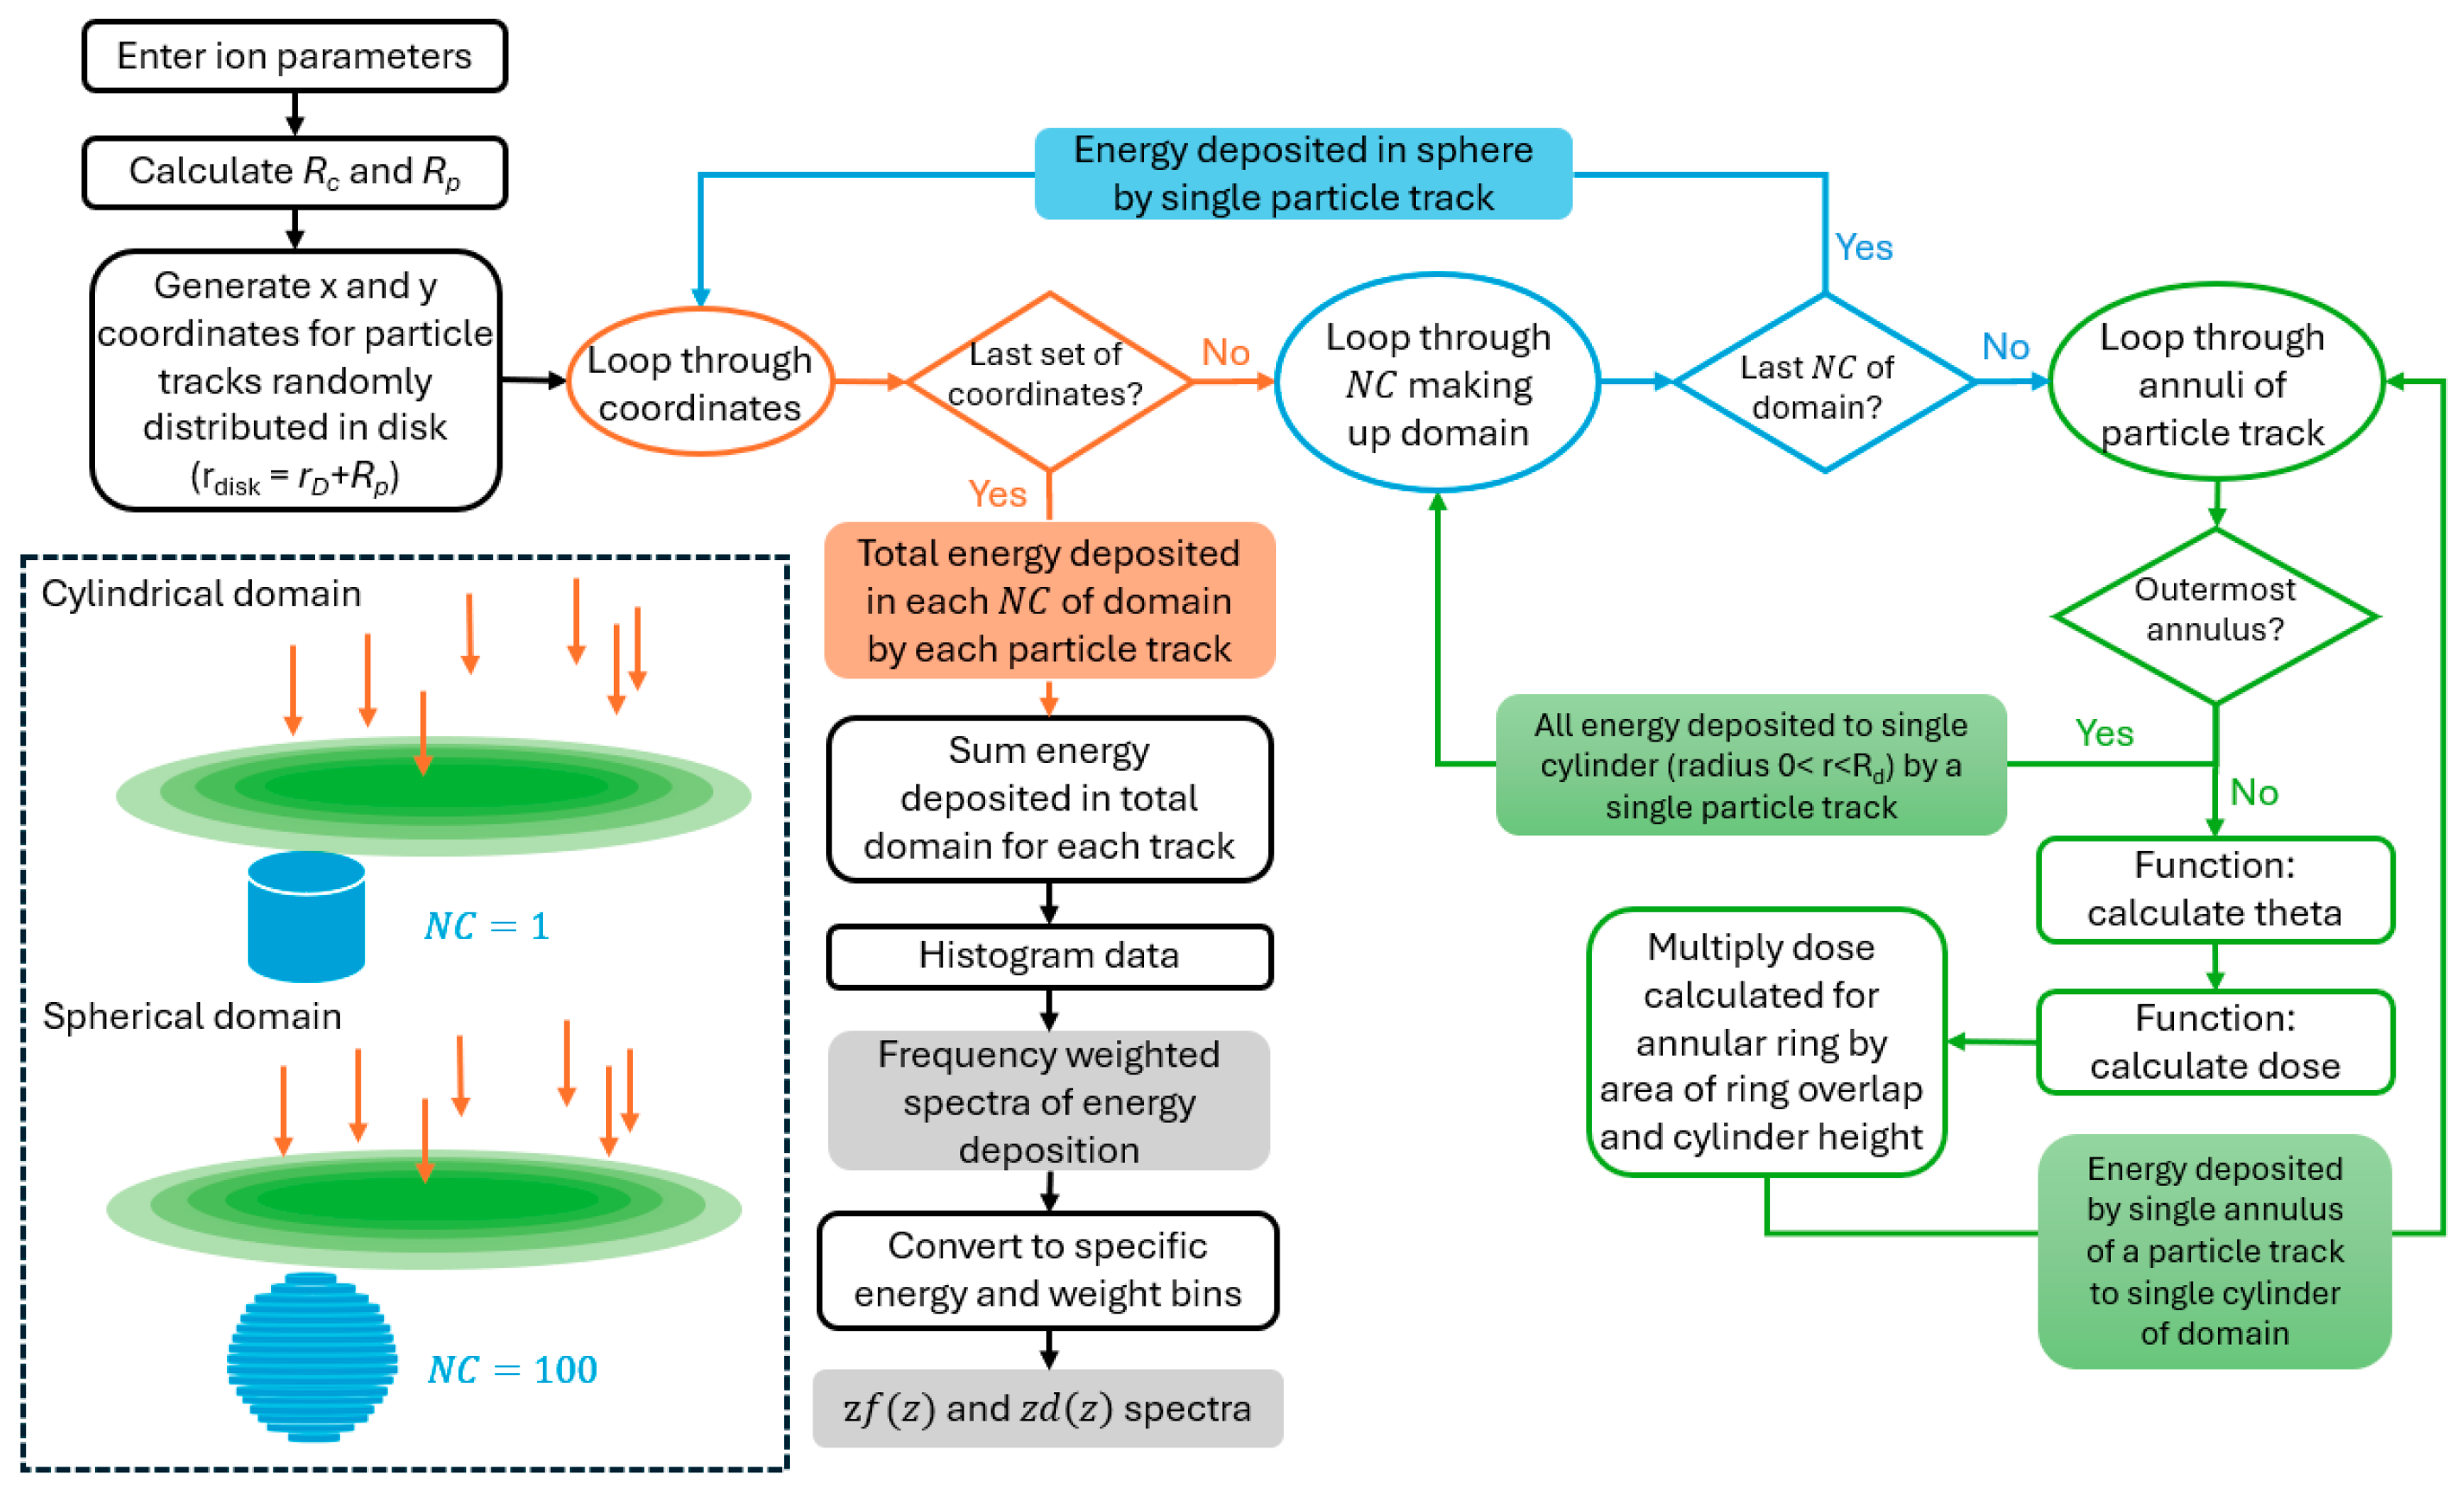
2.2. Microdosimetry
2.2.1. AMF
2.2.2. KC Track Structure Model
2.3. RBE Calculation
3. Results
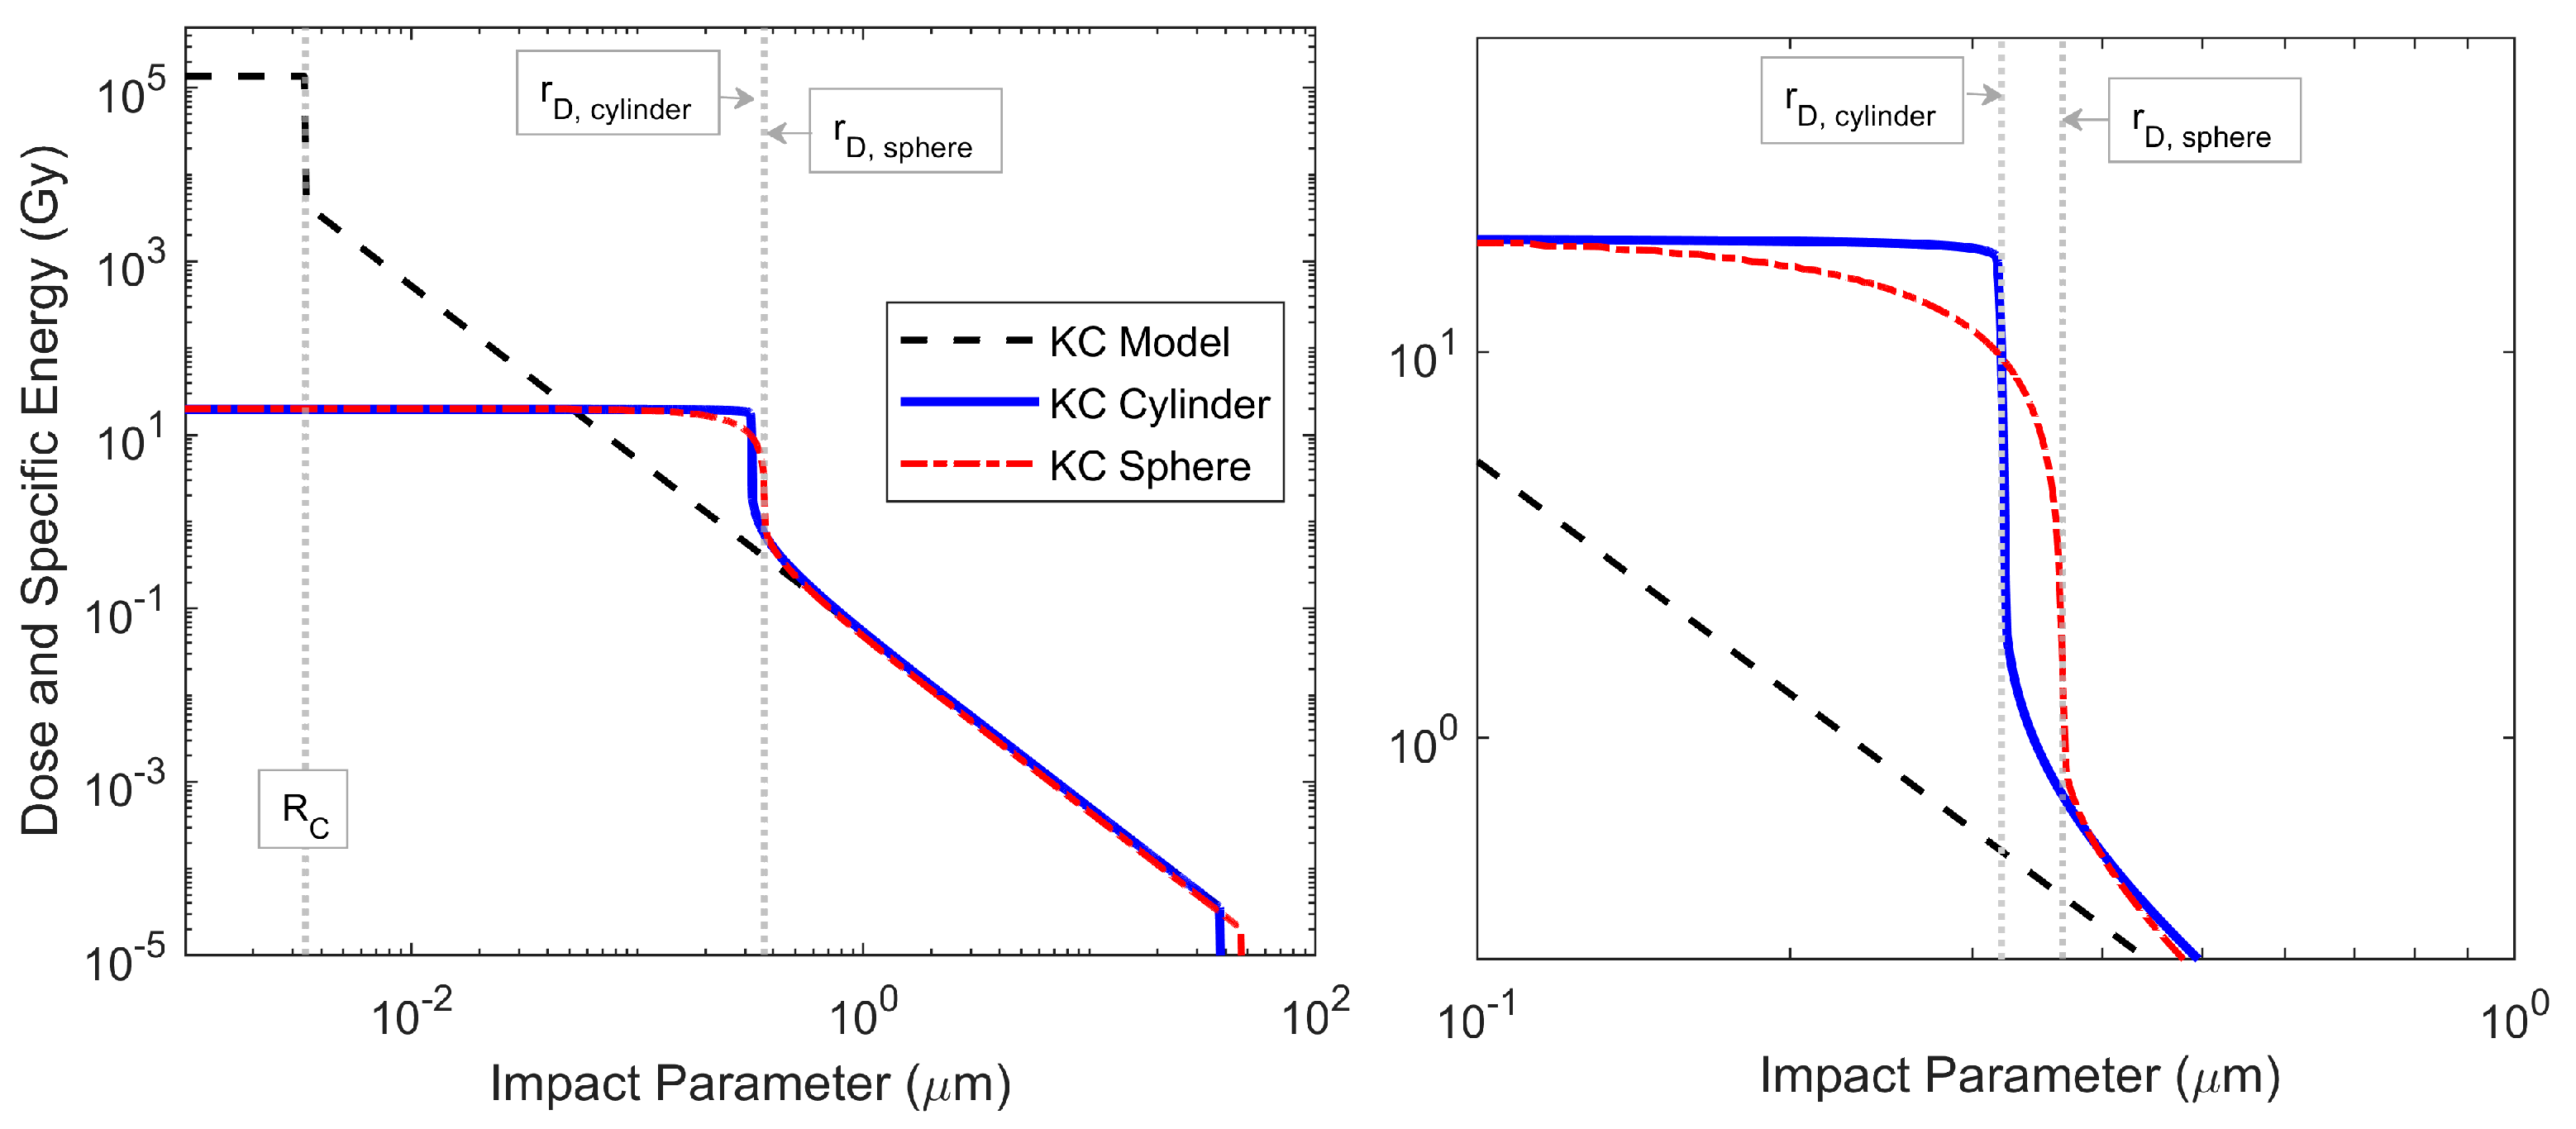
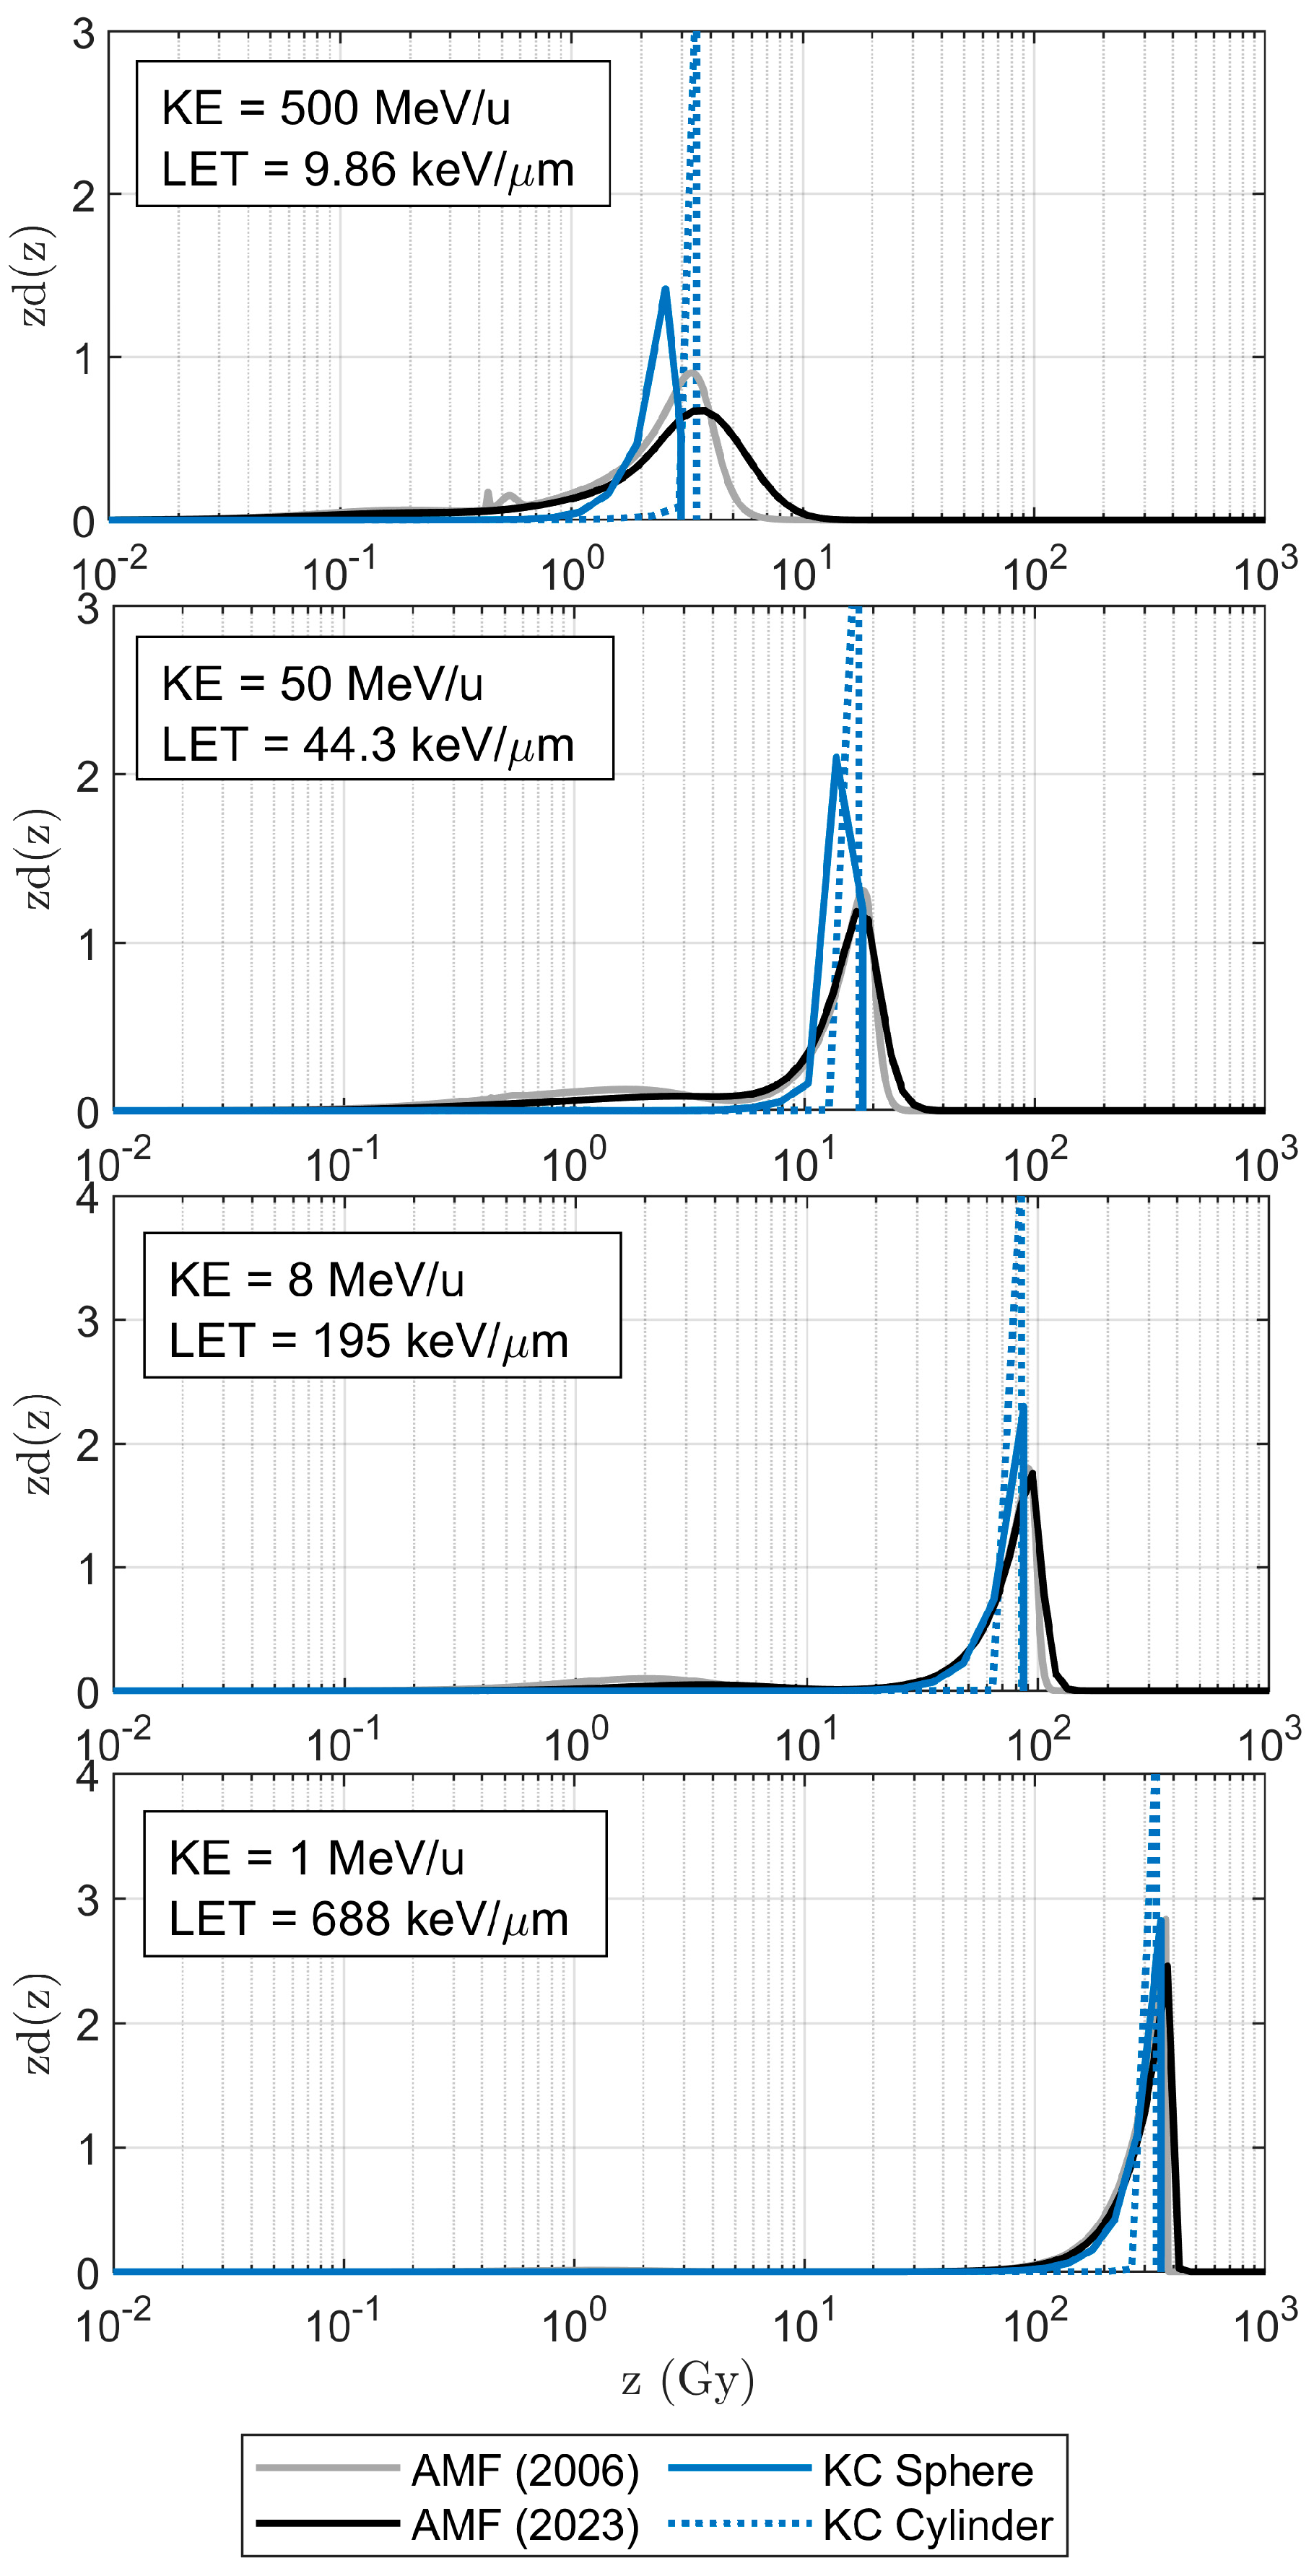
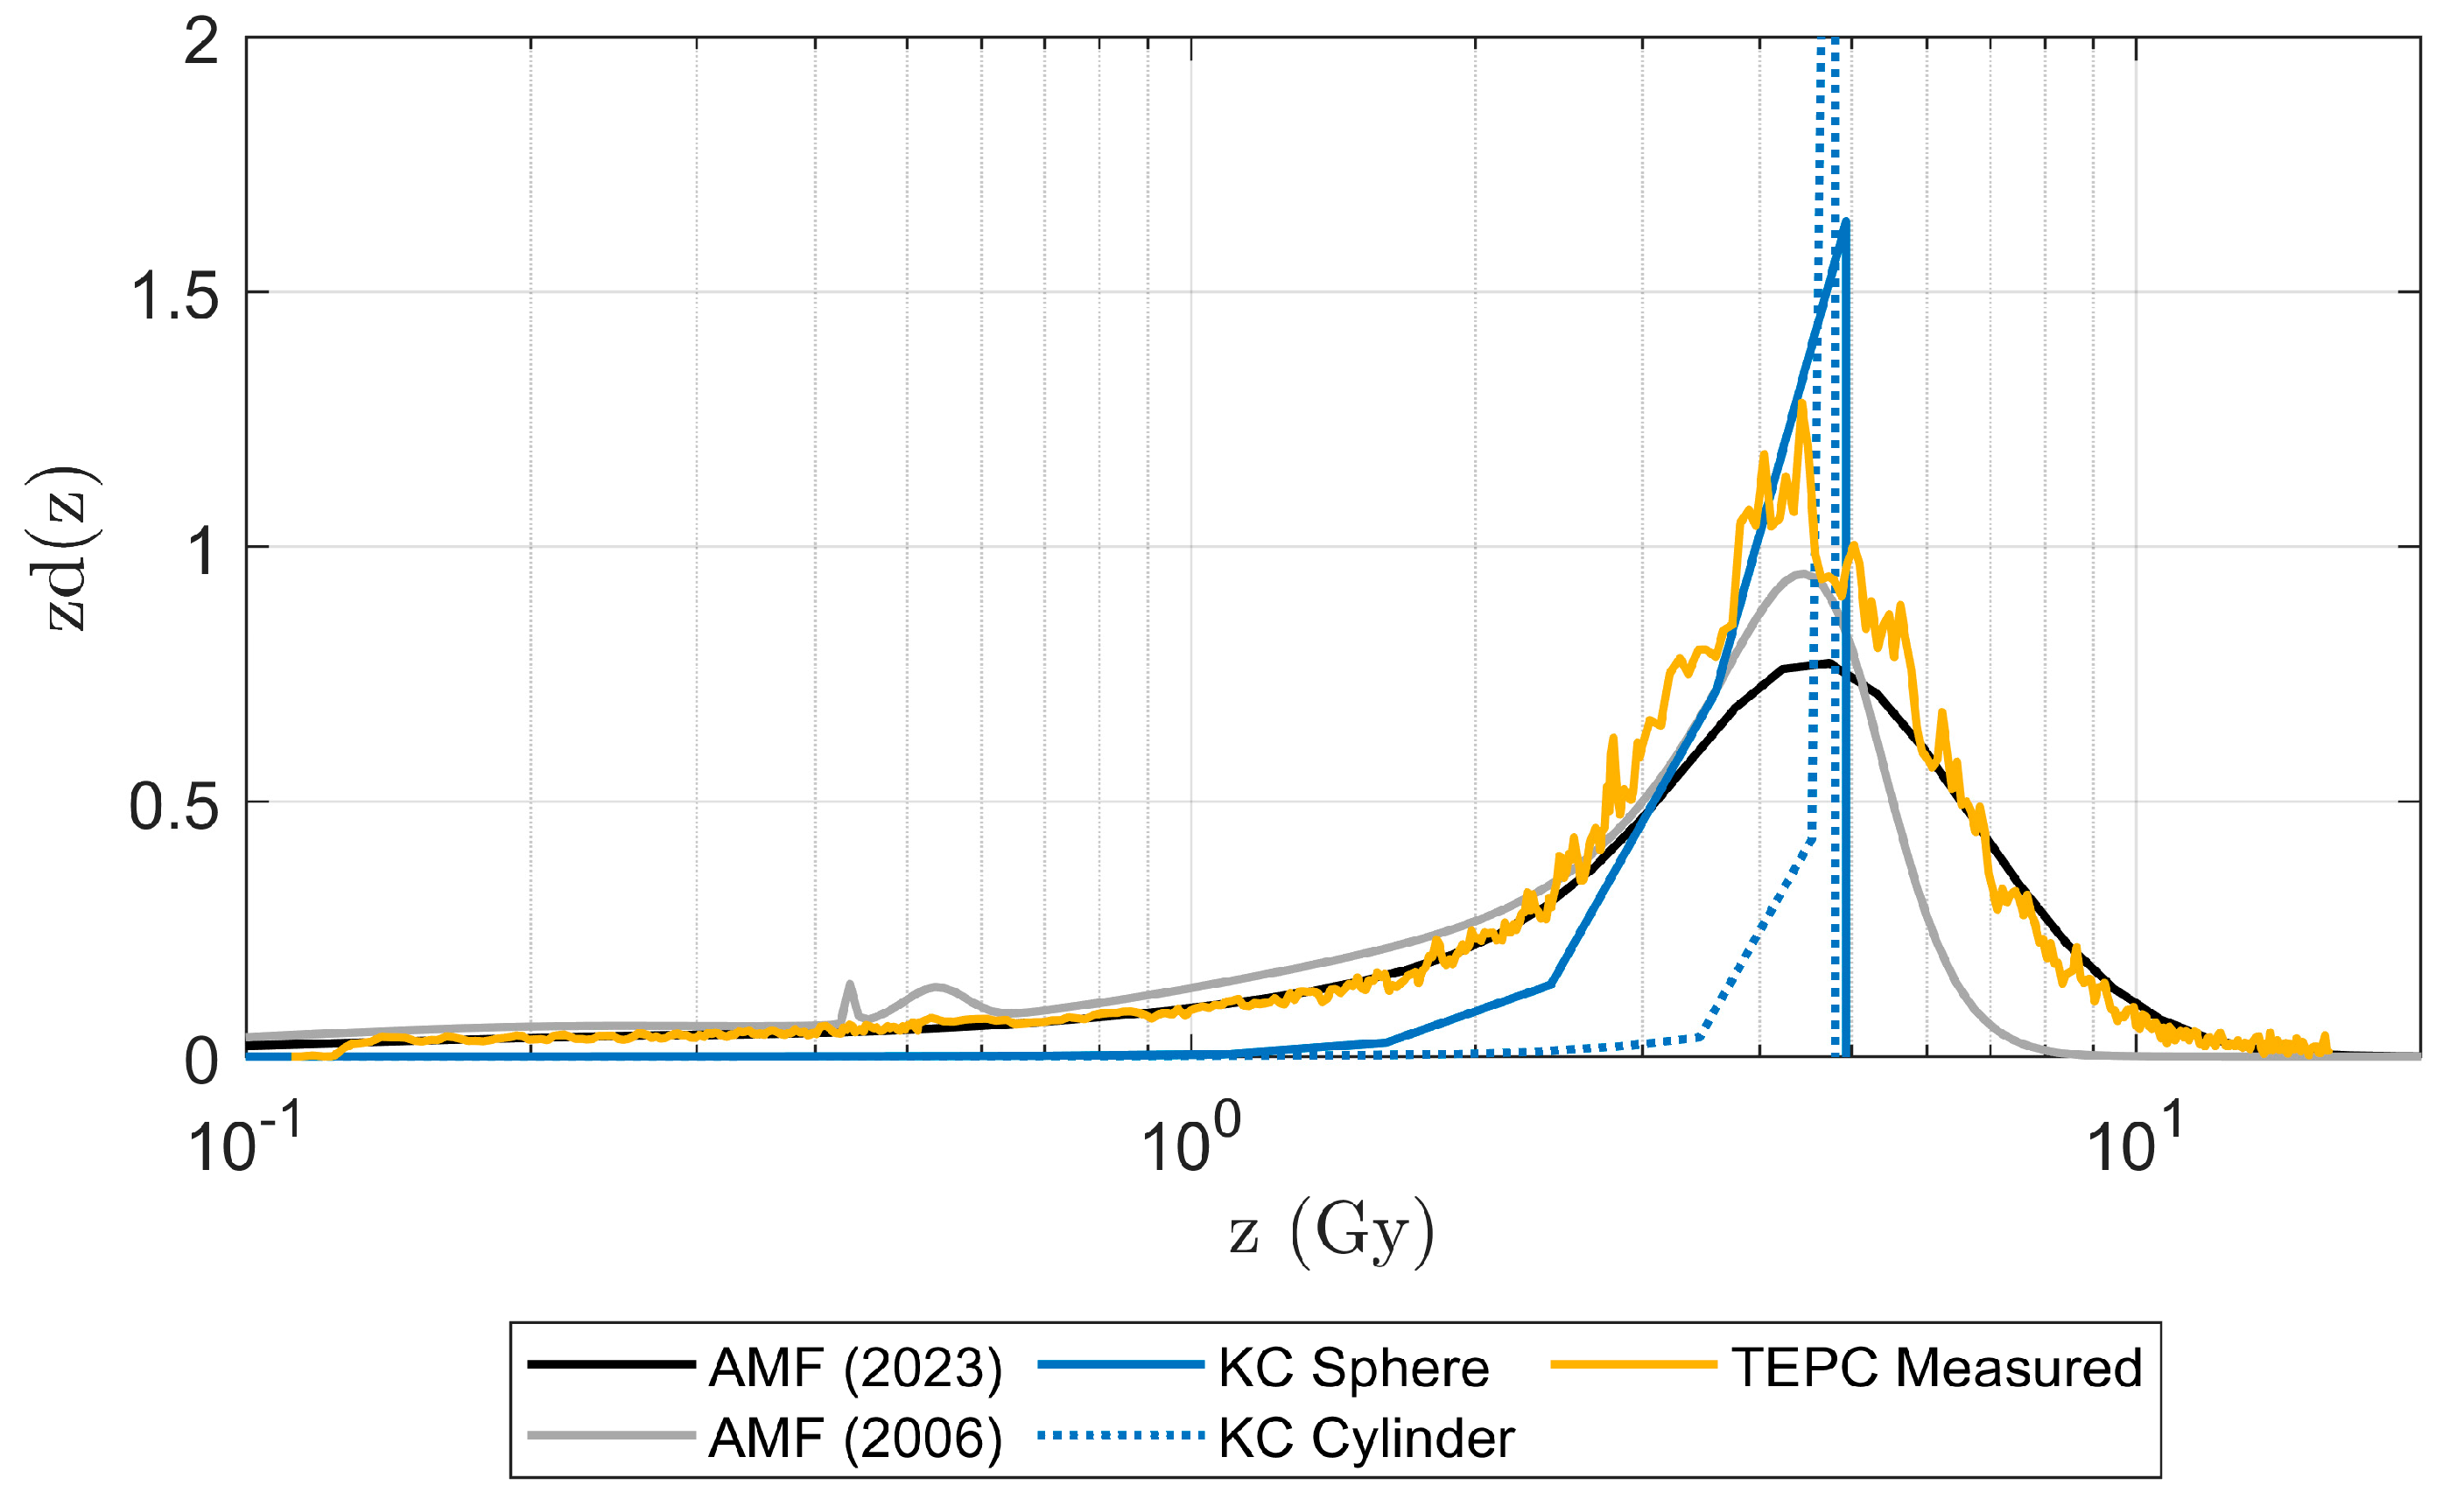
3.1. Impact Parameter and Microdosimetric Spectra
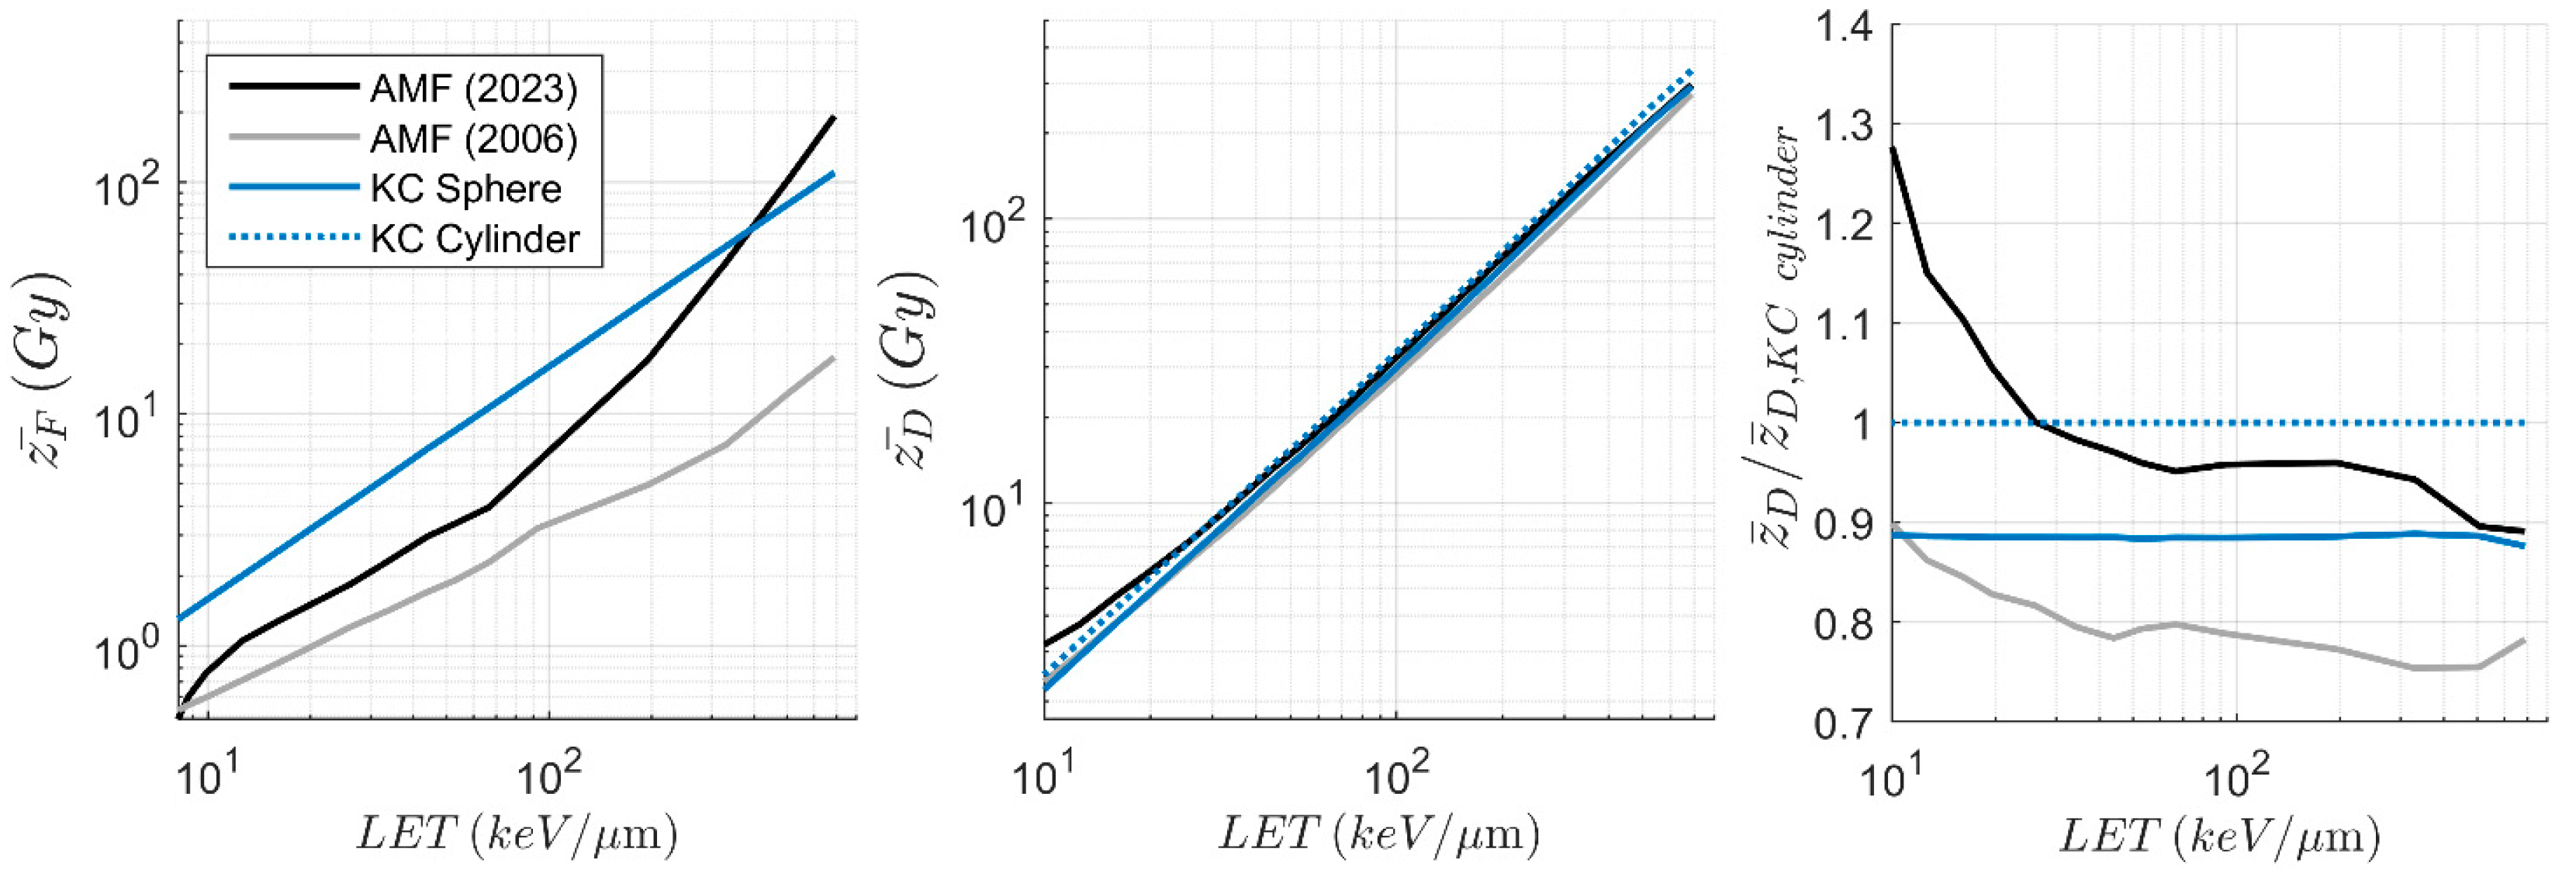
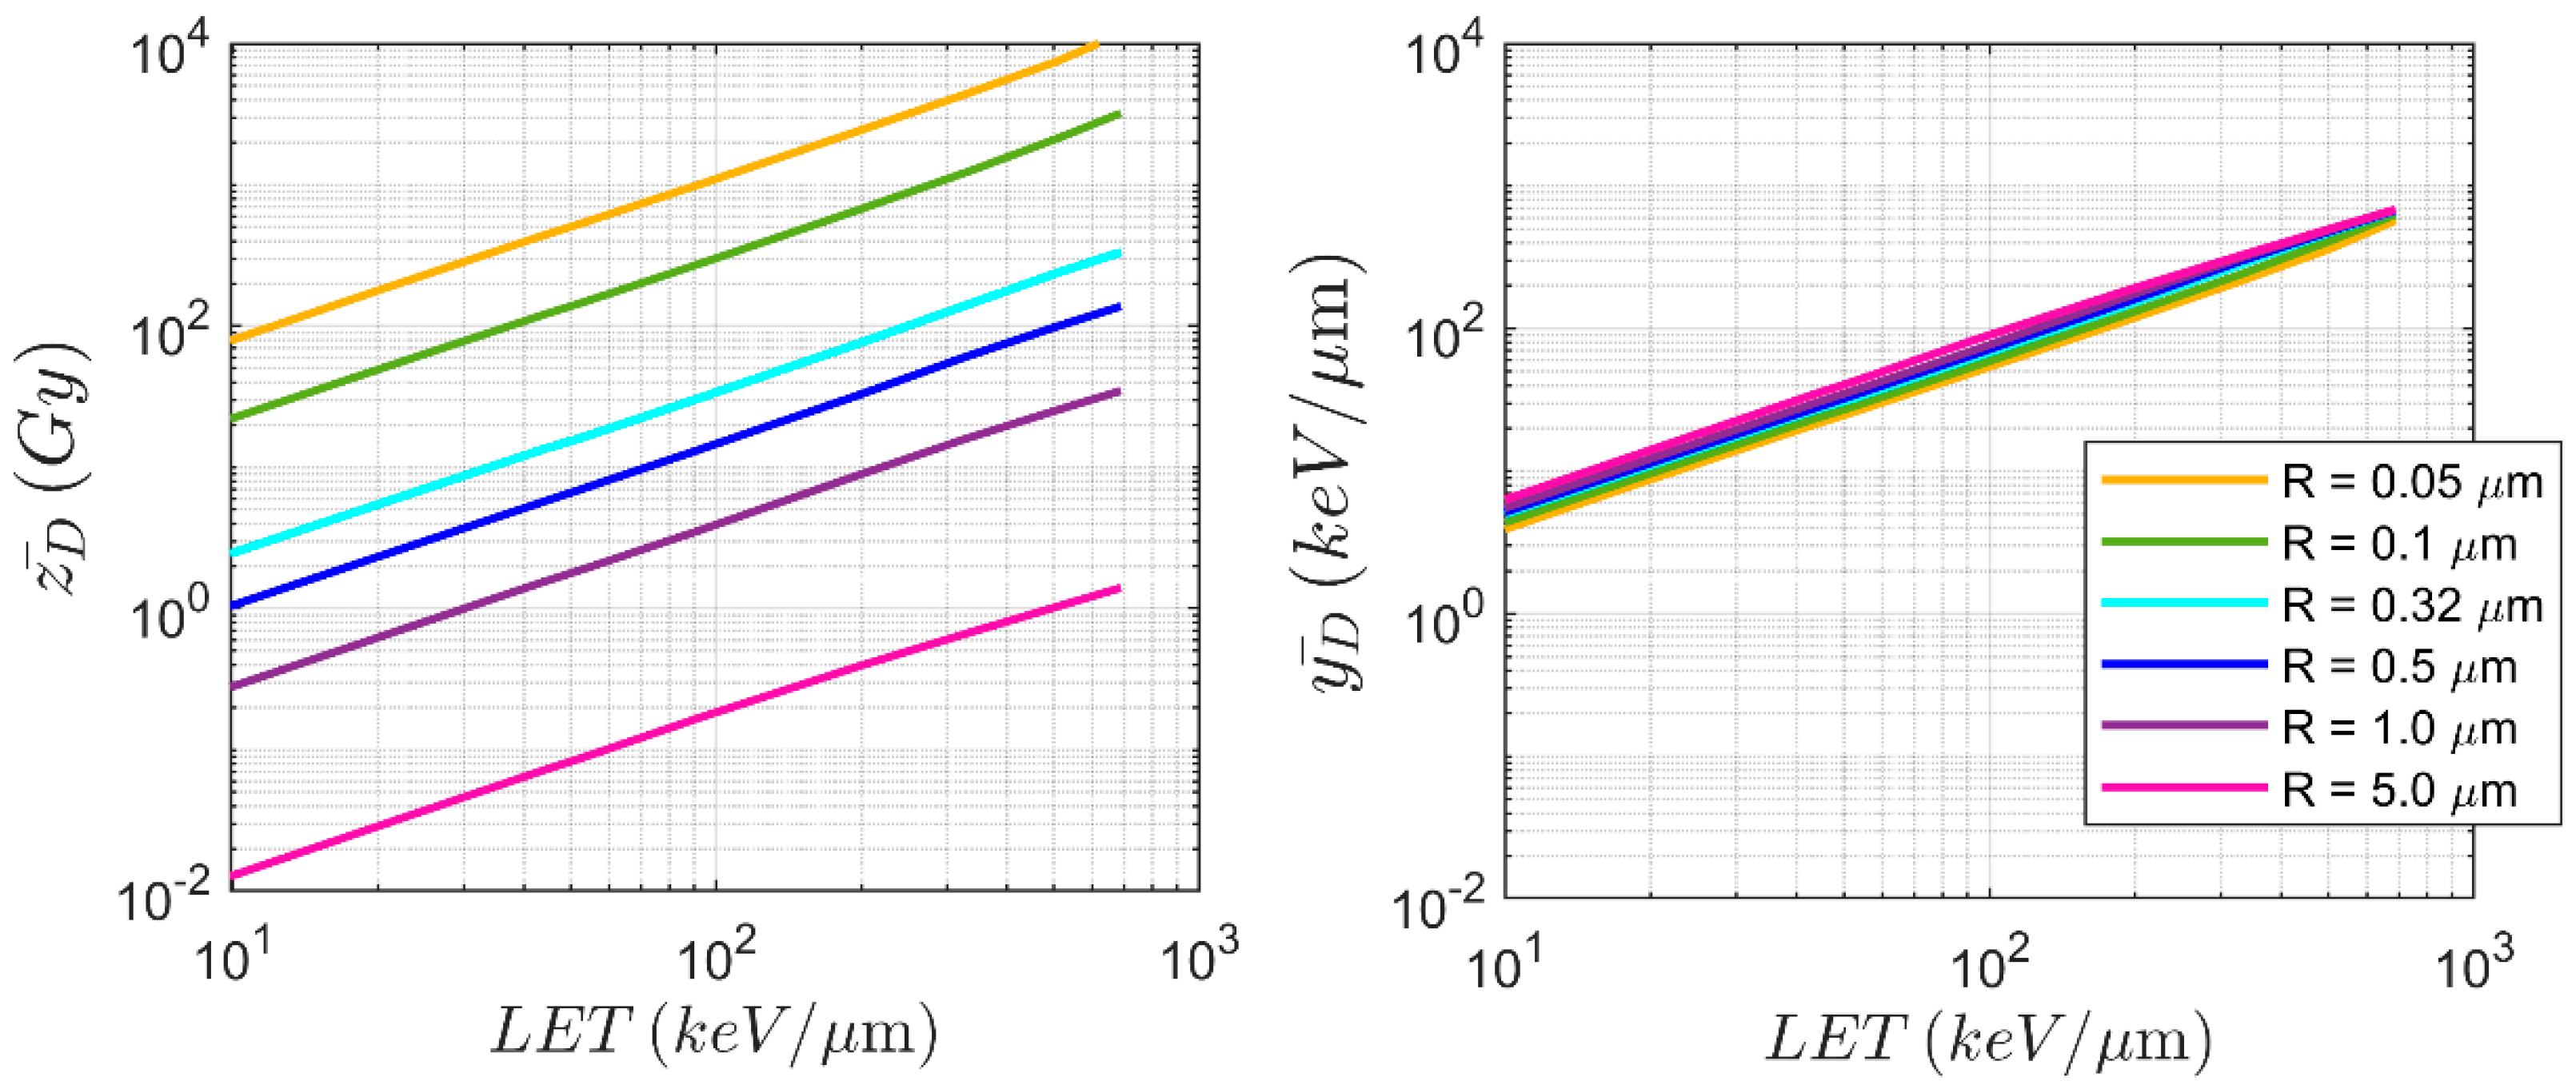
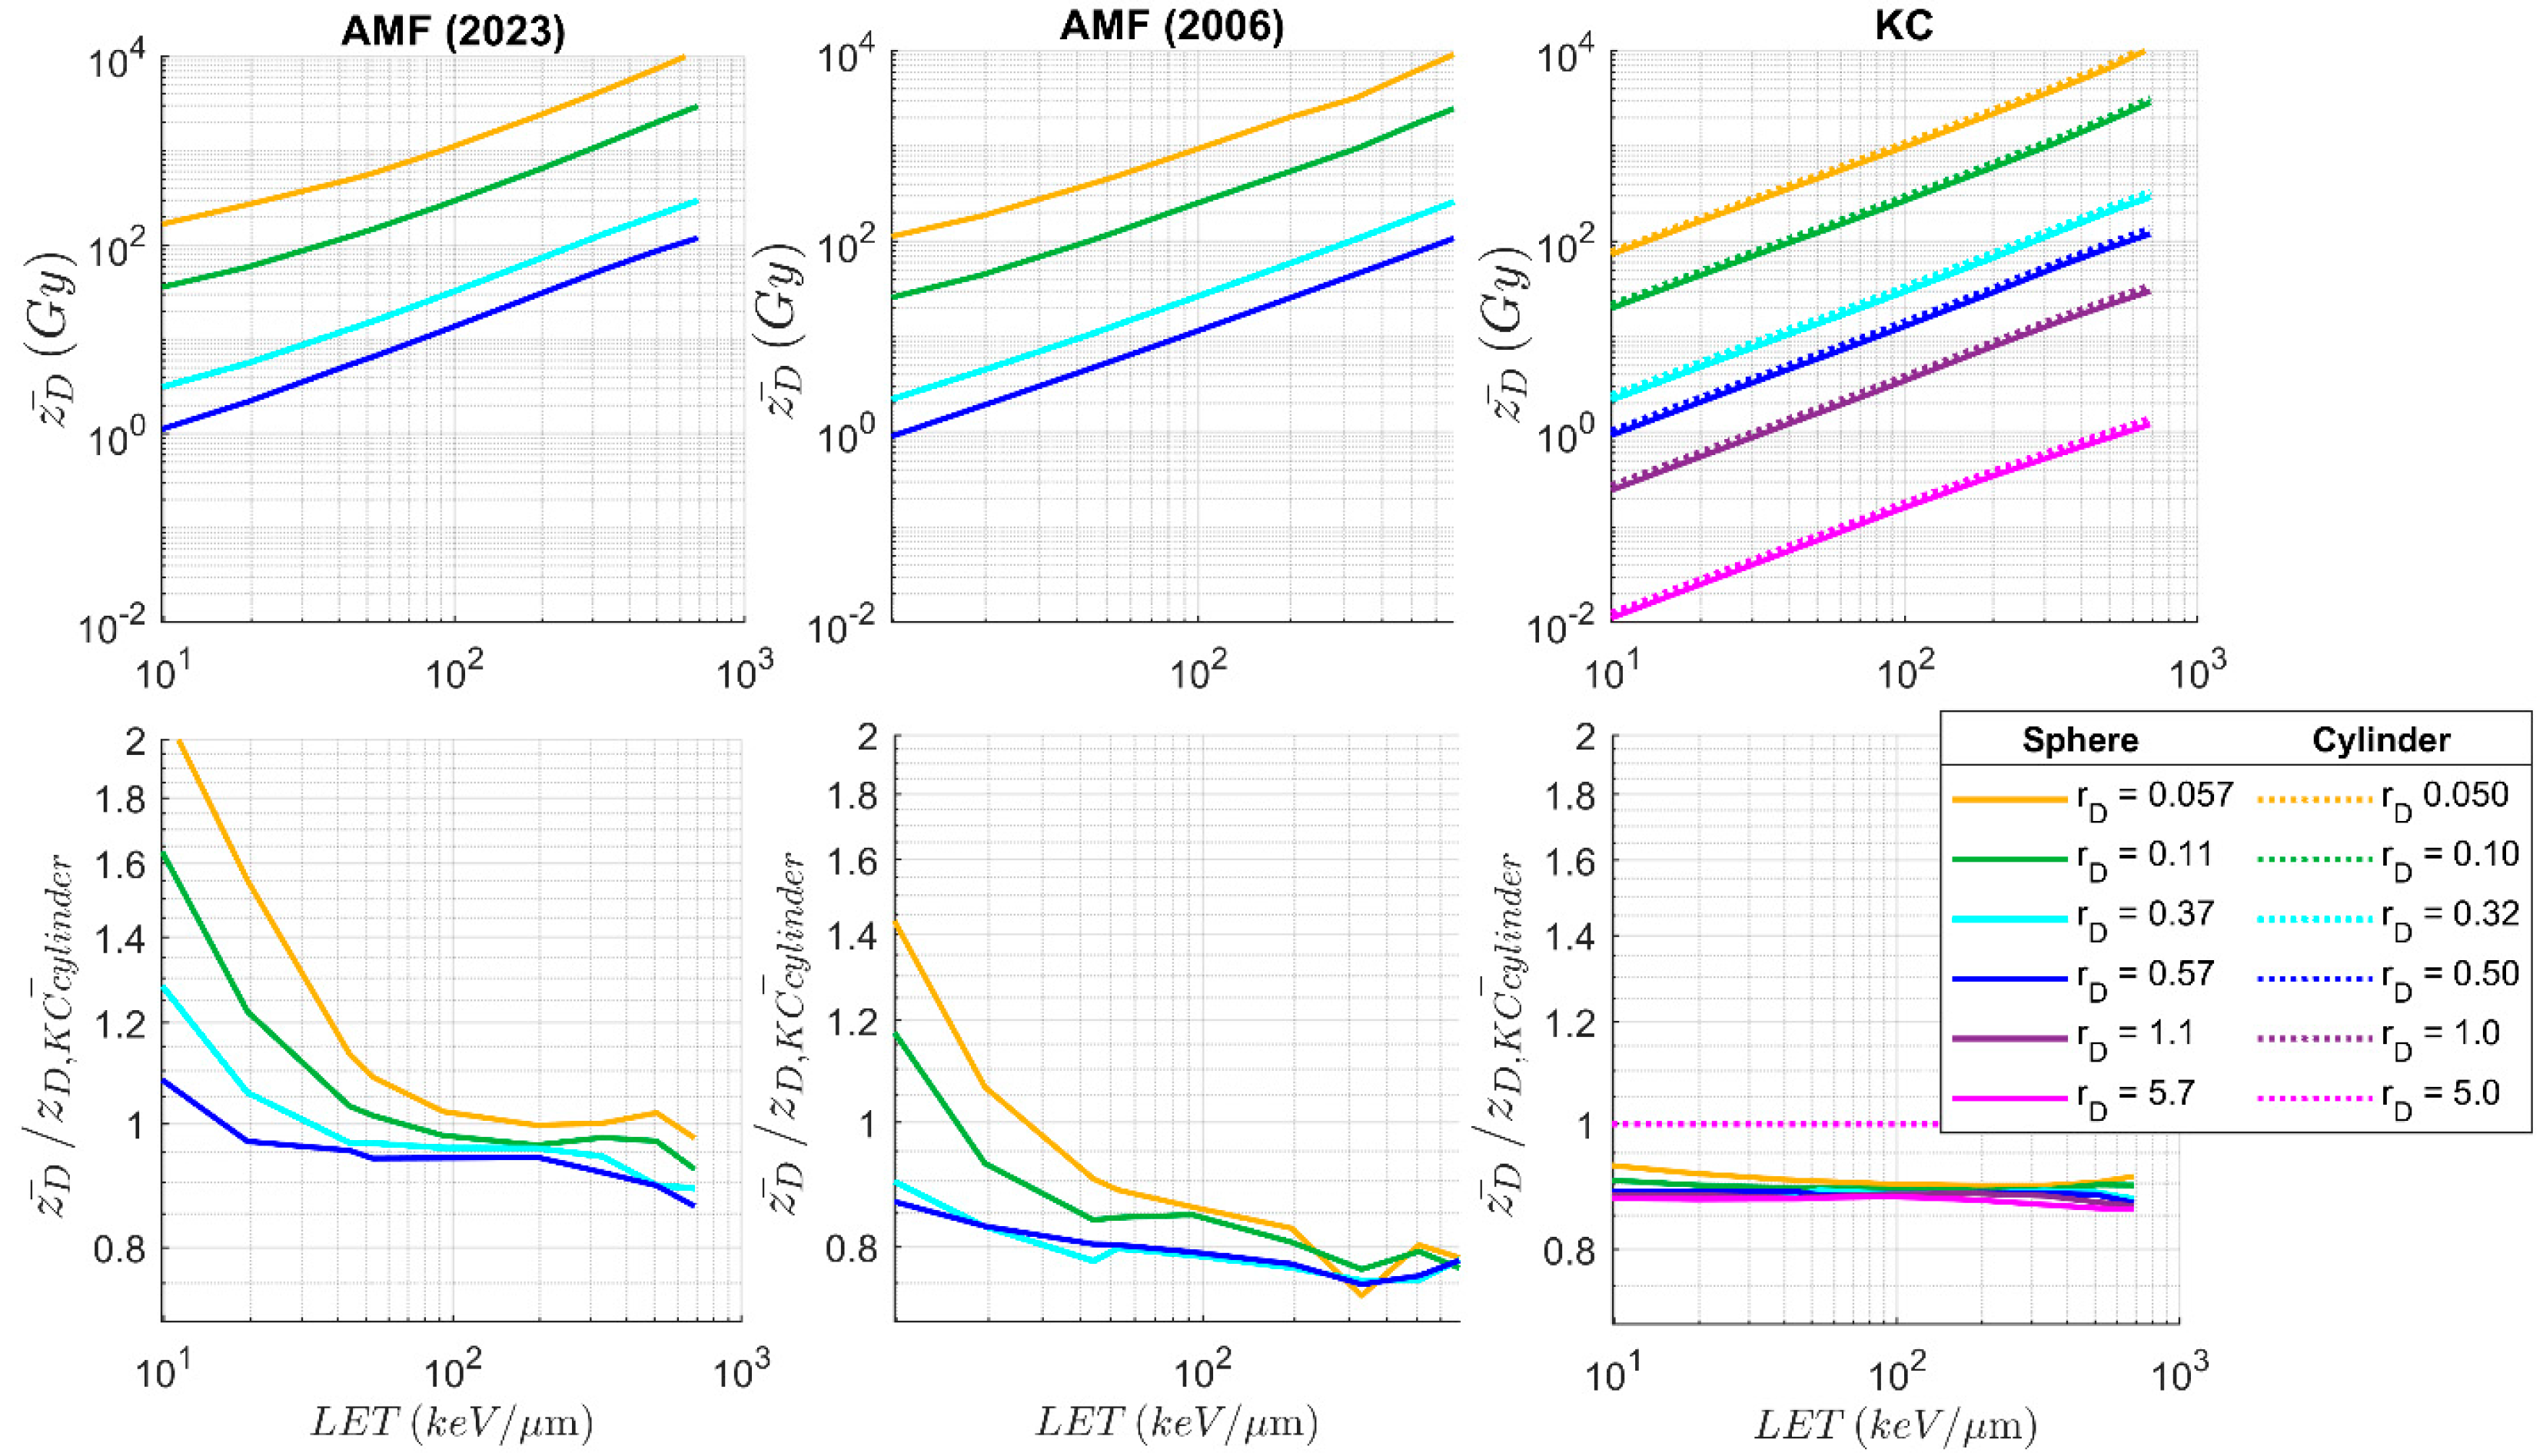
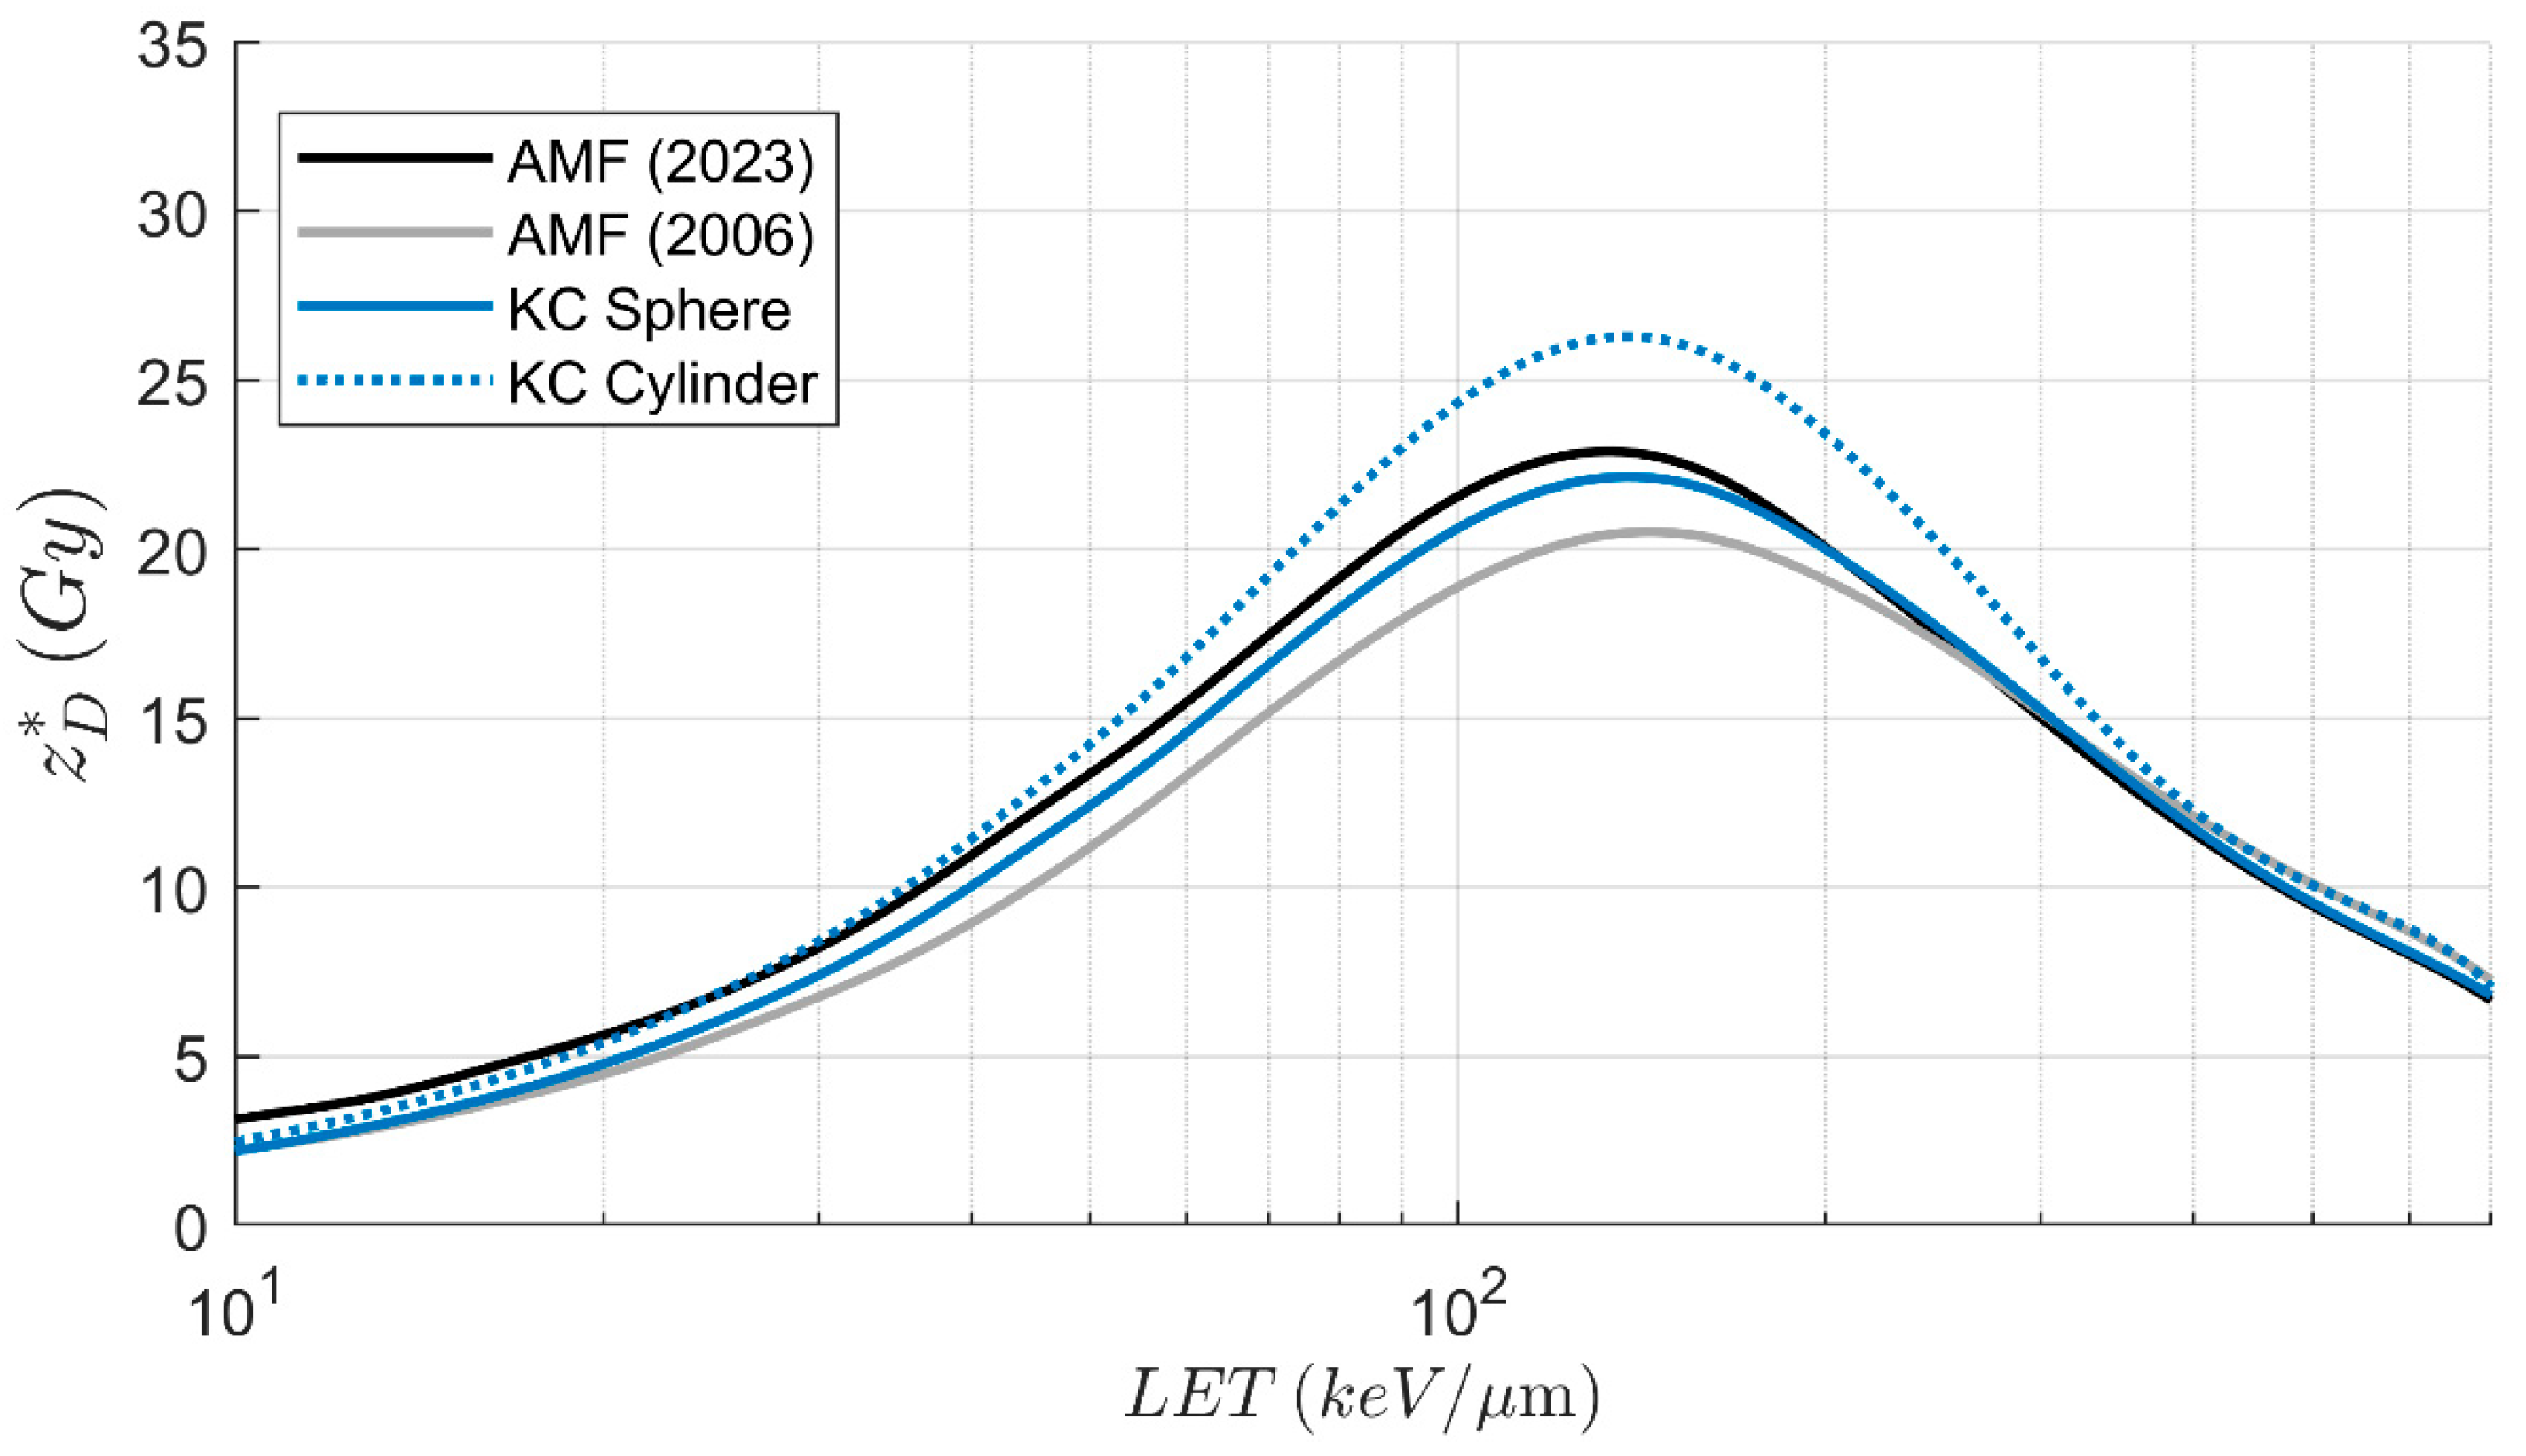
3.2. Deterministic Microdosimetric Parameters
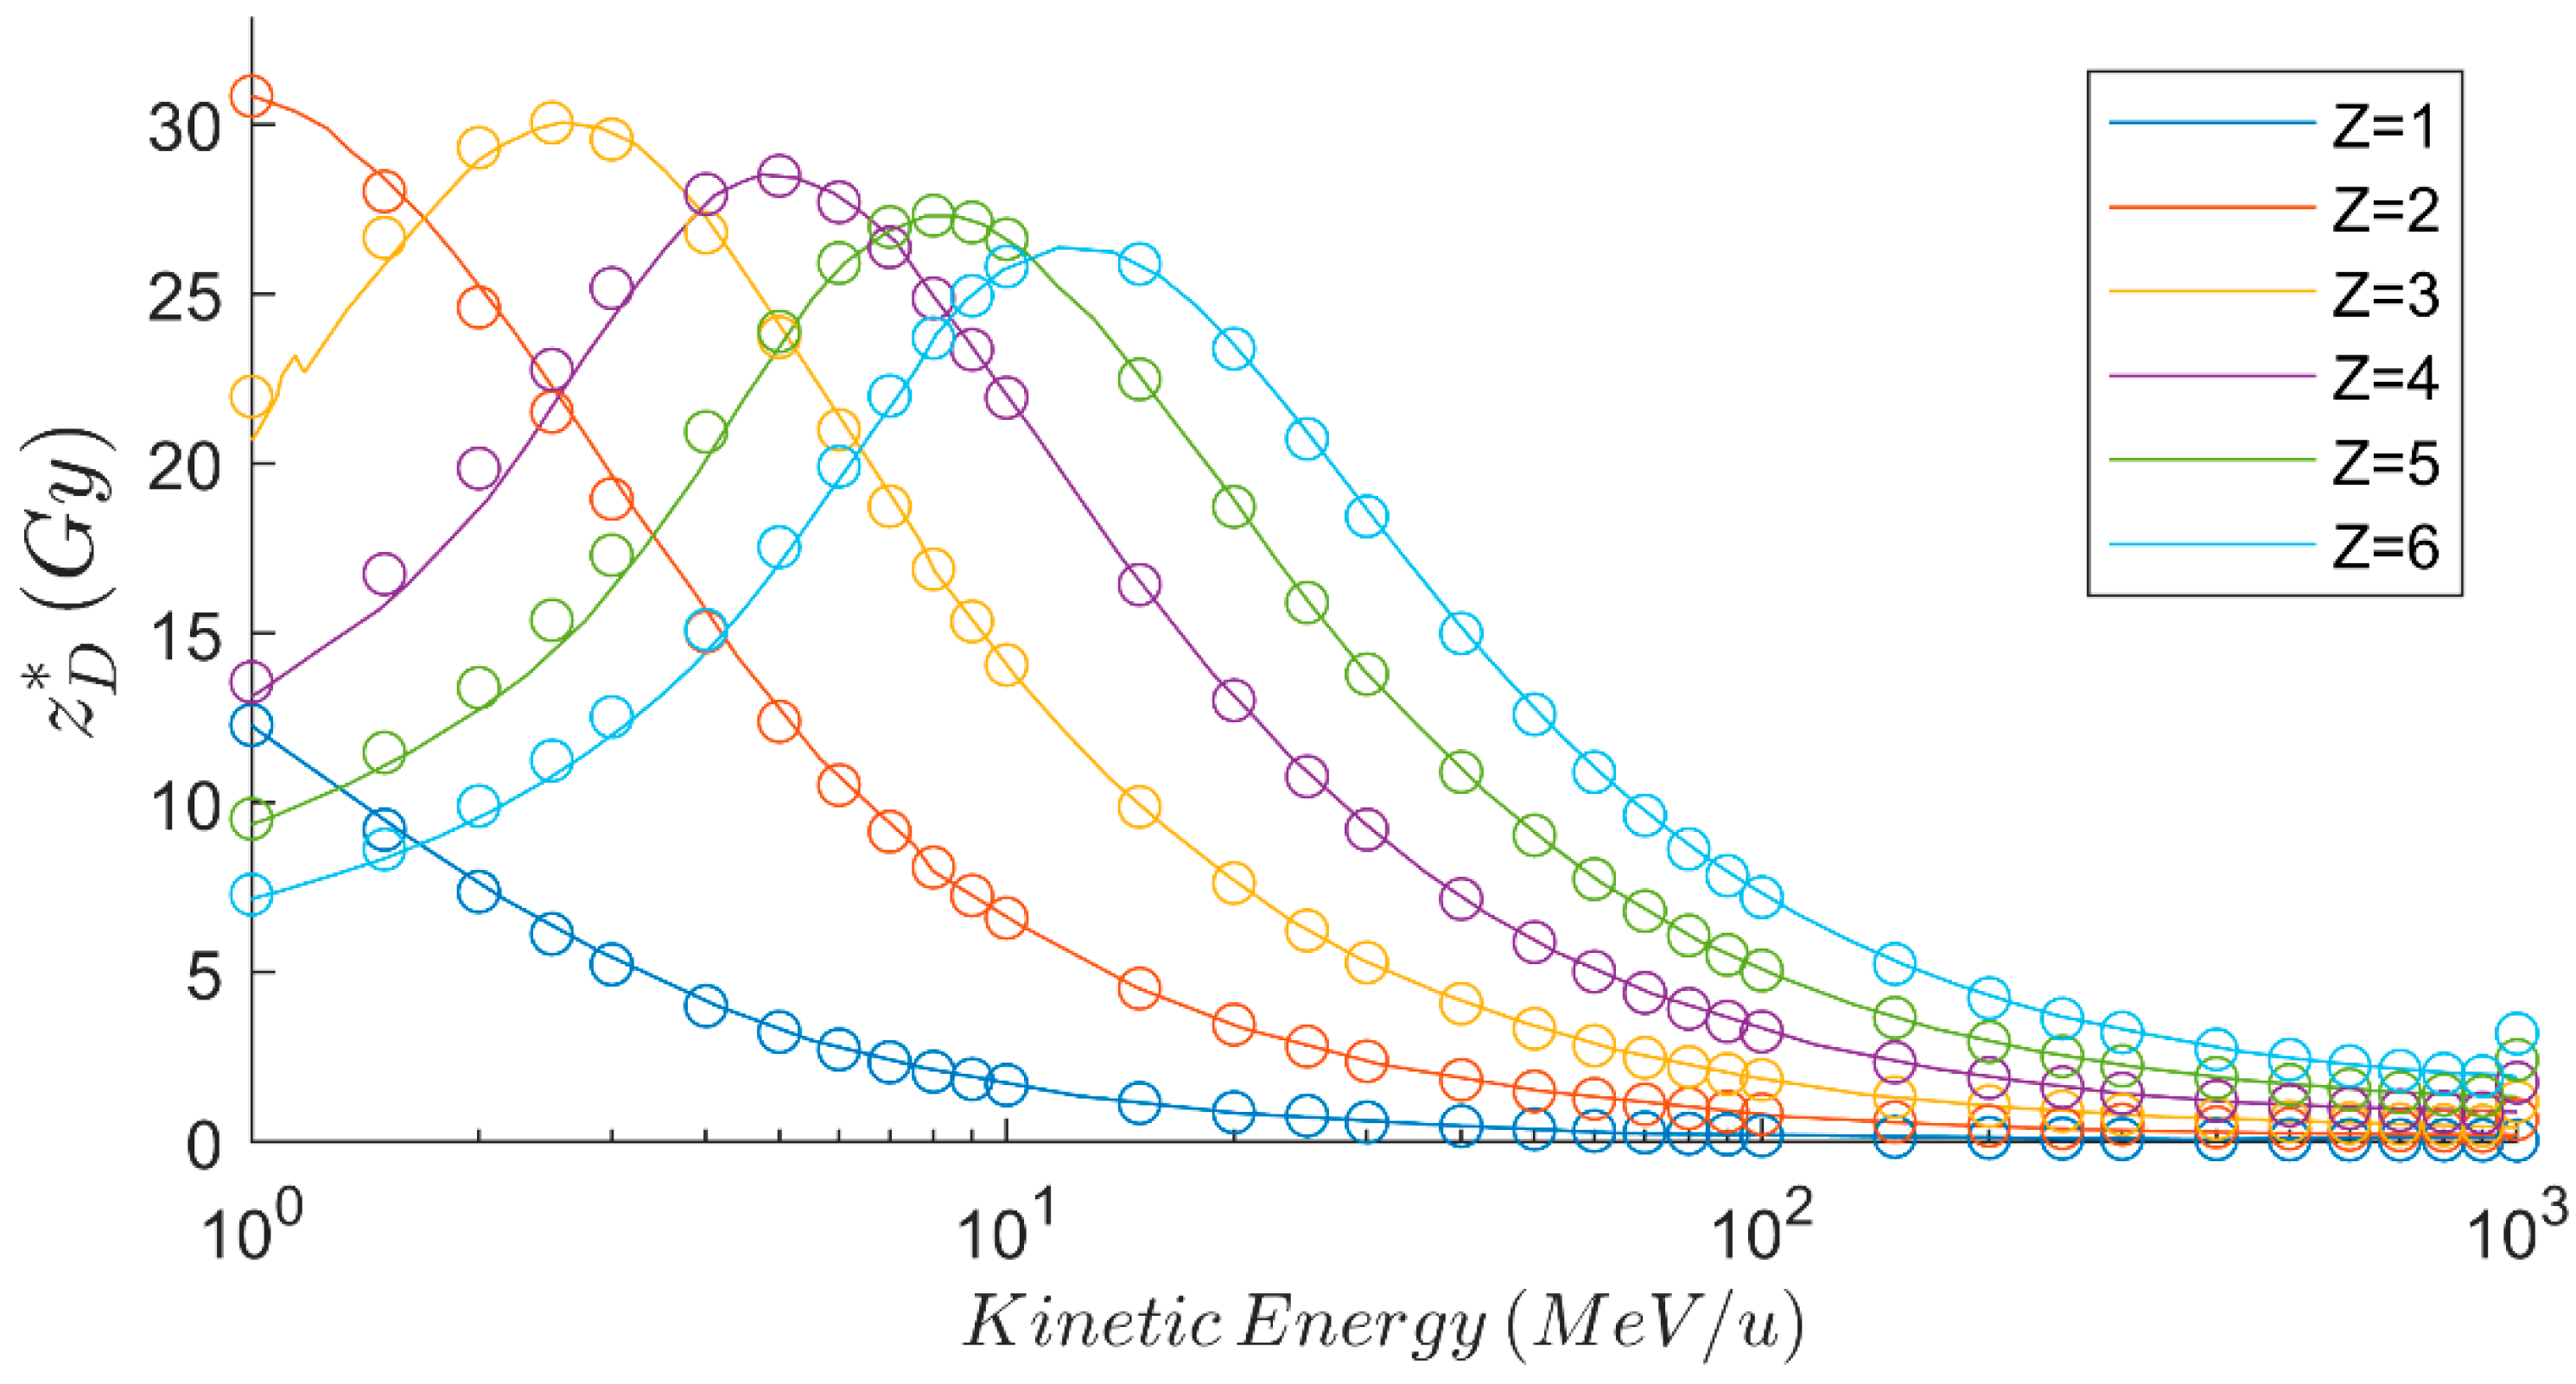
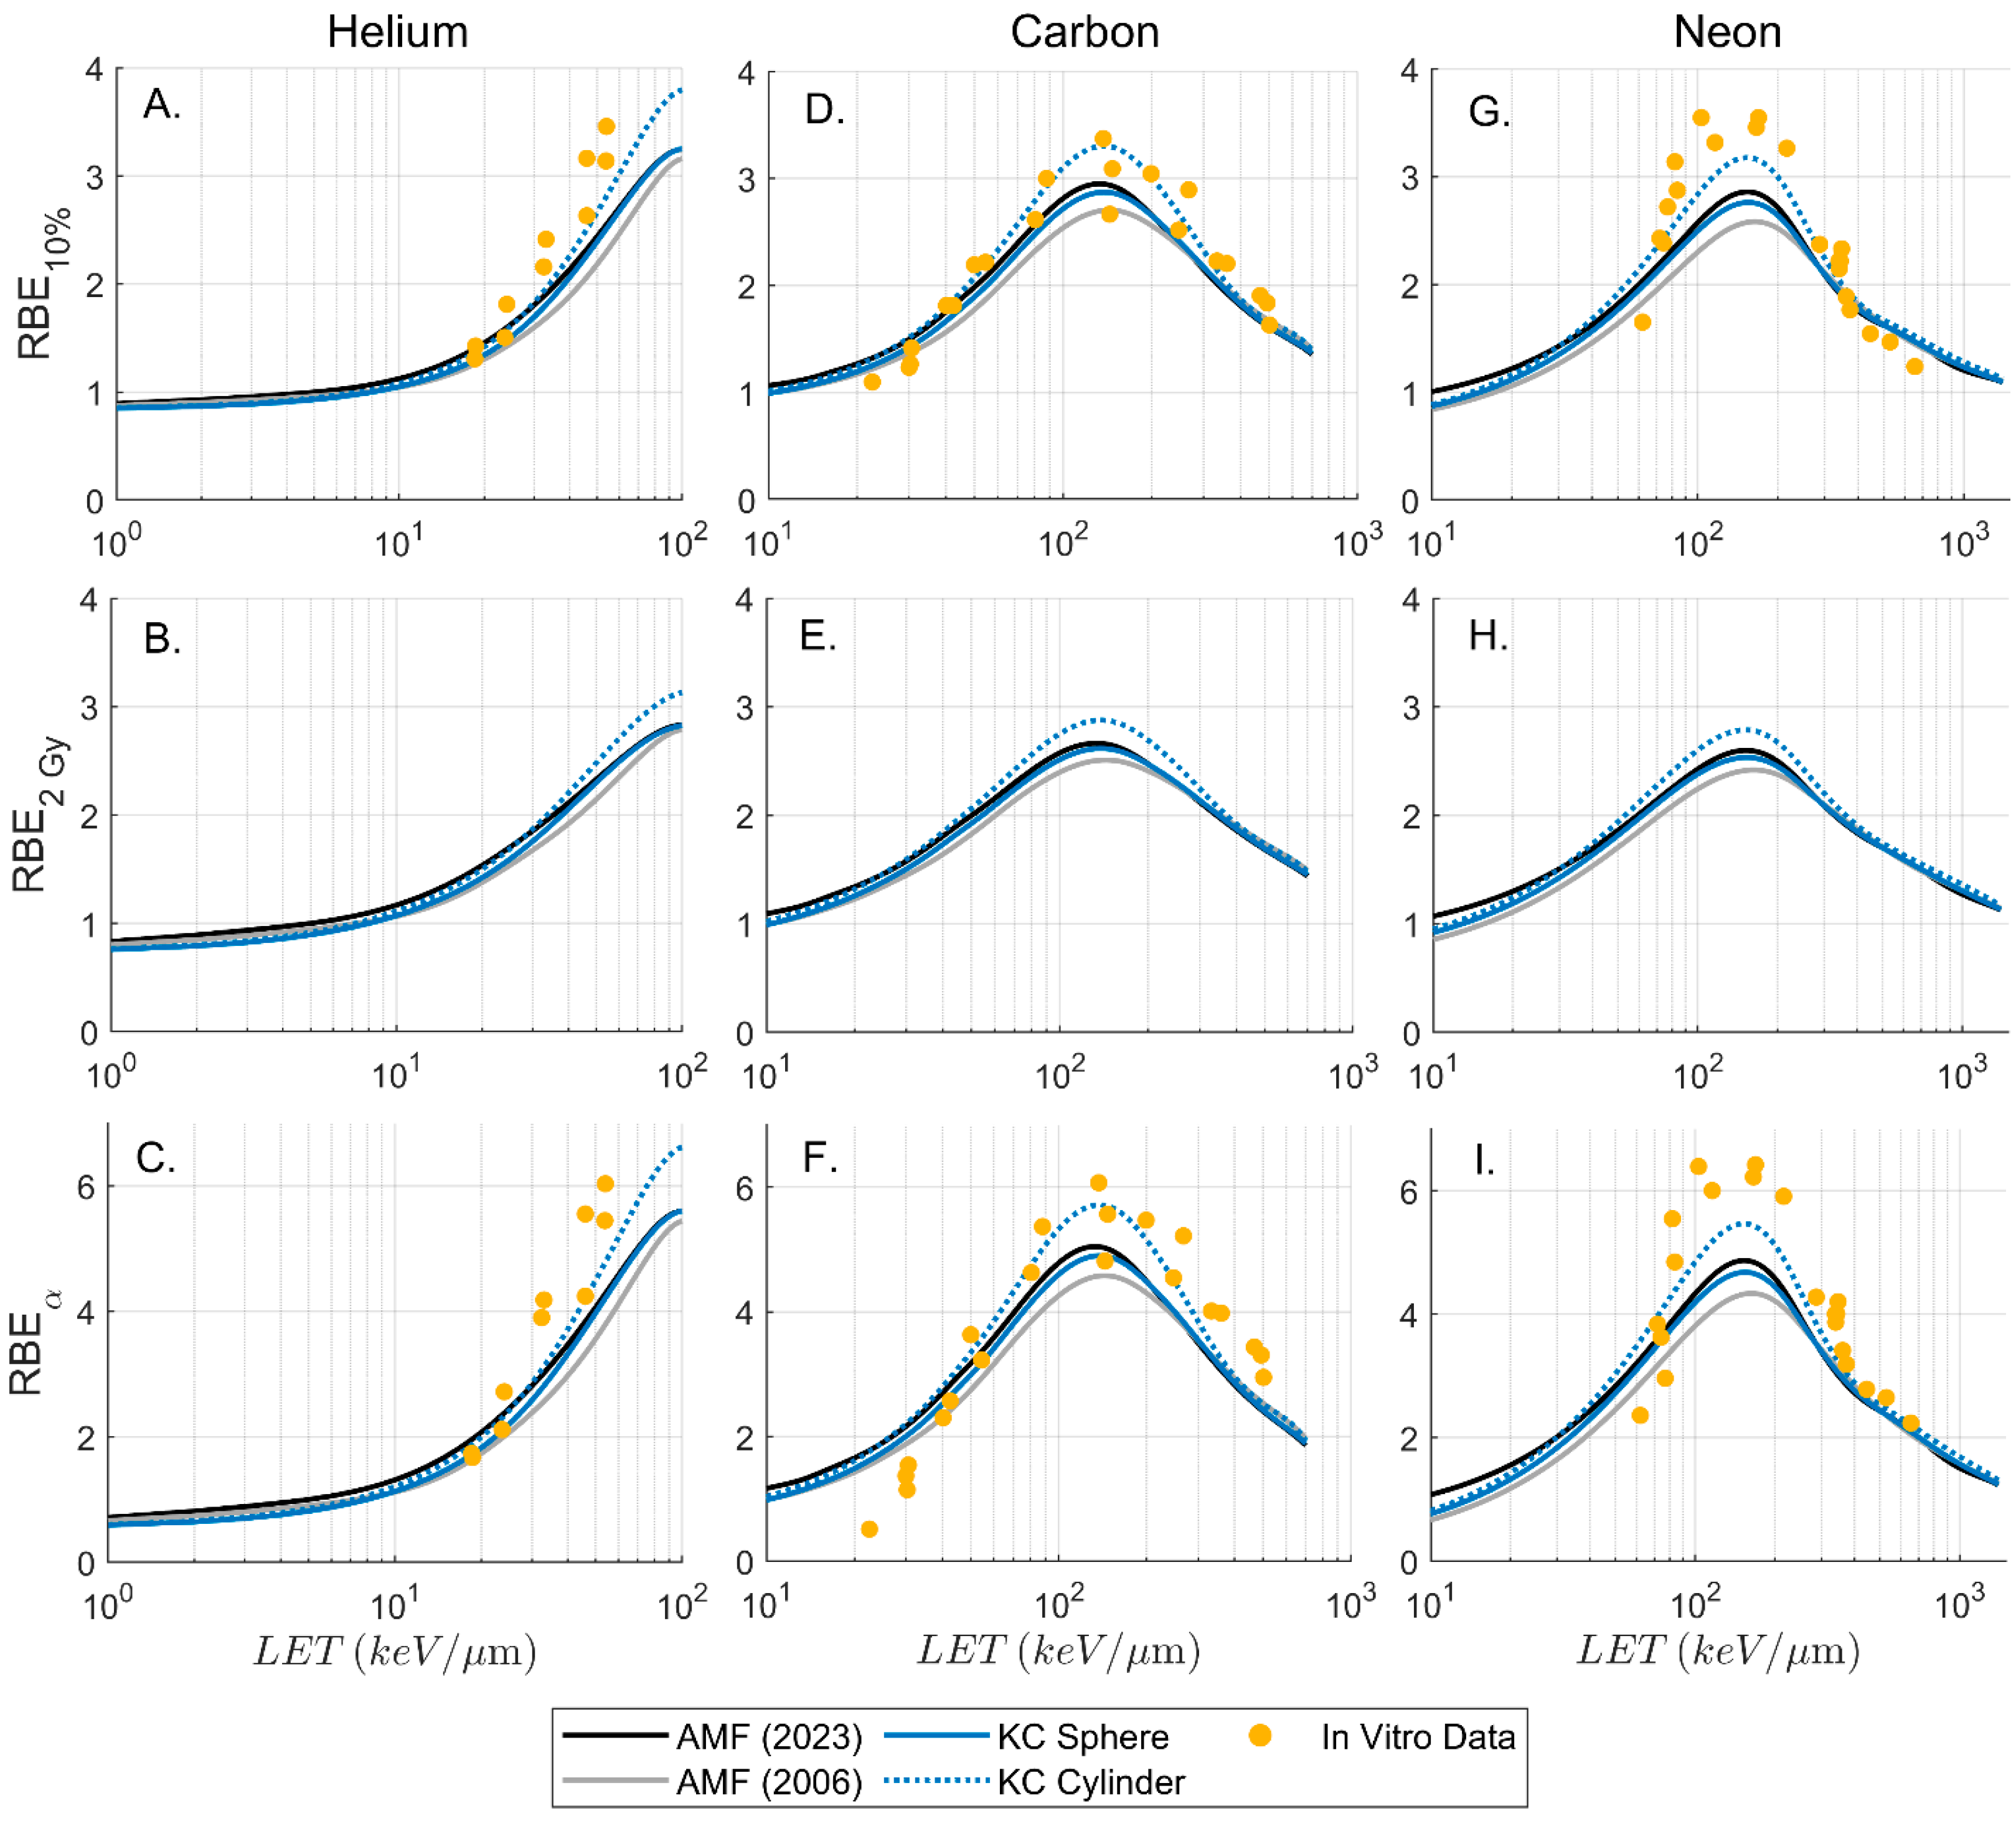
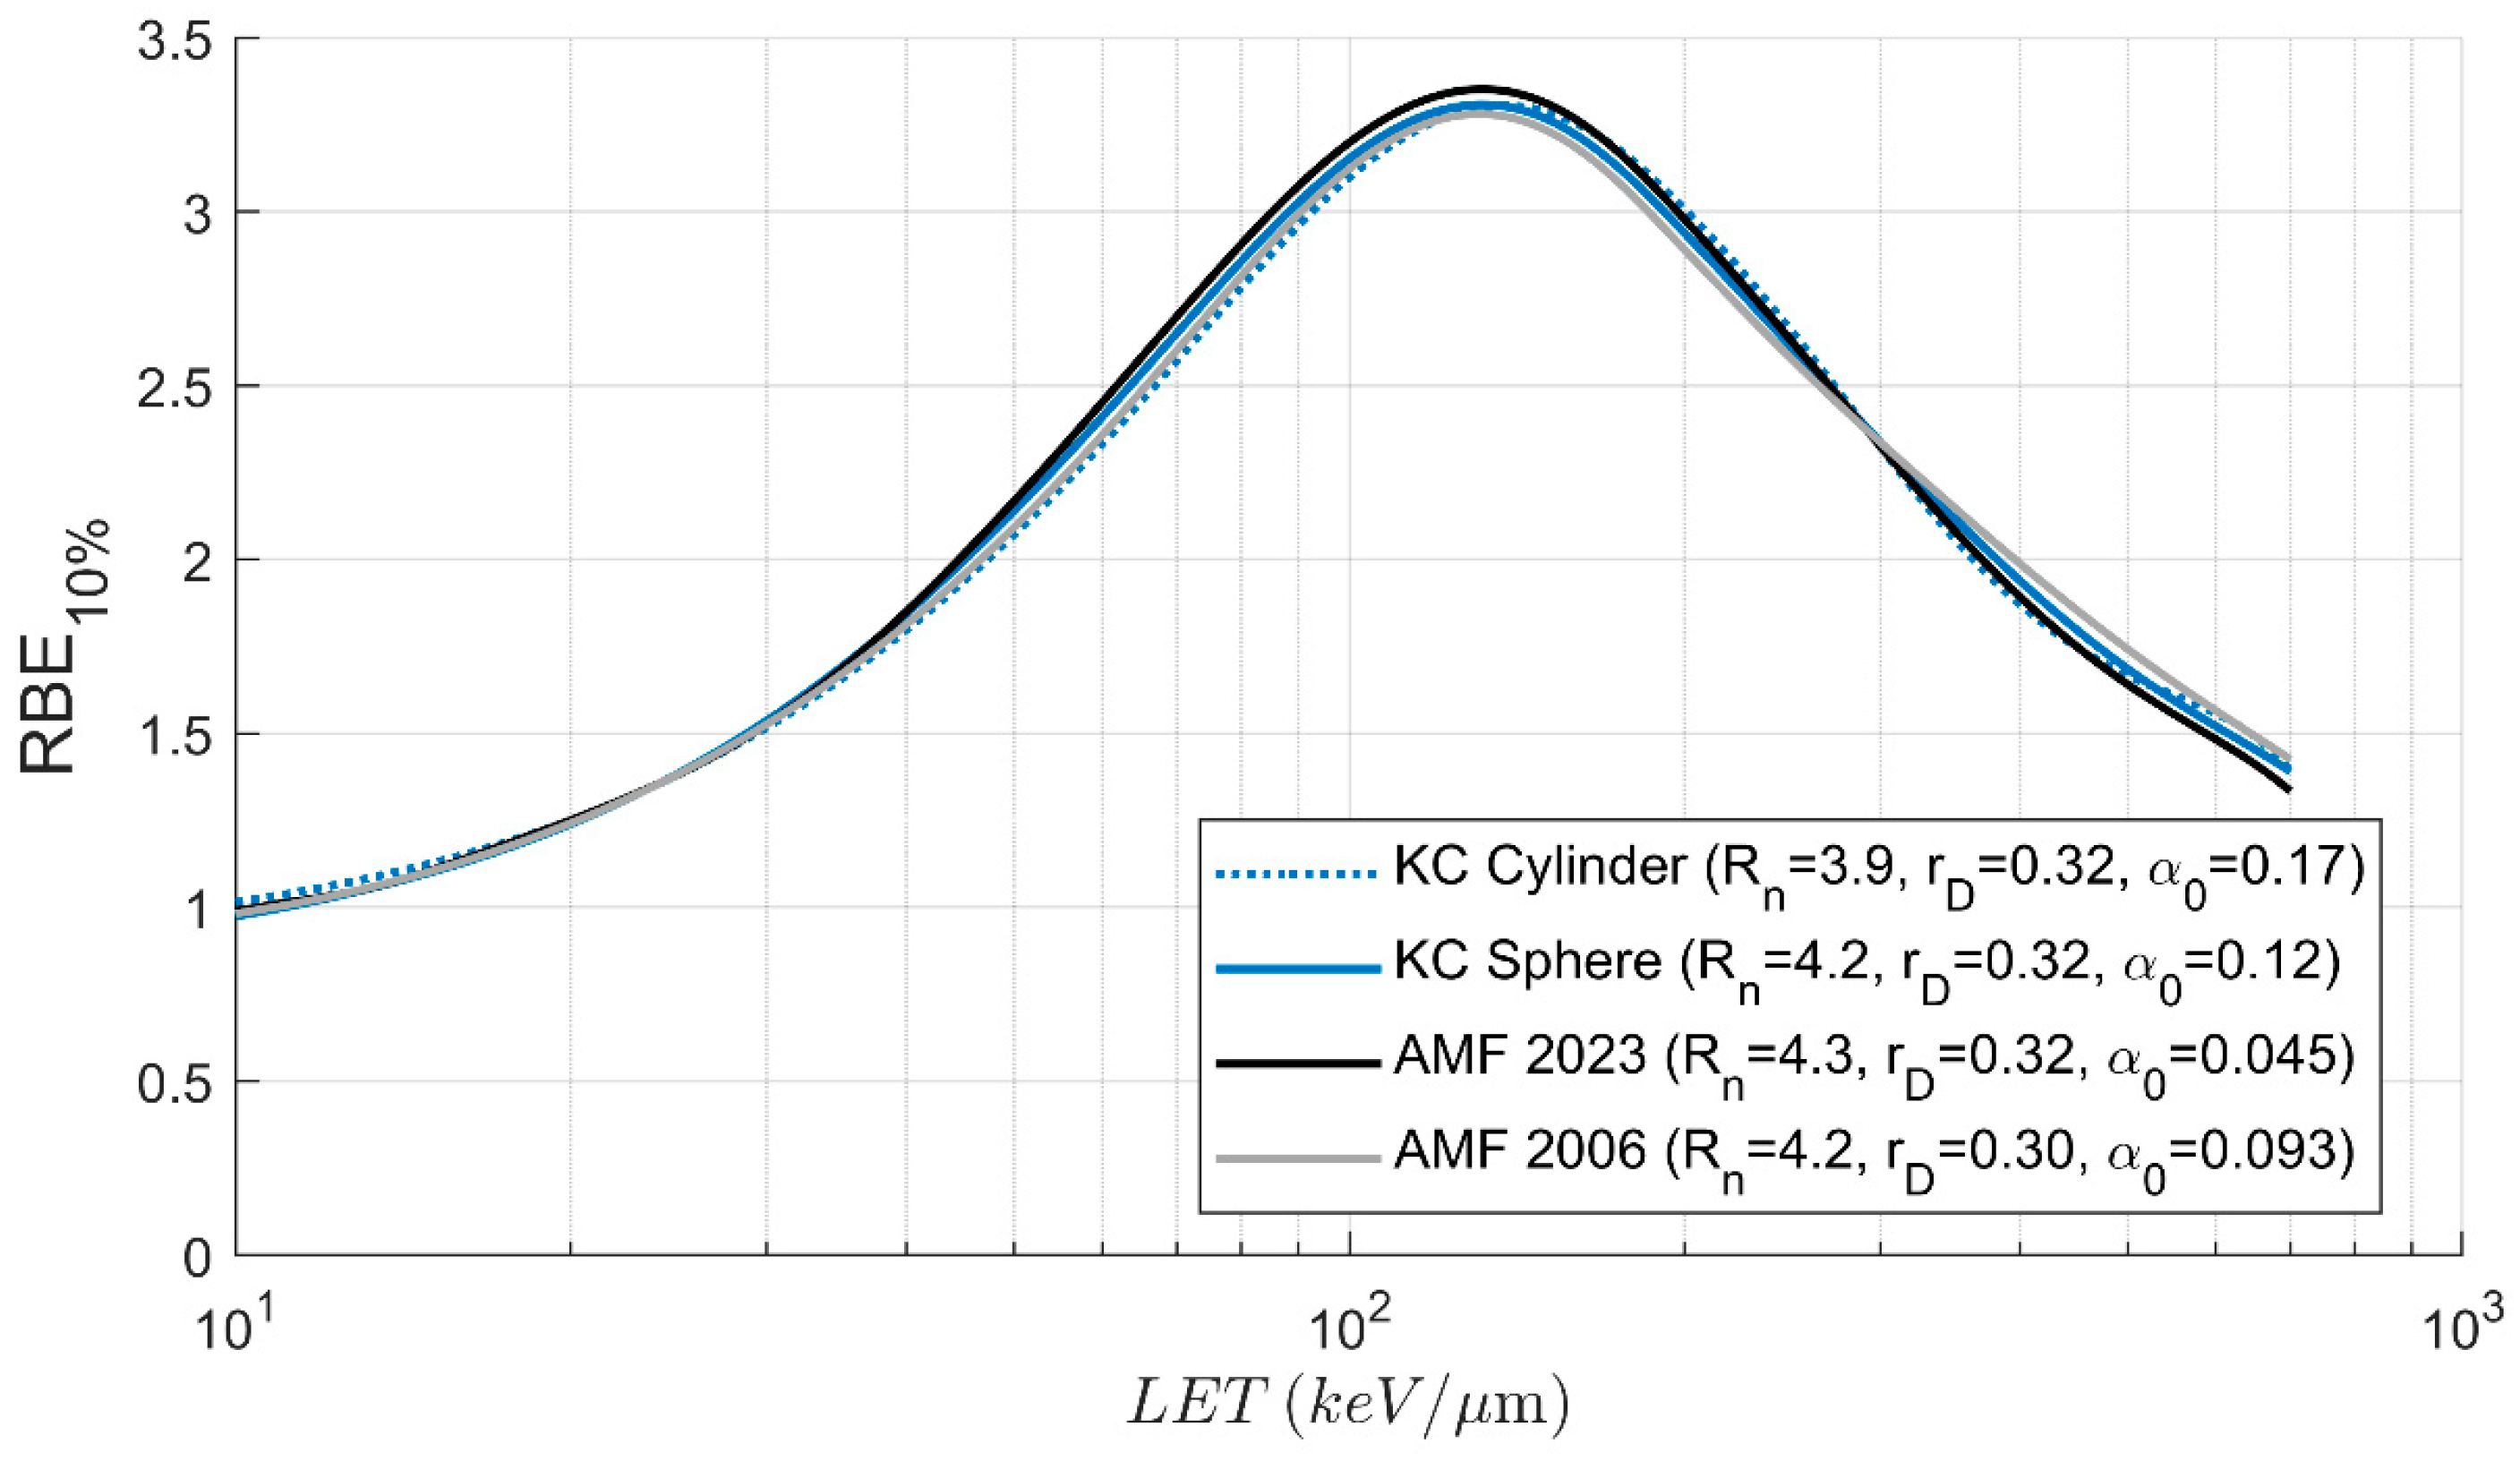
3.3. Biologic Parameters and RBE
4. Discussion
5. Conclusions
Author Contributions
Funding
Institutional Review Board Statement
Informed Consent Statement
Data Availability Statement
Conflicts of Interest
Abbreviations
| Linear term of the linear quadratic model of cell survival | |
| Linear term of the linear quadratic model of cell survival in the case where linear energy transfer approaches 0 | |
| AMF | Analytical microdosimetric function |
| Quadratic term of the linear quadratic model of cell survival | |
| CIRT | Carbon ion radiotherapy |
| DG | Domain geometry |
| HSG | Human salivary gland |
| KC | Kiefer–Chatterjee track structure model |
| LET | Linear energy transfer |
| MF | Microdosimetric function |
| mMKM | Modified microdosimetric kinetic model |
| PHITS | Particle and heavy ion transport code system |
| RBE | Relative biological effectiveness |
| RBEmMKM | Relative biological effectiveness calculated using the modified microdosimetric kinetic model |
| RBEα | Relative biological effectiveness calculated for low doses |
| RBE10% | Relative biological effectiveness calculated for a surviving fraction of 10% |
| RBE2Gy | Relative biological effectiveness calculated for a physical dose of 2 Gy |
| Radius of a subnuclear domain | |
| Radius of a cell nucleus | |
| TEPC | Tissue-equivalent proportional counter |
| Dose-mean lineal energy | |
| Frequency-mean specific energy | |
| Dose-mean specific energy | |
| Saturation-corrected dose-mean specific energy |
Appendix A
Appendix A.1. Implementing KC as a Microdosimetric Function
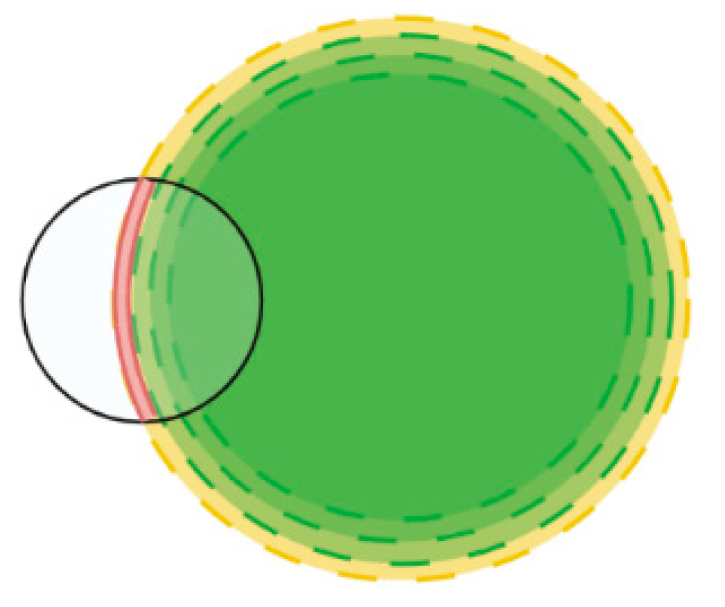
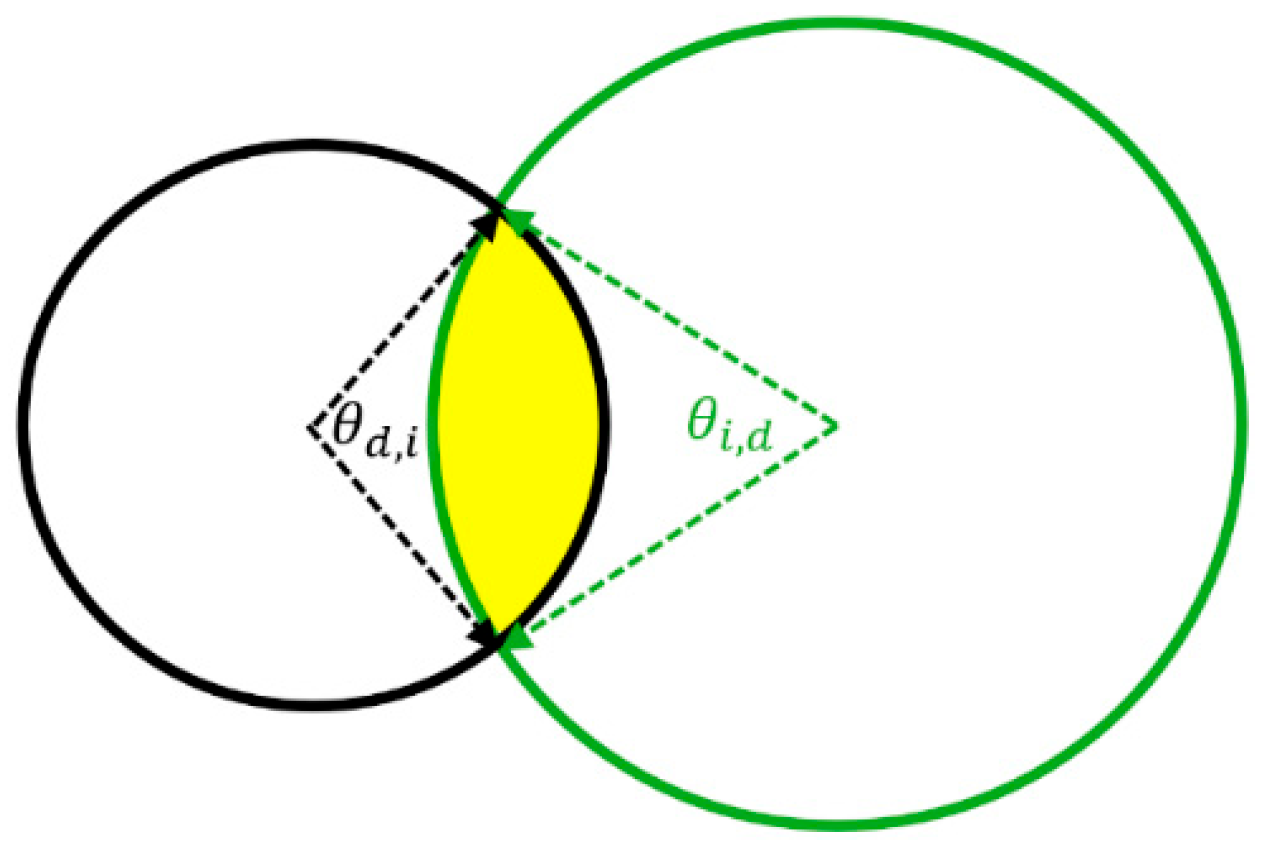
Appendix A.2. Derivation of Overlap of Annulus and Circle


| Scenario | Calculation |
|---|---|
| A, B, G, I | |
| C, D, E | = 0 |
| F | |
| H |
Appendix A.3. Energy Deposition in Domain
Appendix A.4. Calculating Microdosimetric Parameters
Appendix B
| Ion | Energy (MeV/u) | Parameter | AMF (2023) | AMF (2006) | KC Sphere | KC Cylinder |
|---|---|---|---|---|---|---|
| 1H | 3.7 | (Gy) (calculated with Inaniwa 2010 [16] parameters) | 4.68 | 4.21 | 3.79 | 4.26 |
| 4He | 21.6 | 3.91 | 2.85 | 2.92 | 3.30 | |
| 12C | 500 | 3.11 | 2.19 | 2.18 | 2.44 | |
| 1H | 3.7 | (Gy) (calculated with fitted parameters) | 6.23 | 5.28 | 4.88 | 4.26 |
| 4He | 21.6 | 5.19 | 3.5 | 3.77 | 3.30 | |
| 12C | 500 | 4.18 | 2.71 | 2.79 | 2.44 | |
| 1H | 3.7 | RBE10% (calculated with Inaniwa 2010 [16] parameters) | 1.19 | 1.15 | 1.12 | 1.16 |
| 4He | 21.6 | 1.13 | 1.04 | 1.05 | 1.08 | |
| 12C | 500 | 1.06 | 1.00 | 0.99 | 1.01 | |
| 1H | 3.7 | RBE10%(calculated with fitted parameters) | 1.15 | 1.18 | 1.13 | 1.16 |
| 4He | 21.6 | 1.06 | 0.995 | 1.04 | 1.08 | |
| 12C | 500 | 0.987 | 0.979 | 0.971 | 1.01 |
References
- ICRU. Microdosimetry. ICRU Report 36; International Commission on Radiation Units and Measurements: Bethesda, MD, USA, 1983; Volume 36, pp. 35–36. [Google Scholar]
- Lindborg, L.; Walker, A. Microdosimetry: Experimental Methods and Applications; CRC Press Taylor & Francis Group: Boca Raton, FL, USA, 2017. [Google Scholar]
- Liamsuwan, T.; Hultqvist, M.; Lindborg, L.; Uehara, S.; Nikjoo, H. Microdosimetry of proton and carbon ions. Med. Phys. 2014, 41, 081721. [Google Scholar] [CrossRef] [PubMed]
- Bellinzona, V.E.; Attili, A.; Cordoni, F.; Missiaggia, M.; Tommasino, F.; Scifoni, E.; La Tessa, C. Linking microdosimetric measurements to biological effectiveness: A review of theoretical aspects of MKM and other models. Front. Phys. 2020, 8, 578492. [Google Scholar] [CrossRef]
- Hartzell, S.; Parisi, A.; Sato, T.; Beltran, C.J.; Furutani, K.M. Extending TOPAS with an analytical microdosimetric function: Application and benchmarking with nBio track structure simulations. Phys. Med. Biol. 2025, 70, 105010. [Google Scholar] [CrossRef] [PubMed]
- Incerti, S.; Kyriakou, I.; Bernal, M.A.; Bordage, M.C.; Francis, Z.; Guatelli, S.; Ivanchenko, V.; Karamitros, M.; Lampe, N.; Lee, S.B.; et al. Geant4-DNA example applications for track structure simulations in liquid water: A report from the Geant4-DNA Project. Med. Phys. 2018, 45, e722–e739. [Google Scholar] [CrossRef]
- Moeini, H.; Mokari, M. DNA damage and microdosimetry for carbon ions: Track structure simulations as the key to quantitative modeling of radiation-induced damage. Med. Phys. 2022, 49, 4823–4836. [Google Scholar] [CrossRef]
- Conte, V.; Agosteo, S.; Bianchi, A.; Bolst, D.; Bortot, D.; Catalano, R.; Cirrone, G.A.P.; Colautti, P.; Cuttone, G.; Guatelli, S.; et al. Microdosimetry of a therapeutic proton beam with a mini-TEPC and a MicroPlus-Bridge detector for RBE assessment. Phys. Med. Biol. 2020, 65, 245018. [Google Scholar] [CrossRef]
- Tran, L.T.; Bolst, D.; Guatelli, S.; Pogossov, A.; Petasecca, M.; Lerch, M.L.F.; Chartier, L.; Prokopovich, D.A.; Reinhard, M.I.; Povoli, M.; et al. The relative biological effectiveness for carbon, nitrogen, and oxygen ion beams using passive and scanning techniques evaluated with fully 3D silicon microdosimeters. Med. Phys. 2018, 45, 2299–2308. [Google Scholar] [CrossRef]
- Kase, Y.; Kanai, T.; Matsumoto, Y.; Furusawa, Y.; Okamoto, H.; Asaba, T.; Sakama, M.; Shinoda, H. Microdosimetric Measurements and Estimation of Human Cell Survival for Heavy-Ion Beams. Radiat. Res. 2006, 166, 629–638. [Google Scholar] [CrossRef]
- Sato, T.; Watanabe, R.; Niita, K. Development of a calculation method for estimating specific energy distribution in complex radiation fields. Radiat. Prot. Dosim. 2006, 122, 41–45. [Google Scholar] [CrossRef]
- Sato, T.; Matsuya, Y.; Ogawa, T.; Kai, T.; Hirata, Y.; Tsuda, S.; Parisi, A. Improvement of the hybrid approach between Monte Carlo simulation and analytical function for calculating microdosimetric probability densities in macroscopic matter. Phys. Med. Biol. 2023, 68, 155005. [Google Scholar] [CrossRef]
- Kiefer, J.; Straaten, H. A model of ion track structure based on classical collision dynamics. Phys. Med. Biol. 1986, 31, 1201–1209. [Google Scholar] [CrossRef]
- Chatterjee, A.; Schaefer, H.J. Microdosimetric structure of heavy ion tracks in tissue. Rad. Environ. Biophys. 1976, 13, 215–227. [Google Scholar] [CrossRef]
- Parisi, A.; Beltran, C.J.; Furutani, K.M. The Mayo Clinic Florida microdosimetric kinetic model of clonogenic survival: Formalism and first benchmark against in vitro and in silico data. Phys. Med. Biol. 2022, 67, 185013. [Google Scholar] [CrossRef]
- Inaniwa, T.; Furukawa, T.; Kase, Y.; Matsufuji, N.; Toshito, T.; Matsumoto, Y.; Furusawa, Y.; Noda, K. Treatment planning for a scanned carbon beam with a modified microdosimetric kinetic model. Phys. Med. Biol. 2010, 55, 6721–6737. [Google Scholar] [CrossRef]
- Kase, Y.; Kanai, T.; Matsufuji, N.; Furusawa, Y.; Elsässer, T.; Scholz, M. Biophysical calculation of cell survival probabilities using amorphous track structure models for heavy-ion irradiation. Phys. Med. Biol. 2008, 53, 37–59. [Google Scholar] [CrossRef]
- Sato, T.; Iwamoto, Y.; Hashimoto, S.; Ogawa, T.; Furuta, T.; Abe, S.-I.; Kai, T.; Matsuya, Y.; Matsuda, N.; Hirata, Y.; et al. Recent improvements of the particle and heavy ion transport code system—PHITS version 3.33. J. Nucl. Sci. Technol. 2024, 61, 127–135. [Google Scholar] [CrossRef]
- Krämer, M. Calculation of heavy-ion track structure. Nucl. Instrum. Methods Phys. Res. Sect. B Beam Interact. Mater. At. 1995, 105, 14–20. [Google Scholar] [CrossRef]
- ICRU. Key Data for Ionizing-Radiation Dosimetry: Measurement Standards and Applications. ICRU Report. 2014. Available online: www.icru.org/report/icru-report-90-key-data-for-ionizing-radiation-dosimetry-measurement-standards-and-applications/ (accessed on 6 May 2024).
- ICRU. Stopping of ions heavier than Helium. J. ICRU 2005, 73, iii–viii. [Google Scholar]
- Parisi, A.; Beltran, C.J.; Furutani, K.M. The Mayo Clinic Florida Microdosimetric Kinetic Model of Clonogenic Survival: Application to Various Repair-Competent Rodent and Human Cell Lines. Int. J. Mol. Sci. 2022, 23, 12491. [Google Scholar] [CrossRef]
- Parisi, A.; Furutani, K.M.; Sato, T.; Beltran, C.J. Comparative Evaluation of Two Analytical Functions for the Microdosimetry of Ions from 1H to 238U. Quantum Beam Sci. 2024, 8, 18. [Google Scholar] [CrossRef]
- Curtis, S.B. Introduction to Track Structure and z*2/B2. 2016. Available online: https://three.jsc.nasa.gov/articles/Track-Structure-SCurtis.pdf (accessed on 6 May 2024).
- Furusawa, Y.; Fukutsu, K.; Aoki, M.; Itsukaichi, H.; Eguchi-Kasai, K.; Ohara, H.; Yatagai, F.; Kanai, T.; Ando, K. Inactivation of aerobic and hypoxic cells from three different cell lines by accelerated 3He-, 12C- and 20Ne-ion beams. Radiat. Res. 2000, 154, 485–496. [Google Scholar] [CrossRef]
- Hartzell, S.; Guan, F.; Magro, G.; Taylor, P.; Taddei, P.; Peterson, C.; Kry, S.F. Contribution of nuclear fragmentation to dose and RBE in carbon ion radiotherapy. J. Radiat. Res. 2025, 203, 96–106. [Google Scholar] [CrossRef]
- Inaniwa, T.; Kanematsu, N. Adaptation of stochastic microdosimetric kinetic model for charged-particle therapy treatment planning. Phys. Med. Biol. 2018, 63, 095011. [Google Scholar] [CrossRef]
- Tsuda, S.; Sato, T.; Takahashi, F.; Satoh, D.; Sasaki, S.; Namito, Y.; Iwase, H.; Ban, S.; Takada, M. Systematic Measurement of Lineal Energy Distributions for Proton, He and Si Ion Beams Over a Wide Energy Range Using a Wall-less Tissue Equivalent Proportional Counter. J. Radiat. Res. 2012, 53, 264–271. [Google Scholar] [CrossRef]
- Tran, L.T.; Bolst, D.; James, B.; Pan, V.; Vohradsky, J.; Peracchi, S.; Chartier, L.; Debrot, E.; Guatelli, S.; Petasecca, M.; et al. Silicon 3D Microdosimeters for Advanced Quality Assurance in Particle Therapy. Appl. Sci. 2021, 12, 328. [Google Scholar] [CrossRef]
- Rosenfeld, A.B. Novel detectors for silicon based microdosimetry, their concepts and applications. Nucl. Instrum. Methods Phys. Res. Sect. A Accel. Spectrometers Detect. Assoc. Equip. 2016, 809, 156–170. [Google Scholar] [CrossRef]
- Prieto-Pena, J.; Gómez, F.; Fleta, C.; Guardiola, C.; Pellegrini, G.; Donetti, M.; Giordanengo, S.; González-Castaño, D.M.; Pardo-Montero, J. Microdosimetric Spectra Measurements on a Clinical Carbon Beam at Nominal Therapeutic Fluence Rate With Silicon Cylindrical Microdosimeters. IEEE Trans. Nucl. Sci. 2019, 66, 1840–1847. [Google Scholar] [CrossRef]
- Magrin, G.; Verona, C.; Ciocca, M.; Marinelli, M.; Mastella, E.; Stock, M.; Verona-Rinati, G. Microdosimetric characterization of clinical carbon-ion beams using synthetic diamond detectors and spectral conversion methods. Med. Phys. 2019, 47, 713–721. [Google Scholar] [CrossRef]
- Parisi, G.; Magrin, G.; Verona, C.; Verona-Rinati, G.; Barna, S.; Meouchi, C.; Romano, F.; Schettino, G. On the microdosimetric characterisation of the radiation quality of a carbon-ion beam and the effect of the target volume thickness. Phys. Med. Biol. 2024, 69, 245003. [Google Scholar] [CrossRef]
- Taddei, P.J.; Zhao, Z.; Borak, T.B. A comparison of the measured responses of a tissue-equivalent proportional counter to high energy heavy (HZE) particles and those simulated using the Geant4 Monte Carlo code. Radiat. Meas. 2008, 43, 1498. [Google Scholar] [CrossRef]
- Borak, T.B.; Doke, T.; Fuse, T.; Guetersloh, S.; Heilbronn, L.; Hara, K.; Moyers, M.; Suzuki, S.; Taddei, P.; Terasawa, K.; et al. Comparisons of LET distributions for protons with energies between 50 and 200 MeV determined using a spherical Tissue-Equivalent Proportional Counter (TEPC) and a position-sensitive silicon spectrometer (RRMD-III). Radiat. Res. 2004, 162, 687–692. [Google Scholar] [CrossRef]
- Conte, V.; Colautti, P.; Chiriotti, S.; Moro, D.; Ciocca, M.; Mairani, A. Mini-TEPC Microdosimetric Study of Carbon Ion Therapeutic Beams at CNAO. EPJ Web Conf. 2021, 153, 01012. [Google Scholar] [CrossRef]
- Hartzell, S.; Guan, F.; Taylora, P.; Peterson, C.; Taddei, P.; Kry, S. Uncertainty in tissue equivalent proportional counter assessments of microdosimetry and RBE estimates in carbon radiotherapy. Phys. Med. Biol. 2021, 66, 155018. [Google Scholar] [CrossRef]
- Attili, A.A.-O.; Scifoni, E.A.-O.; Tommasino, F.A.-O. Modelling the HPRT-gene mutation induction of particle beams: Systematicin vitrodata collection, analysis and microdosimetric kinetic model implementation. Phys. Med. Biol. 2022, 67, 195001. [Google Scholar] [CrossRef]
- Manganaro, L.; Russo, G.; Cirio, R.; Dalmasso, F.; Giordanengo, S.; Monaco, V.; Muraro, S.; Sacchi, R.; Vignati, A.; Attili, A. A Monte Carlo approach to the microdosimetric kinetic model to account for dose rate time structure effects in ion beam therapy with application in trreatment planning simulations. Med. Phys. 2017, 44, 1577–1589. [Google Scholar] [CrossRef]
- Magro, G.; Dahle, T.J.; Molinelli, S.; Ciocca, M.; Fossati, P.; Ferrari, A.; Inaniwa, T.; Matsufuji, N.; Ytre-Hauge, K.S.; Mairani, A. The FLUKA Monte Carlo code coupled with the NIRS approach for clinical dose calculations in carbon ion therapy. Phys. Med. Biol. 2017, 62, 3814–3827. [Google Scholar] [CrossRef]
- Dahle, T.J.; Magro, G.; Ytre-Hauge, K.S.; Stokkevåg, C.H.; Choi, K.; Mairani, A. Sensitivity study of the microdosimetric kinetic model parameters for carbon ion radiotherapy. Phys. Med. Biol. 2018, 63, 225016. [Google Scholar] [CrossRef]
- Hartzell, S.; Guan, F.; Magro, G.; Taylor, P.; Peterson, C.; Kry, S. Quantifying sensitivity of carbon RBE models to reference parameter variations. Radiat. Res. 2025. [Google Scholar] [CrossRef]
- Mein, S.; Klein, C.; Kopp, B.; Magro, G.; Harrabi, S.; Karger, C.P.; Haberer, T.; Debus, J.; Abdollahi, A.; Dokic, I.; et al. Assessment of RBE-Weighted Dose Models for Carbon Ion Therapy Toward Modernization of Clinical Practice at HIT: In Vitro, in Vivo, and in Patients. Int. J. Radiat. Oncol. Biol. Phys. 2020, 108, 779–791. [Google Scholar] [CrossRef]
- Góra, J.; Grosshagauer, S.; Fossati, P.; Mumot, M.; Stock, M.; Schafasand, M.; Carlino, A. The sensitivity of radiobiological models in carbon ion radiotherapy (CIRT) and its consequences on the clinical treatment plan: Differences between LEM and MKM models. J. Appl. Clin. Med. Phys. 2024, 25, e14321. [Google Scholar] [CrossRef]
- Grosshagauer, S.; Fossati, P.; Schafasand, M.; Carlino, A.; Poljanc, K.; Radakovits, T.; Stock, M.; Hug, E.; Georg, P.; Pelak, M.; et al. Organs at risk dose constraints in carbon ion radiotherapy at MedAustron: Translations between LEM and MKM RBE models and preliminary clinical results. Radiother. Oncol. 2022, 175, 73–78. [Google Scholar] [CrossRef] [PubMed]
- Wang, W.; Huang, Z.; Sheng, Y.; Zhao, J.; Shahnazi, K.; Zhang, Q.; Jiang, G. RBE-weighted dose conversions for carbon ionradiotherapy between microdosimetric kinetic model and local effect model for the targets and organs at risk in prostate carcinoma. Radiother. Oncol. 2020, 144, 30–36. [Google Scholar] [CrossRef] [PubMed]
- Molinelli, S.; Magro, G.; Mairani, A.; Allajbej, A.; Mirandola, A.; Chalaszczyk, A.; Imparato, S.; Ciocca, M.; Fiore, M.R.; Orlandi, E. How LEM-based RBE and dose-averaged LET affected clinical outcomes of sacral chordoma patients treated with carbon ion radiotherapy. Radiother. Oncol. 2021, 163, 209–214. [Google Scholar] [CrossRef] [PubMed]
- Weisstein, E.W. Circle-Circle Intersection. Available online: https://mathworld.wolfram.com/Circle-CircleIntersection.html (accessed on 6 May 2024).
- Weisstein, E.W. Circular Sector. Available online: https://mathworld.wolfram.com/CircularSector.html (accessed on 6 May 2024).
- Weisstein, E.W. Disk Point Picking. Available online: https://mathworld.wolfram.com/DiskPointPicking.html (accessed on 6 May 2024).
| LET (keV/µm) | RBE10% | |||||
|---|---|---|---|---|---|---|
| Average (Gy) | Spread (Gy) | St. Dev. (%) | Average | Spread | St. Dev. (%) | |
| 688 | 7.14 | 0.62 | 4.08% | 1.40 | 1.86% | 0.05 |
| 508 | 9.66 | 0.63 | 3.49% | 1.63 | 1.99% | 0.06 |
| 330 | 14.2 | 1.30 | 4.11% | 2.07 | 2.78% | 0.13 |
| 195 | 20.9 | 4.48 | 9.37% | 2.75 | 7.27% | 0.46 |
| 92.6 | 20.6 | 5.20 | 10.5% | 2.72 | 8.21% | 0.53 |
| 44.3 | 11.4 | 2.76 | 10.6% | 1.79 | 6.38% | 0.26 |
| 19.5 | 5.07 | 1.16 | 10.6% | 1.22 | 3.71% | 0.10 |
| 9.86 | 2.50 | 0.96 | 18.1% | 1.02 | 3.37% | 0.07 |
| 8.16 | 1.93 | 0.61 | 13.6% | 0.97 | 2.02% | 0.05 |
Disclaimer/Publisher’s Note: The statements, opinions and data contained in all publications are solely those of the individual author(s) and contributor(s) and not of MDPI and/or the editor(s). MDPI and/or the editor(s) disclaim responsibility for any injury to people or property resulting from any ideas, methods, instructions or products referred to in the content. |
© 2025 by the authors. Licensee MDPI, Basel, Switzerland. This article is an open access article distributed under the terms and conditions of the Creative Commons Attribution (CC BY) license (https://creativecommons.org/licenses/by/4.0/).
Share and Cite
Hartzell, S.; Furutani, K.M.; Parisi, A.; Sato, T.; Kase, Y.; Deglow, C.; Friedrich, T.; Beltran, C.J. Impact of Microdosimetric Modeling on Computation of Relative Biological Effectiveness for Carbon Ion Radiotherapy. Radiation 2025, 5, 21. https://doi.org/10.3390/radiation5020021
Hartzell S, Furutani KM, Parisi A, Sato T, Kase Y, Deglow C, Friedrich T, Beltran CJ. Impact of Microdosimetric Modeling on Computation of Relative Biological Effectiveness for Carbon Ion Radiotherapy. Radiation. 2025; 5(2):21. https://doi.org/10.3390/radiation5020021
Chicago/Turabian StyleHartzell, Shannon, Keith M. Furutani, Alessio Parisi, Tatsuhiko Sato, Yuki Kase, Christian Deglow, Thomas Friedrich, and Chris J. Beltran. 2025. "Impact of Microdosimetric Modeling on Computation of Relative Biological Effectiveness for Carbon Ion Radiotherapy" Radiation 5, no. 2: 21. https://doi.org/10.3390/radiation5020021
APA StyleHartzell, S., Furutani, K. M., Parisi, A., Sato, T., Kase, Y., Deglow, C., Friedrich, T., & Beltran, C. J. (2025). Impact of Microdosimetric Modeling on Computation of Relative Biological Effectiveness for Carbon Ion Radiotherapy. Radiation, 5(2), 21. https://doi.org/10.3390/radiation5020021