1. Introduction
It is nowadays well-known that humans are constantly exposed to low doses (below 100 mGy) and low-dose rates (less than 6 mGh/h) of ionizing radiation, coming from both natural and man-made sources [
1]. Due to the increasing popularity of radiation therapy and diagnostic radiology, studies on the biological effects of low-dose radiation are becoming a focus of interest. Although many studies indicate a link between carcinogenesis and radiation exposure, the exact mechanism is still not clear. The well-known linear no-threshold (LNT) model reports that any radiation exposure presents a carcinogenic risk, and the risk is proportional to the absorbed radiation dose; however, it has no indisputable scientific basis when doses are very low and the evidence supporting LNT is inconclusive [
2,
3].
In low-dose radiobiology (LDR), the observed effects are not directly proportional to the dose received, but there are a number of factors, such as genetic background, age, gender, and lifestyle, which can modify the outcome [
4,
5,
6,
7].
The global mechanisms underlying LDR include the production of oxidative stress, changes in mitochondrial and membrane channels, signaling to neighbor cells, the release of exosomes carrying modified cargos, and changes in the proteome. It is important to recognize that these changes may be proactive damage responses and not harmful per se. Change does not necessarily equate with harm.
In recent years, monitoring changes induced by low doses of ionizing radiation has attracted increasing interest, not only for the implications in the medical field, but also in other areas related to space exploration, industrial applications, military activities, nuclear power plants, and the environment [
8,
9,
10,
11]. In the
Supplementary Materials, Tables S1 and S2 report the doses usually adopted in medical diagnostics and other activities.
Among the different methods available to investigate the changes induced by low doses of ionizing radiation, vibrational spectroscopies, such as Fourier transform infrared and Raman micro-spectroscopy (FT-IR and RMS), can play a relevant role. These non-destructive techniques are powerful tools to examine the biochemical properties of biological samples such as proteins, cellular materials, and tissues. FT-IR and RMS can provide reliable information and are largely adopted in many fields of biomedical and biotechnological interest [
12,
13,
14,
15,
16].
Recently, Monaghan et al. [
17] have carefully reviewed the most significant applications of vibrational spectroscopy in radiobiology. FT-IR and RMS have been applied to investigate the changes induced in DNA, lipids, and proteins by radiation doses usually adopted in radiotherapy or higher ones [see Ref. [
17] and references therein]. In particular, these techniques have been applied to study subcellular, cellular, tissue, and bone systems, in vitro and ex vivo, directly irradiated by different ionizing radiation doses. Also, bystander and abscopal effects have been investigated in the above-mentioned class of samples [
18,
19]. A certain number of studies have tried to translate the application of vibrational spectroscopies in clinical settings using solid and liquid biopsies.
In the present manuscript, we aim to contribute to defining the possibility of using FT-IR and RMS to monitor the changes induced in cells and tissues by low-dose ionizing radiation by reviewing the literature in this field. To retrieve the papers of interest in the review, the Scopus, PubMed, Web of Knowledge, and Google databases have been searched up to November 2024. To identify relevant records, the search terms included ‘vibrational spectroscopies’, ‘Raman spectroscopy’, ‘micro-Raman spectroscopy’, ‘infrared spectroscopy’, ‘Fourier-Transform infrared spectroscopy’, AND ‘low doses’, AND ‘ionizing radiation’ OR ‘X-ray’ OR ‘γ ray’ OR ‘proton’ OR ‘neutron’. Title and abstract screening were performed to identify potentially relevant papers and remove duplicate articles.
Readers not familiar with vibrational spectroscopies can refer to the Refs. [
17,
20] for a clear description of the physics principles of these techniques and many other details that can be of interest but are beyond the scope of this work.
2. Molecular Changes Induced in Human Tissues and Cells by Low Doses of Ionizing Radiation
Radiation acts primarily by inducing DNA damage in somatic cells. DNA lesions are caused either by direct energy deposition in DNA or by the indirect action of ROS/RNS (Reactive Oxygen and Reactive Nitrogen Species)-mediated free radicals produced during and after water radiolysis; however, double-strand breaks (DSBs) and complex lesions (consisting of multiple lesions in close proximity) in DNA are probably the most important in causing long-lived mutations. Radiation-induced effects are generally divided in targeted and not targeted effects.
In targeted effects, radiation stimulates DNA damage repair through homologous end-joining (HEJ) and non-homologous end-joining (NHEJ) pathways. The latter is an error-prone pathway, as it involves the repair of a DSB failure (DSB induction is considered one of the main mechanisms by which radiation exerts its deleterious effect), that can lead to the induction of chromosome aberrations, which in turn may cause genomic instability. Thus, even the lowest doses of radiation may induce DNA damage that may remain unrepaired and converted into DNA sequence mutations and cells with unrepaired DSBs may be eliminated. Furthermore, low-dose hyper radiosensitivity (HRS), adaptive response, and hormesis can be considered targeted effects [
21,
22,
23,
24]. HRS is described as an increase in radiosensitivity in cells exposed to low-dose radiation, usually below 0.2–0.3 Gy for low Linear Transfer energy (LET) radiation. Some authors hypothesized that only X-ray doses above a certain threshold (0.5 Gy) can induce enough damage to activate DNA damage repair mechanisms during the cellular cycle [
1,
2,
3]. Some research on different cell lines reported that HRS increases in G2-phase cells. An adaptive response can be defined as the ability of a first low dose of radiation to “protect” against the effects of a subsequent high dose. There is emerging evidence that low doses induce cellular and intercellular changes, which can lead to adaptive metabolic alterations that may be beneficial to health. For hormesis, according to the term, it means observing some beneficial effects after low-dose exposure compared to unirradiated controls.
Non-targeted effects, including bystander effects and genomic instability, contribute to the induction of cancer in a less clear way. The progeny of exposed cells may exhibit phenotypes such as chromosomal aberrations and rearrangements, gene mutations, and enhanced cell death rates. The acquisition of alterations in the genome of the progeny of irradiated cells is described as genomic instability, and it has been accepted as the hallmark of cancer cells and one of the most important factors involved in the development of some cancers.
Radiation-induced genomic instability (RIGI) is observed in irradiated progeny cells as a delayed and elevated stochastic appearance of de novo chromosomal aberrations (two or three mitoses after initial exposure also), gene mutations, and reproductive cell death after the initial insult. In the context of RIGI, the effect on the genome is mediated via the accumulation of genetic changes in the progeny of surviving irradiated cells through many generations. The ability to induce genomic instability depends on both the dose and quality of radiation (different LET), with high LET radiation generally inducing chromosome- and chromatid-type aberrations more effectively. Some studies [
1,
25,
26] suggest that the ability of low-dose X-rays to induce chromosomal aberrations increases with the dose rate.
Bystander effects are defined as radiation-like effects observed in cells that have not received any energy deposition but have received signals from irradiated cells (Radiation-Induced Bystander Effects—RIBEs). This effect, together with other non-targeted effects, is often described as more relevant for low-dose radiation and is mediated through two mechanisms: secretion of soluble factors by irradiated cells and also by signaling through cell-to-cell junctions. The RIBE has the greatest influence on DSB induction at doses up to 10 mGy and it is in a super linear relationship with the dose.
3. General Aspects of Vibrational Radiobiology
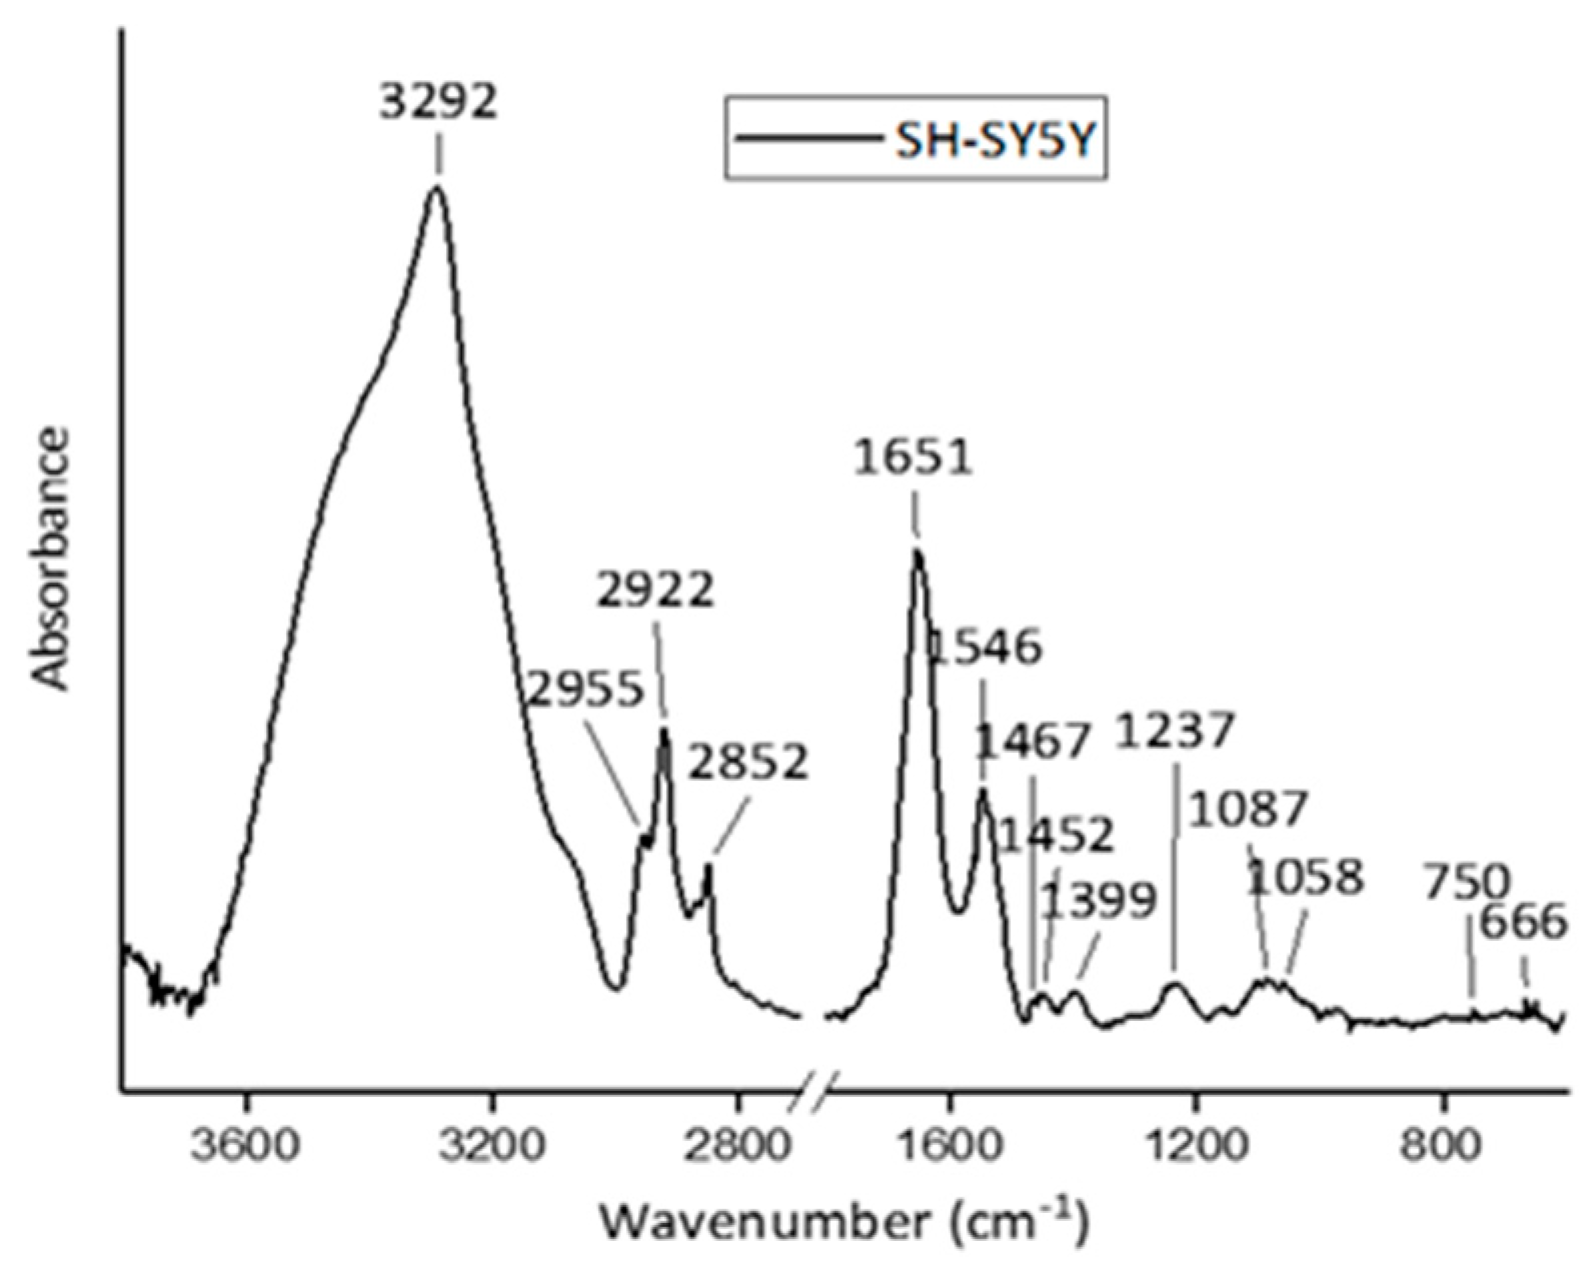
Vibrational spectroscopies have been largely adopted in radiobiology, especially for investigating the effects of the ionizing radiation doses usually adopted in radiotherapy or higher ones [see Ref. [
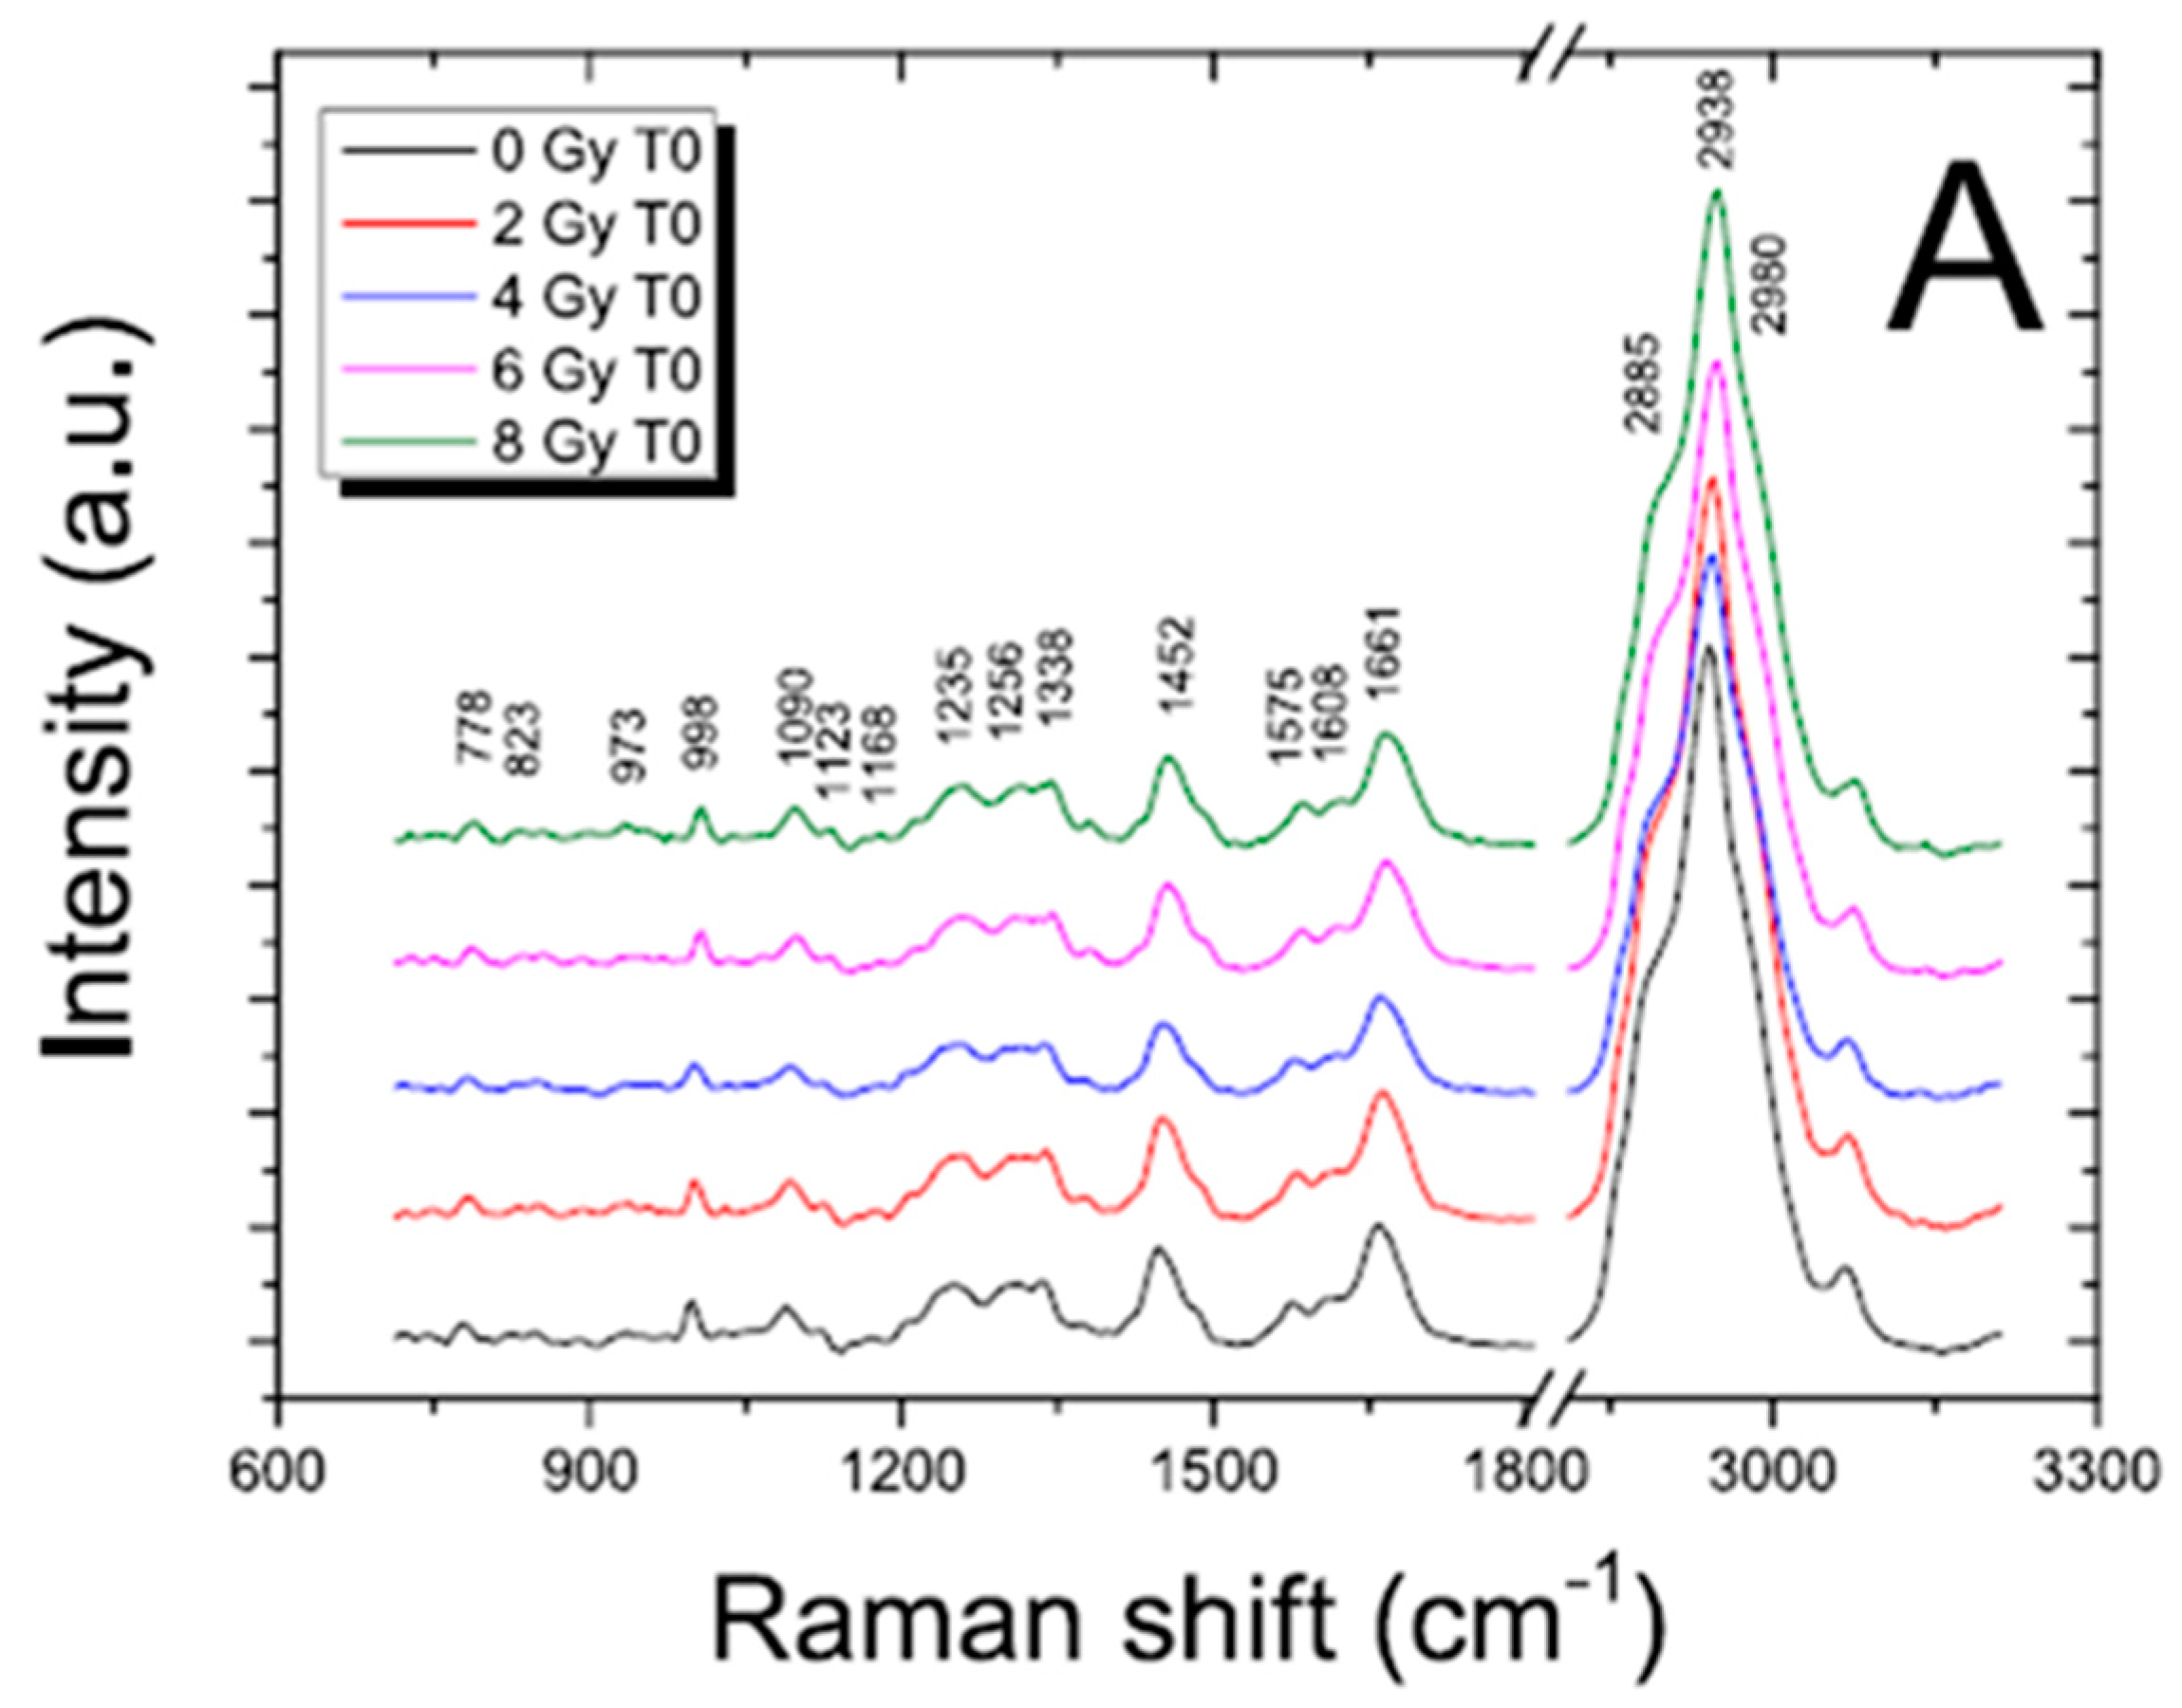
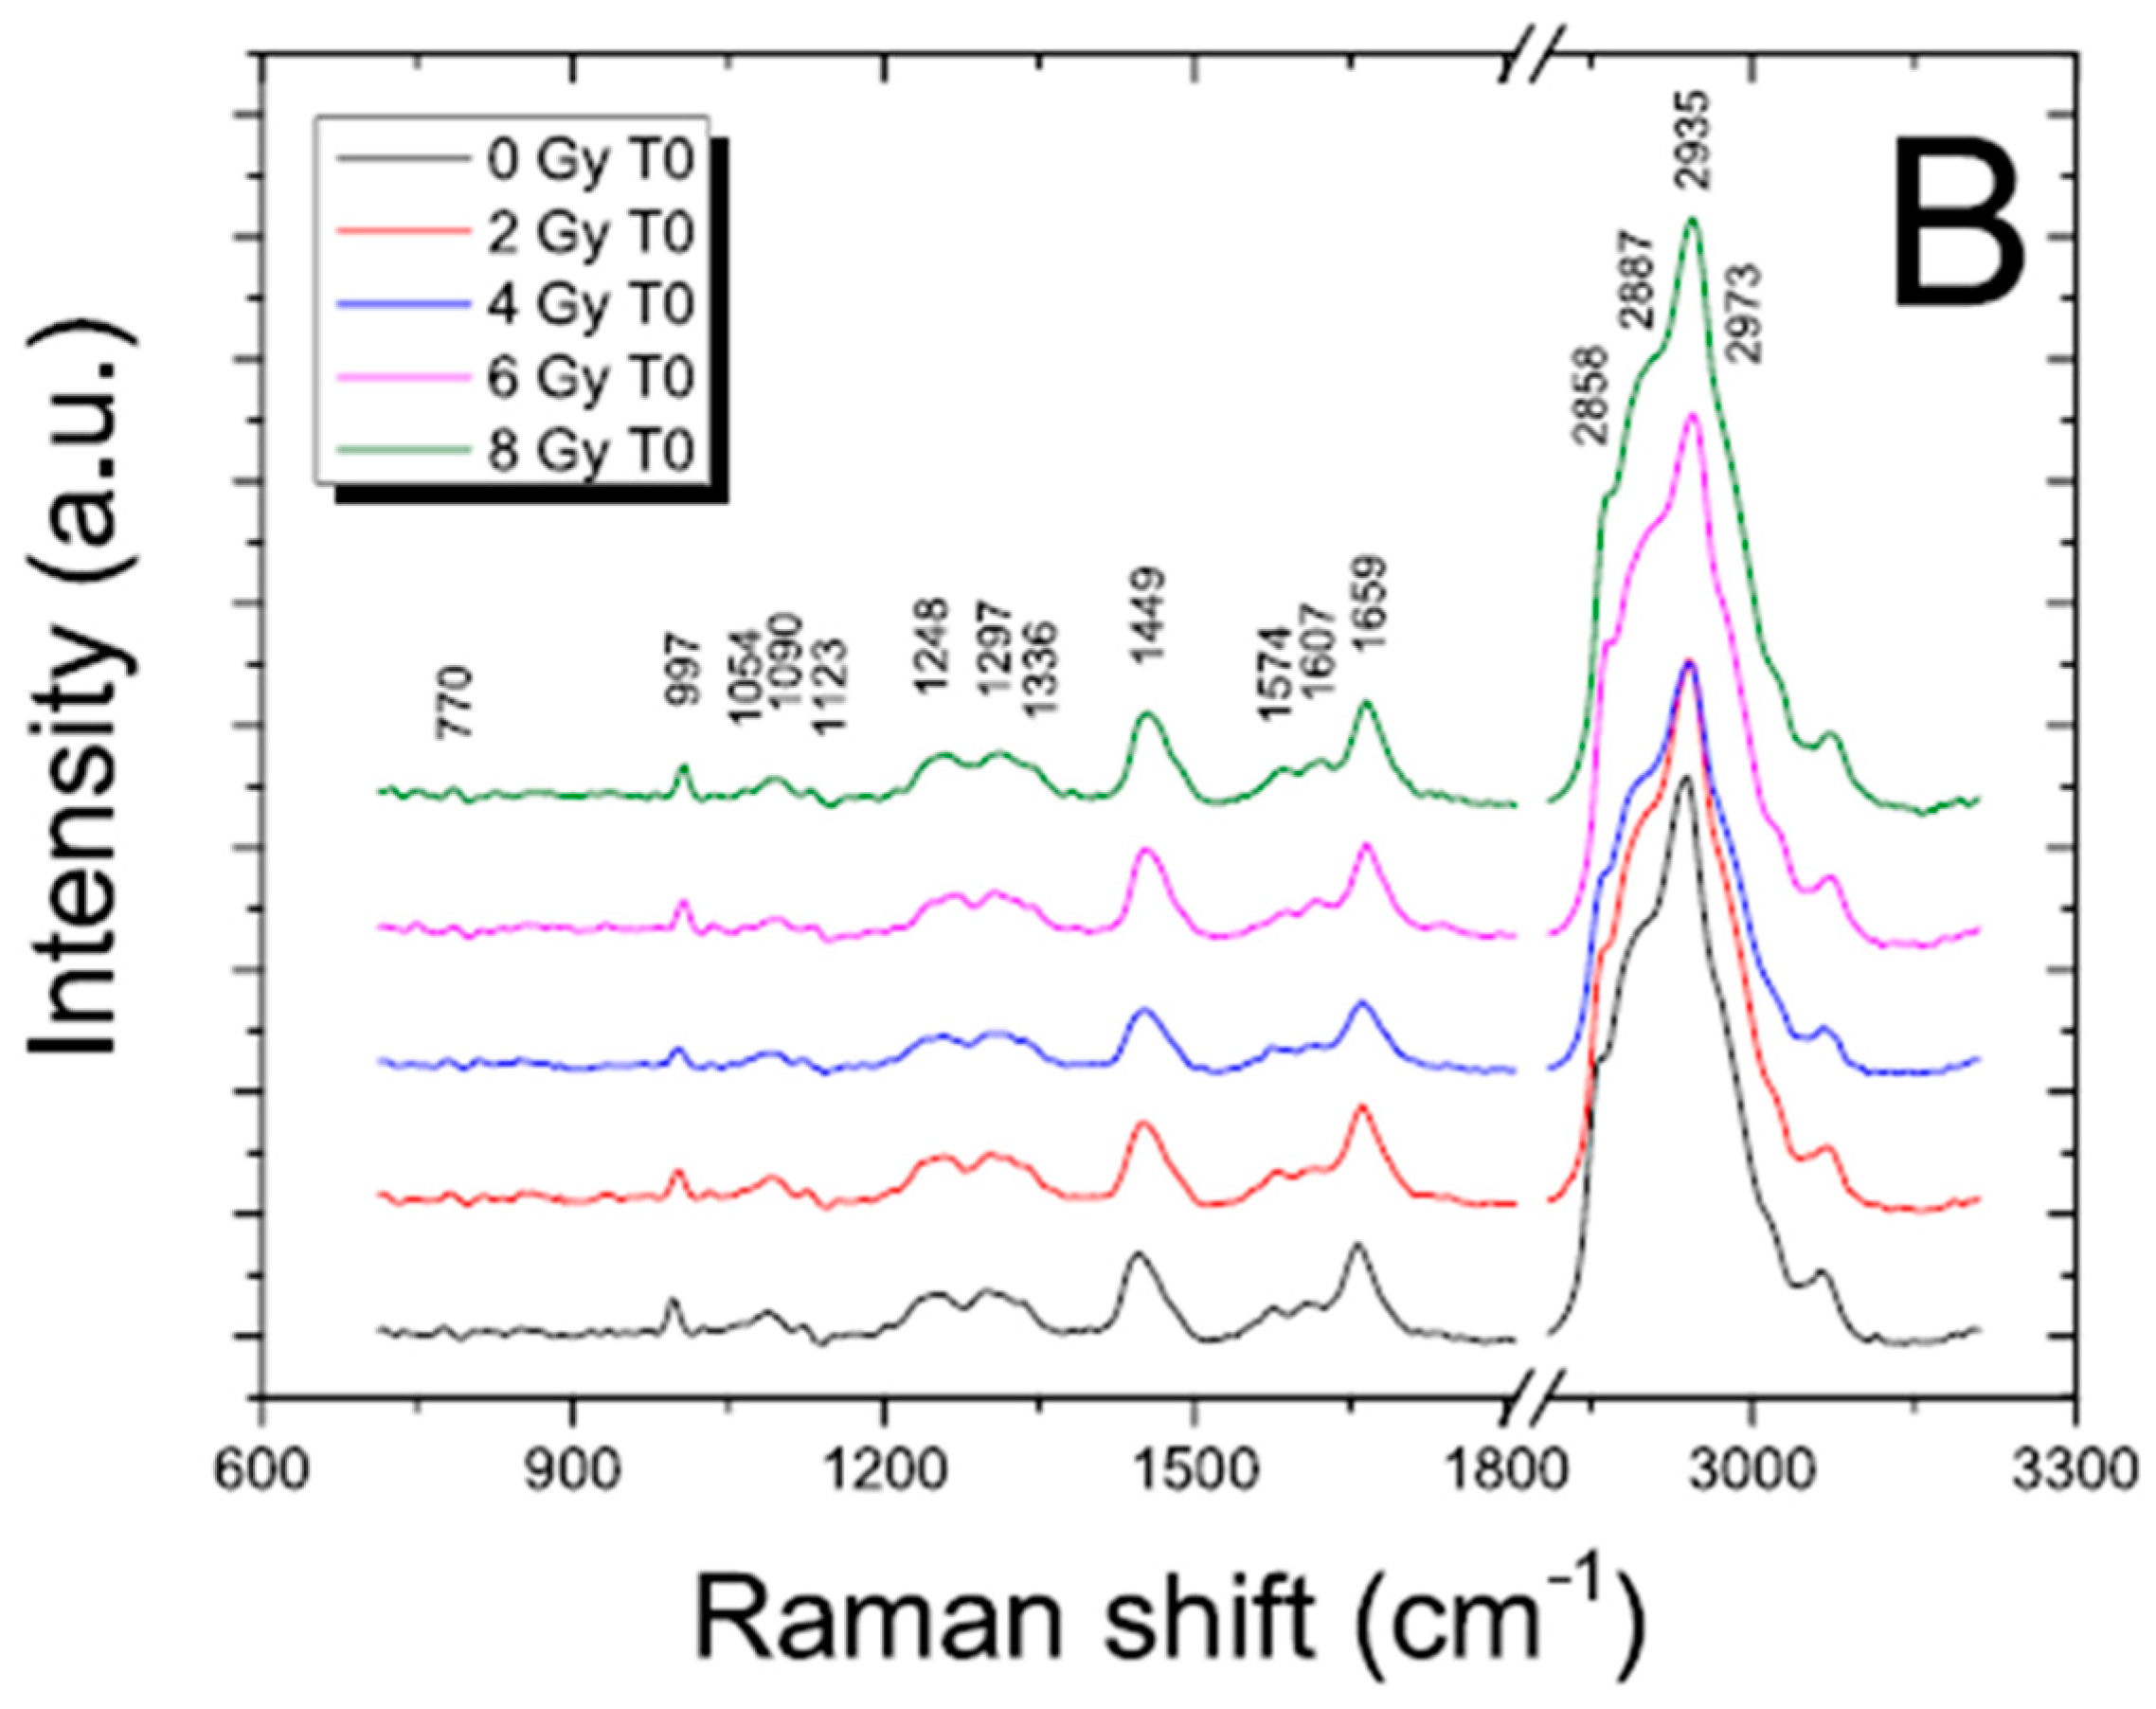
17] and references therein]. To evidence the content of information that can be extracted by using these techniques in the radiobiological field, FT-IR and RMS spectra are reported for SH-SY5Y human neuroblastoma cells in
Figure 1 and
Figure 2, respectively.
Figure 1.
Representative FT-IR spectrum acquired from SH-SY5Y cells in the high-wavenumber region (3600–2800 cm
−1) and fingerprint region (1800–650 cm
−1). Main peaks are labelled, and their assignments are reported in
Table 1. Reprinted under Open Access conditions from Ref. [
27].
Figure 1.
Representative FT-IR spectrum acquired from SH-SY5Y cells in the high-wavenumber region (3600–2800 cm
−1) and fingerprint region (1800–650 cm
−1). Main peaks are labelled, and their assignments are reported in
Table 1. Reprinted under Open Access conditions from Ref. [
27].
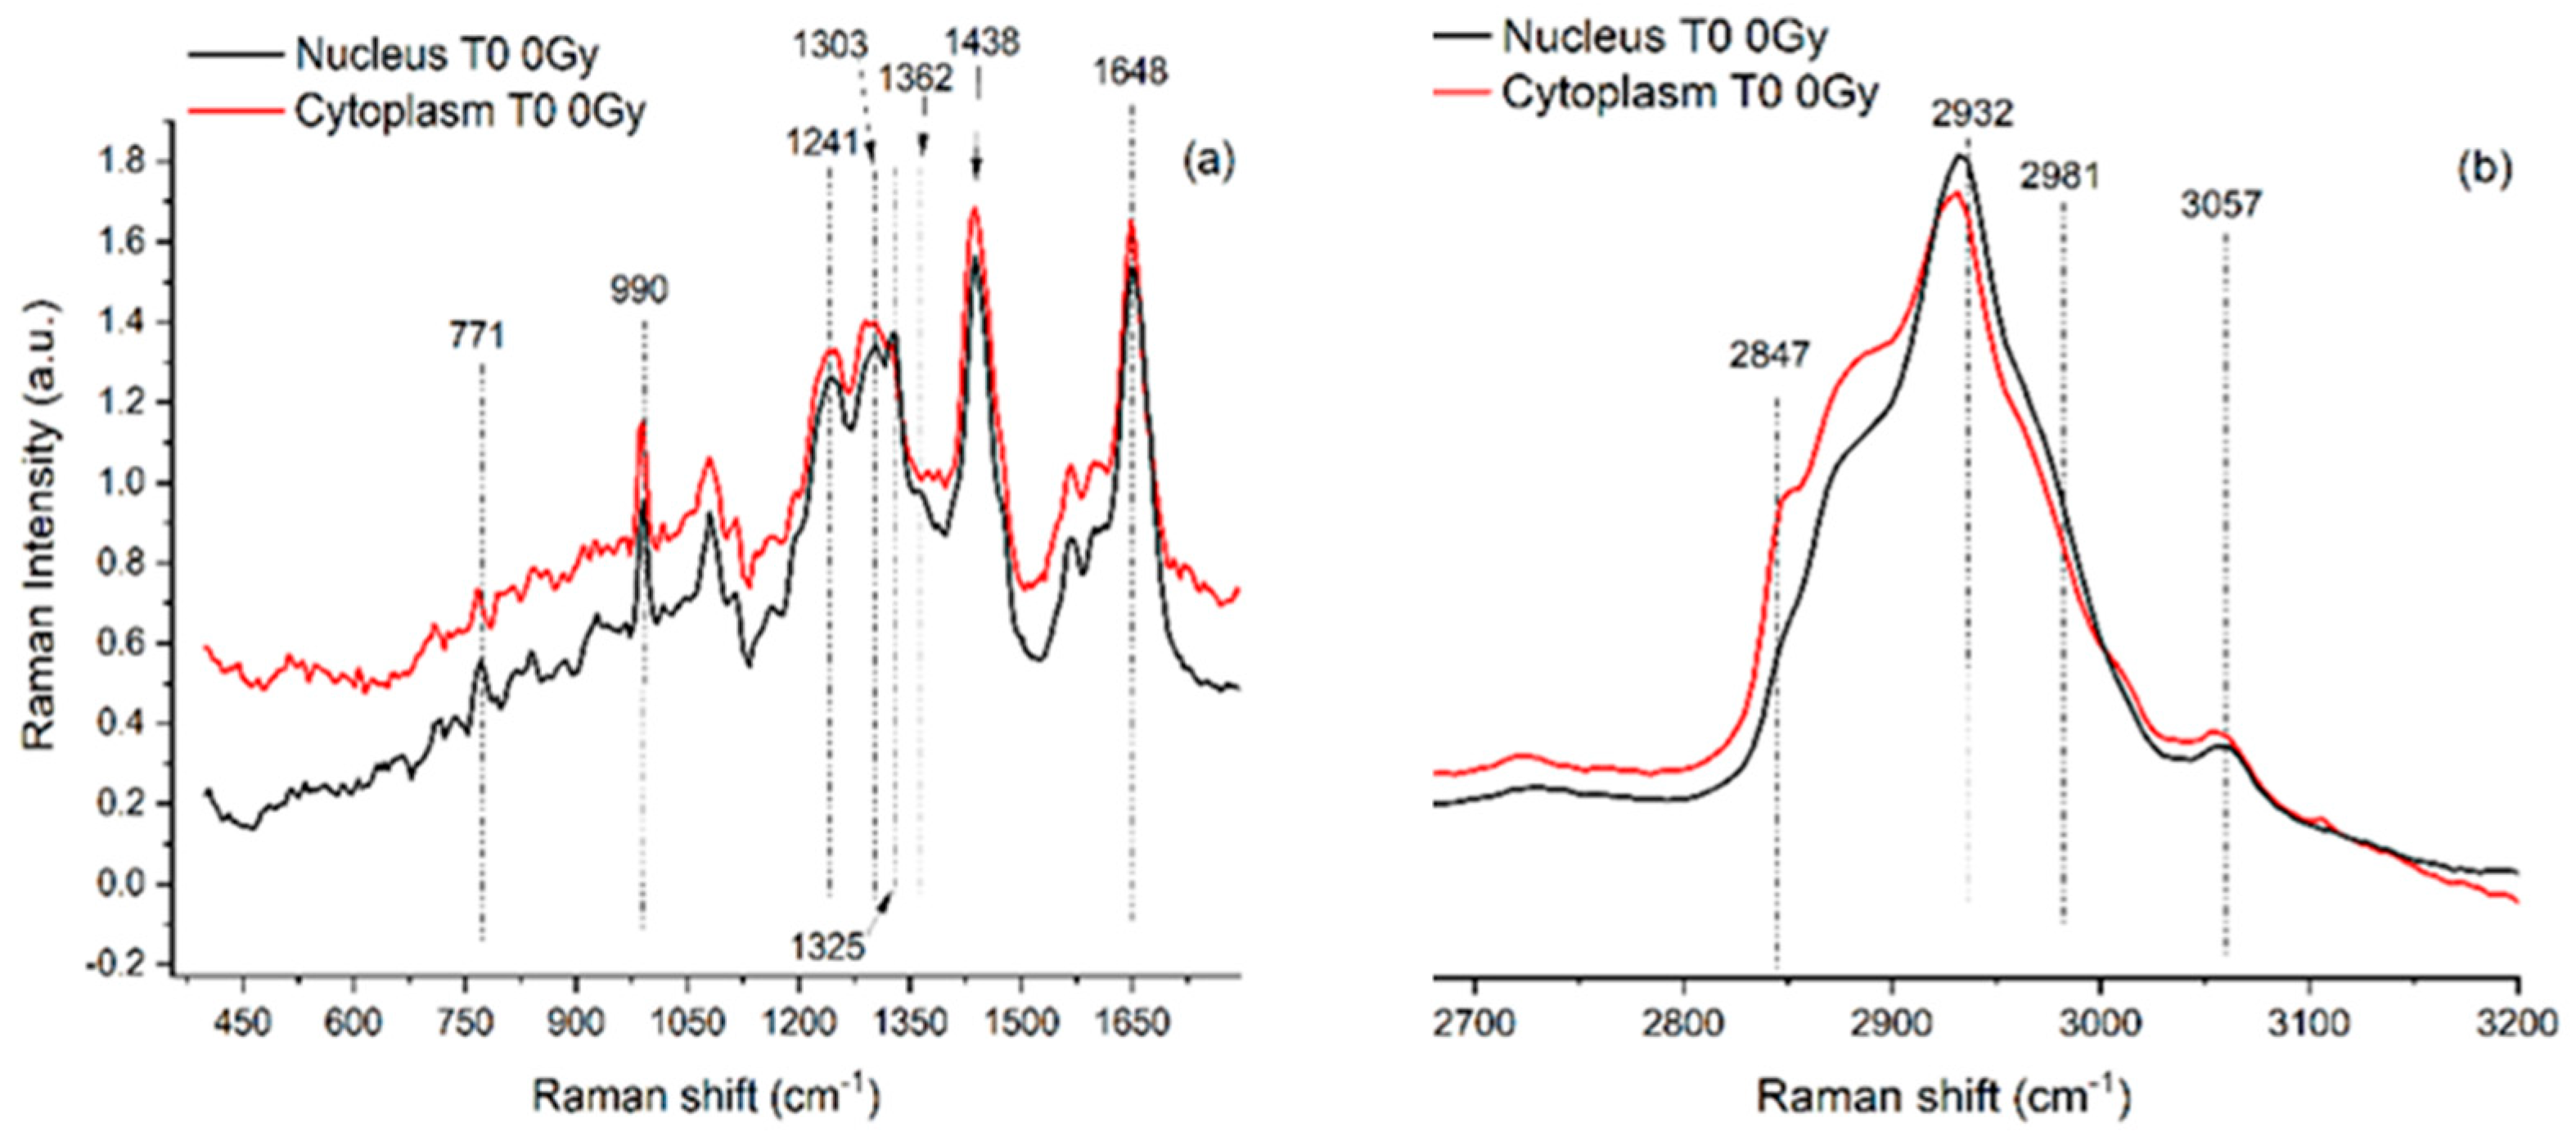
Figure 2.
Representative RMS spectra acquired from cytoplasm (red line, a spectrum) and from nucleus (black line, b spectrum) of single SH-SY5Y cells in the fingerprint region (400–1700 cm
−1; panel (
a) and in the high wavenumber region (2650–3200 cm
−1; (panel (
b))). An Argon laser working at 514.5 nm with 10 mW power was used for spectra acquisition. Main peaks are labelled, and their assignments are reported in
Table 1. Details about the study are available in Refs. [
28,
29].
In the spectra, the contributions due to the different typical components of cells can also be recognized by a visual inspection. In an FT-IR spectrum, the features due to lipids can be present together with a large band attributed to proteins (with contributions due to water if the samples are not dried) in the high wavenumber region (from 4000 to 2700 cm−1). The spectral range from 1700 to 800 cm−1 presents the bands that are mainly related to protein, nucleic acid, and carbohydrate components. The intermediate region from 2700 to 1700 cm−1 does not give any significant information for biological samples.
The regions of interest are also the same for RMS spectra that are rich in vibrational signatures that reflect the biochemical complexity of the cell. These spectra contain distinct features corresponding to the main classes of biomolecules, such as proteins, lipids, nucleic acids, and carbohydrates. For example, proteins are typically identified by peaks around 1655 cm⁻1, associated with Amide I vibrations, and in the 1250–1300 cm⁻1 range, corresponding to Amide III. Lipids show strong signals at 1440 cm⁻1 from C-H bending and in the 2850–2950 cm⁻1 region due to C-H stretching, while nucleic acids exhibit peaks near 785 cm⁻1 that relate to DNA and RNA backbone vibrations. Carbohydrates contribute signals in the 480–900 cm⁻1 range, associated with saccharide structures. Because cells are heterogeneous, when single cells are analyzed and subcellular regions are selected, Raman spectra can vary depending on the region, the nucleus, cytoplasm, or membrane, showing differences in the local biochemical environment that result in differences in the Raman features. Notably, because of the well-known evidence that, in the same conditions, the relative Raman signal of water, compared to those from cellular components, is lower than its relative FT-IR signal, analyzing cells in physiological conditions by using RMS is easier than using FT-IR.
The main peaks in FT-IR and RMS spectra are reported in
Table 1 with their assignments.
Table 1.
FT-IR and MRS peaks observed in the average spectra of SH-SY5Y cells with their main assignments in agreement with the data reported in the literature [
28,
30,
31]. Abbreviation: as = asymmetric, s = symmetric, ν = stretching, δ = bending, br = breathing.
Table 1.
FT-IR and MRS peaks observed in the average spectra of SH-SY5Y cells with their main assignments in agreement with the data reported in the literature [
28,
30,
31]. Abbreviation: as = asymmetric, s = symmetric, ν = stretching, δ = bending, br = breathing.
FT-IR
Peak
Position (cm−1) | MRS
Peak
Position
(cm−1) | Assignments |
|---|
| | | DNA/RNA | Protein | Lipid | Carbohydrates |
| 3292 | | | | | ν (O–H) |
| | 3057 | | | | |
| 2955 | 2981 | | νas (CH3) | νas (CH3) | |
| 2922 | 2932 | | | νas (CH2) | |
| 2852 | 2847 | | | νs (CH2) | |
| 1651 | 1648 | | Amide I
νs (C=O) | | |
| 1546 | | | Amide II | | |
| 1467 | 1438 | | δs (CH2) | δs (CH2) | |
| 1452 | | | δas (CH3) | | |
| 1399 | | δs (CH3) | δs (CH3) | | |
| | 1303 | Adenine | Amide III | | |
| 1237 | 1241 | | Amide III | | |
| 1087 | | νs ( | | | |
| 1058 | | ν (C–O) | | | |
| | 990 | νs ( | | | |
| | 771 | br (Cytosine/
Thymine/Uracil ring)
ν (O-P-O) | | | |
When cells are exposed to ionizing radiation, the induced changes are evidenced by modifications in the spectral position, the intensity of the signal or shape of the band, or by the presence of new bands. In
Figure 3 and
Figure 4, FT-IR and RMS spectra of SH-SY5Y exposed to different X-ray doses usually adopted in radiotherapy are reported. The visual inspection of these figures suggests that subtle changes are generally induced by ionizing radiation and then appropriate data analysis procedures are required for analyzing them.
In fact, different univariate and multivariate data analysis procedures are generally used for extracting the information content [
33,
34,
35,
36]. By analyzing the above-mentioned changes in the spectral features, vibrational spectroscopies offer interesting insights into the different effects induced in cells and tissues by ionizing radiation. As also indicated in
Section 2, these effects essentially regard DNA damage and conformation changes, lipid peroxidation, protein degradation, and structural rearrangement and metabolic influences related to gene and protein expression alterations, resulting in biological effects [see Ref. [
17] and references therein].
4. Representative Results of FT-IR Spectroscopy Investigations on Effects Induced by Low Doses of Ionizing Radiation
In the previous section, we evidenced that vibrational spectroscopies have been generally employed to investigate the effects due to the ionizing radiation doses usually used in radiotherapy or higher ones. Instead, a small number of researchers adopted these spectroscopy techniques to investigate the effects of low doses of different ionizing radiations on tissues and cells. A pioneering work about the use of FT-IR spectroscopy in this field can be represented by the paper of Meade et al. that reports the results of an investigation on dose-dependent molecular effects occurring in the HaCaT human keratinocyte cell line after exposure to γ-radiation [
37]. The cells were grown on MirrIR slides and FT-IR spectra were acquired in transflection mode. As far as the low-dose range is concerned, they investigated the effects induced by 5 mGy, 20 mGy, 50 mGy, 200 mGy, 500 mGy, 750 mGy, 1 Gy, 2.5 Gy, and 5 Gy doses, which were used to analyze the dose-dependent effects occurring after exposure to γ-radiation by using partial least-squares regression (PLSR) and generalized regression neural networks (GRNNs). Even though the adopted methodology has been demonstrated to be able to analyze the changes in the biochemical characteristics occurring after irradiation and give a dose prediction efficiencies of approximately ±10 mGy, no precise information about the effects induced by γ-radiation low doses is given.
In the literature, a certain numbers of papers are devoted to the investigation of the effects induced by low doses of fast neutrons [
38,
39,
40] by using FT-IR spectroscopy.
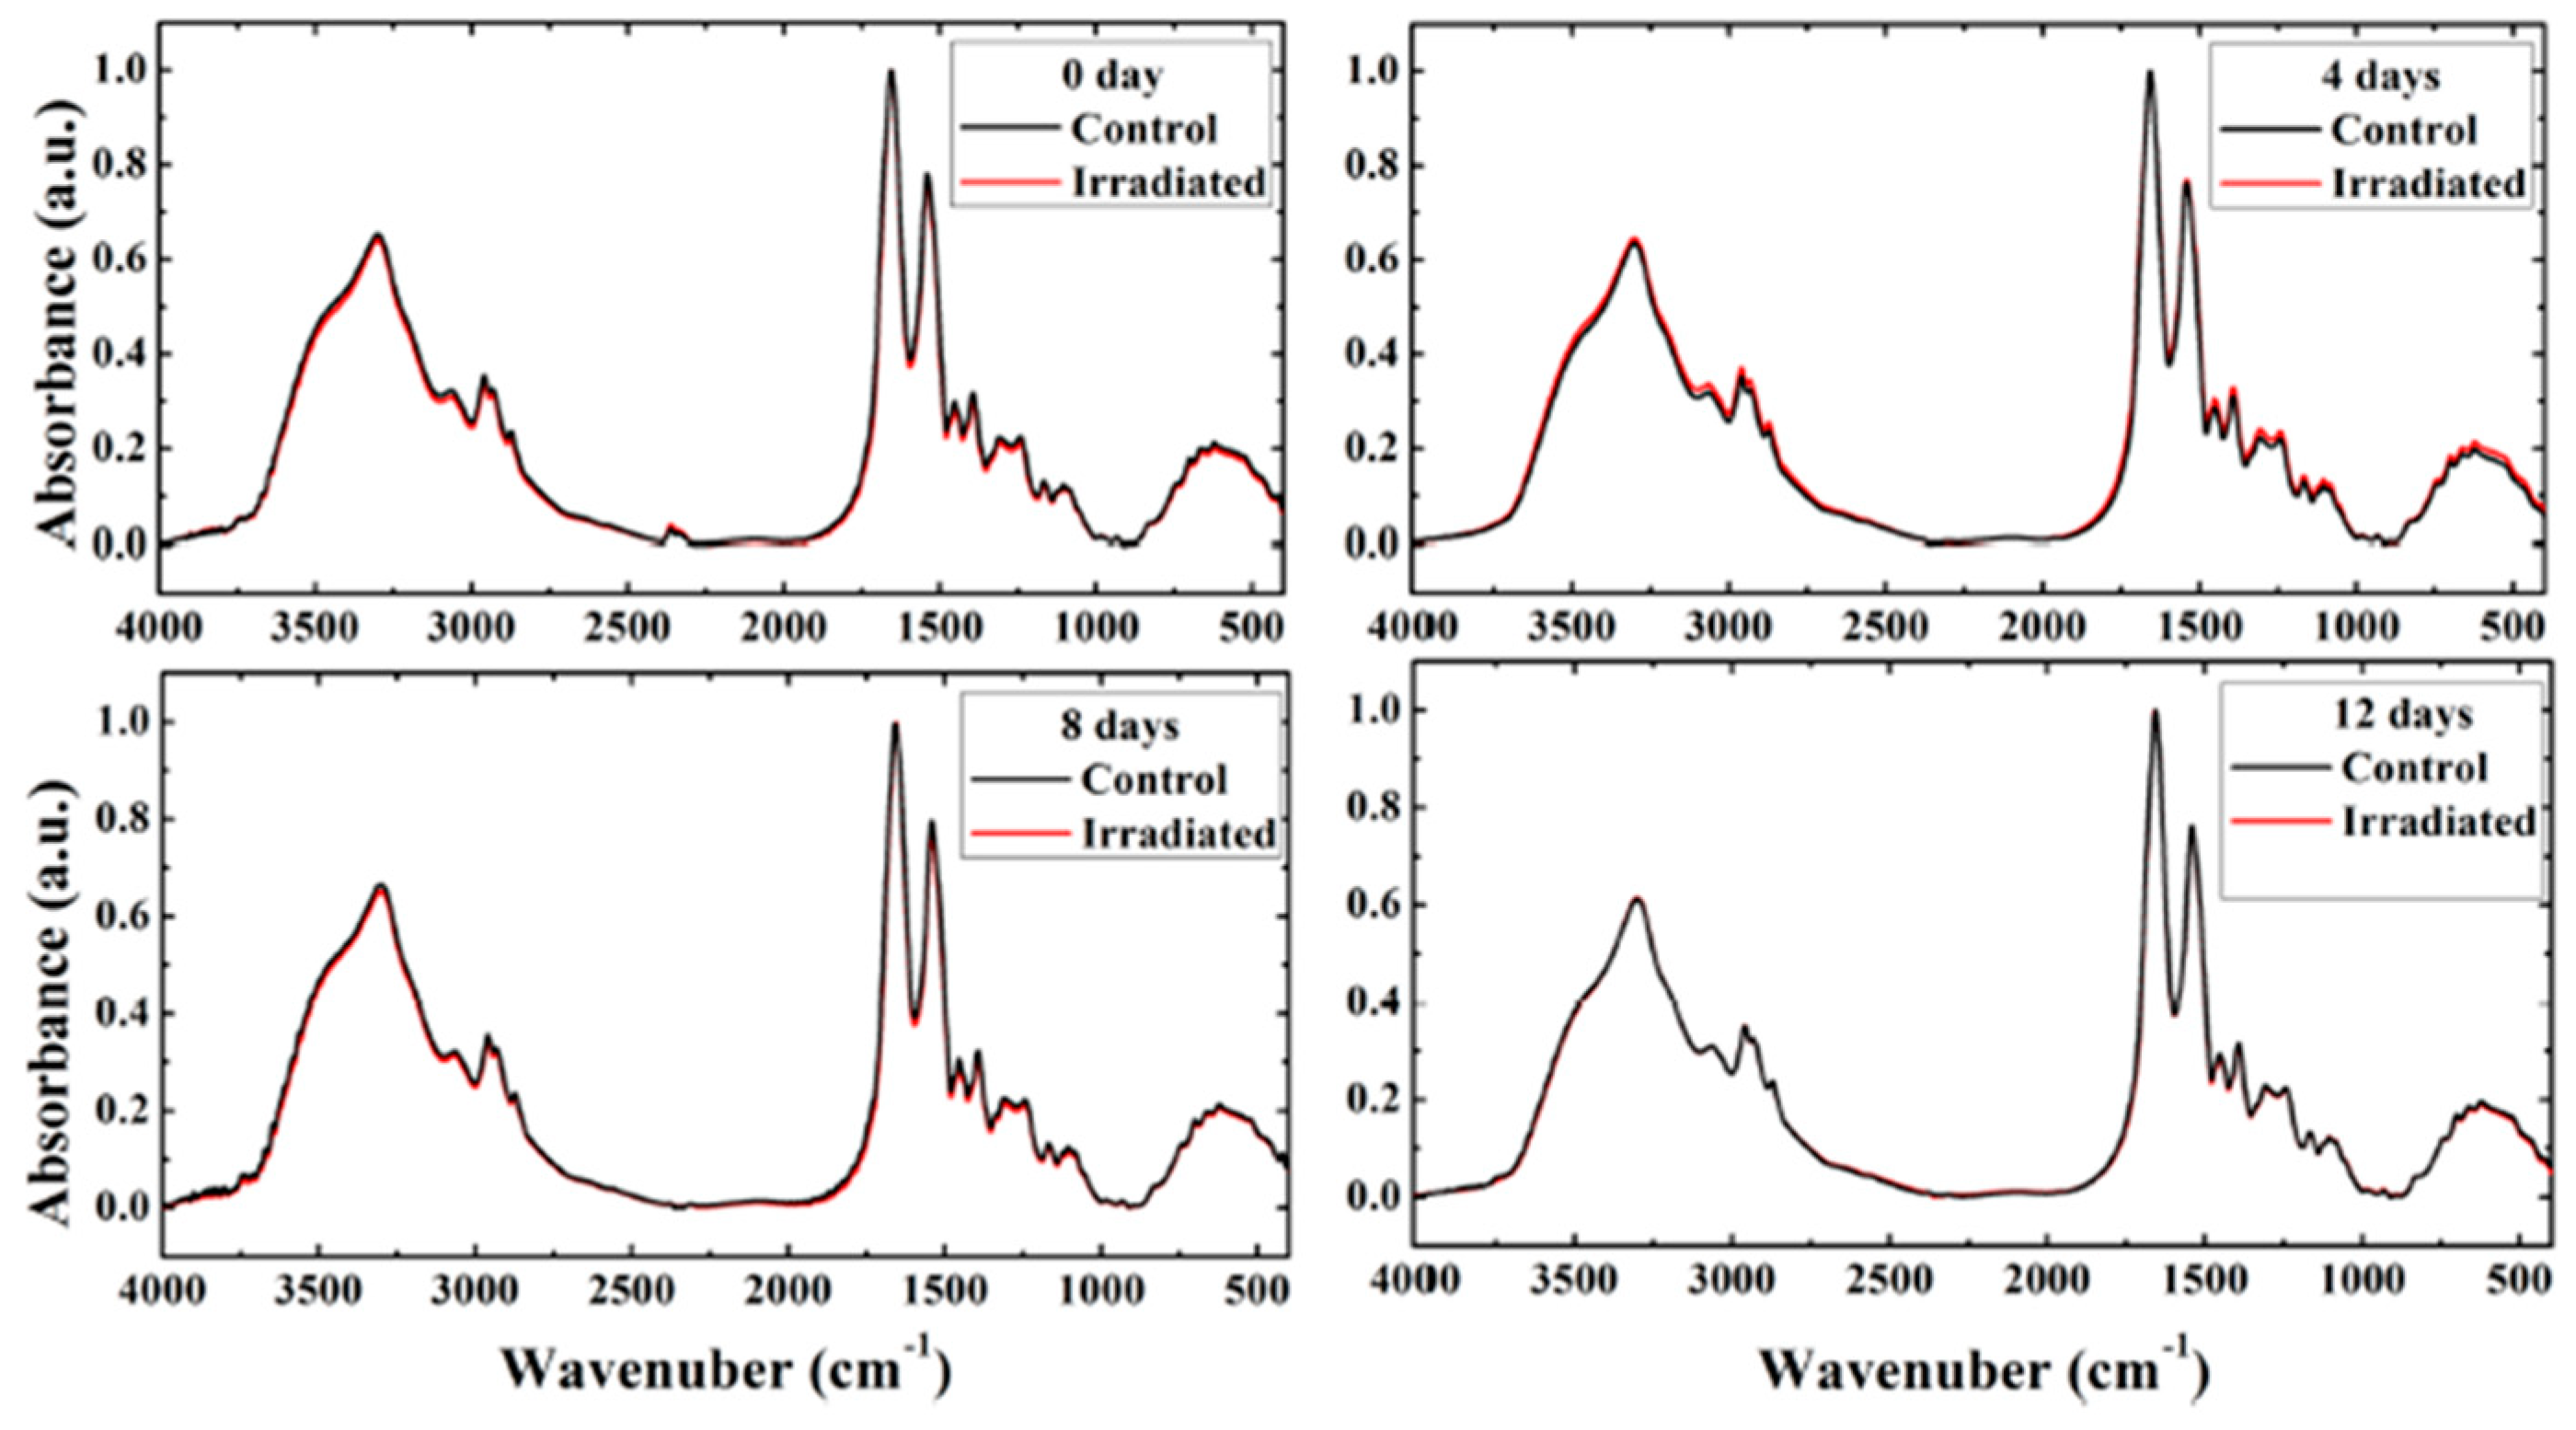
Saeed et al. adopted FT-IR spectroscopy to study the effects of very low doses of fast neutrons on cell membranes and protein secondary structures in rat erythrocytes [
38]. In this case, twelve female Wistar rats were irradiated with neutrons at a total dose of 0.009 Gy (241Am-Be, 0.2 mGy/h), and twelve others were used as control. After irradiation, peripheral blood samples (3 mL) were collected and after centrifugation, the plasma was removed, and the mononuclear cells were separated. Lyophilized erythrocytes were mixed with KBr to prepare the KBr discs for FT-IR spectra acquisition in transmission mode. The spectra were collected at different times after the exposure and the average spectra are reported in
Figure 5.
In
Figure 5, the average FT-IR spectra of the control and irradiated erythrocytes in the range of 4000–400 cm
−1 are reported for different times after irradiation (0, 4, 8, and 12 days). The spectra of irradiated samples show negligible changes compared with those of the control and they are nearly superimposed. Only the spectrum obtained from the irradiated sample at 4 days after irradiation evidences small changes in the intensity of the bands and their spectral position when compared to the control spectrum. To evidence the changes, FT-IR spectra were analyzed by using a second derivative and curve fitting to obtain the peak positions and the area of selected bands related to the main groups of lipids (CH
3, CH
2 symmetric and asymmetric), ester carbonyl (C=O), and the protein bands. See Figures 2 and 3 in Ref. [
38]. This analysis indicated that the most significant changes in the cell membrane and protein secondary structure induced by neutron exposure were present in spectra collected 4 days after irradiation. In this case, the authors noticed that membrane polarity, phospholipid chain length, packing, and unsaturation increased. A similar trend was also obtained by examining the values of corresponding band area ratios. The authors indicated that this evidence can be related to membrane lipid peroxidation processes. Indications about changes in membrane fluidity can also be obtained by considering the shift in symmetric and asymmetric CH
2 stretching bands toward lower wavenumbers. Amide I curve fitting showed percentage changes occurring for the area of α-helix and β-structure protein secondary structures, which can be due to protein denaturation processes. By considering the above briefly summarized results, the authors deduced that very-low-dose fast neutrons can induce oxidative stress to the irradiated erythrocytes, which is better evidenced by the FT-IR spectra of samples collected 4 days after irradiation. The comparison with the results obtained from spectra acquired 8 and 12 days after irradiation indicates that repair processes could occur at longer times. The hierarchical cluster analysis was able to distinguish only spectra acquired from irradiated and control samples 4 days after irradiation [
38].
The same group of researchers successively used FT-IR spectroscopy to study the effects of very-low-dose fast neutrons focusing their attention on the DNA in peripheral blood mononuclear cells (PBMCs) from exposed and unexposed rats [
39]. For this investigation, seven female Wistar rats were irradiated with neutrons of 0.9 mGy (241Am-Be, 0.02 cGy h
−1), and seven others were used as control. After irradiation, 6 mL of peripheral blood samples were collected from anaesthetized rats; after extraction, PBMCs were lyophilized and mixed with KBr for subsequent FT-IR spectra acquisition in transmission mode in the 1300–900 cm
−1 wavenumber region. Also, in this case, FT-IR spectra were analyzed by using curve fitting to obtain the peak positions and the area of selected bands in the 1070–970 cm
−1 region. The results of this analysis are reported in
Table 2.
In
Table 2, the most important changes regard the increase in the area of the ν
s (PO
2−) band related to the phosphodiesters of nucleic acids. Also, a noticeable increase in the area of the ν (C–O) band that belongs to the RNA ribose can be observed in the irradiated groups, while a significant decrease in the ν (C–O) band of DNA deoxy ribose is observed. No significant changes were recorded in other bands. Also, the values of the ratio between selected bands show significant changes, as evidenced in Table 3 of Ref. [
39]. In fact, significant increases in the values of the band area ratio of RNA/DNA and phosphodiesters/carbohydrates of the nucleic acid for exposed samples can be observed.
A hierarchical cluster analysis (HCA) performed on the second derivative of FTIR spectra in the wavenumber region from 1200 to 1000 cm−1 indicates that there are differences between the DNA of PBMCs from unexposed and exposed rats. This is further evidence that low doses of fast neutrons induce changes in the DNA structure of the PBMCs.
The results of a larger investigation on the effects induced on the protein components of PBMCs by low doses of fast neutrons are reported by [
40]. For this study, 64 Wistar rats were used. A total of 32 rats were exposed to fast neutrons at a total dose of 10 mGy (241Am-Be, 0.2 mGy/h), and the other 32 were used as controls. Samples were prepared and examined as in Ref. [
39]. FT-IR spectra revealed alterations in the protein structure at time intervals for the samples collected 2 and 4 days post-irradiation. In particular, the FT-IR protein analysis showed increases in the percentage areas of aggregated strands and antiparallel β-sheet structures and showed decreases in the β-sheet structures. The increase in aggregated strands and antiparallel β-sheet structures can be due to abnormalities in proteins such as amyloidosis, while the decrease in the β-sheet and increase in the aggregated β-sheet structure can be attributed to protein denaturation. No significant changes between control and irradiated groups were evidenced in spectra acquired from samples collected 8 days after irradiation, indicating the occurrence of repair processes. Confirmations of the effects induced on proteins in the PBMCs of rats by exposure to low-dose fast neutrons have been also obtained by Comet assay and fluorescence [
40].
Using the same experimental conditions, the changes induced in the lipid components of PBMCs of rats were examined by Saeed and Abolaban [
41]. In this paper, the regions of 3030–2800 and 1480–1040 cm
−1 containing the features of lipid hydrocarbon chains and phospholipids were analyzed and the total phospholipid content was estimated by using a spectrophotometric assay [
42]. The FT-IR analysis indicates a decrease in the lipid content and the occurrence of significant changes in their molecular structure for samples acquired 2 and 4 days after exposure. On the contrary, no changes are detected between control and irradiated samples acquired 0 and 8 days after irradiation. These results suggest that the phospholipids of the PBMC membrane are affected by the action of ROS generated by water-fast neutron radiolysis. HCA and Principal Component Analysis (PCA) were also used in the 3020–2800 cm
−1 spectral range to distinguish the cell membranes of PBMCs of irradiated rats from cell membranes of PBMCs of not irradiated animals. The different behavior evidenced for samples acquired 2 and 4 days and samples acquired at 0 and 8 days after irradiation can be ascribed to the occurrence of direct or indirect effects and repairing mechanisms in cells.
The effects of low doses of X rays have been investigated by using FT-IR data in a series of papers devoted to the study of radioadaptive responses. In the first of these papers, the authors irradiated rats using different X-ray levels. In the low-dose range, they used 10cGy and examined dried intestine tissue samples using KBr pellets and spectra were acquired in transmission mode [
43]. FT-IR data prove the induction of lipid peroxidation and disorder in the unsaturated lipids in the samples of all of the irradiated groups as compared with the sham-irradiated group. Lipid peroxidation was evidenced by the decrease in total lipid content, a decrease in the degree of lipid unsaturation, characterized by the increase in the ratio of saturated/unsaturated acyl chains, and the decrease in the integrated area under the olefinic=CH absorption band. This effect was associated with significant reductions in the length of phospholipid hydrocarbon chains in all the irradiated groups. The results also indicate a decrease in the fluidity of cell membranes and possible changes in protein secondary structures. No adaptive response was observed when a dose of 10 cGy preceded a dose of 2 Gy. However, 10 cGy-induced effects are equivalent to, and sometimes even greater than, the 2 Gy dose. In a subsequent study, Abdelrazzak et al. confirmed the results obtained by FT-IR spectroscopy with those obtained from dielectric measurements and biochemical tests [
44,
45].
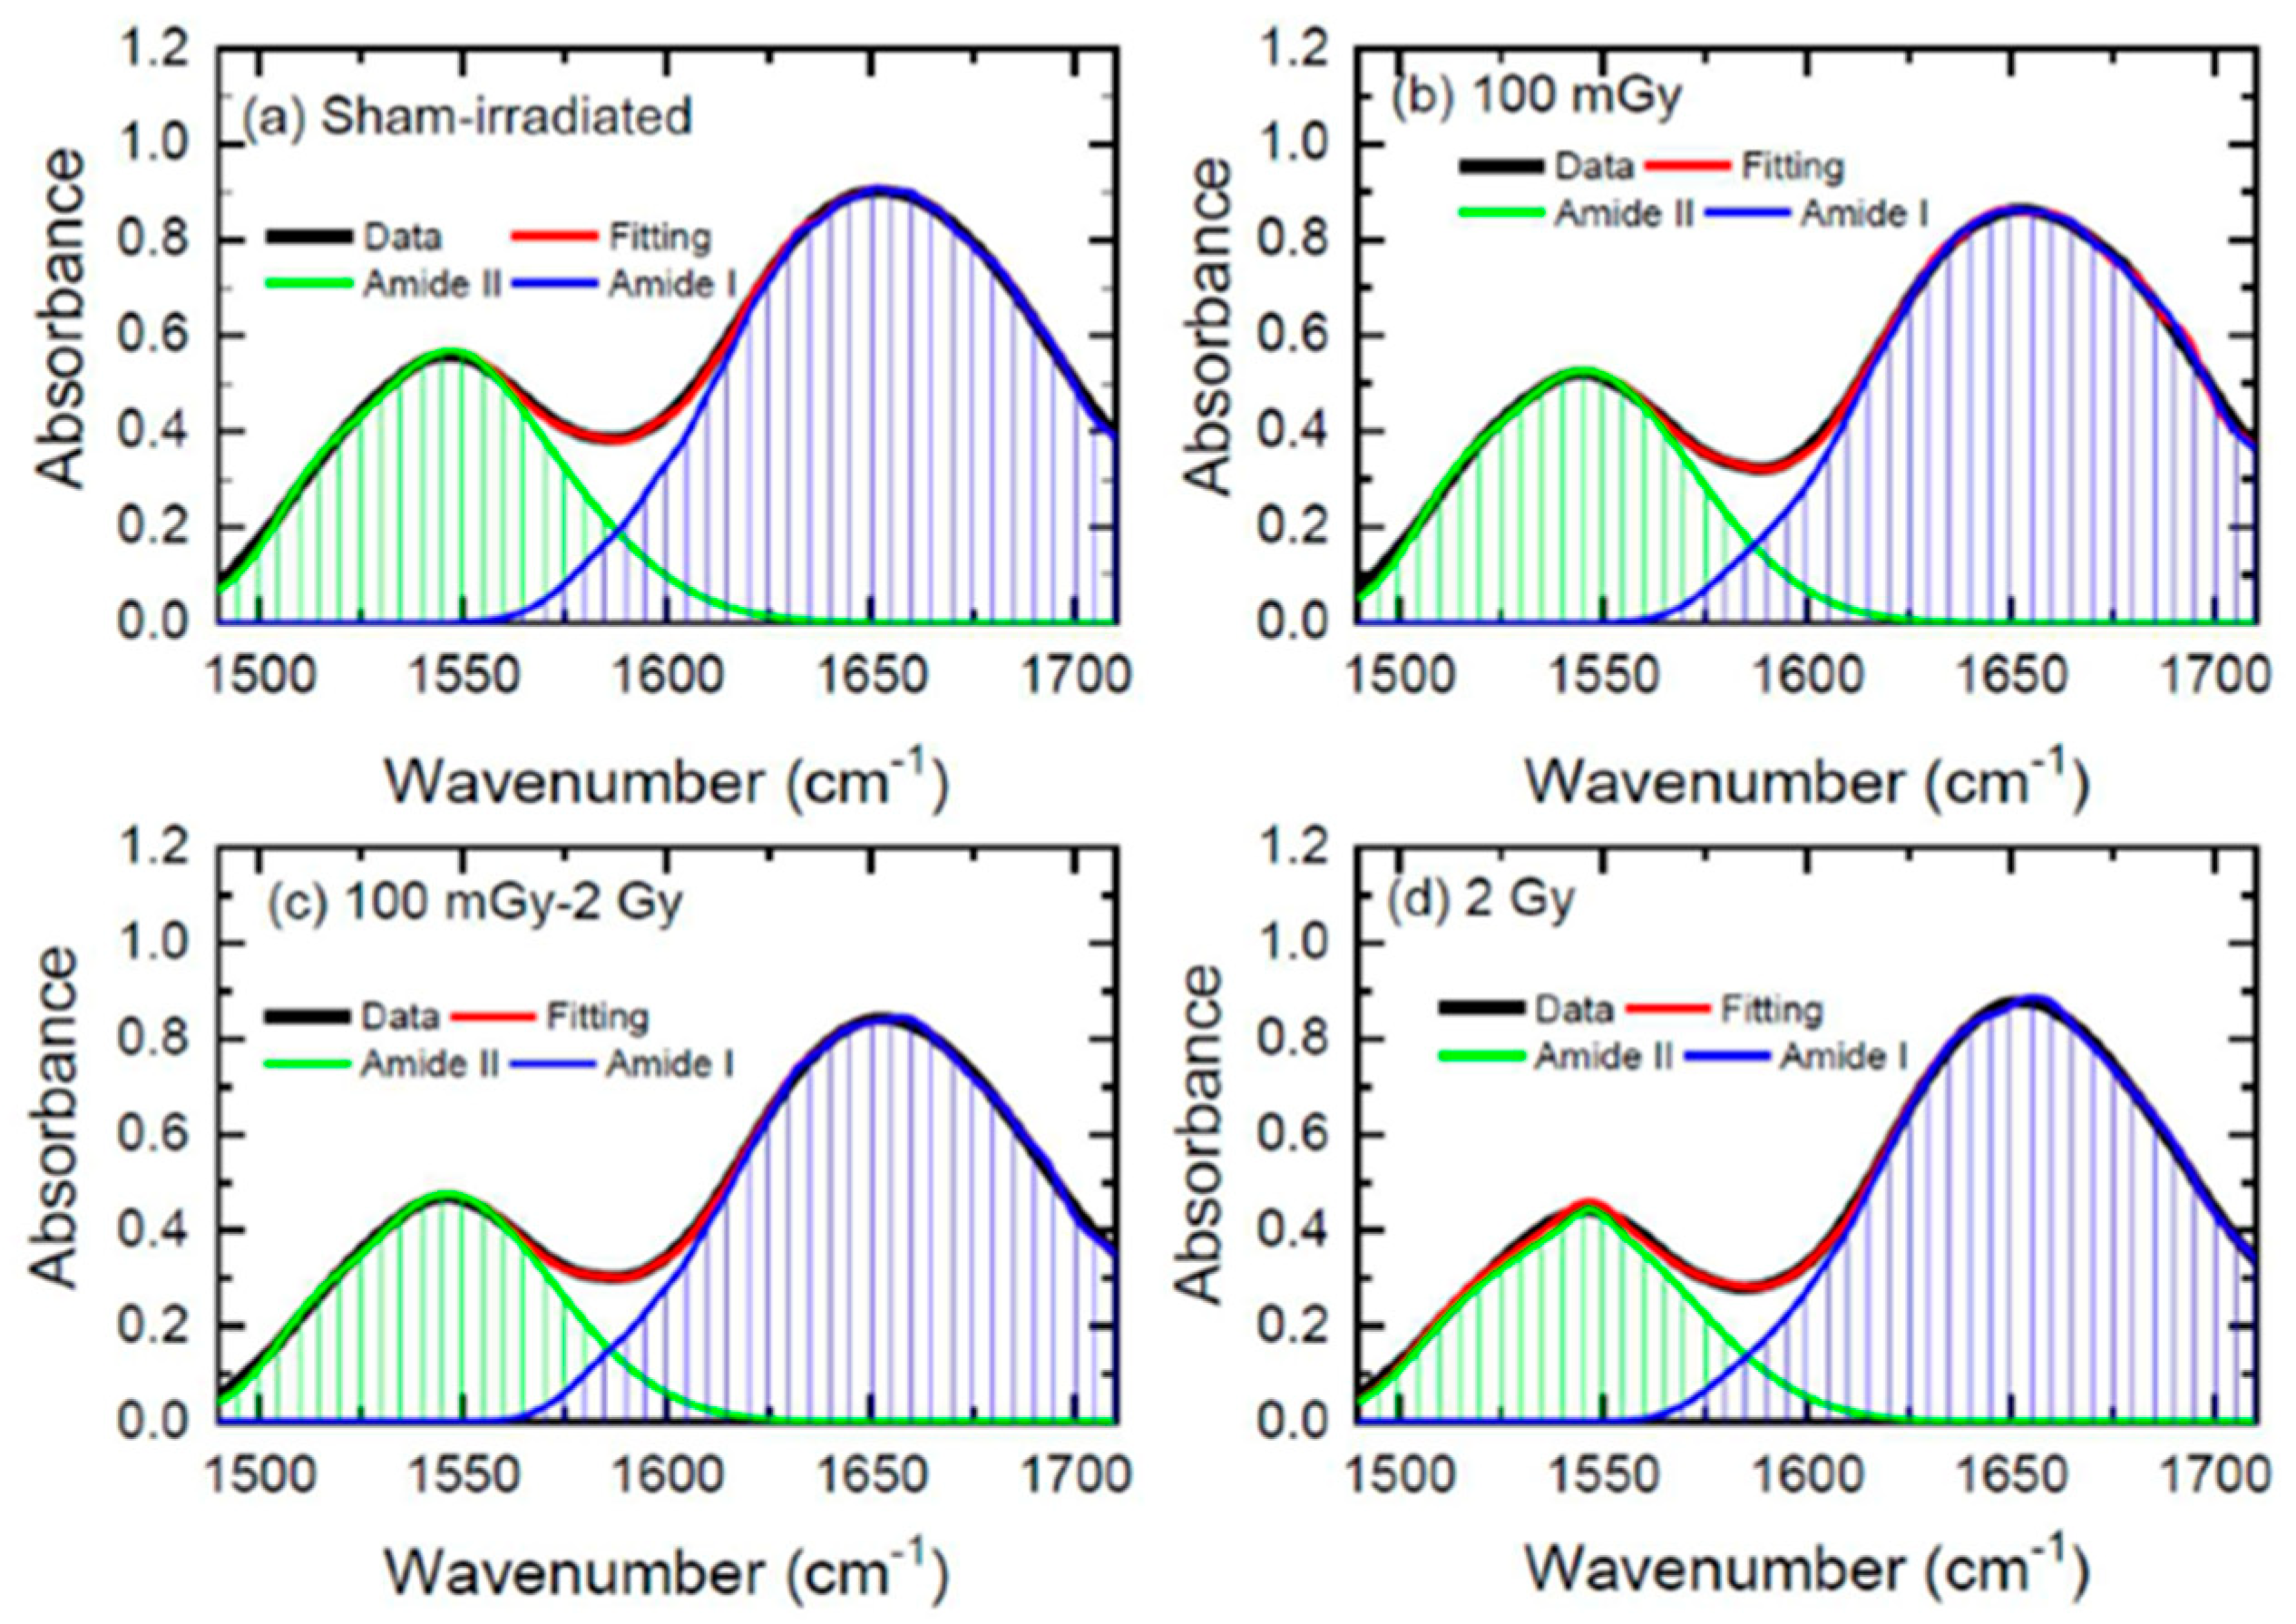
In a very recent study, FT-IR spectroscopy was used to study the induction of radiation adaptation in the form of reduced changes in protein secondary structures in the kidneys of rats subjected to low-dose irradiation. After irradiation, the rats were sacrificed, and kidney sections were collected and freeze-dried for FT-IR analysis in transmission mode. In this case, low-dose total-body irradiation with 100 mGy X-rays did not cause significant changes in protein conformation compared to the sham-irradiated group but provided a clue of the radioadaptation effect induced by the 100 mGy X-ray delivered before the higher 2 Gy dose [
46]. In this paper, the authors focused their attention on the decrease in the alterations of protein secondary structures to demonstrate the induction of radioadaptation. The Amide I and Amide II bands were deconvoluted using Lorentz functions and the various components of the protein secondary structures were extracted. In
Figure 6, the Amide I and Amide II bands are reported together with the results of the fitting procedure.
In Ref. [
46], the authors evaluated the ratio between the β-sheet and α-helix components of Amide bands using the above-mentioned deconvolution procedure. They reported that when the 2Gy irradiation was preceded with a smaller dose of 100 mGy, or when the animals were irradiated with the low dose only (100 mGy), no change in the ratio was observed, which was different from the case in which the animals were irradiated with the 2 Gy dose.
Another very recent paper employs FT-IR spectroscopy to investigate the long-term effects of low-dose ionizing radiation exposure in mouse ear pinnae [
47]. FT-IR was used to repeatedly measure the stratum corneum of mouse ear pinnae positioned under the Attenuated Total Reflectance (ATR) objective on the stack of the microscope after exposure to various doses of X-rays: 0, 0.1, 0.5, 1, and 2 Gy (total body irradiation) at 5, 14, 21, 49, and 90 days post-irradiation. In
Figure 7, the experimental procedure is schematically represented.
The differences in the second derivative spectra reveal clear spectral changes associated with DNA damage, lipid oxidation and accumulation, and post-translational protein modifications. In particular, the comparative analysis of the second derivative spectra reveals a slight shift in the asymmetric O-P-O stretching band from approximately 1236 cm−1 (0 Gy) to approximately 1240 cm−1 (0.1–2 Gy) and intensity increases, suggesting that the phosphate groups are less hydrogen-bonded; this could cause changes in the DNA backbone geometry and consequently the DNA conformation transition from the predominant B-DNA to the A-DNA. Furthermore, the analysis of the second derivative spectra reveals that the 0.1–2 Gy group exhibits increased peak intensities of the CH2 and CH3 stretching modes at 2923 cm−1 and 2852 cm−1 and bending modes at about 1458 cm−1, indicating lipid accumulation and increased lipid metabolism.
In
Table 3, the main results reported in the papers previously discussed are summarized together with some details about the spectra collection mode, the irradiation sources, the doses, and the kind of examined samples.
Table 3.
A summary of the main results obtained by using FT-IR spectroscopy to investigate the effects induced in human cells and tissues by low doses of ionizing radiations [
37,
38,
39,
40,
41,
43,
44,
46,
47].
Table 3.
A summary of the main results obtained by using FT-IR spectroscopy to investigate the effects induced in human cells and tissues by low doses of ionizing radiations [
37,
38,
39,
40,
41,
43,
44,
46,
47].
Collection
Geometry | Irradiation Source and
Doses | Investigated
Samples | Main Results | Refs. |
|---|
| Transreflection | γ-radiation
5–200 mGy | human keratinocyte
cell line | nonlinear changes in the biochemical fingerprint occurring with dose and time after irradiation; potential applications in radiobiological dosimetry | [37] |
| Transmission | neutrons
9 mGy | rat’s lyophilized
erythrocytes | alterations in the cell membrane and protein secondary structure; increase in membrane polarity, phospholipids chain length, packing, and unsaturation, probably due to the membrane lipid peroxidation; decrease in membrane fluidity; oxidative stress | [38] |
| Transmission | neutrons
9 mGy | rat’s peripheral
blood mononuclear
cells and leukocytes | differences in the DNA structures; increase in the area of phosphodiesters of nucleic acids and the area ratios of RNA/DNA and phosphodiesters/carbohydrates; low-level damage, double-strand break, and chromatin fragmentation of DNA of leukocytes | [39] |
| Transmission | neutrons
10 mGy | rat’s peripheral blood mononuclear cells | differences in protein secondary structure | [40] |
| Transmission | neutrons
10 mGy | rat’s peripheral blood mononuclear cells | significant changes in the molecular structure of lipids; free radicals’ production indirectly affecting the molecular structure of the lipids: and phospholipids molecules damage; damage repair processes | [41] |
| Transmission | X-rays
10 cGy | rat’s small intestine
tissues | induction of lipid peroxidation and disorder in the unsaturated lipids; decreases in the length of phospholipid hydrocarbon chains; decrease in the fluidity of the cell membrane; alterations in the secondary structure of proteins. | [43] |
| ATR | X-rays
10 cGy | rat’s lung tissues | increase in cellular membrane fluidity | [44] |
| Transmission | X-rays
100 mGy | rat’s kidney tissues | whole-body irradiation with 100 mGy did not induce significant modification in the protein conformation | [46] |
| Micro-ATR | X-rays
0.1 to 2 Gy | mouse ear pinnae | biological changes in DNA conformation; lipid oxidation and accumulation; changes in protein secondary structure | [47] |
From the inspection of
Table 3, it is evident that low doses of different ionizing radiation have been investigated. In some cases, the dose range also includes doses higher than the value generally assumed for low doses (100 mGy). Different cell lines and tissues have been investigated, taking advantage of the different spectra collection geometry available for FT-IR spectroscopy. All the examined studies confirm that this technique can offer interesting results regarding DNA and protein components. Also, the different effects induced in lipids have been clearly evidenced.
5. Representative Results of Raman Micro-Spectroscopy Investigations on Effects Induced by Ionizing Radiation Low Doses
As said before, RMS has been widely used to analyze radiobiological effects on various cell lines. Still, the majority of the studies rely on the effects of high-dose (>1 Gy) exposures and only a few are about the investigation of cell response to low radiation doses (<1 Gy). The first one among these latter studies was published in 2015 by Maguire et al. [
48]. They reported an in vitro RMS study of the ionizing radiation effects on peripheral blood lymphocytes derived by a cohort of healthy donors that were irradiated (0.05 and 0.5 Gy) 17 h after plating using a cobalt-60 gamma ray teletherapy source (dose rate approximately 1.5 Gy/min). Irradiated and non-irradiated (used as control) lymphocytes were placed in an incubator at 37 °C for 60 min, at which time cells were fixed using 2% paraformaldehyde in PBS. From each resulting suspension, a 40 μL-aliquot was dropped onto calcium fluoride (CaF
2) slides. Using the resulting samples, Raman spectra were recorded from individual cells, including signals from both its nucleus and cytoplasm, by a commercial RMS system equipped with a 660 nm solid-state diode laser delivering 100 mW of power to the sample. Depending on the irradiation treatment, different intensities are observed for some Raman features, mainly those related to DNA/RNA, suggesting DNA damage that is also confirmed by γ-H2AX assay results. The changes in spectral profiles resulted in being highly variable from individual to individual, matching the γ-H2AX interindividual variability. The results demonstrated that RMS can detect the changes due to cell responses for doses as low as 0.05 Gy. This study also demonstrated the capability of Raman spectroscopy combined with PCA followed by Linear Discriminant Analysis (PCA-LDA) for classifying control samples against irradiated samples with doses as low as 0.05 Gy in individuals.
Allen et al. [
49] used RMS to investigate the effects of various doses of X-ray radiation, ranging from 0.01 Gy to 5 Gy, on human lens epithelial (HLE) cells, chemically fixed 24 h after irradiation. Cells adhered to quartz coverslips were irradiated at a dose rate of 38.2 cGy min
−1 (at 120 kVp), with low-dose (0.25 and 0.5 Gy), and high-dose (2 and 5 Gy) X-rays with additional exposures at 0.01 Gy and 0.05 Gy, to measure the Raman response at ultra-low doses. Raman spectra were acquired from the nucleus and cytoplasm regions of the HLE cells by using a 785 nm laser, the power below the objective being 30 mW. The raw spectra were preprocessed and PCA-LDA was used to carry on binary discrimination between the dose versus control spectra from the nucleus and cytoplasm. The authors also analyzed the difference spectra between spectra from the control and irradiated cells. By this approach, changes in the Raman spectra at low and high doses were observed, and the discriminating Raman bands were identified for each dose compared to the control. The ten most prominent Linear Discriminant loadings, in terms of magnitude, were found for both the nucleus and cytoplasm and are given in the manuscript’s
Table 2 and
Table 3, respectively, along with their molecular assignments in terms of contributions due to single nucleotide bases (adenine, uracil, thymine, cytosine, guanine), proteins, lipids, saccharides, metabolites, DNA, or RNA. These tables also report details about the “sign” of the loading features (positive and negative loadings), indicating whether the contribution for the given dose is higher or lower relative to the control spectrum. By analyzing the results, the author concluded that the HLE cells display increased radio-resistance at low (0.25 and 0.5 Gy) and ultra-low (0.01 and 0.05 Gy) doses. Notably, the authors showed that the variation in some of the Raman spectroscopic features with dose is in excellent agreement with the induced repair model of cell survival.
The molecular and biochemical changes in dental pulp stem cells (DPSCs) due to consecutive low-dose ionizing radiation exposures were investigated using RMS by Simon et al. in 2018 [
50]. DPSCs were irradiated by X-rays using a cone beam computed tomography (CBCT) machine at a radiation dose of 33.59 mGy (±2.58 mGy), corresponding to three consecutive CBCT exposures. The authors were motivated to conduct this study due to the effects and health consequences involved in the use of this diagnostic imaging procedure. Cells were fixed 30 min after irradiation and Raman spectra and mapping images were then obtained by exciting samples with the 785 nm line of a diode laser (300 mW power). By taking advantage of the analysis of median spectra and difference spectra between spectra from the control and irradiated cells by using PCA as well, the authors identified Raman biomarkers characteristic of the low-dose cone beam computed tomography (CBCT) irradiation of the DPSCs. The biomarkers were monitored inside the cells using the relative intensity distribution of the 785 and 1734 cm
−1 bands. The first is assigned to O–P–O backbone molecular vibrations of DNA and ring breathing modes of nucleic acid bases in DNA and RNA, and it was used by the authors as an indicator of DNA/RNA. Its relative intensity was higher in the control cells, whereas the irradiated cells presented a much smaller area of the nucleus, as identified in the obtained Raman maps. The feature located at 1734 cm
−1 is attributed to the C=O stretching of lipids and was used to monitor the distribution of lipids in the healthy and low-dose irradiated cells and as a marker for lipids when also comparing the Raman maps of cells that underwent different treatments. An increased intensity of this band is observed in the irradiated cell compared to the healthy sample. Moreover, when using this feature for obtaining a Raman map of the cells, the endoplasmic reticulum was identified, as well as lipid vesicles. The results indicate that RMS could be successfully used as an efficient alternative method for the identification of molecular biomarkers specific to the cumulative effects of ionizing radiation in stem cells.
The effects of low-dose X-ray irradiation due to the same diagnostic imaging technique (CBCT) were investigated by Colceriu-Simon et al. [
51] using surface-enhanced Raman spectroscopy (SERS) to study body fluid, namely, salivary samples of pediatric patients (PP) who had undergone a CBCT examination. The SERS spectra of samples obtained from PP before and after CBCT low-dose IR exposure were acquired by excitation with the 785 nm diode laser (65 mW power at the sample). The dried saliva sample was deposited on a homemade SERS substrate based on calcium fluoride (CaF
2)-polished glass coverslips decorated with silver nanoparticles.
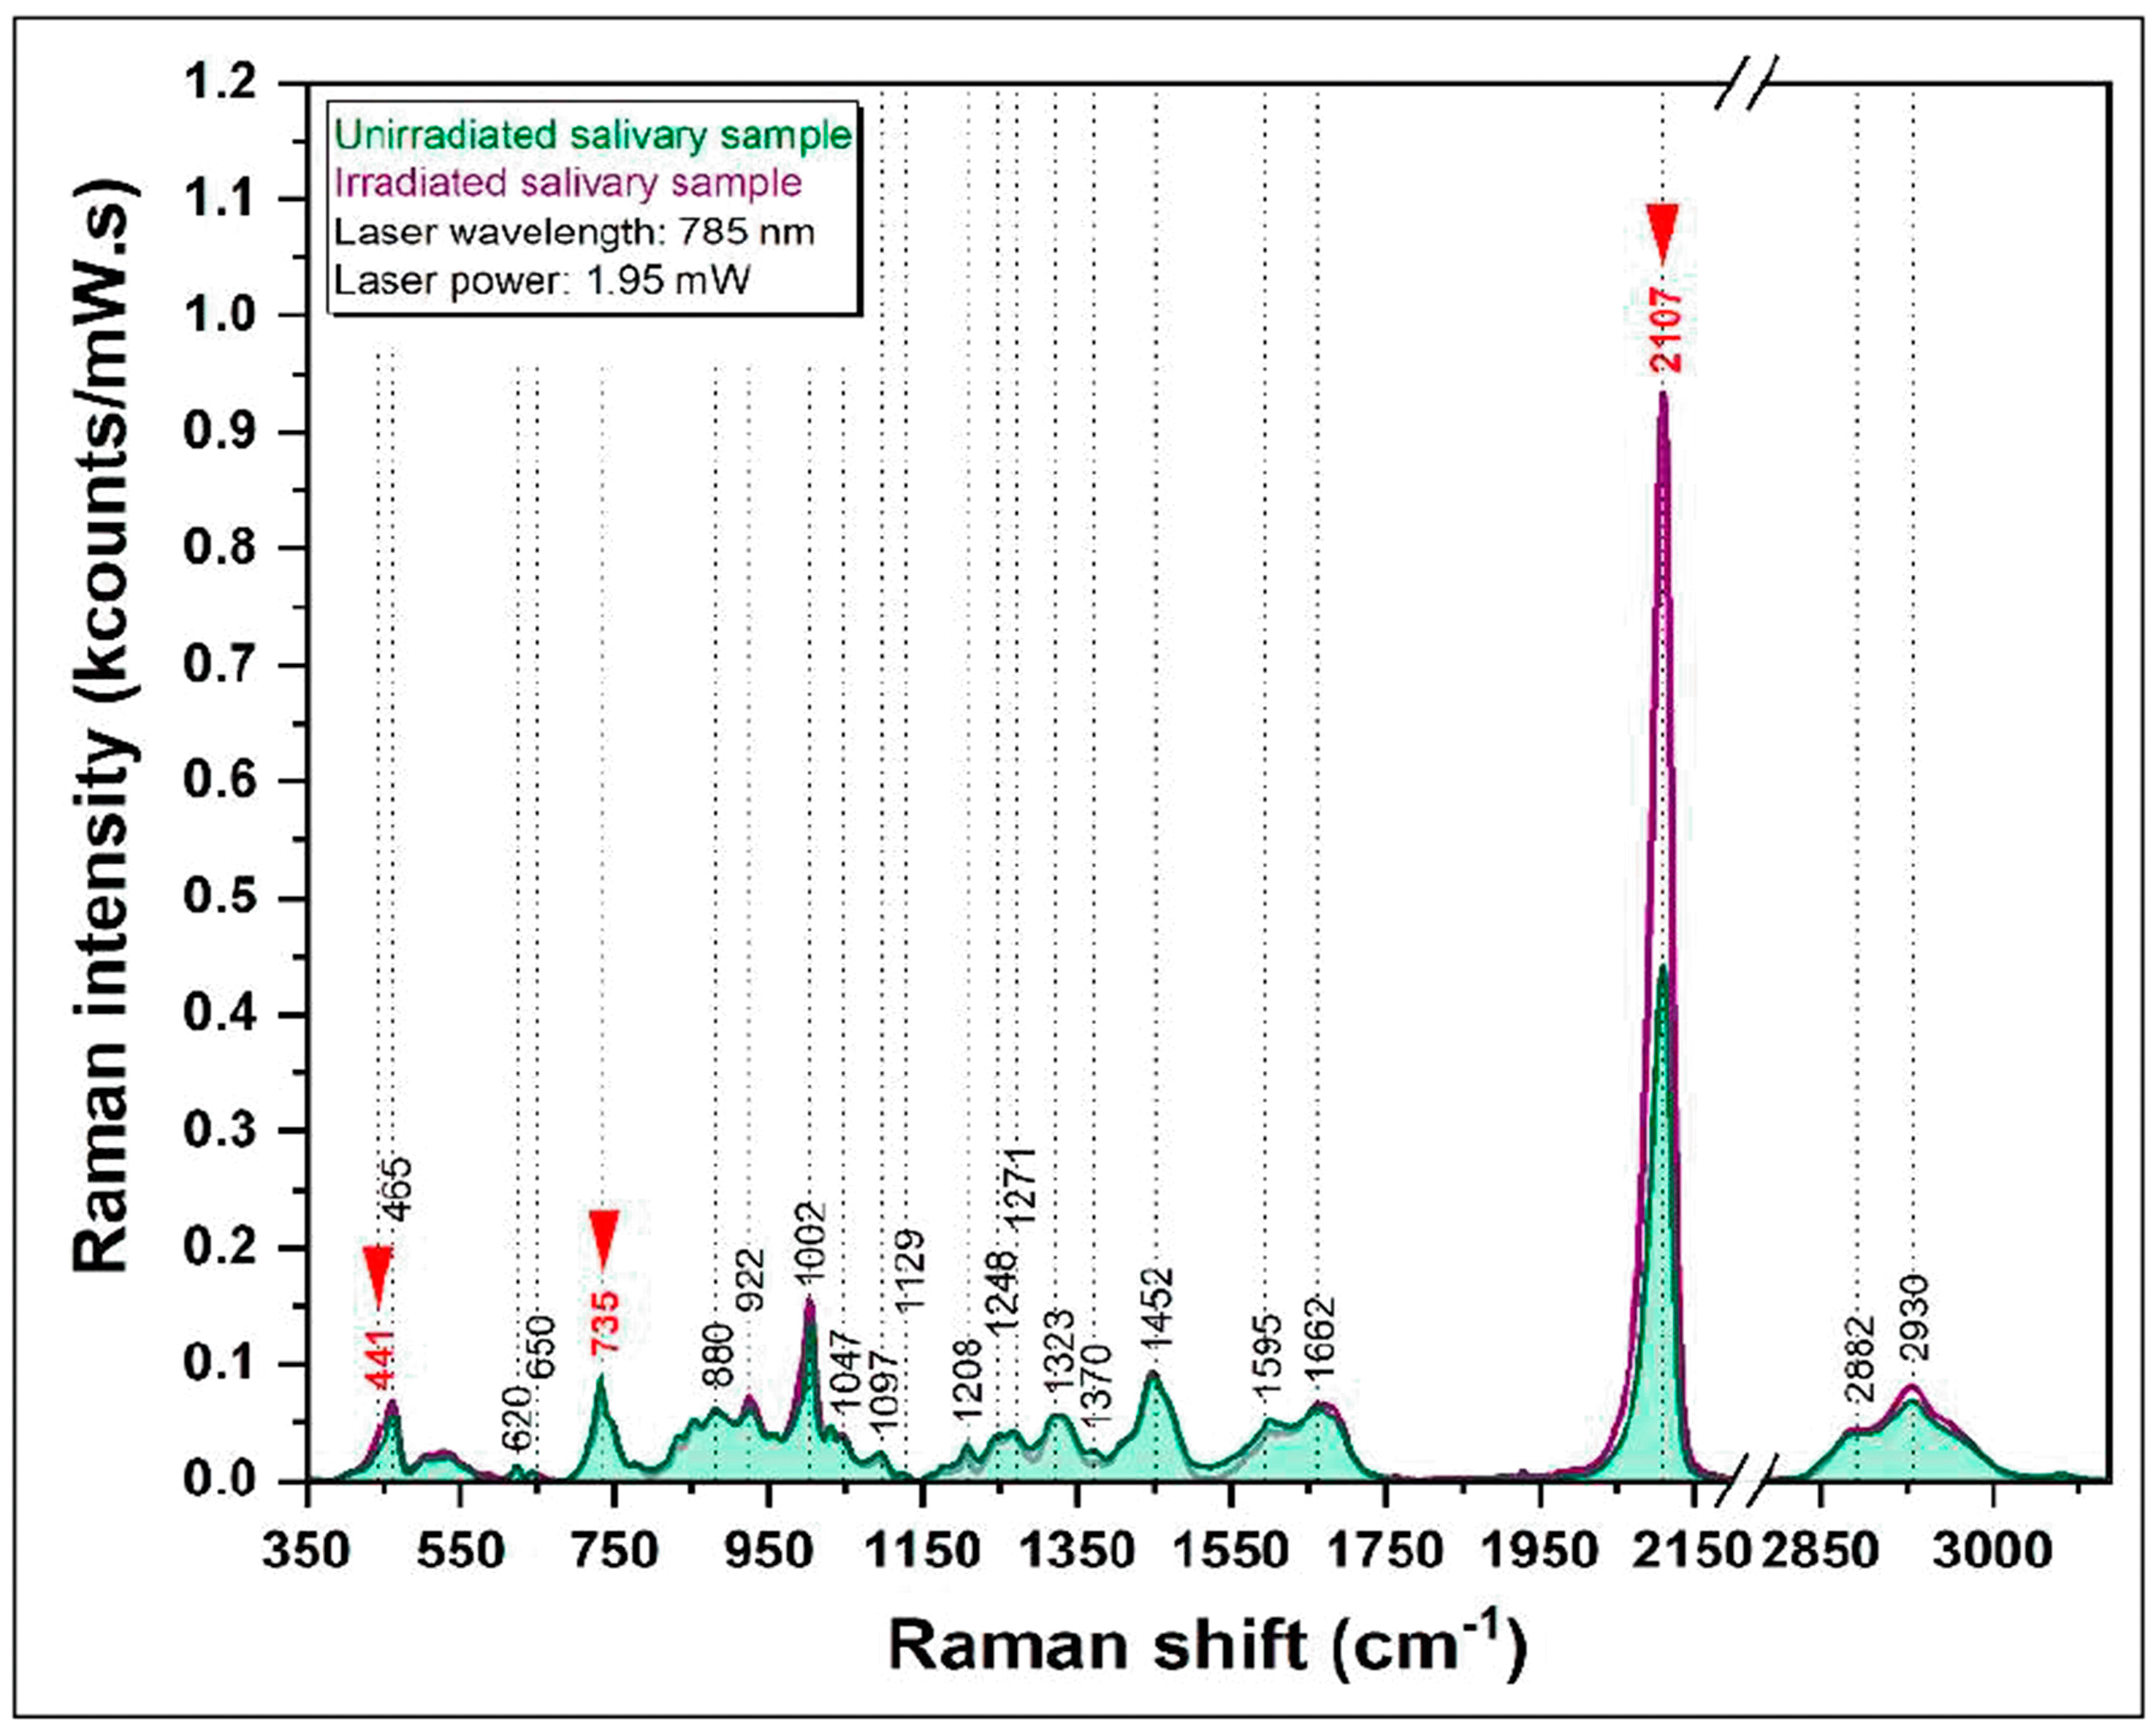
In
Figure 8, the SERS spectra from a salivary sample before and after irradiation are reported. The SERS spectra are dominated by several vibrational bands, including those due to thiocyanate (SCN
−), a molecule with the antioxidative capacity to scavenge oxidizing agents. Comparing the SERS spectra of saliva samples from PP before and after the CBCT examination, the only peak that showed a greater intensity in all the samples of the irradiated group is the one related to the -C=N stretching of thiocyanate (located at 2107 cm
−1). This evidence was discussed as an indication of an increase in SCN concentration in saliva induced by irradiation due to the activation of the salivary antioxidant system.
In addition to the effects of low-dose ionizing radiation on cells and salivary samples, a study about the impact on tissues was reported. Santos et al. investigated the effects of low-energy radiation in adipose and muscular tissues (from a commercial porcine belly sample) by employing autofluorescence and RMS techniques [
52]. Different X-ray radiation doses (0.11, 1.1, and 2.1 Gy) were used. Raman signal dependence on the radiation dose was investigated using PCA. Raman spectra were acquired using an 830 nm excitation laser. Raman spectroscopy suggests that low-dose irradiation changes the collagen, proteins, amino acids, NAD/NADH, and lipid bands at different degrees. Some band intensities increase after irradiation, while others decrease. Also, the autofluorescent analysis outlined variations in the collagen and nicotinamide adenine dinucleotide emission (NADH), resulting from the structural modifications, and variations in the reduced/oxidized fluorophores equilibrium followed by radiation exposure.
The question of studying low-dose irradiation effects by RMS was also approached by using Monte Carlo (MC) simulations to investigate the microdosimetric spread across populations of microscopic targets relevant to RMS studies of cellular radiation response [
53]. Oliver and Thomson performed MC simulations enabling them to demonstrate the possible presence of the considerable variation in energy deposition (microdosimetric spread) throughout populations of µm-sized targets relevant for RMS studies of cellular responses to radiation. The microdosimetric spread increases with a decreasing (macroscopic) absorbed dose, target size, and incident photon energy. The observed variations highlight the importance of microdosimetric considerations (i.e., considering the stochastic nature of radiation transport and energy deposition) for RMS and other studies using microscopic sampling volumes and low doses. The results also provided a guide for researchers in the field of RMS, pointing to the importance of the choice of the number of measurements, size of sampling region, and signal averaging method.
In
Table 4, the main results reported in the papers concerning RMS that have been previously considered are summarized. In this Table, the characteristics of the laser sources used to acquire spectra are reported. As expected, visible and near infrared lasers have been adopted to acquire spectra to minimize fluorescence contributions.
The most largely investigated irradiation source is represented by X-rays. As indicated for FT-IR spectroscopy, also in this case, the investigated dose range considers values higher than the limit value assumed for low doses. The samples examined include different cell lines, tissues, and biofluids. In general, the results concern the different biological components (DNAs, proteins and lipids), and the occurrence of changes is often evidenced by carefully selecting suitable data analysis procedures.
6. Conclusions
In this brief review, the most relevant papers devoted to the study of the effects induced by low doses of ionizing radiation by using FT-IR and RMS techniques have been reviewed. These two techniques have been already demonstrated to represent valuable tools in radiobiology (see Ref. [
17] and references therein), giving valuable information on DNA damage and lipid and protein alterations induced by radiation, offering the possibility to improve radiotherapeutic treatment plans. Moreover, FT-IR and/or RMS can be properly selected for a particular application in radiobiology by considering the typical experimental conditions adopted in one of these spectroscopies, the physics processes on which these spectroscopies are based, and the results previously reported. For example, it is possible to note that FT-IR signals are significantly higher than those detected in Raman measurements, but Raman spectra are generally characterized by narrow peaks that increase the selectivity in the identification of the different spectral contributions. Moreover, many commercial FT-IR spectrometers can acquire signals from areas that are around hundreds of μm
2. This makes it difficult to inspect subcellular regions or small regions in tissues. Conversely, RMS can examine regions with a spatial resolution of a few μm. FT-IR can also reach a similar spatial resolution, but in this case, synchrotron radiation sources should be used. In addition, FT-IR spectra can be only acquired from dried samples, differently from Raman spectroscopy, which allows the study of samples independently of their hydration state.
The results described in this review demonstrate that in the study of effects induced by low doses, vibrational spectroscopies can also give interesting results. In particular, further investigations could provide new insights into the description of the mechanisms by which low-dose ionizing radiation can induce damage to human organisms. As described in the initial section of this paper, these mechanisms cannot be explained by the classical “target theory” of radiation biology, through which deleterious effects such as mutation and carcinogenesis are attributed to direct damage to a cellular target, usually identified as nuclear DNA, and whose consequences are expressed in the surviving irradiated cells. When low-dose exposures are considered, specific cellular responses can be described in terms of radioadaptive responses, radiation-induced bystander responses, low-dose hyper radiosensitivity, and genomic instability. All these phenomena are considered radiation responses involving non-target molecules or molecules that have not directly interacted with the radiation.


