1. Introduction
Destination loyalty remains a central concern in tourism research because retaining previous visitors and encouraging positive word-of-mouth can contribute substantially to the long-term competitiveness of mature destinations. A large body of research has established that tourist satisfaction, destination image, perceived destination attributes, and travel motivations are associated with post-visit behavioural intentions, including revisit and recommendation intentions (
Bigné et al., 2001;
Yoon & Uysal, 2005;
Chi & Qu, 2008;
L. Wang & Li, 2023;
Ahn & Kim, 2024). Accordingly, the satisfaction–loyalty relationship itself can no longer be regarded as an unresolved question. The more relevant issue is whether the structural mechanisms through which satisfaction and its antecedents are associated with loyalty remain stable across visitors with different levels of previous destination experience.
Previous research provides substantial evidence that first-time and repeat visitors may differ in their destination evaluations, motivations, behavioural intentions, and loyalty patterns (
Oppermann, 2000;
Chi, 2012;
McKercher et al., 2012). Repeat visitation is therefore more than a descriptive characteristic of tourism demand. Accumulated destination experience may alter the relative importance of the cognitive and motivational factors associated with satisfaction and loyalty. More recent evidence, however, indicates that structural differences between visitor groups should not be assumed to occur universally.
Sodawan and Hsu (
2025), for example, found no significant differences between first-time and repeat travellers across the destination image–loyalty relationships examined in their multigroup analysis. This finding reinforces the need to determine empirically which structural pathways vary with previous visitation and which remain comparatively stable. Nevertheless, much of the destination-loyalty literature has examined these relationships either within pooled samples or through isolated comparisons between visitor groups. Consequently, less attention has been devoted to whether the structural architecture of loyalty formation itself differs according to visit frequency, particularly when direct effects, satisfaction-mediated effects, and cross-group differences in those indirect effects are examined simultaneously.
A second unresolved issue concerns the conceptual treatment of destination image and destination attributes. Destination image is generally understood as a broad multidimensional representation of tourists’ beliefs, impressions, and affective evaluations of a place (
Chi & Qu, 2008;
Afshardoost & Eshaghi, 2020). The present study does not operationalize destination image in this comprehensive sense. Instead, it focuses more specifically on perceived destination attribute salience, defined here as the importance tourists assign to concrete destination attributes in their destination choice. These attributes include natural and cultural resources, comfort and well-being, leisure and shopping opportunities, and sun-and-beach characteristics. This distinction is theoretically relevant because attribute salience captures the cognitive weight assigned to specific pull characteristics rather than an overall evaluative image of the destination. It therefore provides a more precise representation of the institutional measures available in the secondary dataset and avoids equating attribute importance with destination image as a whole.
A third issue concerns the role of travel motivations. Push–pull approaches have long established that internal travel motives and destination attributes represent conceptually distinct components of tourist decision-making (
Crompton, 1979;
Yoon & Uysal, 2005). However, their relationships with post-visit evaluations need not be structurally equivalent across tourists with different levels of destination familiarity. In particular, the association between a primary reason for travelling and subsequent satisfaction or loyalty may depend on whether the tourist is relatively unfamiliar with the destination or has accumulated experience through repeated visits. Examining motivations and destination attribute salience simultaneously therefore makes it possible to distinguish motivational push factors from destination-related pull factors while assessing whether their respective structural roles vary according to visit frequency.
The mediating role of satisfaction adds a further layer to this problem. Previous studies have shown that satisfaction can transmit the associations of destination perceptions, experiences, and motivations to subsequent behavioural intentions (
Chi & Qu, 2008;
Prayag et al., 2017;
Tang et al., 2022). However, establishing mediation in a pooled sample does not demonstrate that the mediated mechanism operates with the same magnitude across different visitor groups. From a conditional-process perspective, visit frequency may be associated not only with differences in direct structural paths but also with differences in the indirect pathways linking destination attributes and travel motivations to loyalty through satisfaction. This distinction between conventional mediation and moderated mediation across visit-frequency groups remains particularly relevant in mature destinations, where repeat visitation constitutes a substantial share of tourism demand.
Against this background, the research gap addressed in this study is not the absence of evidence concerning satisfaction, motivation, destination attributes, or loyalty individually. Rather, it concerns the limited understanding of whether and where the integrated structural relationships among these constructs differ according to accumulated destination experience. Specifically, previous research leaves unresolved whether visit frequency is associated with differences in (i) the relationships between destination attribute salience and satisfaction, (ii) the relationships between primary travel motivations and satisfaction, (iii) the satisfaction–loyalty relationship, (iv) the direct relationships of destination attributes and motivations with loyalty, and, importantly, (v) the indirect relationships transmitted through tourist satisfaction. Recent evidence showing that first-time and repeat visitors do not necessarily differ across all structural relationships (
Sodawan & Hsu, 2025) further underscores the importance of treating visitor experience as a potentially selective rather than universal source of structural heterogeneity. Addressing these questions requires moving beyond comparisons of isolated coefficients toward an integrated multigroup assessment of structural heterogeneity.
The present study addresses this gap using data from 37,781 international tourists surveyed through the Canary Islands Tourist Expenditure Survey conducted by the Canary Islands Institute of Statistics (ISTAC) during the second half of 2023 and the first half of 2024. The Canary Islands provide a particularly relevant empirical setting because they constitute a mature international tourism destination characterized by substantial repeat visitation. The large institutional dataset also offers high ecological validity, while simultaneously requiring careful treatment of the measurement constraints inherent in secondary data not originally designed for latent-variable modelling.
Methodologically, the study applies covariance-based structural equation modelling (CB-SEM) and multigroup analysis to distinguish frequent from non-frequent visitors. Measurement equivalence is assessed before structural comparisons, and the analysis is restricted to comparisons justified by the supported level of invariance. The model simultaneously examines four retained dimensions of perceived destination attribute salience, five primary travel-motivation categories, Tourist Satisfaction, and Destination Loyalty. In addition to direct structural relationships, indirect effects through satisfaction and cross-group differences in those indirect effects are formally evaluated. This approach allows visit frequency to be examined as a theoretically meaningful boundary condition without assuming that every relationship necessarily differs between visitor groups.
The study makes three principal contributions. First, it contributes theoretically by replacing the assumption of a homogeneous destination-loyalty mechanism with a conditional structural perspective in which some relationships remain relatively stable while others differ according to visit frequency. The contribution therefore lies not in demonstrating once again that satisfaction is related to loyalty, but in identifying which components of the broader satisfaction–loyalty system exhibit structural heterogeneity, and which do not. Second, it integrates destination attribute salience and primary travel motivations as conceptually distinct pull and push antecedents within the same multigroup framework, allowing their direct and satisfaction-mediated relationships with loyalty to be evaluated simultaneously. Third, it contributes methodologically by applying measurement validation, multigroup CB-SEM, formal cross-group tests, and moderated-mediation analysis to a large institutional tourism dataset while explicitly recognizing the psychometric and invariance limitations associated with secondary survey measures.
Accordingly, the objective of this study is to examine whether the structural relationships linking perceived destination attribute salience and primary travel motivations to Tourist Satisfaction and Destination Loyalty differ between frequent and non-frequent visitors to a mature tourism destination, and whether visit frequency is associated with differences in the indirect relationships transmitted through satisfaction. Rather than presupposing universal differences between the two visitor segments, the study identifies the specific pathways for which structural heterogeneity is empirically supported. In doing so, it seeks to provide a more nuanced account of destination loyalty formation and a more precise basis for experience-based destination segmentation.
2. Literature Review and Hypothesis Development
2.1. Perceived Destination Attribute Salience and Tourist Satisfaction
Destination-related cognitive evaluations have traditionally been examined through the concept of destination image, which encompasses tourists’ beliefs, impressions, and evaluations of a destination (
Chi & Qu, 2008;
Afshardoost & Eshaghi, 2020). However, the construct examined in the present study is conceptually narrower. Rather than measuring destination image as a holistic cognitive–affective representation, the institutional survey records the importance or salience assigned by tourists to specific destination attributes in their destination choice.
This distinction is important because perceived destination attribute salience refers to the relative cognitive weight attached to concrete destination characteristics rather than to an overall evaluation of the destination. In the present study, the institutional destination attributes are organized into four empirically retained dimensions: Natural and Cultural Experience (I1), Comfort and Well-being (I2), Leisure and Shopping Options (I3), and Sun and Beach (I4). These dimensions represent different components of the destination’s pull structure and should therefore not be assumed to contribute uniformly to tourists’ post-visit evaluations.
Previous research has consistently linked destination characteristics and cognitive destination evaluations to tourist satisfaction (
Baker & Crompton, 2000;
Chi & Qu, 2008;
Afshardoost & Eshaghi, 2020). From an expectation–evaluation perspective, attributes that are particularly salient in destination choice provide reference points against which the subsequent tourism experience can be assessed. When tourists perceive that the destination experience is consistent with the characteristics they considered important, more favourable overall evaluations may emerge. Recent evidence further supports the relevance of destination-related evaluations in loyalty formation. In a cultural heritage tourism context,
Li and Du (
2025) found that destination performance was associated with several post-visit evaluations and exhibited a significant direct relationship with long-term destination loyalty.
Nevertheless, the multidimensional character of destination attributes implies that these associations should be examined separately rather than collapsed into a single global effect. Natural and cultural resources, comfort-related attributes, leisure opportunities, and sun-and-beach characteristics represent qualitatively different components of the destination experience and may therefore exhibit different associations with satisfaction. Accordingly, the following hypotheses are proposed:
H1. Perceived destination attribute salience is significantly associated with Tourist Satisfaction.
More specifically:
H1a. Natural and Cultural Experience (I1) is significantly associated with Tourist Satisfaction.
H1b. Comfort and Well-being (I2) is significantly associated with Tourist Satisfaction.
H1c. Leisure and Shopping Options (I3) is significantly associated with Tourist Satisfaction.
H1d. Sun and Beach (I4) is significantly associated with Tourist Satisfaction.
2.2. Primary Travel Motivations and Tourist Satisfaction
Tourist motivation has traditionally been interpreted through push–pull frameworks distinguishing internal psychological forces from destination-related external attractions (
Crompton, 1979;
Yoon & Uysal, 2005). Whereas destination attributes represent pull characteristics associated with the destination itself, primary travel motivations capture the purposes or internal drivers underlying the decision to travel. Recent research continues to support this conceptual distinction.
Orden-Mejía et al. (
2025), for example, distinguish internally driven push motivations from destination-specific pull attributes and show that different motivational dimensions need not be uniformly associated with tourists’ evaluations of destination quality.
Motivation is particularly relevant to post-visit evaluation because satisfaction can depend on the extent to which the tourism experience corresponds to the objectives that initially motivated the trip. Previous studies have consequently identified relationships between travel motivation, destination experience, satisfaction, and subsequent behavioural intentions (
Yoon & Uysal, 2005;
Çelik & Dedeoğlu, 2019;
Suhartanto et al., 2020).
In the present study, motivation is not specified as a latent construct. The secondary institutional questionnaire identifies the tourist’s primary travel motivation through mutually exclusive categories. Five dummy variables—Fun, Family, Rest, Hobbies, and Exploration—are therefore included as observed exogenous variables, while Other motivation constitutes the omitted empirical reference category. Consequently, the estimated coefficients should not be interpreted as effects of increasing levels of a latent motivational dimension, but as differences associated with each primary motivation relative to the reference category.
Because the substantive meaning of these motivations differs, their associations with satisfaction are tested separately:
H2. Primary travel motivation is significantly associated with Tourist Satisfaction relative to the reference category (“Other motivation”).
Specifically:
H2a. Fun as the primary travel motivation is significantly associated with Tourist Satisfaction relative to Other motivation.
H2b. Family as the primary travel motivation is significantly associated with Tourist Satisfaction relative to Other motivation.
H2c. Rest as the primary travel motivation is significantly associated with Tourist Satisfaction relative to Other motivation.
H2d. Hobbies as the primary travel motivation is significantly associated with Tourist Satisfaction relative to Other motivation.
H2e. Exploration as the primary travel motivation is significantly associated with Tourist Satisfaction relative to Other motivation.
This explicit categorical formulation is essential because it aligns the theoretical hypotheses with the empirical specification and avoids treating the motivation indicators as reflective measures of a common latent construct.
2.3. Tourist Satisfaction and Destination Loyalty
Tourist satisfaction occupies a central position in models of post-consumption behaviour. It represents an overall evaluation of the tourism experience and has repeatedly been identified as one of the strongest correlates of subsequent behavioural intentions (
Baker & Crompton, 2000;
Bigné et al., 2001;
Yoon & Uysal, 2005;
Chi & Qu, 2008;
L. Wang & Li, 2023). More recent evidence also confirms the robustness of this relationship in specific tourism contexts.
Ahn and Kim (
2024), for example, found a strong positive association between tourist satisfaction and destination loyalty in the context of wellness tourism.
Destination loyalty is itself multidimensional. It encompasses both a behavioural-intention component, represented by willingness or intention to revisit, and an attitudinal component reflected in willingness to recommend the destination to others (
Bigné et al., 2001;
Chi & Qu, 2008). The present study therefore models Destination Loyalty as a latent construct reflected by intention to return and willingness to recommend.
Although the satisfaction–loyalty relationship is well established, it remains an essential component of the present structural framework because satisfaction constitutes the mediator through which destination attribute salience and primary travel motivations may be associated with loyalty. Moreover, the magnitude of this relationship can itself differ according to previous destination experience.
Accordingly:
H3. Tourist Satisfaction is positively and significantly associated with Destination Loyalty.
2.4. The Mediating Role of Tourist Satisfaction
The relationship between pre-visit or destination-related antecedents and post-visit behavioural intentions need not operate exclusively through direct pathways. Satisfaction provides an evaluative mechanism through which tourists’ motivations and their perceptions of relevant destination attributes may become associated with subsequent loyalty (
Chi & Qu, 2008;
Prayag et al., 2017;
Tang et al., 2022).
This mediation perspective is particularly appropriate for distinguishing between the direct association of an antecedent with loyalty and the indirect association transmitted through satisfaction. Such a distinction is theoretically relevant because an attribute or travel motivation may exhibit a weak or even non-significant direct relationship with loyalty while remaining associated with loyalty indirectly through the tourist’s overall evaluation of the experience.
Importantly, mediation in the present cross-sectional design is interpreted statistically rather than causally. The indirect effects represent structural associations consistent with a mediating mechanism; they do not establish temporal or psychological causation.
For destination attributes:
H4. Tourist Satisfaction mediates the association between perceived destination attribute salience and Destination Loyalty.
Specifically:
H4a. Tourist Satisfaction mediates the association between Natural and Cultural Experience (I1) and Destination Loyalty.
H4b. Tourist Satisfaction mediates the association between Comfort and Well-being (I2) and Destination Loyalty.
H4c. Tourist Satisfaction mediates the association between Leisure and Shopping Options (I3) and Destination Loyalty.
H4d. Tourist Satisfaction mediates the association between Sun and Beach (I4) and Destination Loyalty.
For travel motivations:
H5. Tourist Satisfaction mediates the association between primary travel motivations and Destination Loyalty.
Specifically:
H5a. Tourist Satisfaction mediates the association between Fun and Destination Loyalty.
H5b. Tourist Satisfaction mediates the association between Family and Destination Loyalty.
H5c. Tourist Satisfaction mediates the association between Rest and Destination Loyalty.
H5d. Tourist Satisfaction mediates the association between Hobbies and Destination Loyalty.
H5e. Tourist Satisfaction mediates the association between Exploration and Destination Loyalty.
2.5. Visit Frequency as a Boundary Condition
Previous visitation represents an important source of heterogeneity in tourist behaviour. First-time and repeat visitors may differ in destination knowledge, expectations, motivations, information-processing patterns, and behavioural intentions (
Oppermann, 2000;
Chi, 2012). Moreover, repeat visitors should not necessarily be regarded as a homogeneous category.
Schofield et al. (
2020) show the relevance of distinguishing visitor groups according to previous visitation when examining destination evaluations, while
Tan (
2017) conceptualizes accumulated destination experience in terms of experiential familiarity and relates it to repeat visitation. Recent evidence further indicates that destination experience may change systematically as the number of previous visits increases (
Barra et al., 2026). At the same time, visitor-group differences should not be assumed to occur uniformly across structural relationships.
Sodawan and Hsu (
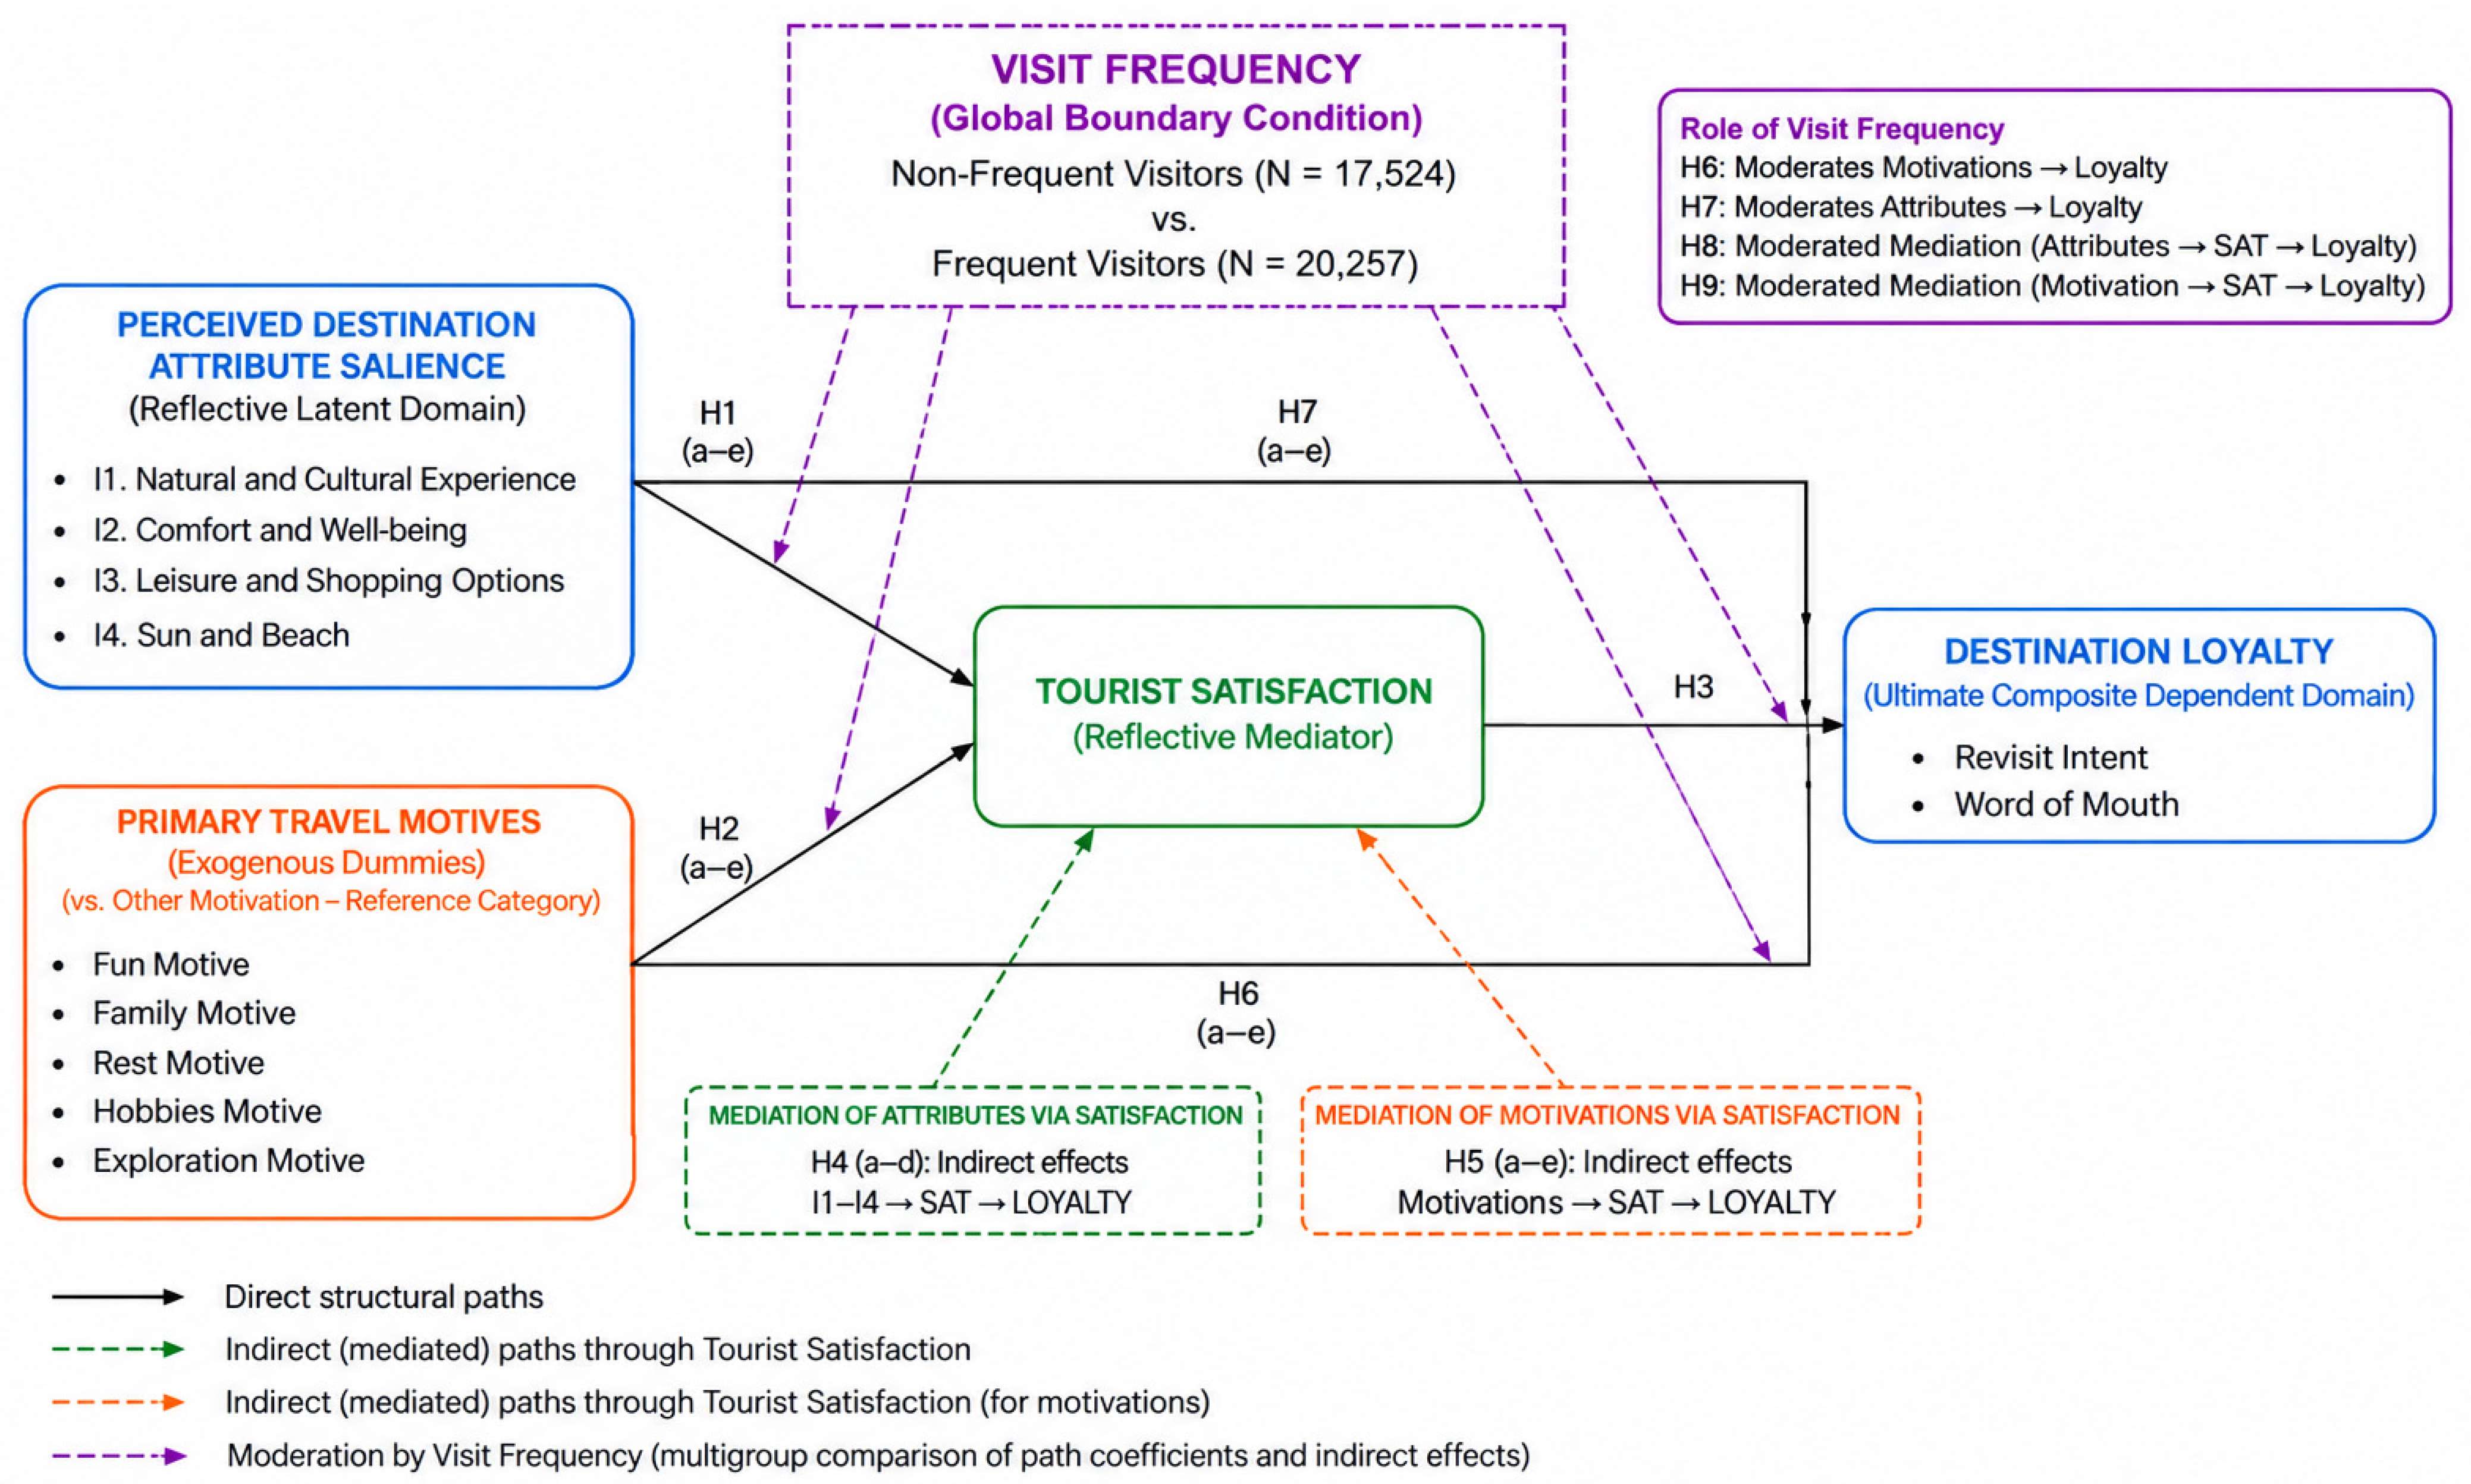
2025), using multigroup analysis to compare first-time and repeat travellers, found no significant differences across the destination image–loyalty pathways examined, suggesting that previous visitation may operate as a boundary condition selectively rather than uniformly across structural relationships. Taken together, this literature supports treating visit frequency as a meaningful segmentation criterion whose structural relevance should be tested at the level of specific relationships, rather than assuming structural homogeneity among repeat visitors or universal differences between visitor groups. The conceptual model and the hypothesized relationships examined in this study are presented in
Figure 1.
2.5.1. Moderation of the Motivation–Loyalty Relationships
The relationship between travel motivation and loyalty may vary according to accumulated destination experience. The same primary motivation may be differently associated with loyalty among tourists with limited previous experience and those who have repeatedly visited the destination. Consequently:
H6. Visit frequency moderates the association between primary travel motivations and Destination Loyalty.
Specifically:
H6a. Visit frequency moderates the association between Fun and Destination Loyalty.
H6b. Visit frequency moderates the association between Family and Destination Loyalty.
H6c. Visit frequency moderates the association between Rest and Destination Loyalty.
H6d. Visit frequency moderates the association between Hobbies and Destination Loyalty.
H6e. Visit frequency moderates the association between Exploration and Destination Loyalty.
2.5.2. Moderation of the Attribute Salience–Loyalty Relationships
Accumulated destination experience may similarly condition the relationship between the salience of specific destination attributes and loyalty. Attributes that are strongly associated with post-visit intentions among relatively inexperienced visitors need not exhibit the same structural relationship among tourists with greater destination familiarity.
Accordingly:
H7. Visit frequency moderates the association between perceived destination attribute salience and Destination Loyalty.
Specifically:
H7a. Visit frequency moderates the association between Natural and Cultural Experience (I1) and Destination Loyalty.
H7b. Visit frequency moderates the association between Comfort and Well-being (I2) and Destination Loyalty.
H7c. Visit frequency moderates the association between Leisure and Shopping Options (I3) and Destination Loyalty.
H7d. Visit frequency moderates the association between Sun and Beach (I4) and Destination Loyalty.
2.6. Visit Frequency and Moderated Mediation
Examining moderation only in the direct paths would provide an incomplete assessment of structural heterogeneity. If satisfaction transmits part of the association between destination attributes or travel motivations and loyalty, accumulated destination experience may also be associated with differences in the magnitude of these indirect effects.
This possibility corresponds to a moderated-mediation framework, in which an indirect association varies across levels or categories of a moderator (
Preacher et al., 2007). Recent tourism research has increasingly moved beyond simple direct-effect models by examining conditional indirect mechanisms linking tourist experiences, satisfaction, and revisit intentions. For example,
G. Wang et al. (
2025) applied a moderated mediation framework to show that the mechanisms connecting tourist experiences with revisit intentions may depend on conditioning variables. This development reinforces the need to examine not only whether satisfaction mediates loyalty-related relationships, but also whether the magnitude of these indirect relationships varies across theoretically relevant visitor segments.
In the present study, moderated mediation is evaluated categorically through multigroup comparisons. Thus, the relevant empirical question is whether the estimated indirect association between an antecedent and Destination Loyalty through Tourist Satisfaction differs significantly between frequent and non-frequent visitors. This formulation is particularly important because differences in individual component paths—or statistical significance of an indirect effect in one group but not in the other—do not, by themselves, establish moderated mediation. The difference between the group-specific indirect effects must be formally tested.
2.6.1. Moderated Mediation of Destination Attribute Salience
H8. Visit frequency moderates the indirect association between perceived destination attribute salience and Destination Loyalty through Tourist Satisfaction.
Specifically:
H8a. Visit frequency moderates the indirect association between Natural and Cultural Experience (I1) and Destination Loyalty through Tourist Satisfaction.
H8b. Visit frequency moderates the indirect association between Comfort and Well-being (I2) and Destination Loyalty through Tourist Satisfaction.
H8c. Visit frequency moderates the indirect association between Leisure and Shopping Options (I3) and Destination Loyalty through Tourist Satisfaction.
H8d. Visit frequency moderates the indirect association between Sun and Beach (I4) and Destination Loyalty through Tourist Satisfaction.
2.6.2. Moderated Mediation of Primary Travel Motivations
H9. Visit frequency moderates the indirect association between primary travel motivations and Destination Loyalty through Tourist Satisfaction.
Specifically:
H9a. Visit frequency moderates the indirect association between Fun and Destination Loyalty through Tourist Satisfaction.
H9b. Visit frequency moderates the indirect association between Family and Destination Loyalty through Tourist Satisfaction.
H9c. Visit frequency moderates the indirect association between Rest and Destination Loyalty through Tourist Satisfaction.
H9d. Visit frequency moderates the indirect association between Hobbies and Destination Loyalty through Tourist Satisfaction.
H9e. Visit frequency moderates the indirect association between Exploration and Destination Loyalty through Tourist Satisfaction.
3. Methodology
3.1. Study Area: The Canary Islands
The Canary Islands are an autonomous region of Spain located in the Atlantic Ocean, approximately 1200 km southwest of the Iberian Peninsula and slightly more than 100 km west of the African coast. The archipelago comprises seven main islands and several smaller islands and is characterized by highly diverse natural landscapes, ranging from volcanic environments to subtropical forests.
As one of Europe’s leading mature tourism destinations, the Canary Islands received more than 16 million international tourists in 2023 and ranked among the European regions with the highest number of overnight stays by non-residents (
European Commission, 2024). The destination’s attractiveness is supported by its year-round mild climate, well-developed tourism infrastructure, and diverse natural and cultural attractions. The Canary Islands also exhibit a particularly high proportion of repeat visitors, making the archipelago an especially suitable empirical setting for examining whether previous destination experience conditions the mechanisms through which tourist satisfaction translates into destination loyalty.
3.2. Sampling and Data Source
This study uses secondary data from the Canary Islands Tourist Expenditure Survey conducted by the Canary Islands Institute of Statistics (ISTAC). The original dataset comprises 38,754 records from tourists surveyed at the departure terminals of the main airports of the archipelago at the end of their stay in the Canary Islands during the second half of 2023 and the first half of 2024.
The survey collects information on visitors’ sociodemographic characteristics, trip characteristics, travel motivations, perceived importance of destination attributes, satisfaction, and post-visit behavioural intentions. The data used in this study are anonymized and contain no personally identifiable information.
Because the different stages of the analysis involve different sets of observed variables, the effective sample size varies marginally across analyses. The exploratory factor analysis (EFA) of the 20 original destination attributes was conducted using 37,781 complete cases, whereas the final structural equation model also included 37,781 valid observations after specification of the final measurement model.
Visit frequency was operationalized on the basis of the number of previous visits to the Canary Islands. Previous research indicates that repeat visitors should not necessarily be treated as a homogeneous group and supports distinguishing different levels of previous destination experience (
Mays & Hritz, 2015;
Schofield et al., 2020). More specifically,
Mays and Hritz (
2015) identified meaningful differences between visitors with one or two previous visits and those with three or more visits, providing empirical support for distinguishing more recurrent visitors from those with more limited previous visitation. Moreover, the number of previous visits provides an indicator of accumulated destination experience and experiential familiarity (
Tan, 2017). On this basis, respondents were classified as non-frequent visitors (<3 previous visits; N = 17,524, 46.4%) and frequent visitors (≥3 previous visits; N = 20,257, 53.6%). The three-visit threshold should be interpreted as a theoretically and empirically informed operationalization of accumulated destination experience rather than as a universal cut-off defining frequent visitation. This classification provides the basis for testing whether visit frequency operates as a boundary condition associated with differences in the relationships among destination-related antecedents, tourist satisfaction, and destination loyalty.
3.3. Measurement of Variables and Construct Specification
The conceptual model comprises four main components: perceived destination attribute salience, primary travel motivations, tourist satisfaction, and destination loyalty.
Table 1 summarizes the operationalization, measurement scales, and supporting literature for all variables and constructs included in the final model.
Perceived destination attribute salience was initially derived from 20 items assessing the importance tourists assigned to different characteristics of the Canary Islands when choosing the destination. These items were measured on a five-point importance scale. Given the multidimensional nature of destination attribute salience, its underlying structure was initially examined using exploratory factor analysis. Sampling adequacy was satisfactory (KMO = 0.829), and Bartlett’s test of sphericity was statistically significant (χ2(190) = 210,441.683, p < 0.001). The initial exploratory solution identified five components with eigenvalues greater than one, jointly explaining 56.059% of the total variance.
The exploratory structure was subsequently evaluated through confirmatory factor analysis (CFA) and refinement of the measurement model. The fifth component identified during the exploratory stage was not retained in the final model because it did not exhibit adequate psychometric performance. The gastronomy indicator was also excluded during model refinement. Consequently, the final measurement specification of perceived destination attribute salience comprised four correlated latent dimensions.
Natural and Cultural Experience (I1) was measured by six indicators: historical heritage, hiking, environment, landscapes, cultural offer, and authenticity. Comfort and Well-being (I2) comprised four indicators: safety, effortless trip, accommodation offer, and tranquillity. Leisure and Entertainment (I3) was measured by three indicators: fun possibilities, nightlife, and shopping offer. Finally, Sun and Beach (I4) comprised climate, beaches, and sea. The standardized factor loadings and reliability and convergent-validity statistics associated with these dimensions are reported in
Table 2.
Tourist Satisfaction (SAT) was specified as a reflective latent construct measured by two indicators. The first, overall satisfaction with the destination stay, was measured on a numerical scale ranging from 0 to 10. The second, experience rating, was measured on a five-point ordinal scale ranging from 1 (much worse) to 5 (much better), with 3 representing the same. Because the two indicators were entered separately into the measurement model, they were not combined into an additive or averaged composite score. Their relationship with the latent construct was instead estimated within the CFA/SEM framework.
Destination Loyalty (LOY) was also specified as a reflective latent construct measured by two complementary indicators: intention to return to the Canary Islands and willingness to recommend the destination to others. Both indicators were measured on numerical scales ranging from 0 to 10. Their joint specification captures two commonly recognized manifestations of destination loyalty: revisit intention and recommendation/word-of-mouth intention (
Bigné et al., 2001;
Tang et al., 2022;
Lin, 2024).
Finally, primary travel motivations were incorporated into the structural model as observed categorical exogenous variables rather than as indicators of a latent motivational construct. Five mutually exclusive dummy variables represented the primary travel motive: fun, family, rest, hobbies, and exploration. “Other motivation” served as the empirical reference category. Accordingly, coefficients associated with these dummy variables should be interpreted as differences relative to tourists whose primary reason for travel was classified within the reference category.
3.4. Analytical Strategy and Measurement Model Validation
The statistical analysis was conducted sequentially using SPSS 29 and STATA 18. The analytical strategy combined exploratory factor analysis (EFA), confirmatory factor analysis (CFA), covariance-based structural equation modelling (CB-SEM), and multigroup analysis (MGA).
First, an EFA was conducted on the 20 original destination attribute items to identify their underlying dimensional structure. The resulting factorial solution was subsequently evaluated through CFA. The CFA was used not only to assess overall measurement-model fit but also to examine standardized factor loadings, internal consistency, composite reliability (CR), and average variance extracted (AVE).
The refined measurement model comprised four correlated dimensions of perceived destination attribute salience (I1–I4), together with the latent constructs Tourist Satisfaction (SAT) and Destination Loyalty (LOY). During model refinement, the fifth destination-attribute factor identified at the exploratory stage and the gastronomy indicator were excluded from the final specification. Three residual covariances among indicators belonging to I1 were also freely estimated. These correlated residuals were restricted to indicators within the same latent domain and were specified to account for shared item-specific content not fully represented by the common latent factor.
The final CFA was estimated using 37,781 complete observations after listwise exclusion of 973 cases with missing information on the variables included in the measurement model. The refined CFA yielded χ2(152) = 19,779.242, RMSEA = 0.058, CFI = 0.918, TLI = 0.897, and SRMR = 0.052. Given the exceptionally large analytical sample, the chi-square statistic was expected to be highly sensitive to even minor departures from exact model fit. Model adequacy was therefore evaluated through the joint consideration of absolute and incremental fit indices rather than the statistical significance of χ2 alone. RMSEA and SRMR indicated acceptable absolute fit, CFI exceeded the conventional 0.90 benchmark, whereas TLI (0.897) remained marginally below that threshold. Accordingly, the measurement model was considered sufficiently adequate for proceeding to the structural analysis, while its remaining psychometric limitations were explicitly retained for consideration in the interpretation of the results.
Internal consistency and convergent validity were assessed using Cronbach’s alpha, composite reliability (CR), standardized factor loadings, and average variance extracted (AVE). Because the study relies on secondary institutional survey data originally designed for tourism monitoring rather than specifically for latent psychometric measurement, these indicators were evaluated jointly rather than through a single mechanical cut-off criterion. As reported in
Table 2, measurement quality was heterogeneous across constructs. Consequently, indicators and constructs with comparatively weak reliability or convergent-validity statistics were retained only where their inclusion was theoretically and substantively justified by the institutional measurement framework. These limitations are explicitly considered when interpreting the structural results.
Measurement Invariance
Before comparing structural relationships between frequent and non-frequent visitors, measurement invariance was examined sequentially to determine whether the latent constructs were represented sufficiently similarly across the two groups for multigroup structural comparisons.
Configural invariance was first examined by estimating the same factorial structure in both visitor groups. Metric invariance was then assessed by imposing equality constraints on the corresponding factor loadings across groups. The metric invariance model yielded CFI = 0.917, RMSEA = 0.057, and SRMR = 0.052, indicating that equality of factor loadings could be maintained at an acceptable level and providing the measurement basis required for comparing structural relationships across groups.
Full scalar invariance was subsequently examined by additionally constraining item intercepts to equality. The full scalar specification was not adequately supported. A partial scalar invariance model was therefore estimated by releasing the equality constraints on the intercepts of the experience-rating indicator and the intention-to-return indicator. The resulting partial scalar model yielded CFI = 0.907, RMSEA = 0.059, and SRMR = 0.053. Relative to the metric model, the changes in fit were limited (ΔCFI = −0.010, ΔRMSEA = +0.002, and ΔSRMR = +0.001), providing support for partial rather than full scalar invariance.
The distinction between metric and scalar invariance is particularly relevant to the objectives of this study. The primary purpose of the multigroup analysis was to compare structural path coefficients and indirect relationships across visitor-frequency groups, rather than to test differences in latent construct means. The establishment of metric invariance provides the relevant basis for interpreting cross-group differences in structural relationships because the measurement units of the latent constructs are held comparable across groups. By contrast, the absence of full scalar invariance limits the interpretation of latent mean differences. Accordingly, no substantive conclusions concerning differences in latent means between frequent and non-frequent visitors are drawn in this study. Cross-group results are interpreted specifically as differences in structural associations, subject to the measurement limitations identified above.
3.5. Structural Model Estimation, Moderation, and Moderated Mediation
Following validation of the measurement model and assessment of measurement invariance, a multigroup covariance-based structural equation model (CB-SEM) was estimated in STATA 18.
The final structural model included 37,781 observations, comprising 17,524 non-frequent visitors and 20,257 frequent visitors. The four retained destination attribute dimensions (I1–I4), Tourist Satisfaction (SAT), and Destination Loyalty (LOY) were incorporated as latent constructs. The five primary travel motivations—Fun, Family, Rest, Hobbies, and Exploration—were included as observed dummy-coded exogenous variables, with Other motivation serving as the reference category. Accordingly, the estimated motivational coefficients represent structural associations relative to this reference category.
The multigroup structural analysis was conducted following establishment of metric and partial scalar measurement invariance across the two visitor groups. Metric invariance provided the measurement basis required for comparing structural relationships across groups, while the absence of full scalar invariance precluded interpreting the analysis in terms of unrestricted latent mean comparisons.
The final structural model produced the following fit statistics: χ2(476) = 25,824.222, RMSEA = 0.053, CFI = 0.899, TLI = 0.876, SRMR = 0.047, and CD = 0.996.
Given the very large sample size and the complexity of the multigroup model, RMSEA and SRMR indicate acceptable approximation and residual fit, whereas CFI and TLI are more modest. Model fit was therefore evaluated jointly and conservatively rather than characterized as indicating perfect or uniformly excellent fit.
The moderating role of visit frequency was examined through formal cross-group comparisons of structural coefficients. Differences between corresponding parameters in the frequent and non-frequent visitor groups were assessed using Wald tests. This procedure avoids inferring moderation merely from a coefficient being statistically significant in one group but non-significant in the other, as it directly tests whether the corresponding structural coefficients differ significantly across groups.
To assess mediation, the indirect effects of the four destination attribute dimensions and the five primary travel motivations on Destination Loyalty through Tourist Satisfaction were calculated as the products of the corresponding structural coefficients. Indirect effects and their standard errors were estimated in STATA using nonlinear combinations of model parameters (nlcom), with statistical inference based on the delta method.
Finally, moderated mediation was formally examined by directly comparing the group-specific indirect effects. Thus, H8 and H9 were not evaluated solely by comparing the magnitude or statistical significance of indirect effects within each group. Instead, explicit statistical contrasts of the indirect effects between frequent and non-frequent visitors were conducted. A statistically significant cross-group difference in an indirect effect was interpreted as evidence that the satisfaction-mediated association between the corresponding antecedent and Destination Loyalty differs according to visit-frequency group.
4. Results
4.1. Measurement Model Assessment
Before testing the structural relationships, the psychometric properties of the measurement model were evaluated through exploratory and confirmatory factor analyses. The exploratory factor analysis (EFA) of the 20 destination attribute items was conducted on 37,781 complete observations. Sampling adequacy was satisfactory (KMO = 0.829), and Bartlett’s test of sphericity was statistically significant (χ2(190) = 210,441.683, p < 0.001), confirming that the correlation matrix was appropriate for factor analysis. The initial five-component solution explained 56.059% of the total variance.
The exploratory solution was subsequently subjected to confirmatory factor analysis (CFA). During measurement-model refinement, the fifth destination-attribute factor was removed because it did not exhibit sufficient psychometric stability for inclusion in the final structural model. The gastronomy indicator was also excluded because of inadequate factorial performance. The resulting measurement model retained four destination-attribute dimensions—Natural and Cultural Experience (I1), Comfort and Well-being (I2), Leisure and Shopping (I3), and Sun and Beach (I4)—together with the latent constructs Tourist Satisfaction (SAT) and Destination Loyalty (LOY).
The refined CFA yielded χ2(152) = 19,779.242, RMSEA = 0.058, CFI = 0.918, TLI = 0.897, and SRMR = 0.052. Although the chi-square statistic was significant, this result was expected given the exceptionally large sample size. Taken together, particularly the RMSEA and SRMR values, the fit statistics indicated an adequate approximation of the proposed measurement structure, while the incremental indices suggested some remaining model complexity.
Measurement invariance was subsequently assessed across frequent and non-frequent visitors. Configural invariance supported the same basic factorial structure in both groups. Metric invariance was also supported, with the constrained model yielding CFI = 0.917, RMSEA = 0.057, and SRMR = 0.052. Full scalar invariance could not be established. However, after releasing the equality constraints on the intercepts of experience rating and intention to return, the partial scalar model produced CFI = 0.907, RMSEA = 0.059, and SRMR = 0.053. Relative to the metric model, the changes were ΔCFI = −0.010, ΔRMSEA = +0.002, and ΔSRMR = +0.001.
These results support partial scalar invariance, thereby providing a defensible basis for comparing structural relationships across visitor-frequency groups. Because full scalar invariance was not achieved, the subsequent analysis focuses on differences in structural paths rather than comparisons of latent means.
As shown in
Table 2, measurement quality was heterogeneous across the retained constructs. Standardized factor loadings were generally moderate to high, although some indicators remained below the conventional 0.50 benchmark. Composite reliability also varied across constructs. Three destination-attribute dimensions exhibited AVE values below the conventional 0.50 threshold: Natural and Cultural Experience (I1; AVE = 0.383), Comfort and Well-being (I2; AVE = 0.368), and Leisure and Entertainment (I3; AVE = 0.412). These dimensions were retained because their indicators represent theoretically meaningful components of the institutional destination-attribute framework and because further post hoc deletion of indicators solely to improve psychometric indices would have reduced the substantive coverage of the constructs. Accordingly, the suboptimal convergent validity of these dimensions is reported transparently and is treated as a measurement limitation when interpreting the corresponding structural relationships.
Sun and Beach (I4) reached the conventional AVE benchmark (AVE = 0.502), while Tourist Satisfaction (AVE = 0.504) and Destination Loyalty (AVE = 0.805) also exceeded 0.50. Destination Loyalty showed comparatively strong measurement properties (α = 0.882, CR = 0.891). Tourist Satisfaction exhibited weaker internal consistency (α = 0.547; CR = 0.649), which should be considered when interpreting results involving this construct. Given that Tourist Satisfaction was represented by only two indicators measured using different original response formats, its measurement limitations are explicitly acknowledged rather than interpreted as evidence of uniformly satisfactory psychometric performance.
4.2. Multigroup Structural Model
The final multigroup CB-SEM was estimated using 37,781 observations: 17,524 non-frequent visitors and 20,257 frequent visitors. The structural model yielded χ2(476) = 25,824.222, RMSEA = 0.053, CFI = 0.899, TLI = 0.876, SRMR = 0.047, and CD = 0.996. RMSEA and SRMR indicated acceptable approximation and residual fit, whereas CFI and TLI were more modest. Accordingly, model fit was evaluated jointly and conservatively, and the structural results were interpreted while acknowledging that the model does not reproduce the observed covariance structure perfectly.
Direct Structural Effects
The first set of hypotheses concerned the antecedents of tourist satisfaction. The four destination-attribute dimensions showed heterogeneous relationships with satisfaction across visitor-frequency groups.
Natural and Cultural Experience (I1) was positively related to satisfaction among both non-frequent (β = 0.167, p < 0.001) and frequent visitors (β = 0.130, p < 0.001). Comfort and Well-being (I2) also exhibited positive associations in both groups (β = 0.127 and β = 0.196, respectively; both p < 0.001). Leisure and Shopping (I3), however, showed a small negative relationship among non-frequent visitors (β = −0.034, p = 0.007) and no statistically significant relationship among frequent visitors (β = −0.018, p = 0.132). Sun and Beach (I4) was positively associated with satisfaction among non-frequent visitors (β = 0.045, p < 0.001) but showed virtually no association among frequent visitors (β = −0.001, p = 0.922).
Therefore, H1 is partially supported: positive associations with satisfaction were consistently observed for I1 and I2, whereas I3 showed a small negative association only among non-frequent visitors and I4 was positively associated with satisfaction only among non-frequent visitors. Formal cross-group tests, reported below, determine whether these apparent group differences constitute statistically significant moderation.
The relationships between primary travel motivations and satisfaction also varied across groups. Among non-frequent visitors, Fun (β = −0.007, p = 0.659), Family (β = −0.007, p = 0.691), Hobbies (β = 0.011, p = 0.281), and Exploration (β = −0.037, p = 0.091) were not significantly associated with satisfaction relative to the “Other motivation” reference category. Rest showed a small negative association (β = −0.044, p = 0.048).
Among frequent visitors, by contrast, Fun (β = 0.062, p < 0.001), Family (β = 0.078, p < 0.001), and Rest (β = 0.061, p = 0.018) were positively associated with satisfaction. Hobbies was non-significant (β = 0.010, p = 0.356), while Exploration approached but did not reach conventional statistical significance (β = 0.038, p = 0.062).
Consequently, H2 is partially supported. Positive associations between primary travel motivations and satisfaction were observed primarily among frequent visitors, although formal cross-group tests are required to determine whether the corresponding coefficients differ significantly between groups.
The satisfaction–loyalty relationship was strong, positive, and statistically significant in both groups. Tourist Satisfaction was associated with Destination Loyalty with β = 0.818 (p < 0.001) among non-frequent visitors and β = 0.782 (p < 0.001) among frequent visitors. The cross-group Wald test was significant (χ2 = 53.24, p < 0.001), indicating that the corresponding structural coefficients differed significantly between groups. H3 is therefore supported.
The direct relationships between destination attribute salience and Destination Loyalty were generally weak. Natural and Cultural Experience (I1) showed a small positive association with loyalty among non-frequent visitors (β = 0.036, p < 0.001), whereas the corresponding association was negligible and non-significant among frequent visitors (β = 0.002, p = 0.828). The cross-group difference was statistically significant (Δβ = −0.034; Wald χ2 = 9.07, p = 0.0026). By contrast, the direct associations of Comfort and Well-being (I2), Leisure and Shopping (I3), and Sun and Beach (I4) with loyalty were not statistically significant in either group, and none of their cross-group differences reached statistical significance (all p > 0.45). Accordingly, H7 is partially supported: visit frequency moderated the direct relationship between Natural and Cultural Experience and loyalty, but not the corresponding relationships for the other three destination-attribute dimensions.
A substantially different pattern emerged for the direct relationships between primary travel motivations and Destination Loyalty. For Fun, the direct coefficients were not statistically significant within either group (β = −0.020, p = 0.060 among non-frequent visitors; β = 0.019, p = 0.116 among frequent visitors), but the cross-group difference was statistically significant (Δβ = 0.039; Wald χ2 = 20.85, p < 0.001). Family showed a negative direct association with loyalty among non-frequent visitors (β = −0.029, p = 0.013) and a positive association among frequent visitors (β = 0.039, p = 0.011), with a significant cross-group difference (Δβ = 0.068; Wald χ2 = 72.06, p < 0.001). A similar reversal was observed for Rest, which was negatively associated with loyalty among non-frequent visitors (β = −0.051, p = 0.001) but positively associated among frequent visitors (β = 0.040, p = 0.036), producing the largest cross-group difference among the motivational paths (Δβ = 0.091; Wald χ2 = 175.96, p < 0.001).
Hobbies was negatively associated with loyalty among non-frequent visitors (β = −0.018, p = 0.007) but was not significantly associated among frequent visitors (β = 0.005, p = 0.534); nevertheless, the cross-group difference was significant (Δβ = 0.023; Wald χ2 = 9.65, p = 0.0019). Finally, Exploration was negatively associated with loyalty among non-frequent visitors (β = −0.039, p = 0.011) and positively associated among frequent visitors (β = 0.033, p = 0.028), with a significant cross-group difference (Δβ = 0.072; Wald χ2 = 72.52, p < 0.001).
Taken together, the formal cross-group tests indicate that visit frequency significantly moderated all five motivation–loyalty relationships. H6a–H6e are therefore supported. Importantly, this conclusion is based on direct statistical comparisons of the corresponding coefficients across groups rather than on differences in their within-group significance levels (see
Table 3).
4.3. Mediation Effects of Tourist Satisfaction
H4 and H5 examined whether Tourist Satisfaction mediates the relationships between destination-attribute salience and loyalty and between primary travel motivations and loyalty, respectively.
The indirect effects revealed substantial heterogeneity across both antecedents and visitor groups. For Natural and Cultural Experience (I1), the indirect effect through satisfaction was positive and significant among both non-frequent visitors (indirect effect = 0.355, p < 0.001) and frequent visitors (indirect effect = 0.206, p < 0.001). Comfort and Well-being (I2) also exhibited significant positive indirect effects in both groups (0.252 and 0.304, respectively; both p < 0.001).
For Leisure and Shopping (I3), the indirect effect was negative and statistically significant among non-frequent visitors (−0.072, p = 0.007) but non-significant among frequent visitors (−0.029, p = 0.132). Sun and Beach (I4) showed a positive indirect effect among non-frequent visitors (0.289, p < 0.001) but no statistically significant indirect effect among frequent visitors (−0.005, p = 0.922).
Thus, H4 is partially supported. Significant indirect associations through satisfaction were observed for I1 and I2 in both visitor groups, whereas those involving I3 and I4 were observed only among non-frequent visitors.
The motivational indirect effects were even more clearly differentiated by previous destination experience. Among frequent visitors, Fun (0.215, p < 0.001), Family (0.189, p < 0.001), and Rest (0.115, p = 0.018) exhibited significant positive indirect effects through satisfaction. Exploration produced a positive but marginally non-significant effect (0.096, p = 0.062), whereas Hobbies was non-significant (0.066, p = 0.357).
Among non-frequent visitors, the corresponding effects were generally weak or negative. Fun (−0.029, p = 0.659), Family (−0.024, p = 0.691), Hobbies (0.106, p = 0.281), and Exploration (−0.098, p = 0.091) were non-significant. Rest exhibited a negative indirect effect (−0.113, p = 0.048).
Accordingly, H5 is partially supported. The evidence for motivational mediation is concentrated predominantly among frequent visitors and differs substantially across individual motivation categories.
4.4. Moderating Role of Visit Frequency and Moderated Mediation
The moderating effect of visit frequency was assessed using formal cross-group Wald tests. Importantly, moderation was inferred from the statistical difference between corresponding coefficients rather than from differences in within-group significance.
4.4.1. Moderation of Direct Effects
For the direct motivation-to-loyalty relationships (H6), statistically significant cross-group differences were found for all five primary motivations. The Wald tests were significant for Fun (χ2 = 20.85, p < 0.001), Family (χ2 = 72.06, p < 0.001), Rest (χ2 = 175.96, p < 0.001), Hobbies (χ2 = 9.65, p = 0.0019), and Exploration (χ2 = 72.52, p < 0.001). H6 is therefore supported.
The direction of these differences is particularly noteworthy. Family, Rest, and Exploration showed negative direct relationships with loyalty among non-frequent visitors but positive relationships among frequent visitors. Although some individual paths were not significant within one of the groups, the formal cross-group tests demonstrate that the corresponding coefficients differ significantly between the two visitor segments.
For destination attributes (H7), however, the evidence was much more selective. Only the direct I1 → LOY relationship differed significantly across groups (χ2 = 9.07, p = 0.0026). The cross-group differences for I2, I3, and I4 were not statistically significant. Consequently, H7 is partially supported.
4.4.2. Moderated Mediation
H8 and H9 addressed the more demanding question of whether visit frequency changes the indirect effects operating through Tourist Satisfaction. These hypotheses were evaluated by directly testing the difference between the group-specific indirect effects (see
Table 4).
For destination attribute salience, significant differences in indirect effects were found for Natural and Cultural Experience (I1) and Sun and Beach (I4). The difference for I1 was 0.149 (p < 0.001), whereas the difference for I4 was 0.294 (p < 0.001). In contrast, the differences for Comfort and Well-being (I2; Δ = −0.052, p = 0.096) and Leisure and Shopping (I3; Δ = −0.043, p = 0.196) were not statistically significant. Therefore, H8 is partially supported.
For primary travel motivations, moderated mediation was observed for Fun, Family, Rest, and Exploration. The corresponding differences in indirect effects were −0.243, −0.214, −0.228, and −0.194, respectively (all p < 0.001). No evidence of moderated mediation was found for Hobbies (Δ = 0.040, p = 0.685). Accordingly, H9 is partially supported.
These findings reveal that the satisfaction-mediated relationships are not uniformly stronger or weaker across visit-frequency groups. Instead, the magnitude and direction of the indirect associations differ selectively depending on the specific destination attribute or travel motivation considered. Particularly striking differences emerge for primary travel motivations, whose indirect associations with loyalty tend to be absent or negative among non-frequent visitors but positive among frequent visitors.
4.5. Assessment of the Hypotheses
To provide an integrated overview of the empirical findings,
Table 5 summarizes the final assessment of hypotheses H1–H9. Given the multidimensional nature of perceived destination attribute salience and the categorical specification of primary travel motivations, several hypotheses receive partial rather than full support. This distinction reflects heterogeneity across individual attribute dimensions, motivational categories, and visit-frequency groups rather than an absence of the proposed relationships.
Overall, the results provide strong support for the central proposition of the study: destination loyalty formation is structurally heterogeneous across visit-frequency segments. The satisfaction–loyalty relationship (H3) is consistently supported, while the direct and indirect effects of destination attribute salience and primary travel motivations vary across dimensions and visitor groups. Most importantly, the significant cross-group differences observed in several direct and mediated pathways support the role of visit frequency as a boundary condition in the loyalty-formation process. Accordingly, H6 is supported, whereas H7–H9 receive partial support because moderation and moderated mediation emerge for specific structural pathways rather than uniformly across all antecedents.
5. Discussion
The findings provide empirical support for the central premise of this study: the structural relationships associated with destination loyalty in a mature tourism destination are not homogeneous across tourists with different levels of prior visitation. By distinguishing between frequent and non-frequent visitors, the multigroup analysis shows that the relationships linking perceived destination attribute salience, primary travel motivations, tourist satisfaction, and destination loyalty differ in magnitude, statistical significance, and, in some cases, direction. These findings qualify the assumption that satisfaction and its antecedents operate uniformly across tourists and support the conceptualization of visit frequency as a relevant boundary condition in the structural relationships associated with destination loyalty.
A first important finding concerns the central role of tourist satisfaction. Satisfaction exhibits a strong and positive association with destination loyalty in both visitor groups (β = 0.818 for non-frequent visitors and β = 0.782 for frequent visitors, both
p < 0.001), providing clear support for H3. This result is consistent with the extensive destination loyalty literature positioning satisfaction as a major correlate and antecedent of revisit intentions and willingness to recommend (
Chi & Qu, 2008;
Yoon & Uysal, 2005;
Prayag et al., 2017;
L. Wang & Li, 2023;
Ahn & Kim, 2024). Nevertheless, the significant cross-group difference (Wald χ
2 = 53.24,
p < 0.001) adds an important qualification: the satisfaction–loyalty association is stronger among non-frequent visitors. One possible interpretation is that tourists with less accumulated destination experience may rely more strongly on their evaluation of the current visit when expressing future behavioural intentions, whereas frequent visitors may also draw on a broader set of previous destination experiences. Familiarity, destination attachment, and accumulated successful encounters may contribute to such a pattern, although these mechanisms were not directly measured in the present study and should therefore be regarded as theoretical interpretations rather than empirically established explanations.
The relationships between perceived destination attribute salience and satisfaction provide further evidence of structural heterogeneity. Natural and Cultural Experience (I1) and Comfort and Well-being (I2) are positively associated with satisfaction in both groups, although their relative importance differs. I1 exhibits a stronger association among non-frequent visitors (β = 0.167 versus 0.130; Wald χ
2 = 10.91,
p = 0.001), whereas I2 is more strongly associated with satisfaction among frequent visitors (β = 0.127 versus 0.196; Wald χ
2 = 9.13,
p = 0.0025). This pattern is consistent with the possibility that the evaluative relevance of destination attributes differs according to tourists’ previous familiarity with the destination. Natural and cultural characteristics appear more strongly associated with satisfaction among non-frequent visitors, whereas comfort and well-being show a comparatively stronger association among frequent visitors. Recent research similarly underscores the relevance of destination-related characteristics for tourists’ post-visit evaluations and loyalty.
Li and Du (
2025), for example, found significant relationships linking destination performance with satisfaction-related evaluations and long-term destination loyalty in a cultural heritage tourism context. The present findings extend this general perspective by showing that destination-related associations with satisfaction need not be uniform across either attribute dimensions or levels of previous visitation. Such differences are also compatible with previous research suggesting that destination evaluations may vary according to previous visitation and familiarity (
Chi, 2012;
Oppermann, 2000).
The remaining attribute dimensions do not display an equally consistent pattern. Leisure and Shopping (I3) has a small negative association with satisfaction among non-frequent visitors and is not statistically significant among frequent visitors, whereas Sun and Beach (I4) is positively associated with satisfaction only among non-frequent visitors. The significant cross-group difference for I4 (Wald χ2 = 12.27, p = 0.0005) is particularly noteworthy in the context of the Canary Islands. A possible interpretation is that sun-and-beach characteristics provide greater evaluative differentiation for visitors with less previous destination experience, whereas these attributes may become more expected or familiar among frequent visitors. However, because the present data do not directly measure expectations or changes in attribute evaluation over successive visits, this explanation should remain tentative. Overall, H1 is only partially supported, indicating that destination attribute salience cannot be treated as a uniformly operating correlate of tourist satisfaction.
The results for primary travel motivations reinforce this conclusion. Rather than revealing a uniform relationship between primary motives and satisfaction, the coefficients differ considerably across visit-frequency segments. Among frequent visitors, Fun and Family are positively associated with satisfaction, whereas these relationships are not statistically significant among non-frequent visitors. Rest shows an especially notable cross-group reversal, from a small negative association among non-frequent visitors (β = −0.044, p = 0.048) to a positive association among frequent visitors (β = 0.061, p = 0.018), with a highly significant between-group difference (Wald χ2 = 136.39, p < 0.001). Hobbies is not significantly associated with satisfaction in either group, while Exploration does not reach conventional significance within either segment despite a statistically significant cross-group difference. These results provide partial support for H2 and indicate that the associations between primary travel motives and satisfaction are contingent on visit-frequency segment.
The mediation results provide an additional layer of differentiation. Rather than supporting a universal mediation mechanism, the indirect associations through satisfaction vary substantially across antecedents and visitor groups. For destination attributes, the indirect effect of I1 is positive and significant in both groups but substantially stronger among non-frequent visitors (0.355 versus 0.206; difference = 0.149, p < 0.001). I4 displays an even sharper contrast: its indirect effect is positive and significant among non-frequent visitors (0.289, p < 0.001) but virtually absent among frequent visitors (−0.005, p = 0.922), resulting in significant moderated mediation. By contrast, although I2 exhibits significant positive indirect effects in both groups, the difference between groups is not statistically significant. I3 provides no evidence of a robust cross-group mediated relationship. Consequently, H4 and H8 receive only partial support.
A similarly differentiated pattern emerges for motivations. Satisfaction significantly transmits the associations of Fun and Family with loyalty among frequent visitors but not among non-frequent visitors. Rest again displays a reversal, with a negative indirect effect among non-frequent visitors and a positive indirect effect among frequent visitors. The cross-group differences in the indirect effects of Fun, Family, Rest, and Exploration are statistically significant, whereas no evidence of moderated mediation is observed for Hobbies. These findings provide partial support for H5 and H9. More generally, they show that visit-frequency heterogeneity extends beyond individual direct paths to the indirect relationships linking motivations with loyalty through tourist satisfaction.
The direct paths to loyalty further clarify the pathway-specific nature of this heterogeneity. Among the destination attribute dimensions, only Natural and Cultural Experience (I1) shows a significant direct association with loyalty among non-frequent visitors (β = 0.036, p < 0.001), and this coefficient differs significantly from that observed among frequent visitors (Wald χ2 = 9.07, p = 0.0026). No statistically significant cross-group differences emerge for I2, I3, or I4. H7 is therefore only partially supported. This finding is theoretically relevant because it indicates that visit-frequency moderation is not distributed uniformly across the destination-attribute system but is concentrated in particular structural relationships.
The motivational direct effects provide stronger evidence of cross-group heterogeneity. All five motivation–loyalty paths exhibit statistically significant cross-group differences, although the significance and direction of the individual within-group coefficients vary. Particularly noteworthy are the sign reversals observed for Family, Rest, and Exploration, whose direct coefficients are negative among non-frequent visitors and positive among frequent visitors. Fun also exhibits a significant cross-group difference despite neither within-group coefficient reaching conventional statistical significance. Hobbies is negatively associated with loyalty among non-frequent visitors but not significantly associated with loyalty among frequent visitors. Taken together, these results support H6 and indicate that the structural associations between primary travel motivations and destination loyalty differ systematically across visit-frequency segments. Importantly, given the cross-sectional design, these differences should not be interpreted as evidence that repeated visitation itself causes the observed changes in motivational relationships.
The negative direct coefficients observed in some of these models require particular caution. They should not automatically be interpreted as evidence that particular motivations or destination attributes reduce loyalty in substantive behavioural terms. Because satisfaction is simultaneously included as a strong proximal predictor of loyalty, the direct coefficients represent residual associations after accounting for the pathway operating through satisfaction. The coexistence of direct and indirect effects with different signs is statistically compatible with inconsistent mediation or suppression-type patterns (
Conger, 1974;
Zhao et al., 2010). The present findings therefore establish a statistical pattern but do not identify the underlying psychological mechanism. Explanations involving changes in expectations, cognitive processes, familiarity, or affective responses would require purpose-designed longitudinal or experimental data.
Taken together, the findings refine the conventional satisfaction–loyalty framework in three main respects. First, satisfaction remains the most consistent and strongest proximal correlate of destination loyalty across both experience segments, although its association with loyalty is significantly stronger among non-frequent visitors. Second, the antecedent relationships involving destination attributes and primary motivations are heterogeneous: their associations with satisfaction and loyalty vary across frequent and non-frequent tourists. Third, visit frequency represents a meaningful boundary condition because several direct and indirect pathways differ significantly between groups. At the same time, the partial support obtained for H1, H2, H4, H5, H7, H8, and H9 demonstrates that this heterogeneity is pathway-specific rather than universal. This selective pattern provides a useful contrast with recent evidence from Thailand, where
Sodawan and Hsu (
2025) found no significant structural differences between first-time and repeat travellers across the destination image–loyalty relationships examined. Considered together, these findings suggest that structural heterogeneity associated with previous visitation should not be assumed to operate uniformly across destinations or structural pathways, but should instead be established empirically for the specific relationships under investigation.
Finally, the findings should be interpreted as structural associations rather than causal effects. The cross-sectional research design does not establish temporal precedence or demonstrate that increasing visit frequency causes changes in the loyalty-formation process. Moreover, the use of secondary institutional measures entails psychometric constraints, including relatively low reliability for Tourist Satisfaction and suboptimal convergent validity for some destination-attribute dimensions, as discussed in the measurement-model assessment and limitations section. Nevertheless, the combination of a large destination-level sample, multigroup structural estimation, measurement-invariance assessment, and formal cross-group tests provides substantial evidence of systematic structural heterogeneity between frequent and non-frequent visitors. In this sense, the study extends destination loyalty research by showing that previous visitation is associated not only with differences in individual structural coefficients but also with differences in the indirect pathways linking destination attributes and primary travel motivations to loyalty through tourist satisfaction.
6. Conclusions
6.1. Theoretical Conclusions
This study contributes to the destination loyalty literature by moving beyond homogeneous satisfaction–loyalty models and showing that the structural relationships associated with destination loyalty differ according to tourists’ previous visitation experience. By conceptualizing visit frequency as a boundary condition and examining both direct and satisfaction-mediated relationships, the study provides a more differentiated account of how perceived destination attribute salience and primary travel motivations are associated with destination loyalty in a mature tourism destination.
First, the findings reinforce the central role of tourist satisfaction. Satisfaction was strongly and positively associated with destination loyalty in both visitor groups (H3), confirming its position as the most consistent proximal correlate of both revisit intention and willingness to recommend within the proposed framework. Importantly, however, the strength of this relationship differed significantly between groups and was stronger among non-frequent visitors. This result indicates that the satisfaction–loyalty relationship itself is not structurally invariant across levels of previous visitation and provides evidence against assuming a single homogeneous relationship for all tourists.
Second, the results show that the antecedent relationships involving perceived destination attribute salience cannot be assumed to operate uniformly across visitor segments. Natural and Cultural Experience (I1) and Comfort and Well-being (I2) were positively associated with satisfaction in both groups, although their relative strength differed significantly. Leisure and Shopping (I3) showed only a small negative association among non-frequent visitors and no significant association among frequent visitors, whereas Sun and Beach (I4) was positively associated with satisfaction only among non-frequent visitors. Accordingly, H1 was only partially supported. These findings indicate that the structural relevance of destination attributes for satisfaction differs according to previous visitation, although the cross-sectional design does not establish that accumulated experience causes these differences.
A similarly heterogeneous pattern emerged for primary travel motivations. Relative to the “Other motivation” reference category, the associations of Fun, Family, Rest, Hobbies, and Exploration with satisfaction differed across frequent and non-frequent visitors. Fun and Family were positively associated with satisfaction among frequent visitors but not among non-frequent visitors, while Rest displayed coefficients of opposite signs across the two groups. Hobbies was not significantly associated with satisfaction in either group, and Exploration did not reach conventional significance within either segment despite a significant cross-group difference. H2 was therefore partially supported. This differentiated pattern is consistent with recent evidence suggesting that motivational dimensions need not contribute uniformly to tourists’ post-visit evaluations.
Orden-Mejía et al. (
2025), for example, found that some motivational dimensions were significantly associated with perceived destination quality whereas others were not. Although their study examines adventure tourism and destination quality rather than the categorical motivation–satisfaction relationships analyzed here, their findings similarly highlight the importance of distinguishing among specific motivational drivers rather than assuming a homogeneous motivational effect. The present findings extend this perspective by showing that the relationships between primary travel motives and satisfaction are also contingent on previous visitation.
Third, the mediation analysis provides further evidence of the central role of satisfaction while also demonstrating that the indirect relationships are antecedent- and group-specific. The indirect associations between destination attribute dimensions and loyalty through satisfaction varied across the two segments (H4), as did those involving primary travel motivations (H5). Both mediation hypotheses were therefore only partially supported. Rather than supporting a single universal mediation pattern, the results identify differentiated indirect pathways linking destination attributes and motivations with loyalty through satisfaction.
Fourth, the multigroup analysis identifies visit frequency as an important source of structural heterogeneity. All five motivation–loyalty relationships exhibited statistically significant cross-group differences, supporting H6, although not every individual within-group coefficient was statistically significant. Several coefficients also differed in direction across groups. These findings demonstrate that the structural associations between primary travel motivations and destination loyalty differ systematically between frequent and non-frequent visitors. They should not, however, be interpreted as evidence that repeated visitation itself causes these differences.
The moderating pattern was more selective for perceived destination attribute salience. Natural and Cultural Experience (I1) exhibited a significant cross-group difference in its direct association with loyalty, whereas Comfort and Well-being (I2), Leisure and Shopping (I3), and Sun and Beach (I4) did not. H7 was therefore partially supported. This result is theoretically relevant because it shows that visit-frequency heterogeneity is pathway-specific rather than uniformly distributed across the destination-attribute system.
The moderated mediation results reinforce this conclusion. Significant cross-group differences in indirect effects were identified for Natural and Cultural Experience (I1) and Sun and Beach (I4), whereas those associated with Comfort and Well-being (I2) and Leisure and Shopping (I3) did not differ significantly between groups. H8 was therefore partially supported. Likewise, moderated mediation was identified for Fun, Family, Rest, and Exploration, but not for Hobbies, providing partial support for H9. Visit frequency is thus associated not only with differences in selected direct relationships but also with differences in several satisfaction-mediated pathways.
Taken together, these findings refine the conventional destination satisfaction–loyalty framework in an important way. Visit frequency should not be regarded merely as a descriptive segmentation variable or an additional statistical control. Instead, the results support its conceptualization as a theoretically relevant boundary condition for selected structural relationships associated with destination loyalty. At the same time, the evidence cautions against portraying this heterogeneity as universal: some relationships vary substantially between visitor groups, whereas others remain comparatively stable.
The study therefore contributes to the literature by replacing the assumption of a single homogeneous loyalty structure with a conditional structural perspective. In mature destinations characterized by substantial repeat visitation, destination loyalty is associated with both robust common relationships—most notably the strong satisfaction–loyalty association—and visit-frequency-specific pathways whose magnitude, significance, and, in some cases, direction differ between frequent and non-frequent visitors. This perspective provides a more nuanced understanding of destination loyalty and establishes a basis for further longitudinal research into previous visitation as a boundary condition in tourism and hospitality behaviour.
6.2. Management Implications
The findings provide several practical implications for Destination Management Organizations (DMOs) operating in mature tourism destinations characterized by substantial repeat visitation. The principal managerial implication is that visit frequency can provide a useful additional criterion for destination segmentation and loyalty management. The results indicate that frequent and non-frequent visitors do not exhibit identical structural relationships among destination attributes, travel motivations, satisfaction, and loyalty. Consequently, destination strategies based exclusively on aggregate satisfaction measures may overlook relevant differences between visitor segments.
First, tourist satisfaction remains a fundamental managerial objective for both groups. Its strong positive association with destination loyalty among both non-frequent and frequent visitors confirms the managerial relevance of maintaining high levels of visitor satisfaction regardless of previous destination experience. However, because the satisfaction–loyalty association is significantly stronger among non-frequent visitors, satisfaction indicators should ideally be interpreted jointly with information on previous visitation. Destination monitoring systems could therefore cross-classify satisfaction measures by visit frequency rather than relying exclusively on aggregate destination-level scores.
Second, the results provide a basis for differentiating the management and communication of destination attributes. Natural and Cultural Experience (I1) and Comfort and Well-being (I2) were positively associated with satisfaction in both groups, suggesting that landscapes, cultural and heritage resources, environmental quality, authenticity, safety, accessibility, accommodation, and tranquillity remain relevant components of the visitor experience across segments. Nevertheless, because the strength of these associations differs according to visit frequency, DMOs may benefit from adapting the emphasis placed on particular attributes to tourists’ previous familiarity with the destination.
Sun and Beach (I4) deserves particular attention. Its positive association with satisfaction among non-frequent visitors, together with the absence of a comparable relationship among frequent visitors, indicates that climate, beaches, and the sea are more strongly associated with satisfaction within the non-frequent segment in the present data. For visitors with limited previous experience, destination communication can therefore continue to emphasize these core attributes. For frequent visitors, the results provide less evidence that emphasizing these already familiar characteristics alone is associated with additional satisfaction. Communication aimed at this segment could consequently complement traditional sun-and-beach positioning with less familiar or more diversified destination experiences.
Third, the results concerning primary travel motivations indicate that motivation-based segmentation could complement conventional demographic, geographic, and behavioural segmentation. The associations of Fun, Family, Rest, Hobbies, and Exploration with satisfaction and loyalty differ across frequency groups. Rather than assuming that a particular motivation has the same implications for all visitors, DMOs could combine motivational information with previous-visitation data when designing tourism products and communication strategies.
This principle may be particularly relevant to Exploration. The findings do not imply that repeat visitors necessarily seek novelty, since novelty seeking was not directly measured. Nevertheless, the significant differences associated with Exploration suggest that recurrent visitors constitute an appropriate segment for testing diversified destination propositions. In mature destinations such as the Canary Islands, these could include thematic itineraries, local cultural experiences, nature-based activities, lesser-known attractions, and opportunities for broader territorial exploration. Such initiatives may also be consistent with destination policies aimed at dispersing tourism activity beyond the most intensively visited areas.
Fourth, the moderated mediation results provide a more selective basis for segmentation. The indirect associations of Natural and Cultural Experience (I1) and Sun and Beach (I4) with loyalty through satisfaction differed significantly between frequency groups, whereas those of Comfort and Well-being (I2) and Leisure and Shopping (I3) did not. This distinction suggests that DMOs need not develop separate strategies for every destination-attribute dimension. Segmentation efforts may be more efficiently concentrated on those dimensions for which the empirical evidence indicates significant structural differences between frequent and non-frequent visitors.
A similar principle applies to travel motivations. Satisfaction-mediated associations differed significantly across visit-frequency groups for Fun, Family, Rest, and Exploration, but not for Hobbies. These results can help identify combinations of motivation and visit frequency that merit closer managerial attention. However, because the study is based on observational cross-sectional data, these patterns should be used as evidence for segmentation and further testing rather than as deterministic prescriptions for resource allocation.
From an operational perspective, the findings support incorporating previous-visitation information into destination intelligence and customer-relationship systems where legally and technically feasible. Subject to applicable data-protection requirements, tourism surveys, destination platforms, loyalty programmes, and digital communication systems could distinguish between visitors with different levels of previous destination experience. This would enable DMOs to evaluate whether destination messages, experience recommendations, and post-visit communications perform differently across visit-frequency segments.
For non-frequent visitors, the results support particular attention to satisfaction with the current destination experience and to the destination attributes most strongly associated with that evaluation. For frequent visitors, management may additionally benefit from maintaining a diversified portfolio of experiences that extends beyond attributes already well known to recurrent tourists. Personalized recommendations, thematic itineraries, cultural engagement, and opportunities to encounter less familiar aspects of the destination represent potential strategies to be evaluated within this segment rather than direct consequences established by the present analysis.
Finally, statistically significant negative direct coefficients should not be translated mechanically into managerial recommendations to discourage particular motivations or destination attributes. In a model in which satisfaction operates simultaneously as a mediator, these coefficients represent residual structural associations after accounting for the satisfaction pathway and may be consistent with inconsistent mediation or suppression-type patterns. Managerial interpretation should therefore consider direct, indirect, and cross-group relationships jointly rather than relying on the sign of an isolated coefficient.
Overall, the managerial contribution of the study lies not in proposing two entirely separate destination strategies, but in identifying where segmentation by visit frequency appears empirically relevant and where structural relationships remain comparatively stable. For mature destinations, the findings support a selective experience-based segmentation approach: maintaining destination attributes associated with satisfaction across visitor groups while adapting communication, experience design, and loyalty initiatives in those areas where significant structural heterogeneity between frequent and non-frequent visitors is observed.
6.3. Limitations and Further Research
Despite the large analytical sample and the use of multigroup structural equation modelling, several limitations should be acknowledged. These limitations qualify the interpretation of the findings and provide relevant directions for future research.
First, the study relies on cross-sectional secondary data collected through the Canary Islands Tourist Expenditure Survey. Consequently, the structural relationships identified in the model should be interpreted as statistical associations rather than as evidence of causal effects. Although the proposed relationships are theoretically grounded, the cross-sectional design does not establish temporal precedence among destination attribute salience, primary travel motivations, tourist satisfaction, and destination loyalty. Future research could employ longitudinal or panel designs to examine how these relationships evolve across successive visits and whether the structural differences observed between frequent and non-frequent visitors reflect changes in loyalty formation as destination experience accumulates over time.
Second, the use of an institutional secondary dataset imposes important constraints on construct operationalization. The survey was originally designed for official tourism statistics and expenditure monitoring rather than specifically for latent-variable modelling. The study was therefore restricted to the indicators available in the ISTAC questionnaire. This limitation is particularly relevant to Tourist Satisfaction, which was measured by two indicators using different response formats, and to the destination attribute dimensions derived from the institutional questionnaire. Destination Loyalty was also represented by only two indicators, although these displayed comparatively strong measurement properties. Future studies should replicate the proposed framework using purpose-designed psychometric instruments with a broader set of indicators for each construct and consistent response formats.
Third, the final measurement model displayed heterogeneous psychometric performance across constructs. The refined CFA yielded χ2(152) = 19,779.242, RMSEA = 0.058, CFI = 0.918, TLI = 0.897, and SRMR = 0.052. Thus, RMSEA and SRMR indicated acceptable absolute fit and CFI exceeded the conventional 0.90 benchmark, whereas TLI remained marginally below it. More importantly, several individual indicators showed standardized factor loadings below 0.50, and the AVE values for I1 (0.383), I2 (0.368), and I3 (0.412) remained below the conventional 0.50 benchmark. Internal consistency was also comparatively weak for some constructs, particularly Tourist Satisfaction (Cronbach’s α = 0.547), although its composite reliability (CR = 0.649) and AVE (0.504) were more favourable. These results indicate that the structural findings involving the weaker measurement domains should be interpreted with appropriate caution. The indicators were retained to preserve the substantive coverage of the institutional measurement framework rather than on the assumption of uniformly strong psychometric performance. Replication using dedicated multi-item scales would therefore be valuable for assessing the robustness of the structural relationships reported here.
Fourth, the multigroup measurement analysis supported metric invariance and subsequently partial, rather than full, scalar invariance. Partial scalar invariance was obtained after releasing equality constraints on the intercepts of the experience-rating and intention-to-return indicators. This provides an appropriate basis for the study’s primary purpose of comparing structural relationships across frequent and non-frequent visitors, while requiring greater caution regarding comparisons involving latent construct levels. Accordingly, the present study does not draw substantive conclusions from latent mean differences between the two groups and concentrates instead on cross-group differences in structural path coefficients and indirect effects. Future research using instruments explicitly designed for cross-group equivalence could seek stronger scalar invariance and investigate whether visitor-frequency groups also differ systematically in latent levels of satisfaction, destination attribute salience, and loyalty.
Fifth, visit frequency was operationalized categorically, distinguishing non-frequent from frequent visitors using a three-visit threshold. Although this segmentation provides a theoretically interpretable and managerially useful comparison, categorization necessarily simplifies the underlying continuum of accumulated destination experience. Future research could model visit frequency as a continuous or ordinal moderator, distinguish first-time visitors from second-time and highly recurrent visitors, or incorporate complementary dimensions of destination familiarity, such as cumulative length of stay, time since the first visit, or the intensity and recency of previous destination experiences. Because the present study did not conduct additional sensitivity analyses using alternative visit-frequency thresholds or alternative measurement specifications, future research should assess the robustness of the reported structural heterogeneity under competing operational decisions.
Sixth, the interpretation of negative direct coefficients observed for some structural relationships requires particular caution. When a strong mediator such as satisfaction is introduced, a negative residual direct coefficient alongside an indirect effect of a different sign may be statistically compatible with inconsistent mediation or suppression-type patterns. However, the present analyses do not directly identify the psychological mechanism responsible for these coefficient patterns. They should therefore not be interpreted as evidence that non-frequent visitors experience frustration, disappointment, weaker affective attachment, or other unmeasured psychological states. Future studies could explicitly test alternative mediation and suppression mechanisms and incorporate constructs such as expectation–performance disconfirmation, destination attachment, novelty seeking, perceived value, and emotional responses to determine which psychological processes, if any, account for these statistical patterns.
Finally, the empirical context is a highly mature island destination characterized by a substantial proportion of repeat visitors. This setting is particularly appropriate for examining structural heterogeneity according to visit frequency, but it may limit the generalizability of the findings to emerging destinations, urban destinations, or tourism contexts dominated by first-time visitors. Comparative studies across destinations at different stages of tourism development would therefore be especially valuable for determining whether the structural differences observed here generalize beyond the Canary Islands or are particularly characteristic of mature tourism ecosystems.




 ,
,