1. Introduction
Tourist event experiences are significant drivers of economic activity (
Getz, 2008). When taking place in natural settings, tourist events are crucial for connecting people with nature (
Balmford et al., 2015). However, holding tourism events in vulnerable areas presents a pair of opposing risks, where if too many tourists come, their impact may degrade the very ecosystems being protected (
Mateos et al., 2020). Conversely, if too few tourists come, authorities cannot justify the maintenance and protection of the natural area from development (
Smith et al., 2019). Measuring and understanding experiences from tourism events are therefore vital from a management and natural resource perspective. It allows site managers to identify patterns of use, evaluate the quality of recreational facilities, and assess how much visitors benefit from experiencing a specific place (
Fredman & Tyrväinen, 2010). Measuring visitor experiences is also crucial to dealing with potential conflicts between conservation and tourism goals (
Fredman & Tyrväinen, 2010). With this article, we aim to advance tourism event experience measurement and visualization methodologies, with a focus on a key variable of experiences, namely emotion.
Multiple methods exist for measuring emotion. In recent years, scholars have asserted that measuring emotion with spatial resolution—literally, putting emotions on the map—is uniquely powerful in supporting event experience management (
Kirchberg & Tröndle, 2015;
Pánek & Benediktsson, 2017). For example, seeing a map of a cultural heritage landscape facilitated the (re)design of guided tours to facilitate connections between tourists and local residents (
Mitas et al., 2020); however, previous attempts to visualize emotions on maps have left two significant gaps in methodological knowledge. First, previous studies have mostly focused on urban or cultural heritage locations, leaving the applicability of spatial emotion mapping to nature-based tourism events untested. Second, previous studies have neglected to apply multiple measurement methods to a single site, making comparisons of affordances and limitations of these various methods impossible.
Therefore, this study explores three spatial emotion measurement methods: (1) experience reconstruction maps; (2) emotion physiology maps; and (3) emotion effectiveness maps. The objective of this comparison is to determine the relative affordances and limitations of each, so that researchers and managers can make optimal choices in selecting spatial visualizations for their needs. For the first time, all three methods are applied to the same nature-based tourism event locations. To enhance the relevance of this comparison, we use two different green fort locations in the Netherlands, where visitors engage in comparable tourism events, yet within distinct facilities and spatial layouts. Furthermore, all three map methods are compared against statistical models of physiological arousal as a function of location and emotion self-report.
Our findings extend current theories of experience and emotion, as well as contributing concrete insights on the usefulness of specific mapping methods. However, it is important to note that our contribution is primarily methodological, not theoretical, and thus aims to support better decision-making for tourism event management. Such methodological guidance was previously lacking in the nascent emotion-mapping literature, and entirely absent in the context of tourism event management.
2. Literature Review
2.1. Experiences
Individuals assign meanings to locations where events take place based on their
experiences (
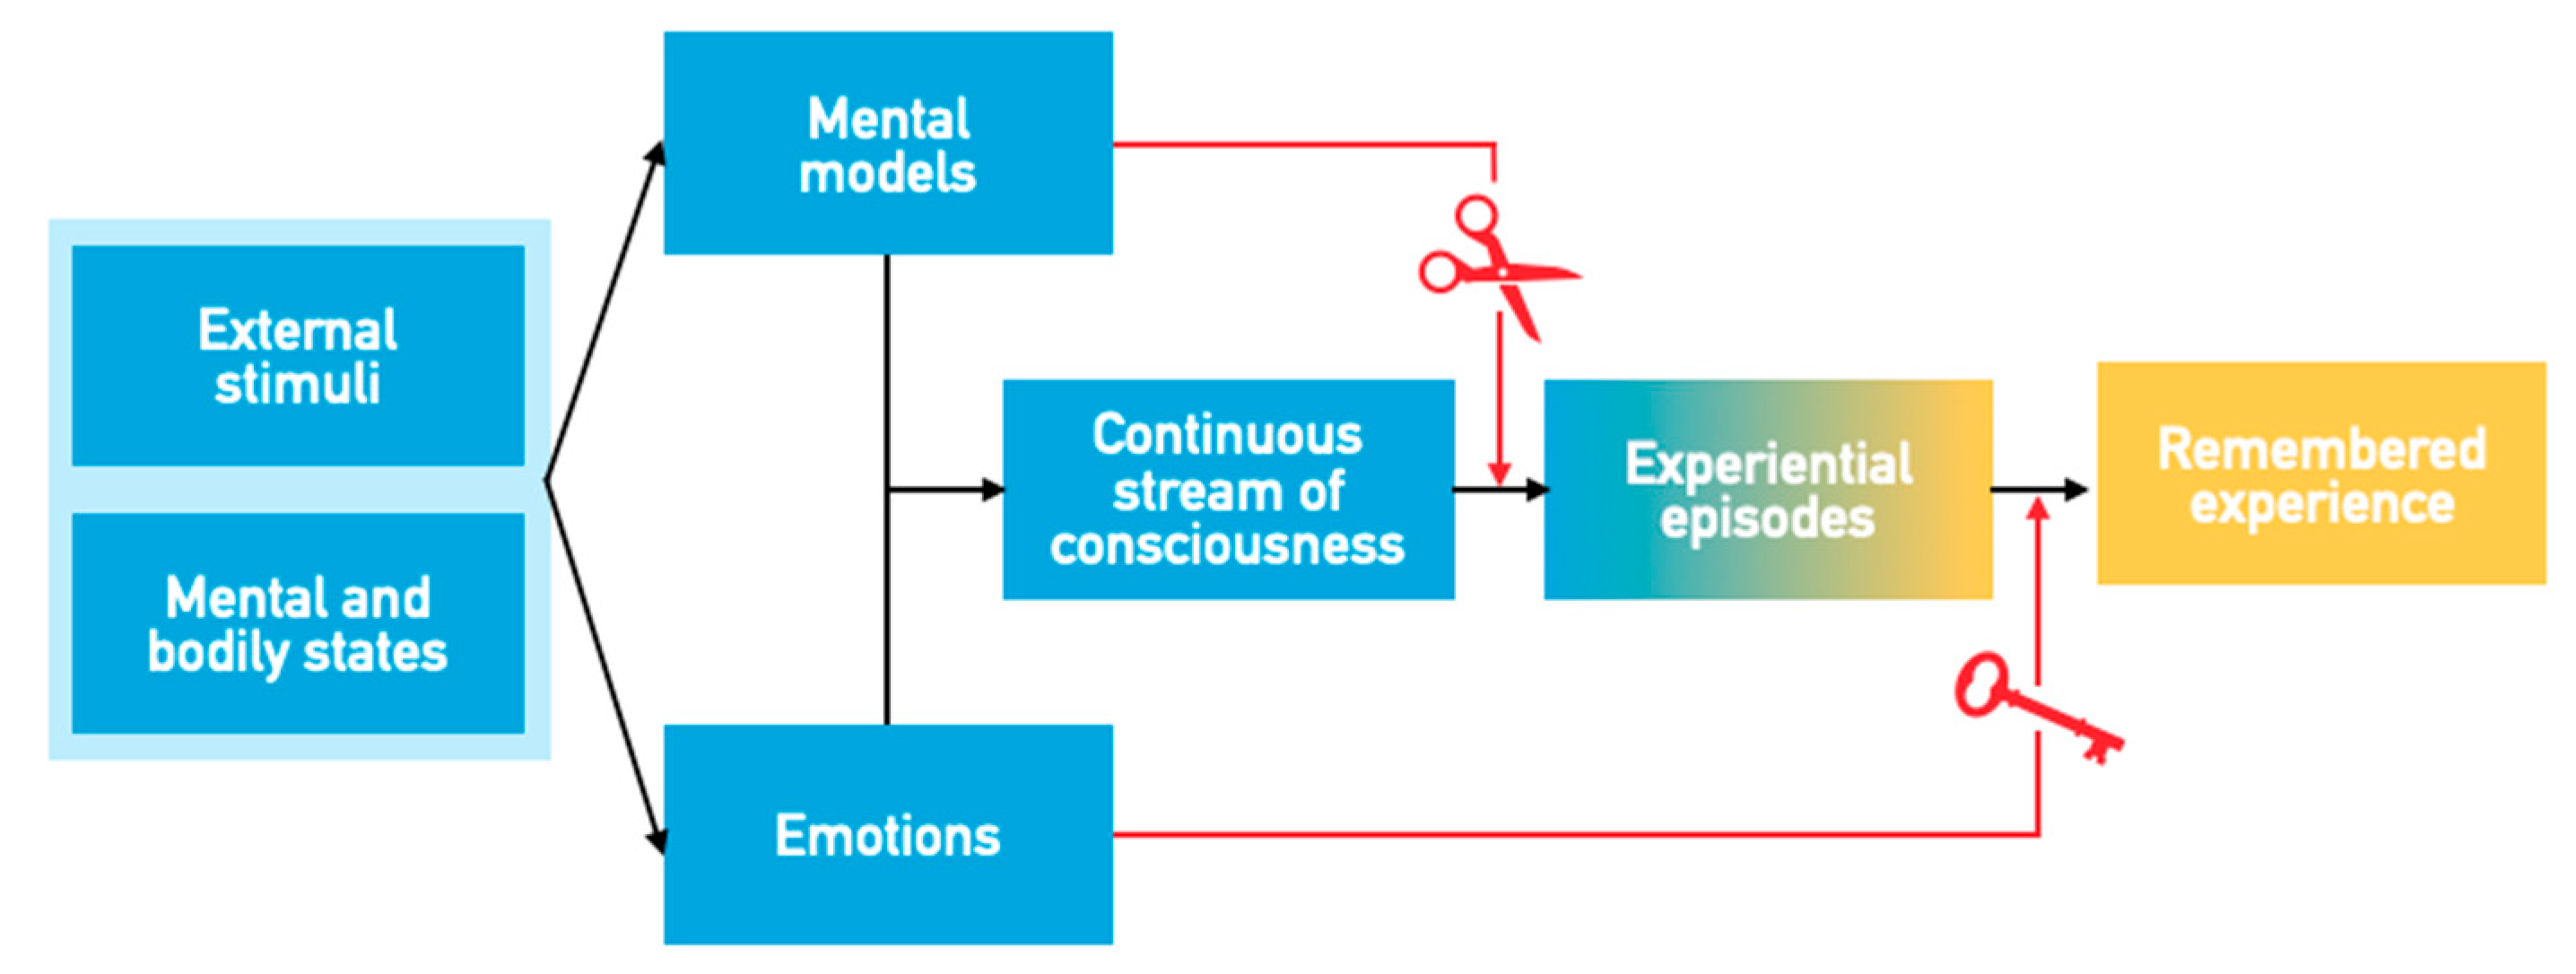
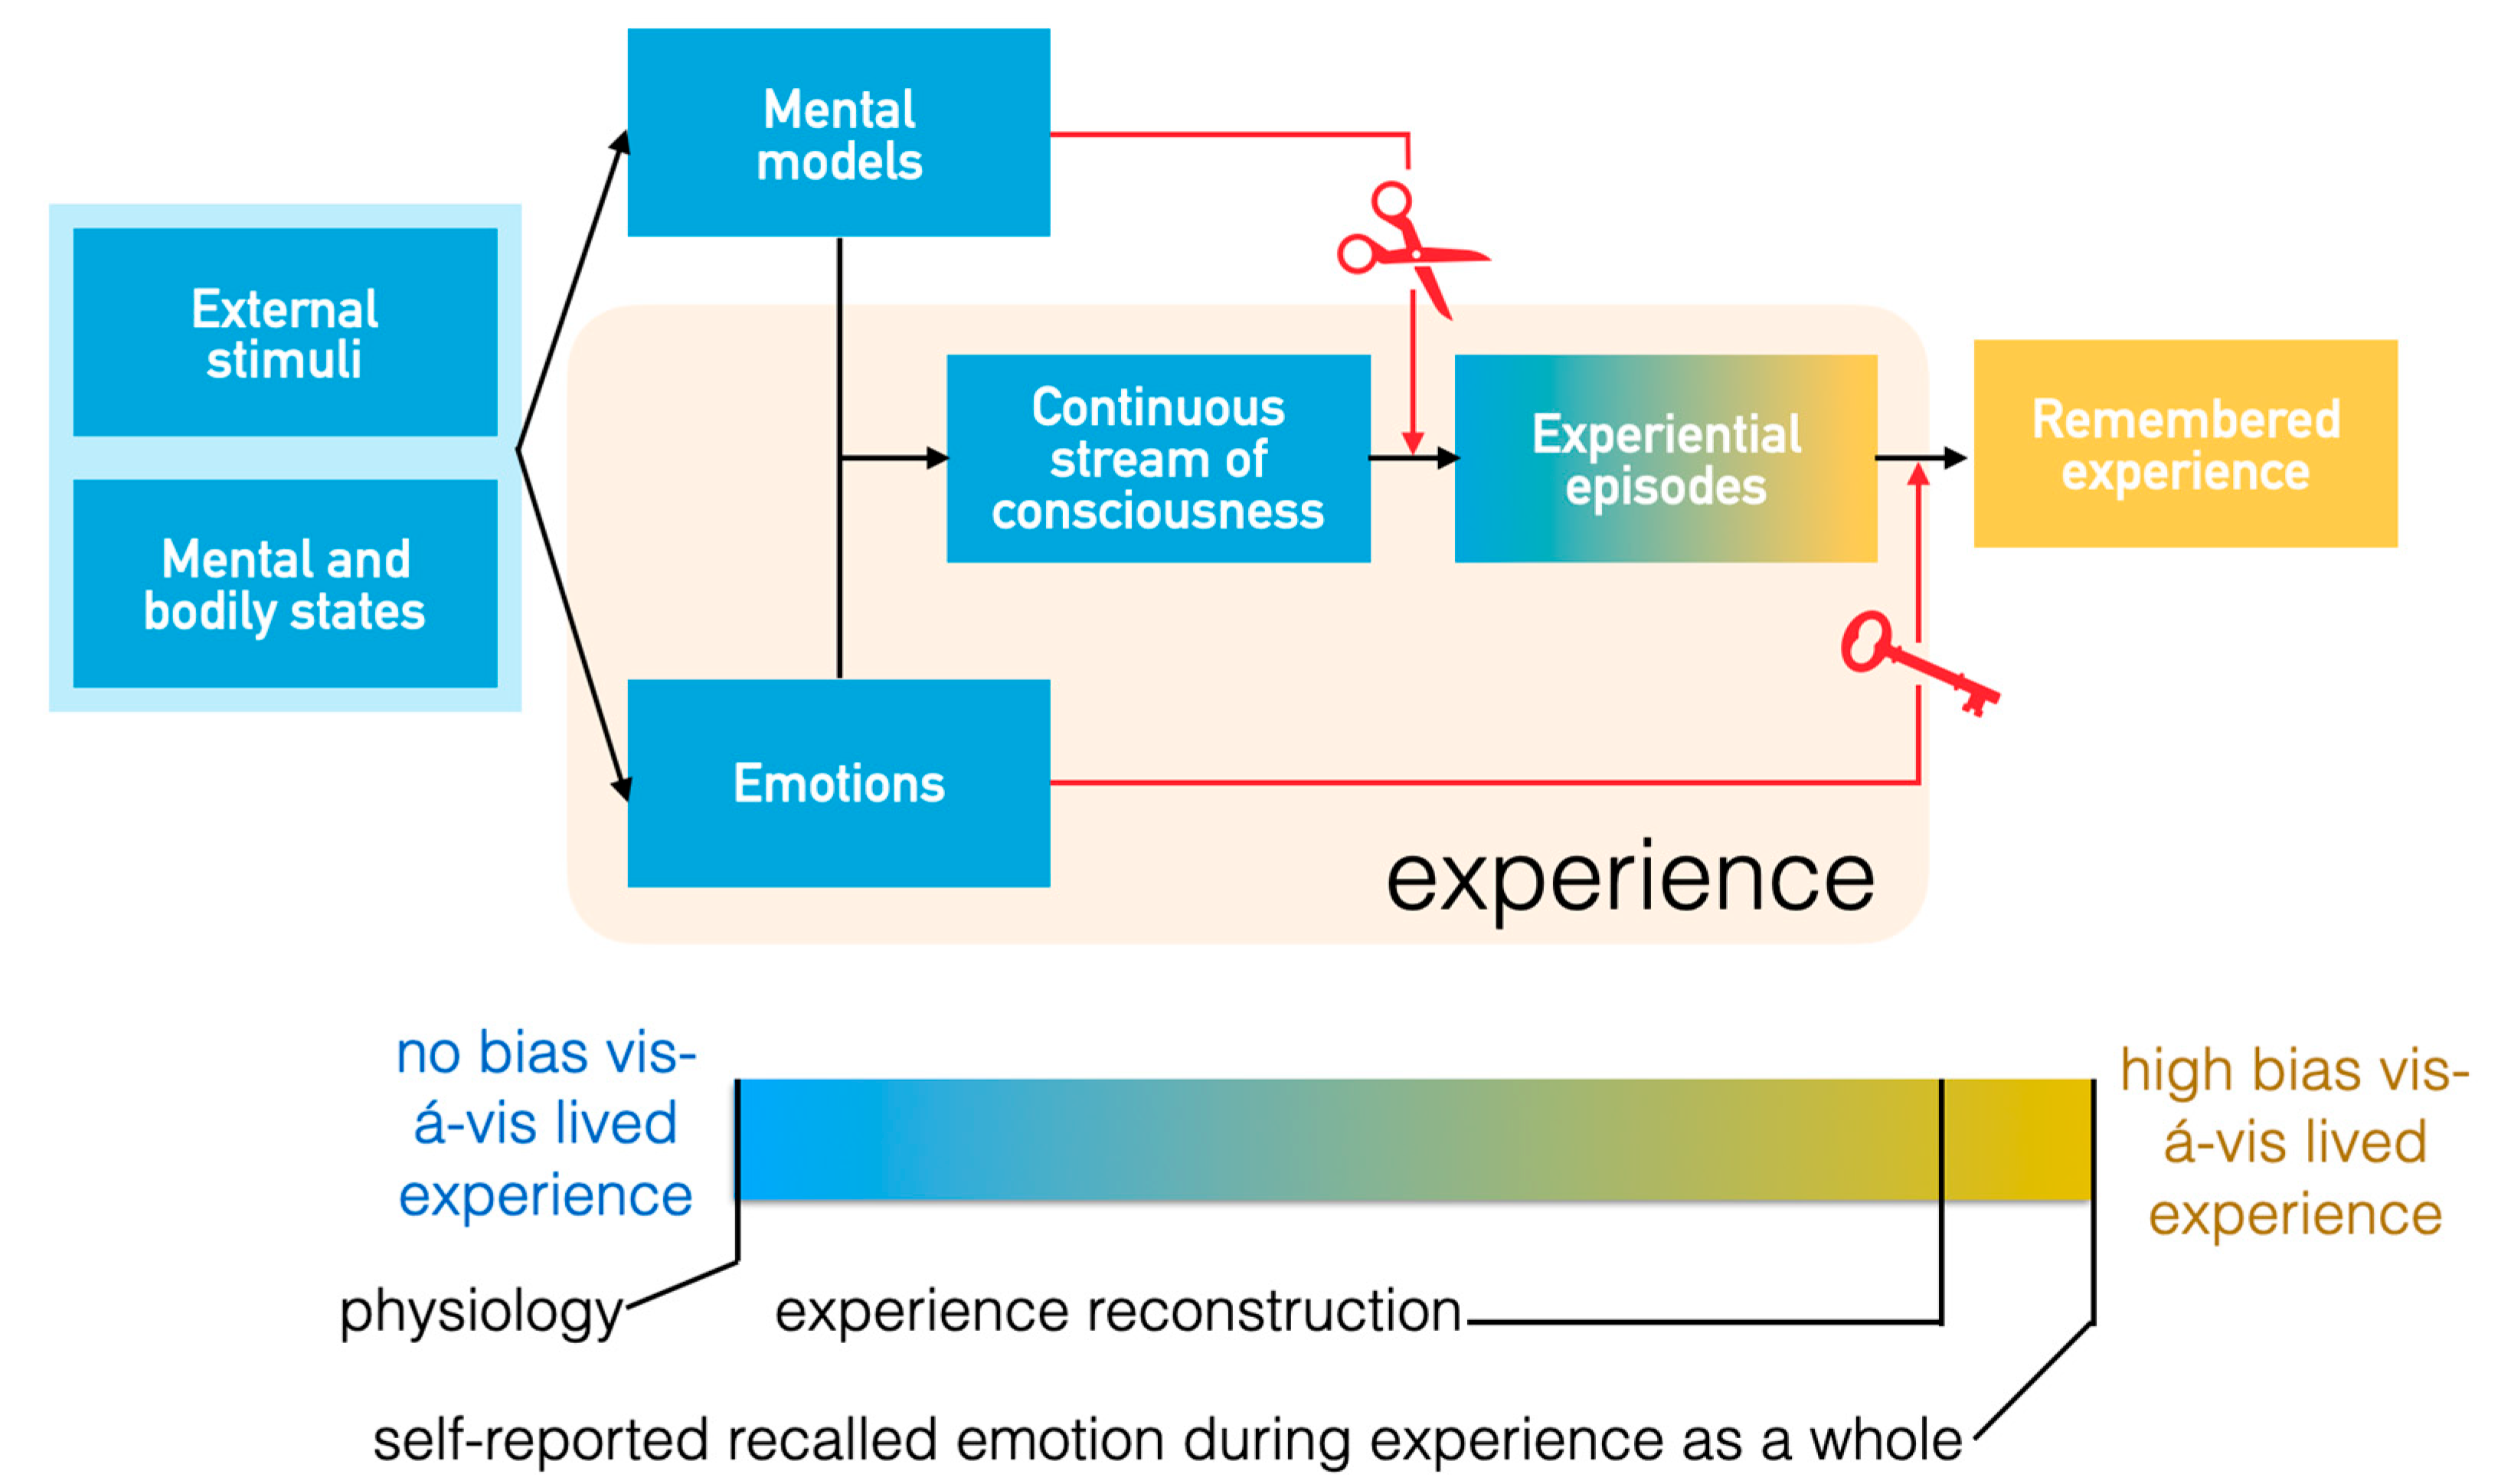
Mitas et al., 2020). Definitions of experiences vary across philosophy, neuroscience, and the social sciences; however, experiences are broadly understood as the conscious content of a person’s mind. According to the theory of experience by
Bastiaansen et al. (
2019), information from the senses triggers mental models, producing a stream of consciousness in the mind. This is also called lived experience (
Kahneman, 2011;
Zajchowski et al., 2016) or immediate conscious experience (
Ellis et al., 2020). Mental models for periods of time, such as ‘morning’ or ‘coffee break’ then segment the stream of consciousness into episodes (
Baddeley, 2000;
Brewer, 1987). Episodes with consequences for an individual’s interests trigger strong emotions. According to
Bastiaansen et al. (
2019), emotions are crucial for both memory and behavior. The
Bastiaansen et al. (
2019) process theory of experience (
Figure 1) has served as a comprehensive theory of experience in recent tourism research (
Mitas et al., 2020;
Strijbosch et al., 2021). In line with this theory,
Pearce and Zare (
2017) as well as
Scott and Le (
2017) both positioned emotion as a crucial ingredient in tourism experiences. Only emotionally loaded episodes are remembered or trigger behavioral consequences; thus, measuring emotions is required for designing and managing experiences.
Although emotions have been overlooked in the early decades of tourism management research (
Bastiaansen et al., 2019;
Moyle et al., 2017), their prominence in the field is increasing; however, combining the measurement of emotion with location tracking is technically difficult. Emotions come and go quickly and unpredictably. If people are asked to report their emotions consciously, their responses carry systematic biases (
Bastiaansen et al., 2019). Previous approaches to measuring emotions are difficult to map to specific locations. Thus,
Bastiaansen et al. (
2019) proposed the use of neuroscience methods such as electroencephalography, heart rate, facial expressions, and skin conductance, providing finer-grained insight into how emotions arise. Some of these can also be linked to location data. With this recommendation in mind, we summarize existing knowledge on emotion measurement.
2.2. Emotion Measurement Methods
2.2.1. Retrospective Self-Report
Previous studies in the tourism research literature have relied on self-reporting to measure emotion, most often through questionnaires that participants fill out after an experience. While useful for measuring cognitive variables such as experience evaluations, retrospective self-reports carry three limitations when recording emotion dynamics. First, retrospective measures get at how memories are recalled, not how they are experienced in the moment, which can lead to aggregation and temporal biases (
Tonetto & Desmet, 2016). Second, self-reports are often skewed by social desirability bias and participants’ attempts to regulate their emotions (
Larsen & Fredrickson, 1999). Third and final, self-reports miss preconscious emotional processes that subsequently shape conscious and remembered emotions (
Winkielman & Berridge, 2004). These limitations hinder managers from optimizing facilities and researchers from clarifying which aspects of tourism events have what extent of emotional impact. Therefore, self-report could be complemented with contemporary neuroscience methods, empowering sufficiently valid, reliable, and dense measurement to temporally and spatially resolve within-individual emotion change (
Bastiaansen et al., 2019). Until recently, these methods were expensive, and researchers wishing to measure within-individual emotion change usually resorted to ecological momentary assessment.
2.2.2. Ecological Momentary Assessment
Ecological momentary assessment involves using a mobile device (previously pagers; now usually a smartphone) to interrupt an experience on multiple occasions and asking participants to briefly report what they are feeling in that exact moment (
Cziksentmihalyi & Larson, 1987). While long considered a ‘gold standard’ of emotion measurement (
Kahneman et al., 2004), ecological momentary assessment has two substantial disadvantages that prevent us from considering it further. First, because it uses a questionnaire to ask participants to rate their emotions, it requires participants to think about what they are feeling before answering. Thus, despite aiming very close in time and location to the lived experience of an emotion, ecological momentary assessment is still in fact measuring recalled emotion. Even if the recall occurs over a very short time window, it still passes through cognitive filters such as social desirability and emotion regulation, imposing the same systematic biases on responses as cross-sectional questionnaires (
Bastiaansen et al., 2019).
A second and unique shortcoming of ecological momentary assessment is that it interrupts the natural unfolding of attention over the course of an experience (
Cziksentmihalyi, 1990). Someone dancing at a festival interrupted by a questionnaire notification must stop, take out their device, and give an emotion rating. A cyclist traveling to an event location must identify a safe stopping point, interrupt the flow they may be experiencing, and tap a button to give an emotion rating. Not only are such disruptions typically negative, as they interfere with inherently positive focus on the here and now (
Killingsworth & Gilbert, 2010), but they may also change the ebb and flow of emotions over time. For example, if a visitor knows they will be interrupted three times over the next several hours, they may start to anticipate the disruptions and find it more difficult to focus on their social context.
2.2.3. Experience Reconstruction Self-Report
Kahneman et al. (
2004) developed an alternative to experience sampling, the day reconstruction method. Without interrupting experiences, they conducted narrative interviews at the end of a given day, segmented the data into experiential episodes, and elicited emotion ratings per episode.
Kahneman et al. (
2004) found this method to be comparable in validity, reliability, and precision to ecological momentary assessment.
Strijbosch et al. (
2019) adapted the method to a single experience, using linking words such as ‘then’ and ‘after that’ to segment a narrative into episodes, and termed this the ‘experience reconstruction method.’ Because the process of segmenting each participant’s narrative was laborious,
Strijbosch et al. (
2021) simplified the method, identifying episodes (scenes) in a highly structured event (a musical performance) a priori and using photos and descriptions to represent these in a questionnaire.
Experience reconstruction is relatively simple to fit into a questionnaire. If a researcher can identify locations which participants process as distinct episodes—such as sculptures in a sculpture garden, or different stages at a festival—experience reconstruction can also be used to connect emotional data with somewhat specific locations. However, the method has its own limitations; as with all self-report methods, it still depends on participants to think about and judge their past emotions. Thus, it is still limited by biases due to social desirability and recall. Second, experience reconstruction depends on participants accurately recalling the exact location the questionnaire is presented. Third, researchers must trade off resolution with participant burden. If too many locations are asked about, participants may become irritated or impatient, affecting the validity of their responses.
2.2.4. Facial Expression Analysis
Researchers in the 1970s and 1980s, most notably Paul Ekman, noticed cross-cultural consistencies in facial reactions to emotional stimuli (
Ekman, 2007). Discrete facial expression components were formalized as so-called ‘action units’ in the Facial Action Coding System (FACS). The FACS could be used to quantify facial expressions from observation or video by manual coding. Such coding was later automated in software packages such as iMotions and Noldus FaceReader. These emotion measurement technologies were largely used in laboratory situations where participants sit still in front of screen-based stimuli.
While it is technically possible to record facial expressions in the field, attempts have proved difficult for two reasons. First, the cameras needed to record participants make them highly aware that they are being researched, possibly affecting their experience. Second, it is very difficult to make lighting and shadows of the video recording consistent while participants move around, disrupting facial expression recognition and leading to very incomplete data. Thus, facial expression recording during experiences in the field is rare; for an exception that carries the above limitations, see
Mitas et al. (
2022).
The advent of constructed emotion theory (
Barrett, 2017) has dealt a serious blow to field research based on facial expression analysis. Barrett demonstrated that the earlier cross-cultural experiments by Ekman and colleagues featured tight control over contextual variables, and that when contexts vary even slightly, facial expressions change. Because most event experiences feature varying contexts (alone, together; moving, still; sheltered, exposed, etc., during a single experience for one participant), not to mention the technical challenges, we judge facial expression analysis to be largely unsuitable for measuring and mapping emotions during event experiences at this time.
2.2.5. Wearable Physiological Recording
Emotions affect the human body in a variety of ways. Emotion measurement technologies have been available in some form since the 1960s to capture signals of these physiological changes (
Cacioppo et al., 2007). Existing technologies span two dimensions: central (brain) and peripheral physiology, and immobile (lab-based) and mobile (in-the-field) measurement.
While it is possible to record signals from the brain while participants are mobile, muscle activity and the richness of visual stimuli greatly outweighs any sign of emotion, despite previous research neglecting this distinction (
Marín-Morales et al., 2019). Thus,
central physiological measures are exclusively for lab-based research paradigms.
Peripheral physiological signals include heart rate, respiration, facial muscle activity, and sweating of the palms and feet. Heart rate and respiration are sensitive to muscular activity, so variation in these signals due to movement and posture outweighs and sign of emotion, just as for brain activity. Despite heart recordings in mobile settings (
i Agustí et al., 2019), heart rate and respiration are best reserved for lab settings. Recording during sleep can be used to assess between-participant or day-to-day variation (
Fenton-O’Creevy et al., 2012), but is not useful for spatial resolution within tourism event experiences.
This leaves sweating of the palms and fingers as the sole promising physiological signal to assess the ebb and flow of emotion during an experience, even when participants are moving about. Sweat glands on the palms and fingers are uniquely responsive to emotional arousal (
Boucsein, 2012;
Braithwaite et al., 2015). Wrist-worn devices such as Shimmer GSR+ use electrodes worn on the fingers to electrically record tiny changes in skin conductance as an index of sweat secretion. After data collection, skin conductance signals are separated into slow (tonic) changes due to heat and physical activity, and brief (phasic) changes due to emotional arousal (
Benedek & Kaernbach, 2010). Phasic skin conductance recorded from finger- or palm-worn electrodes thus represents a valid and precise index of emotional arousal, even when the participant is moving around.
Skin conductance recording has been recorded in tourism, leisure, and hospitality settings for a number of years (e.g.,
Bastiaansen et al., 2022;
Kim & Fesenmaier, 2015). Besides advances in understanding tourists, this research has uncovered two limitations. First, while skin conductance on palms and fingers is robust to the physiological effects of physical activity, it is affected by participants fidgeting with the device (e.g., by loosening or pressing the electrodes ‘into’ the sweat). The resulting artifacts must be removed after identification with software such as ArtifactZ (
Bastiaansen et al., 2022). A second limitation is that phasic skin conductance represents emotional arousal only, and not the valence (i.e., positive vs. negative,
Russell, 1978) or type of emotion being experienced.
2.2.6. Emotion Measurement and Recall Bias
In this literature review, we have touched on a range of emotion measurement methods that can be applied to tourism event experiences. Different methods record different emotion components (
Mauss & Robinson, 2009) and thus cannot be expected to correlate exactly. There is no ‘gold standard’ against which new emotion measures can be calibrated; the affordances and limitations of different measures can only be compared to one another.
As
Wirtz et al. (
2003) showed and
Zajchowski et al. (
2016) explained, emotions are remembered differently from how they were felt in the moment. This difference is further explained by the theory of constructed emotion, which argues that stimuli cause a change in physiological allostasis, triggering socially constructed models of emotion based on context (
Barrett, 2017). Thereby, the physically intense feeling of a dangerous situation triggers, but it distinct from, the feeling of being afraid. Thus, comparing recalled emotion (e.g., by self-report) to core physiological reactions always reveals a gap, sometimes termed recall bias. As previous literature reveals, recall bias is considered a particularly stubborn limitation inherent to self-report. In
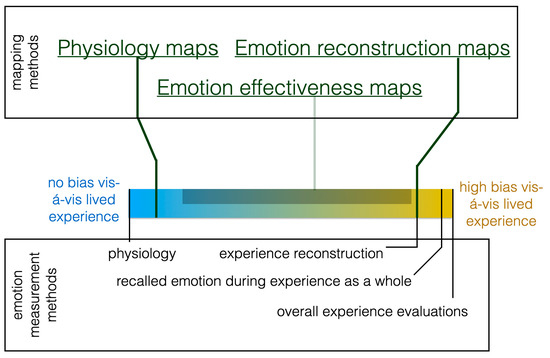
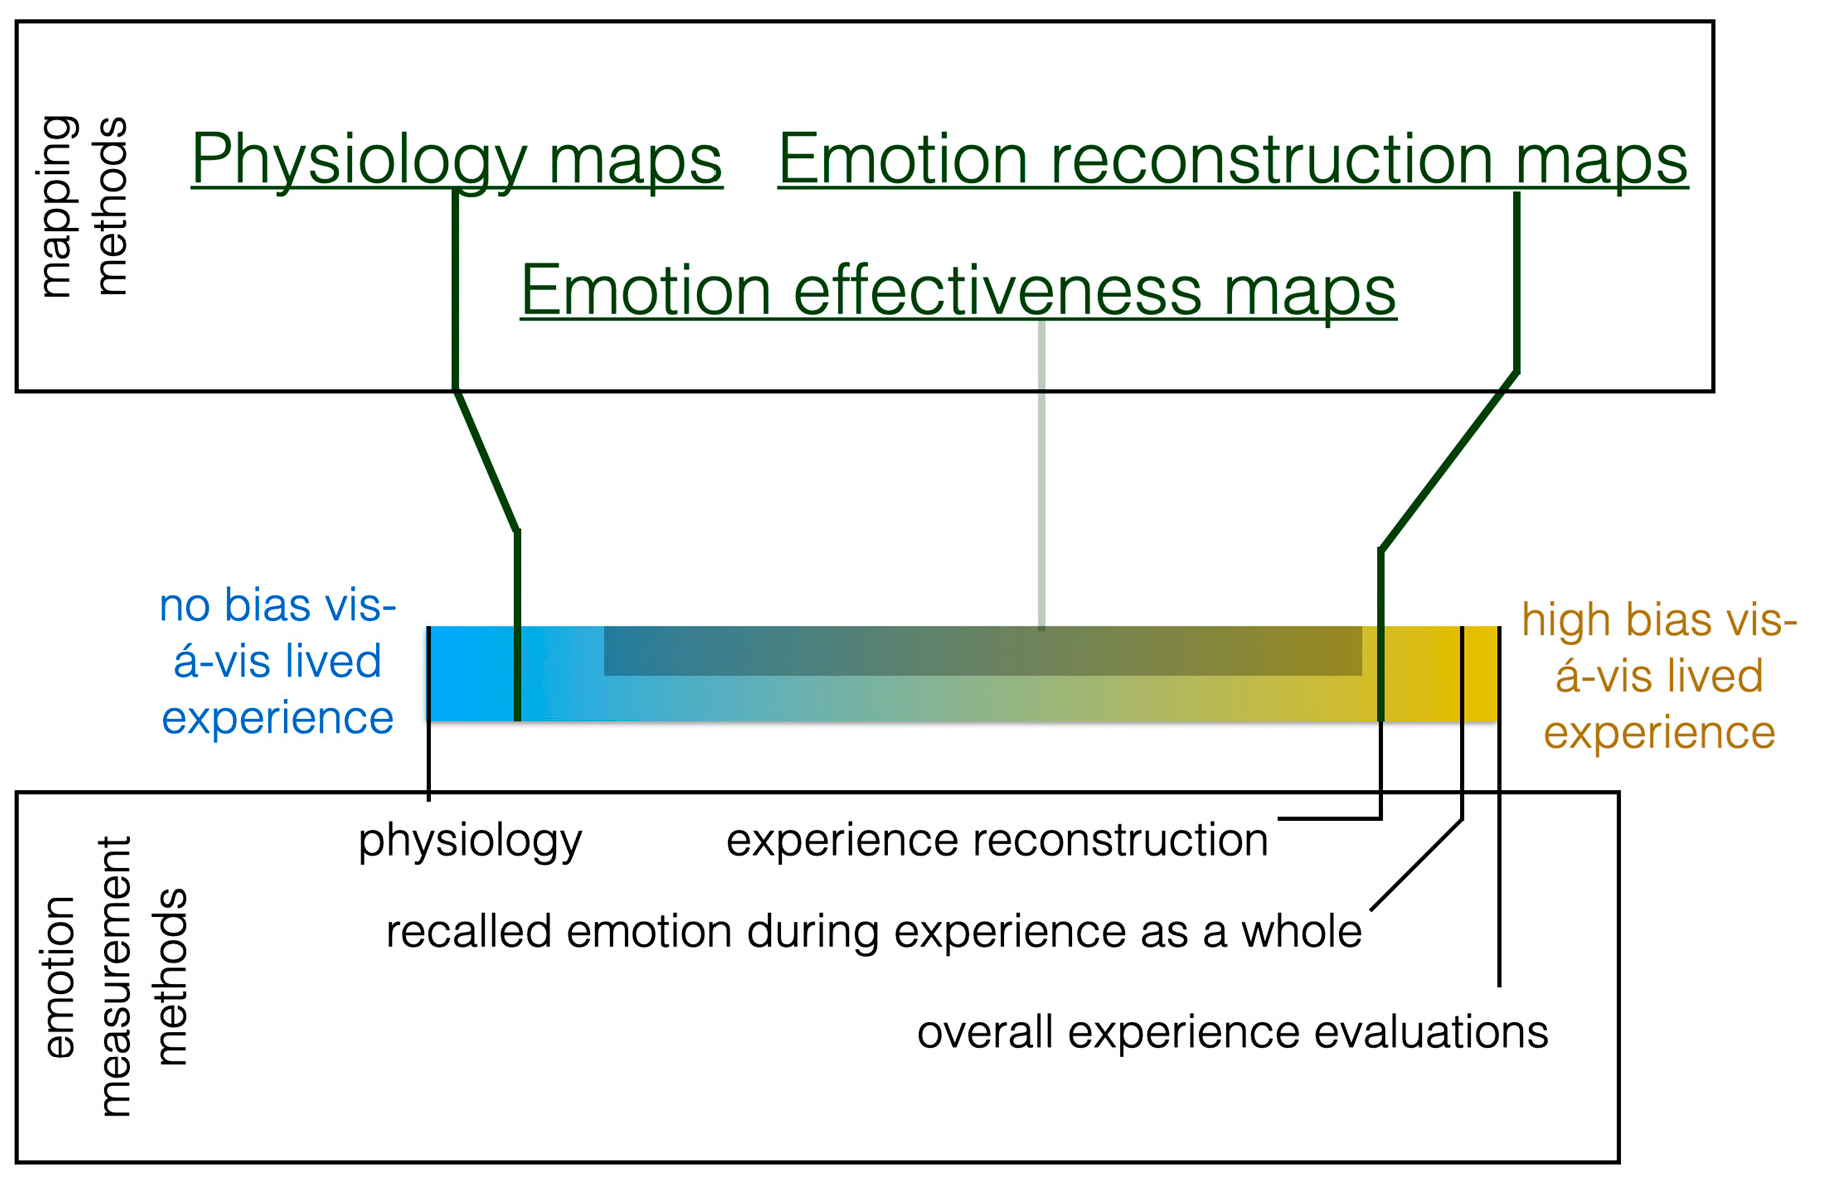
Figure 2, we compare three emotion measurement methods—physiology, experience reconstruction, and retrospective recalled self-reported emotions—in terms of the expected recall bias, plotted against
Bastiaansen et al. (
2019)’s theory of experience. Physiological recording, such as skin conductance, captures the effect of emotions on the body before cognitive processes or socially constructed mental models kick in. As such, physiological recording has essentially no recall bias.
Asking participants to recall their emotions just after an experience aims to capture what they felt, but answering such questionnaire items involves substantial cognitive averaging over each episode of the experience, leading to demonstrable recall bias (
Strijbosch et al., 2021). Experience reconstruction does not involve averaging from discrete episodes to an overall rating in a person’s mind, so it is somewhat closer to how they felt during a given moment (
Kahneman et al., 2004). However, respondents still have to remember and quantify their past emotions, inevitably creating some recall bias (
Figure 2). Here it is important to note that recall bias is not ‘bad’ as such; people make repurchase decisions and subjective well-being judgments largely based on recalled emotions. However, recall bias must be considered in concert with the conclusions researchers or managers would like to make.
2.3. Spatial Resolution of Emotional Data
2.3.1. Overview of Spatial Experience Measurement
Just as diverse methods can exist for emotion measurement, various tools can record the location of an individual at any given time. Such location tracking enables linking environmental stimulus to patterns of emotional responses; for example, if a specific part of an event venue is generally perceived as boring, emotions across different types of paths can be compared. If one type of path gets greater emotional responses, more paths could be converted to that type, making the entire event more engaging. The most obvious and accessible tool for tracking location in an outdoor setting is the Global Positioning System (GPS), a system that triangulates satellite signals on devices such as smartphones and smartwatches. GPS recordings have a resolution of approximately 3 m, sufficient for larger outdoor spaces, and an adequate sampling density of 1 Hz on most devices. Tourism scholars have been interested in using GPS to track tourist location for nearly 20 years (
Shoval & Isaacson, 2007). The most common alternative in indoor settings is Bluetooth, which yields similar results but can be somewhat more precise if sufficient transmitters are used. Unfortunately, combining emotional data and spatial data can exaggerate, rather than making up for, the limitations of both. Thus, valid emotion maps are only possible when both emotion and location measurements are valid and precise. In this study, we review and illustrate three promising approaches to combining emotion and location data: experience reconstruction maps, emotion physiology maps, and emotion effectiveness maps.
2.3.2. Experience Reconstruction Maps
An experience reconstruction is a set of emotion ratings given by participants after an experience, one episode at a time. In a spatial context, this means that participants rate each specific location they visited. While straightforward, this approach has been used with astonishing rarity in the literature—we were able to find no more than seven examples of maps that portray emotional variation across locations based on self-reports in academic journals and books. The vast majority are urban, including Ostrava (
Panek, 2019), St. Petersburg (
Nenko & Petrova, 2018), Minneapolis-St. Paul (
Fan et al., 2020), and Reykjavik (
Pánek & Benediktsson, 2017). A couple focus on transportation networks, including
Fan et al. (
2020) and a study covering the New York–Philadelphia corridor by
Meenar et al. (
2019).
An important contribution of this literature is highlighting the role of emotions in urban transport experiences. Maps based on quantitative self-report are often triangulated with qualitative data, obtained through comments via map-based mobile apps (
Nenko & Petrova, 2018), workshops with participants (
Panek, 2019), and even participant-drawn maps (
Meenar et al., 2019). No experience reconstruction map of an outdoor non-urban tourism setting exists to our knowledge. A second gap in the existing research on experience reconstruction maps is a lack of validation in selecting instruments and approaches, and a lack of comparison across multiple quantitative methods, including those based on physiological data.
2.3.3. Emotion Physiology Maps
Emotion physiology maps visualize physiological recordings by location, usually from a wearable recording of skin conductance. Skin conductance is either averaged over either discrete (
Shoval et al., 2018) or continuous (
Mitas et al., 2020) spatial areas, with color of the visualization indicating average skin conductance recorded from participants in each place. This kind of map has existed for nearly 20 years, starting with the 2008 book edited by Christian Nold,
Emotional Cartography: Technologies of the Self. The authors boldly stated that “thousands of participants since 2004” had provided skin conductance data (
Nold, 2009, p. 3) in cities such as San Francisco, Greenwich, and Stockport. The maps herein set a precedent for what an emotion map should look like, albeit based on questionable data processing. Over a decade later, similar-looking maps in
Shoval et al. (
2018),
Mitas et al. (
2020) and other publications portrayed more rigorously processed data.
Swiss researchers used Bluetooth signals to record participant location indoors (
Kirchberg & Tröndle, 2015). Soon thereafter, several urban studies groups continued to replicate skin conductance maps in outdoor settings (
i Agustí et al., 2019;
Shoval et al., 2018).
Millar et al. (
2021) extended emotion mapping with the concept of
viewsheds. They created an emotion map based on what participants could see from their current location, rather than merely where they were. Using eye tracking to pinpoint the location of participants’ attention is seen as a potential next step.
These studies have visualized which locations are associated with experiences of emotional arousal; however, the noise and skew that are inherent to location tracking and skin conductance recording compound one another. Thus, large numbers of participants (>50) are needed to cover for a map to represent emotional arousal across space faithfully. Furthermore, maps of skin conductance do not portray information about emotional valence or specific emotion categories, which vary based on context and cannot be derived from physiology (
Barrett, 2017). To portray valence or specific emotions requires collecting additional data, usually by self-response.
2.3.4. Emotion Effectiveness Maps
Mitas et al. (
2020) developed the emotion effectiveness map to combine skin conductance, location, and self-response questionnaire data. This approach displays between-participant correlations of localized skin conductance and retrospective self-reported emotion. Location-resolved skin conductance data are aggregated in hexbins or irregular polygons representing areas of interest (AOI). Inside each of these bins, each participant’s skin conductance is averaged. A Pearson product–moment correlation of skin conductance within each bin to each participant’s self-reported emotion valence or evaluation is then computed. The result is a correlation coefficient for each hexbin or AOI, representing the between-participant relationship of self-reported emotion valence to physiological arousal at that specific place. The bin is colored to show the magnitude and direction of the correlation coefficient.
The resulting map displays where participants with a more positive recalled emotional valence felt stronger versus milder emotions. Thus, emotion effectiveness maps visualize multidimensional information, including location, momentary emotional arousal, and retrospective overall self-reported valence. In principle, emotion effectiveness maps can use a wide variety of self-report variables besides valence. For example,
Mitas et al. (
2020) used intention to recommend.
In emotion effectiveness maps, the only spatially resolved emotional data are skin conductance, so it is still impossible to conclude what specific emotion is happening at any one location. To illustrate this limitation, suppose that a park bench shows a strong negative correlation on an emotion effectiveness map. Thus, participants with higher emotional arousal at this location had a more negative experience in the park as a whole. It could be that some participants had a negative, emotionally arousing experience at this bench because it was broken and caused them to fall. However, it could also be that the bench was situated in very calming area, and participants who sat down to relax had a more positive experience overall, while participants who remained distracted or agitated did not. These two very different scenarios—a dangerous bench and a relaxing bench—would lead to the same (negative) correlation between localized arousal and retrospective valence. It is only possible to conclude whether localized emotional arousal had a positive or negative effect, whether greater or lesser (hence emotion effectiveness), on the visit as a whole.
Existing methods of spatially resolving emotional data have distinct strengths and shortcomings. In this study, we consider three approaches––experience reconstruction maps, emotion physiology maps, and emotion effectiveness maps––and apply all three simultaneously, across two event locations, for the first time. We also model skin conductance using repeated-measures models for within-individual emotion change to test the relative validity of all three map types.
We used two different locations, namely two green forts in the Netherlands, where visitors engage not just in comparable event experiences but across different spatial layouts. Tourism events at green forts are fitting context for recording visitor emotions and comparing spatial visualization and analysis techniques. These events invite visitors to disperse freely over a large outdoor area with a broad, distinctive variety of spatial features. Numerous activities minimally including sightseeing and hiking, but also extending to photographing, pet walking, social interaction, eating and drinking, and viewing historical interpretation and art, are all available to visitors. Thus, there is adequate spatial and emotional arousal variety for mapping and analysis; events draw a flow of enough visitors to the sites to allow a sufficient sample to be collected in a short period of time. Maps from one of the forts, excluding statistical validation models, have been published recently as a preliminary precedent to our study (
Mitas et al., 2025). Building on this preliminary work, we can now add data from a second fort, as well as the crucial comparison with statistical models which can control for within-individual autocorrelation. In summary, our aim with the present article is to answer the following questions:
To what extent do the established emotion mapping approaches—experience reconstruction maps, emotion physiology maps, and emotion effectiveness maps, implemented as hexbins or as AOI polygons—lead to different conclusions about visitor emotions during events at locations within green fort sites?
To what extent do the established emotion mapping approaches using AOI polygons—experience reconstruction maps, emotion physiology maps, and emotion effectiveness maps—differ from multilevel statistical models of visitor emotions during events at locations within green fort sites?
3. Methods
The present study was based on intercept samples at two events which took place at green forts in the Netherlands in the early autumn of 2024. A green fort is a former military fortification managed for purposes of public visitation and recreation with substantial preservation of local plant growth. Green forts featured grass land cover over most of the site, while trees and native plants are maintained for long-term viability and appreciation by visitors. Buildings were also maintained in compatibility with plant and animal life, while interpretation and facilities address both natural and built heritage. We intercepted samples of event visitors to two green forts over two subsequent weekends and combined intake and exit questionnaires with GPS location and skin conductance recording. Visitors to the forts mostly comprise Dutch and Flemish day-trippers, particularly during the events during which we collected data.
3.1. Setting
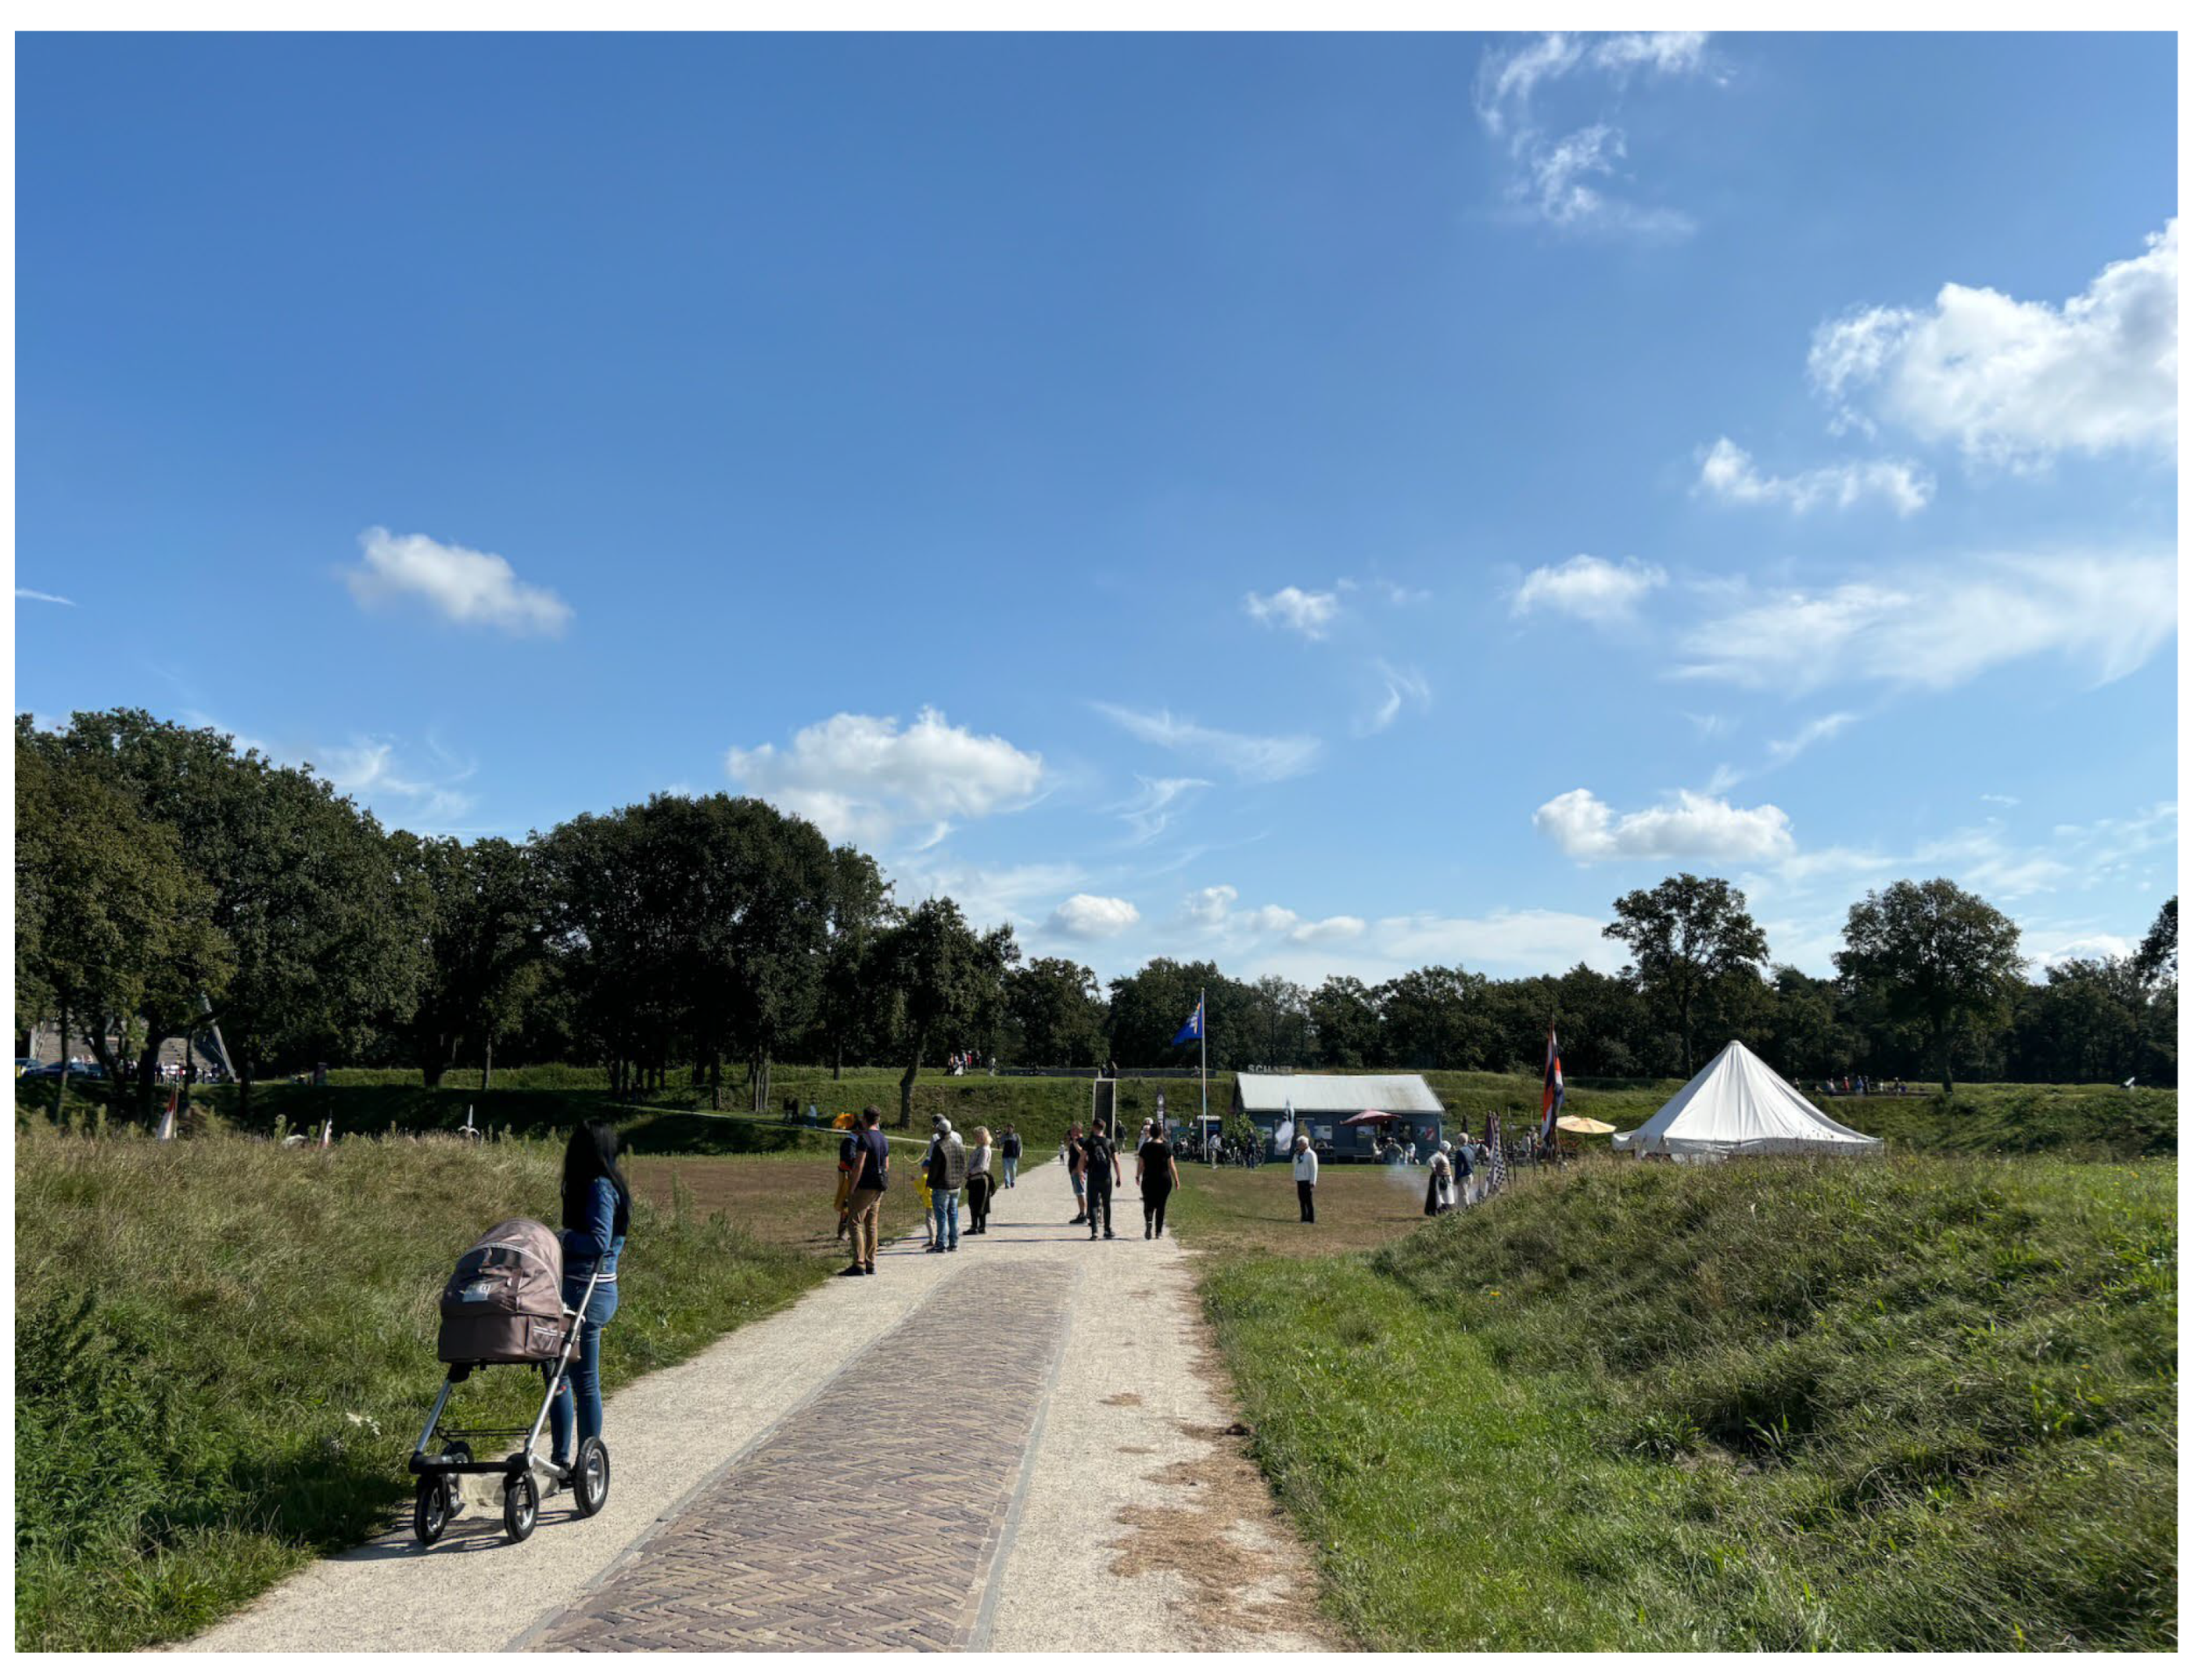
We collected data at Fort de Roovere (
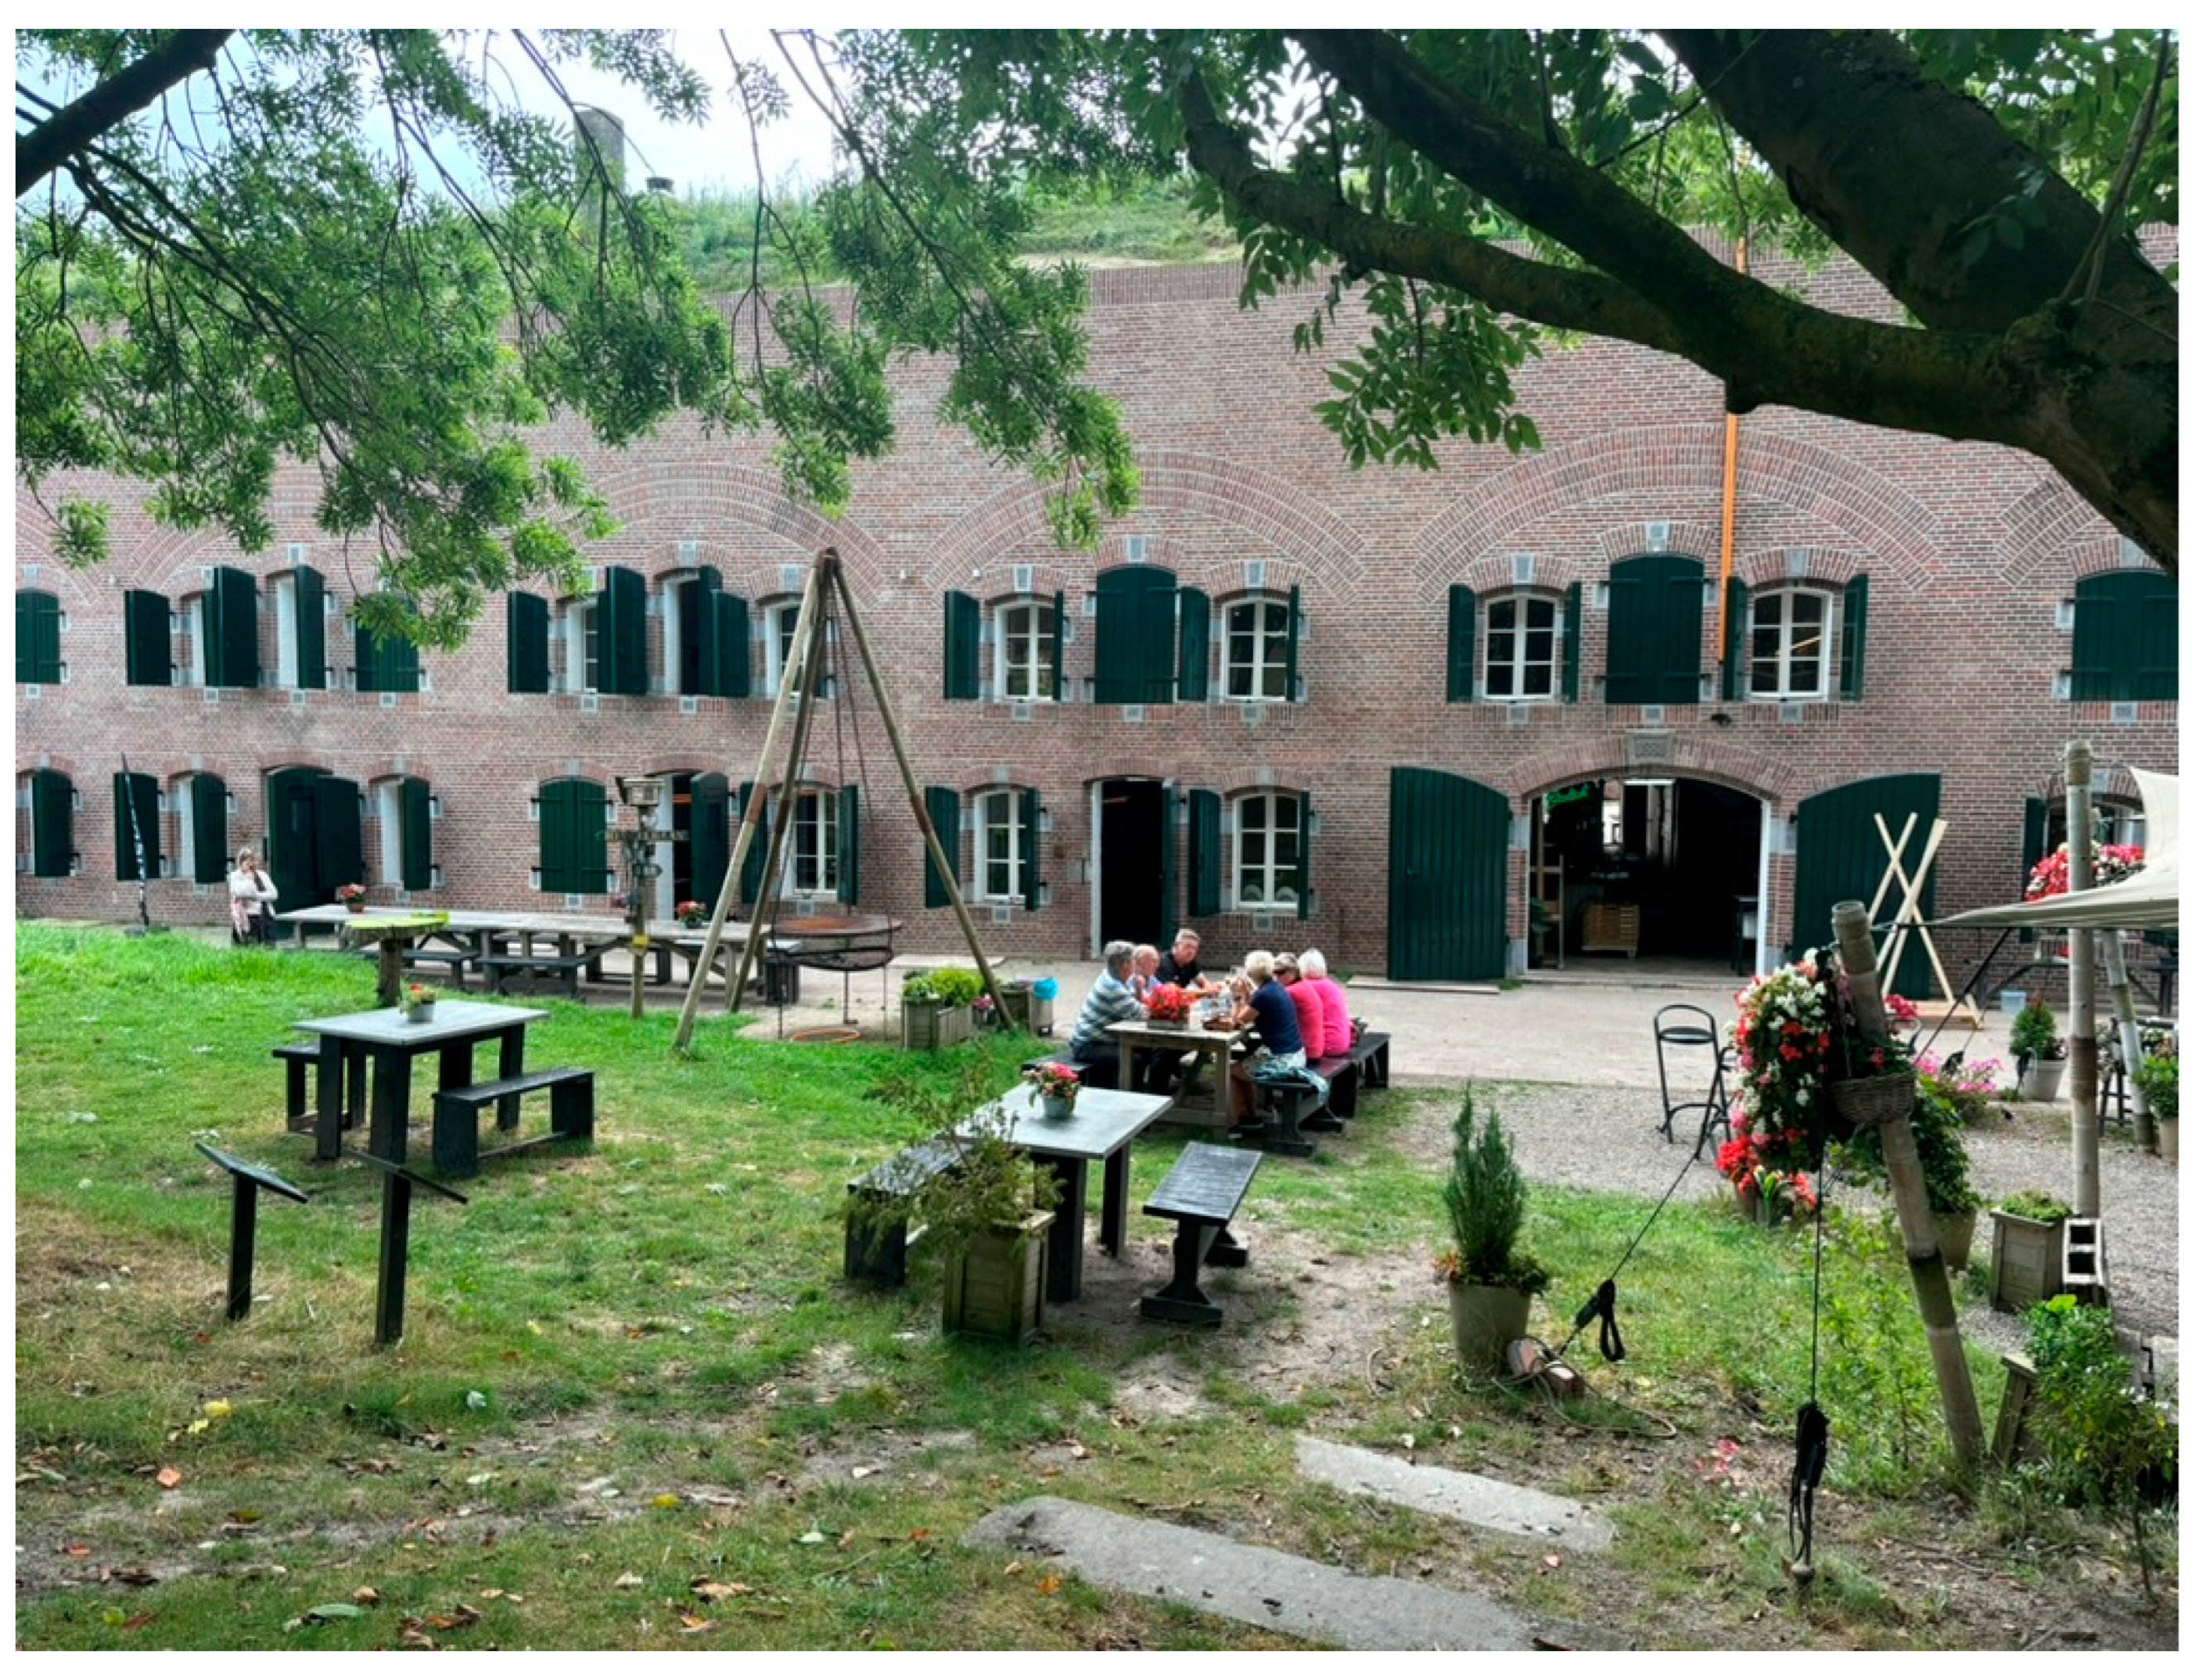
Figure 3) and Fort Sabina (
Figure 4). Fort de Roovere was built as part of the Southern Water Defense Line in the 17th century. In its current reconstruction, Fort de Roovere features earthen walls overgrown with grass and surrounded by a moat. Further walls and ditches beyond the moat are overgrown with dense forest and feature mountain biking and hiking trails. The only built structures were contemporary: the 25 m Pompejus lookout tower with excellent views of the region, and the Moses bridge across the moat, so named as it was recessed into the water, bringing visitors eye-to-eye with aquatic flora and fauna (
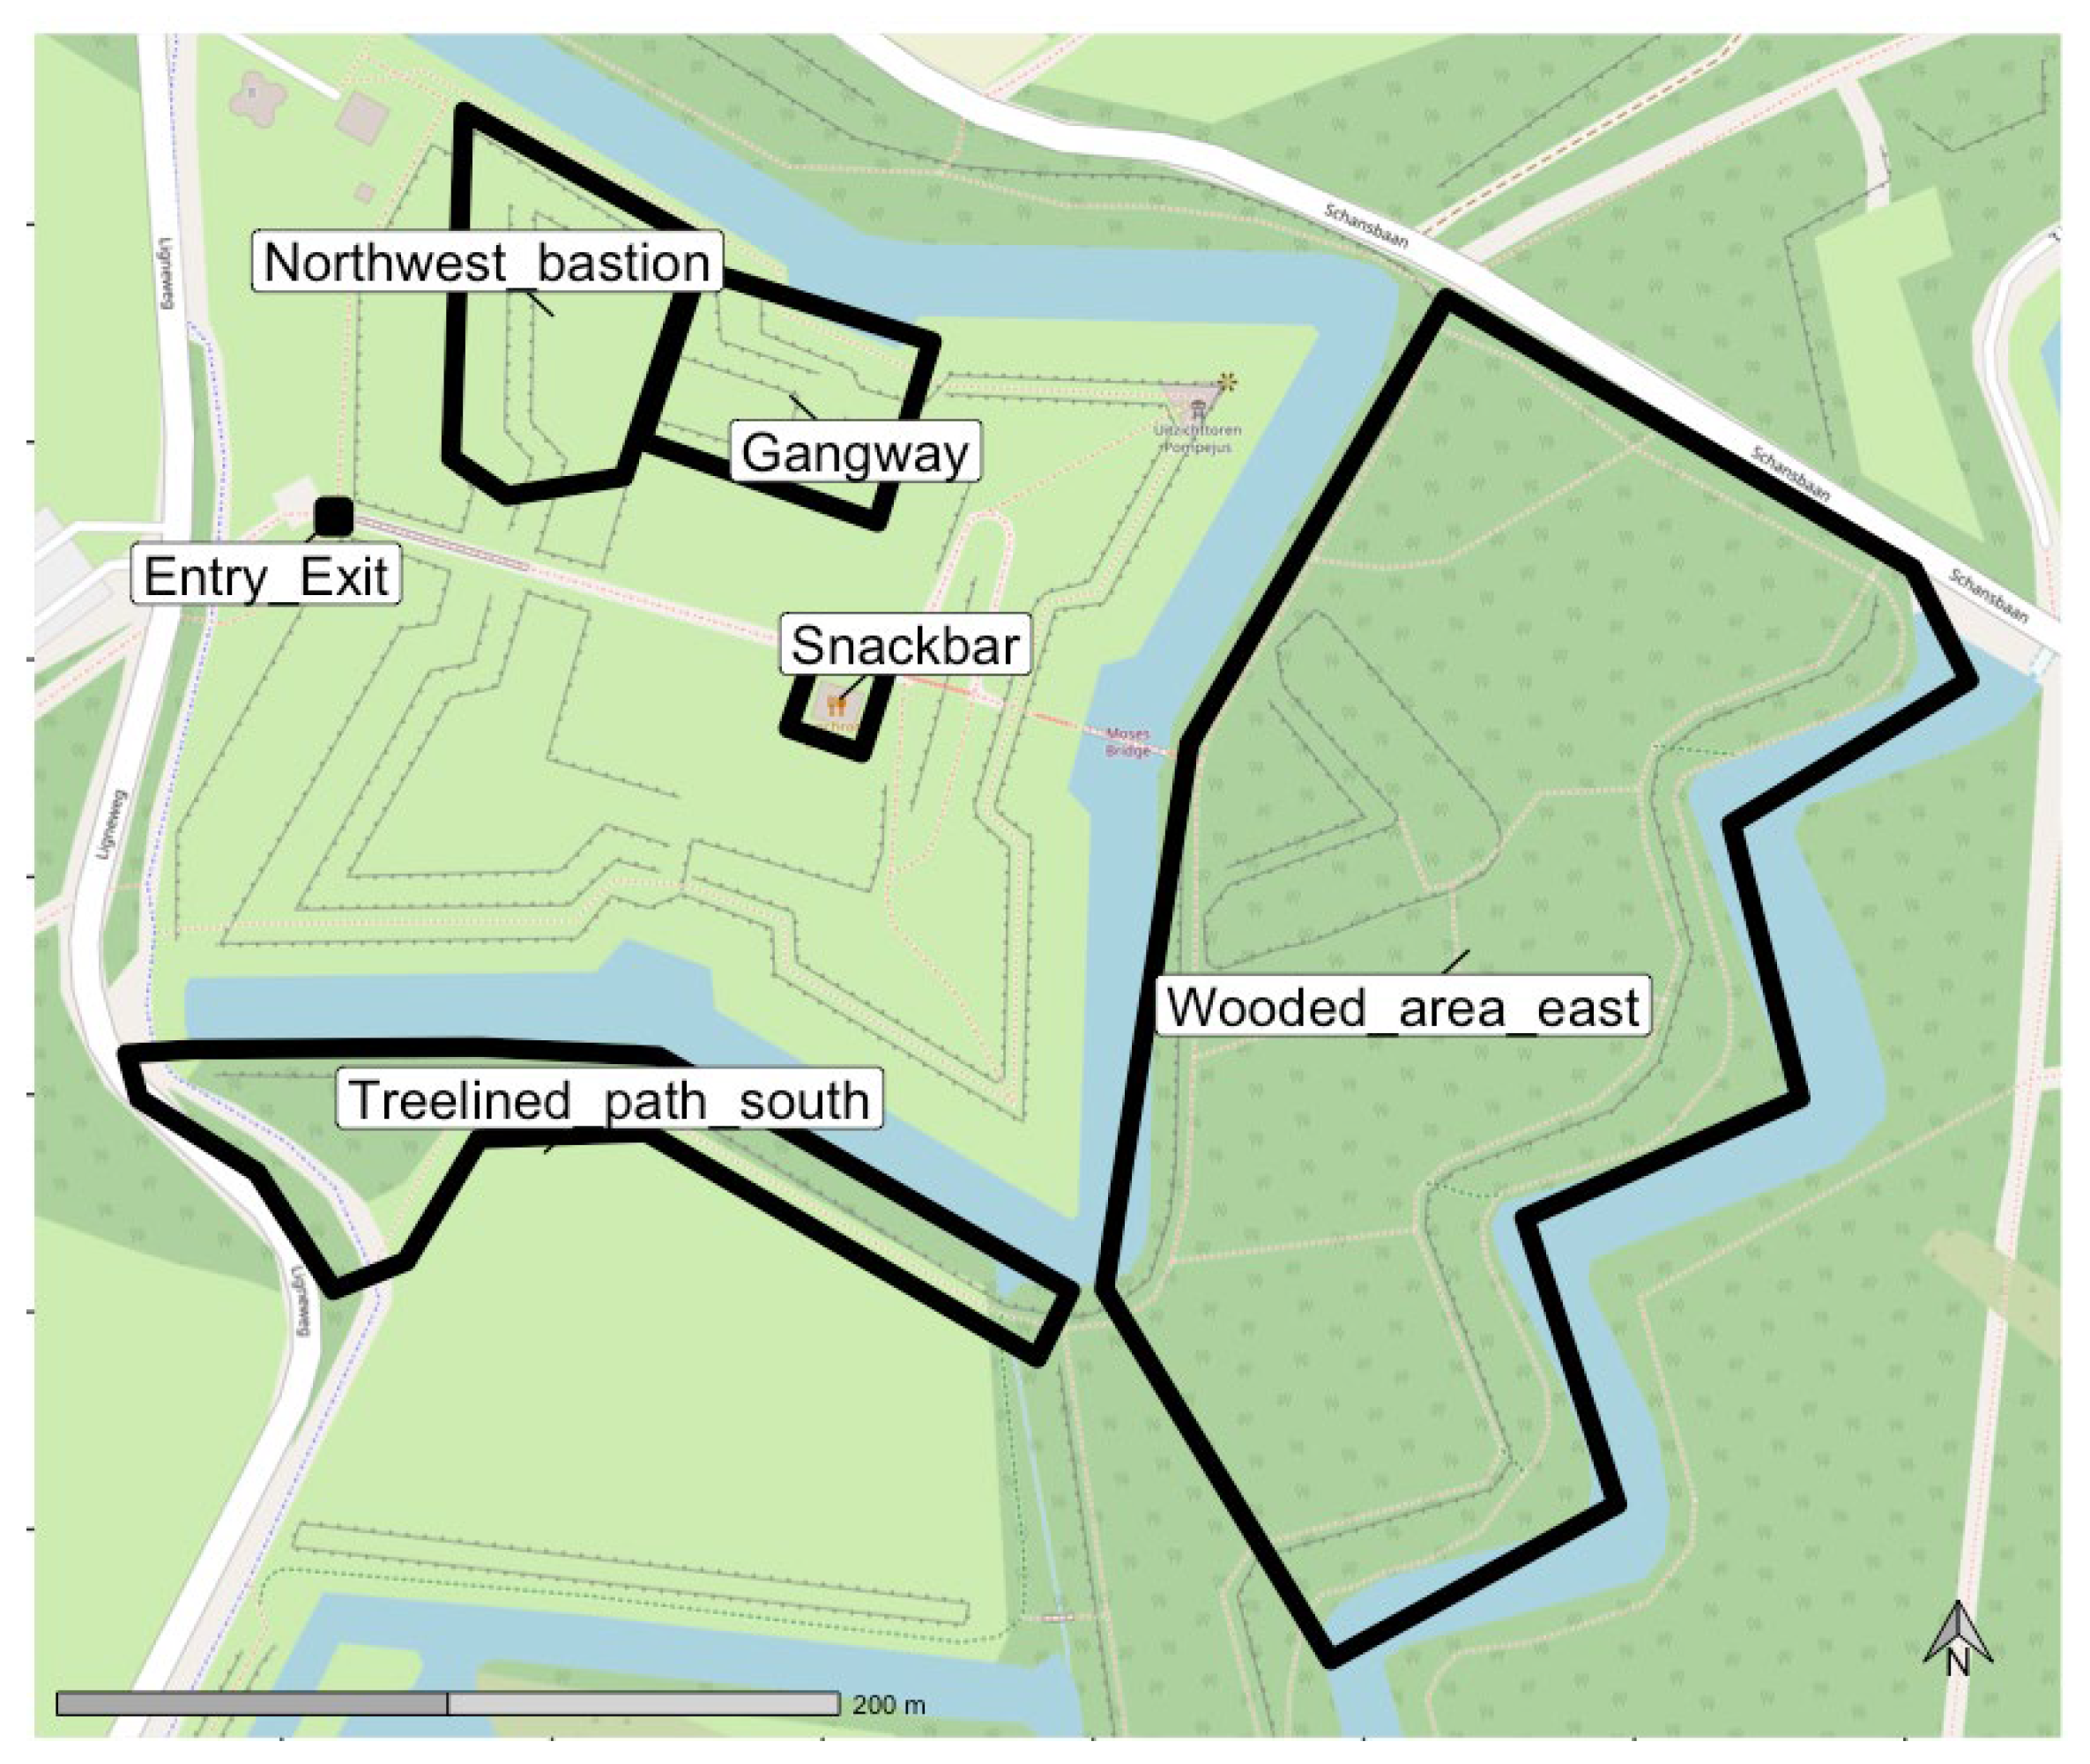
Figure 3). A temporary building houses a simple snack bar. During the weekend of our data collection, Fort de Roovere was an event site for the Open Monument Days, a national event in which historic sites host reenactments, exhibitions, and musical performances. These temporary attractions were present in the central courtyard of the fort, surrounding the snack bar and extending to the base of the lookout tower. Thus, while semi-permanent, the snack bar and gangway AOI hosted unique event-related attractions while we collected data, whereas the more peripheral AOI were not altered from their permanent state, besides having more visitors. The weather during data collection was cool but pleasant, with partly cloudy conditions and temperatures ranging from 8 to 18 degrees Celsius.
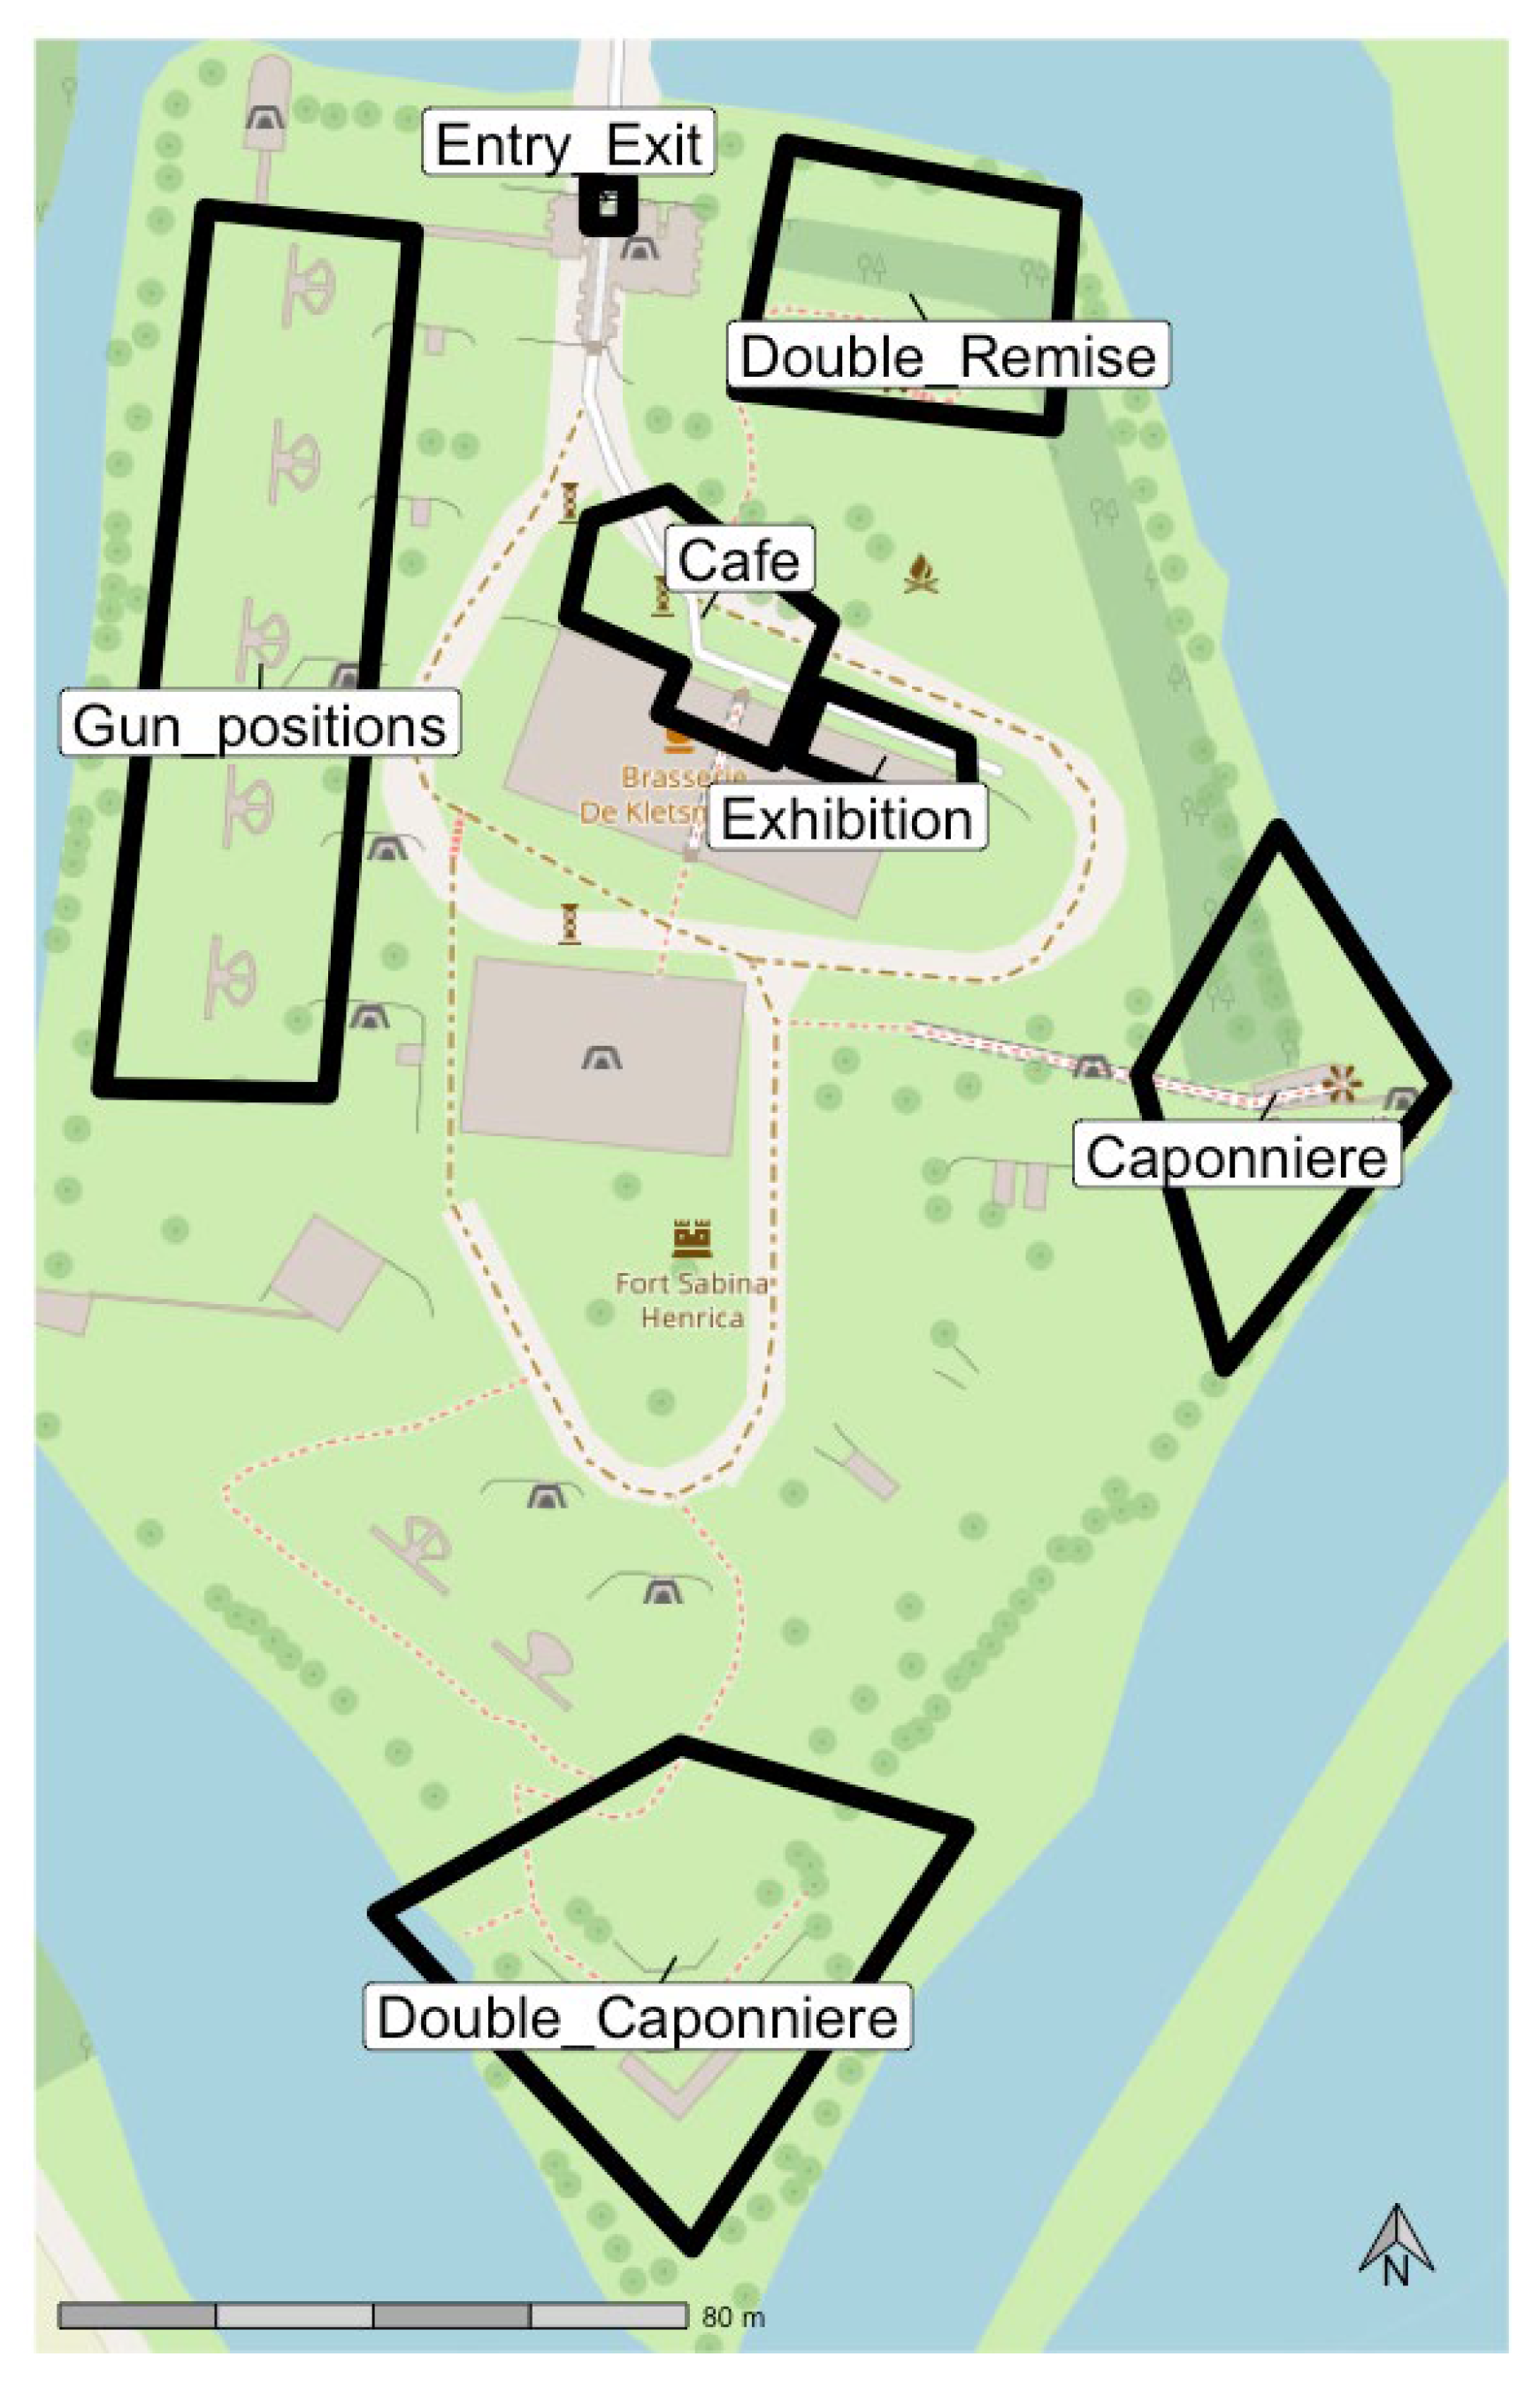
Fort Sabina is younger, with its main building added to a previously existing fort in 1881. As with Fort de Roovere, it featured earthen walls surrounded by a moat; however, original concrete barracks and bunkers remain. These were currently being developed to house an increasing number of historical and art exhibitions. Meanwhile, a café and gathering room for group functions such as weddings were already well-established. The walls featured numerous hiking trails. Unlike Fort de Roovere, however, Fort Sabina was surrounded by privately held farmland with no further trails or recreational areas. Thus, the land area available for recreational visitors was actually quite small, and rather than long hikes or dog walking as at Fort de Roovere, Fort Sabina visitors generally spent their time walking over the walls, looking at exhibits inside the barracks and bunkers, and socializing in the café. During the weekend chosen for data collection, the barrack building at Fort Sabina featured openings of several exhibits about military history, water management, and art about peace. These were present around the café and exhibition AOI. While these and other (non-event) AOI were permanent, fort managers have also experimented with temporary exhibitions or performances on other parts of the fort. These were not present during the event we studied, which used only permanent locations and facilities. The weather during data collection was comfortable, with mostly sunny conditions and temperatures ranging from 13 to 27 degrees Celsius.
3.2. Data Collection and Sampling
We selected participants using intercept sampling. We asked each visitor 16 years or older entering the fort if they would be willing to participate in exchange for a 10 € gift card to be emailed to them afterwards. Of 128 participants who provided data, either questionnaire, wearable, or GPS data were missing for 30 participants, making a total final sample of 98 participants, including 55 at Fort Sabina and 43 at Fort de Roovere.
Participants were first asked to read and sign an informed consent statement. We then asked them to fill out an intake questionnaire on a tablet, and fitted them with sensors to measure their location and emotional arousal, as detailed in the subsequent section. They were then allowed to visit the fort as they had normally intended to. Finally, when they completed their visit and prepared to leave the site, we collected the sensors from them and asked them to fill out an exit questionnaire.
3.3. Passive Mobile Measures
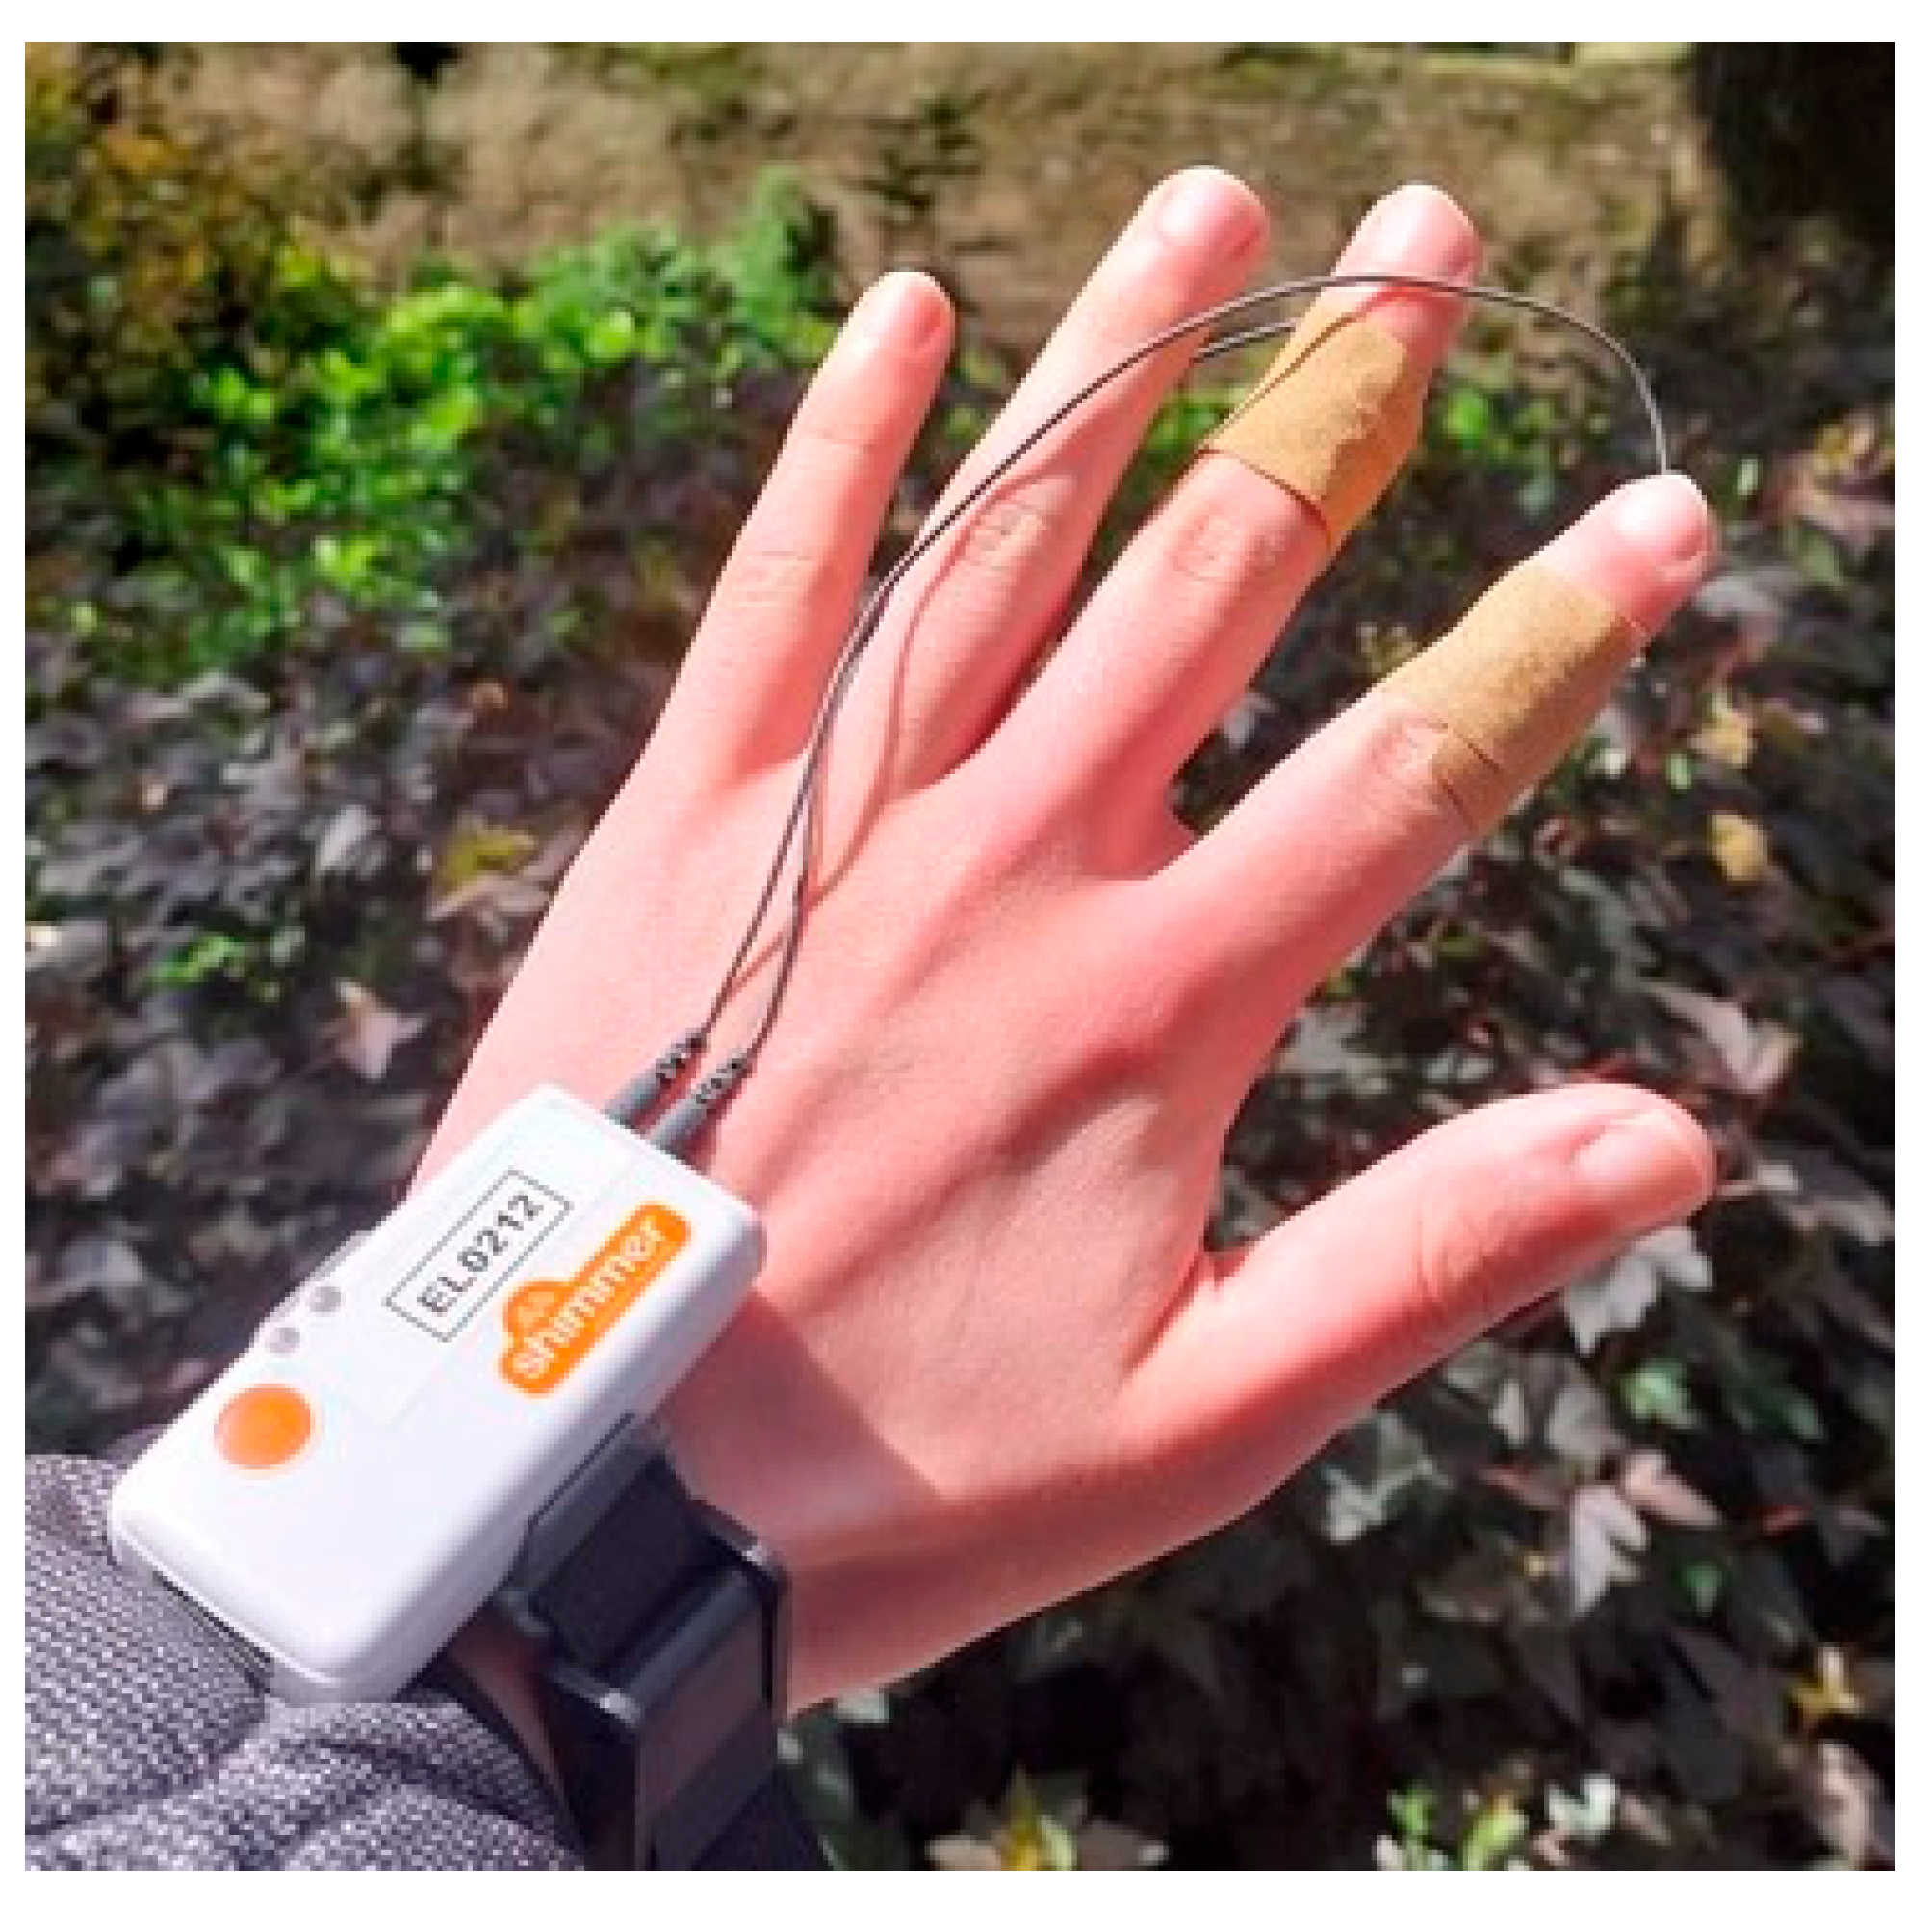
We lent participants a smartphone with the popular workout application Strava, which recorded GPS location once per 2 s. We also lent each participant a Shimmer GSR+ wristband to measure skin conductance, a proxy for emotional arousal, at 64 Hz. The wristband records skin conductance from 2 pre-gelled electrodes on the medial phalanx of the first and second digit (
Figure 5). Subsequently, we used the Breda Experience Lab Toolbox 0.7 (
Bastiaansen et al., 2022) to remove motion artifacts. Tonic changes in the signal due to temperature and wearing of the device were filtered out using the LedaLab 3.4.8 toolbox (
Benedek & Kaernbach, 2010). We used Z-standardization to cancel out differences in skin responsiveness between participants, and log-transformation to reduce skew and kurtosis. We then upsampled GPS data from 0.5 Hz to 64 Hz using linear interpolation and merged them with the skin conductance data. At Fort de Roovere, 10 extremely loud cannon blasts occurred as part of the Open Monument Days event. We recorded the timing of these blasts. We subsequently removed data of 2 min before and 1 min after each cannon blast to eliminate momentary anticipation and startle effects.
3.4. Self-Report Measures
3.4.1. Emotion Before and After the Visit
We measured participants’ self-reported emotions at the beginning and end of their visit. In the pre-visit questionnaire, we asked to what extent participants felt each of a list of emotions “right now”. After their visit, we asked participants to recall to what extent they experienced each emotion “during their visit”. Participants rated emotions on a five-point scale from “not at all” to “extremely”. Items comprised 12 emotions based on the SPANE (
Diener et al., 2010): positivity in general; negativity in general; and several specific positive and negative emotions such as joy, contentment, anger, and sadness. As often in tourism settings, variation in the negative emotional data was insufficient for further analyses. Thus, we used positive emotional data only. The positive items had Revelle’s omegas of (before = 0.86; after = 0.88) in our data, showing high internal consistency. We computed their average per participant to create a positive emotion index. We subtracted the pre-visit index from the post-visit index to capture positive emotion change from the beginning to the end of the visit with each participant.
3.4.2. Experience Reconstruction
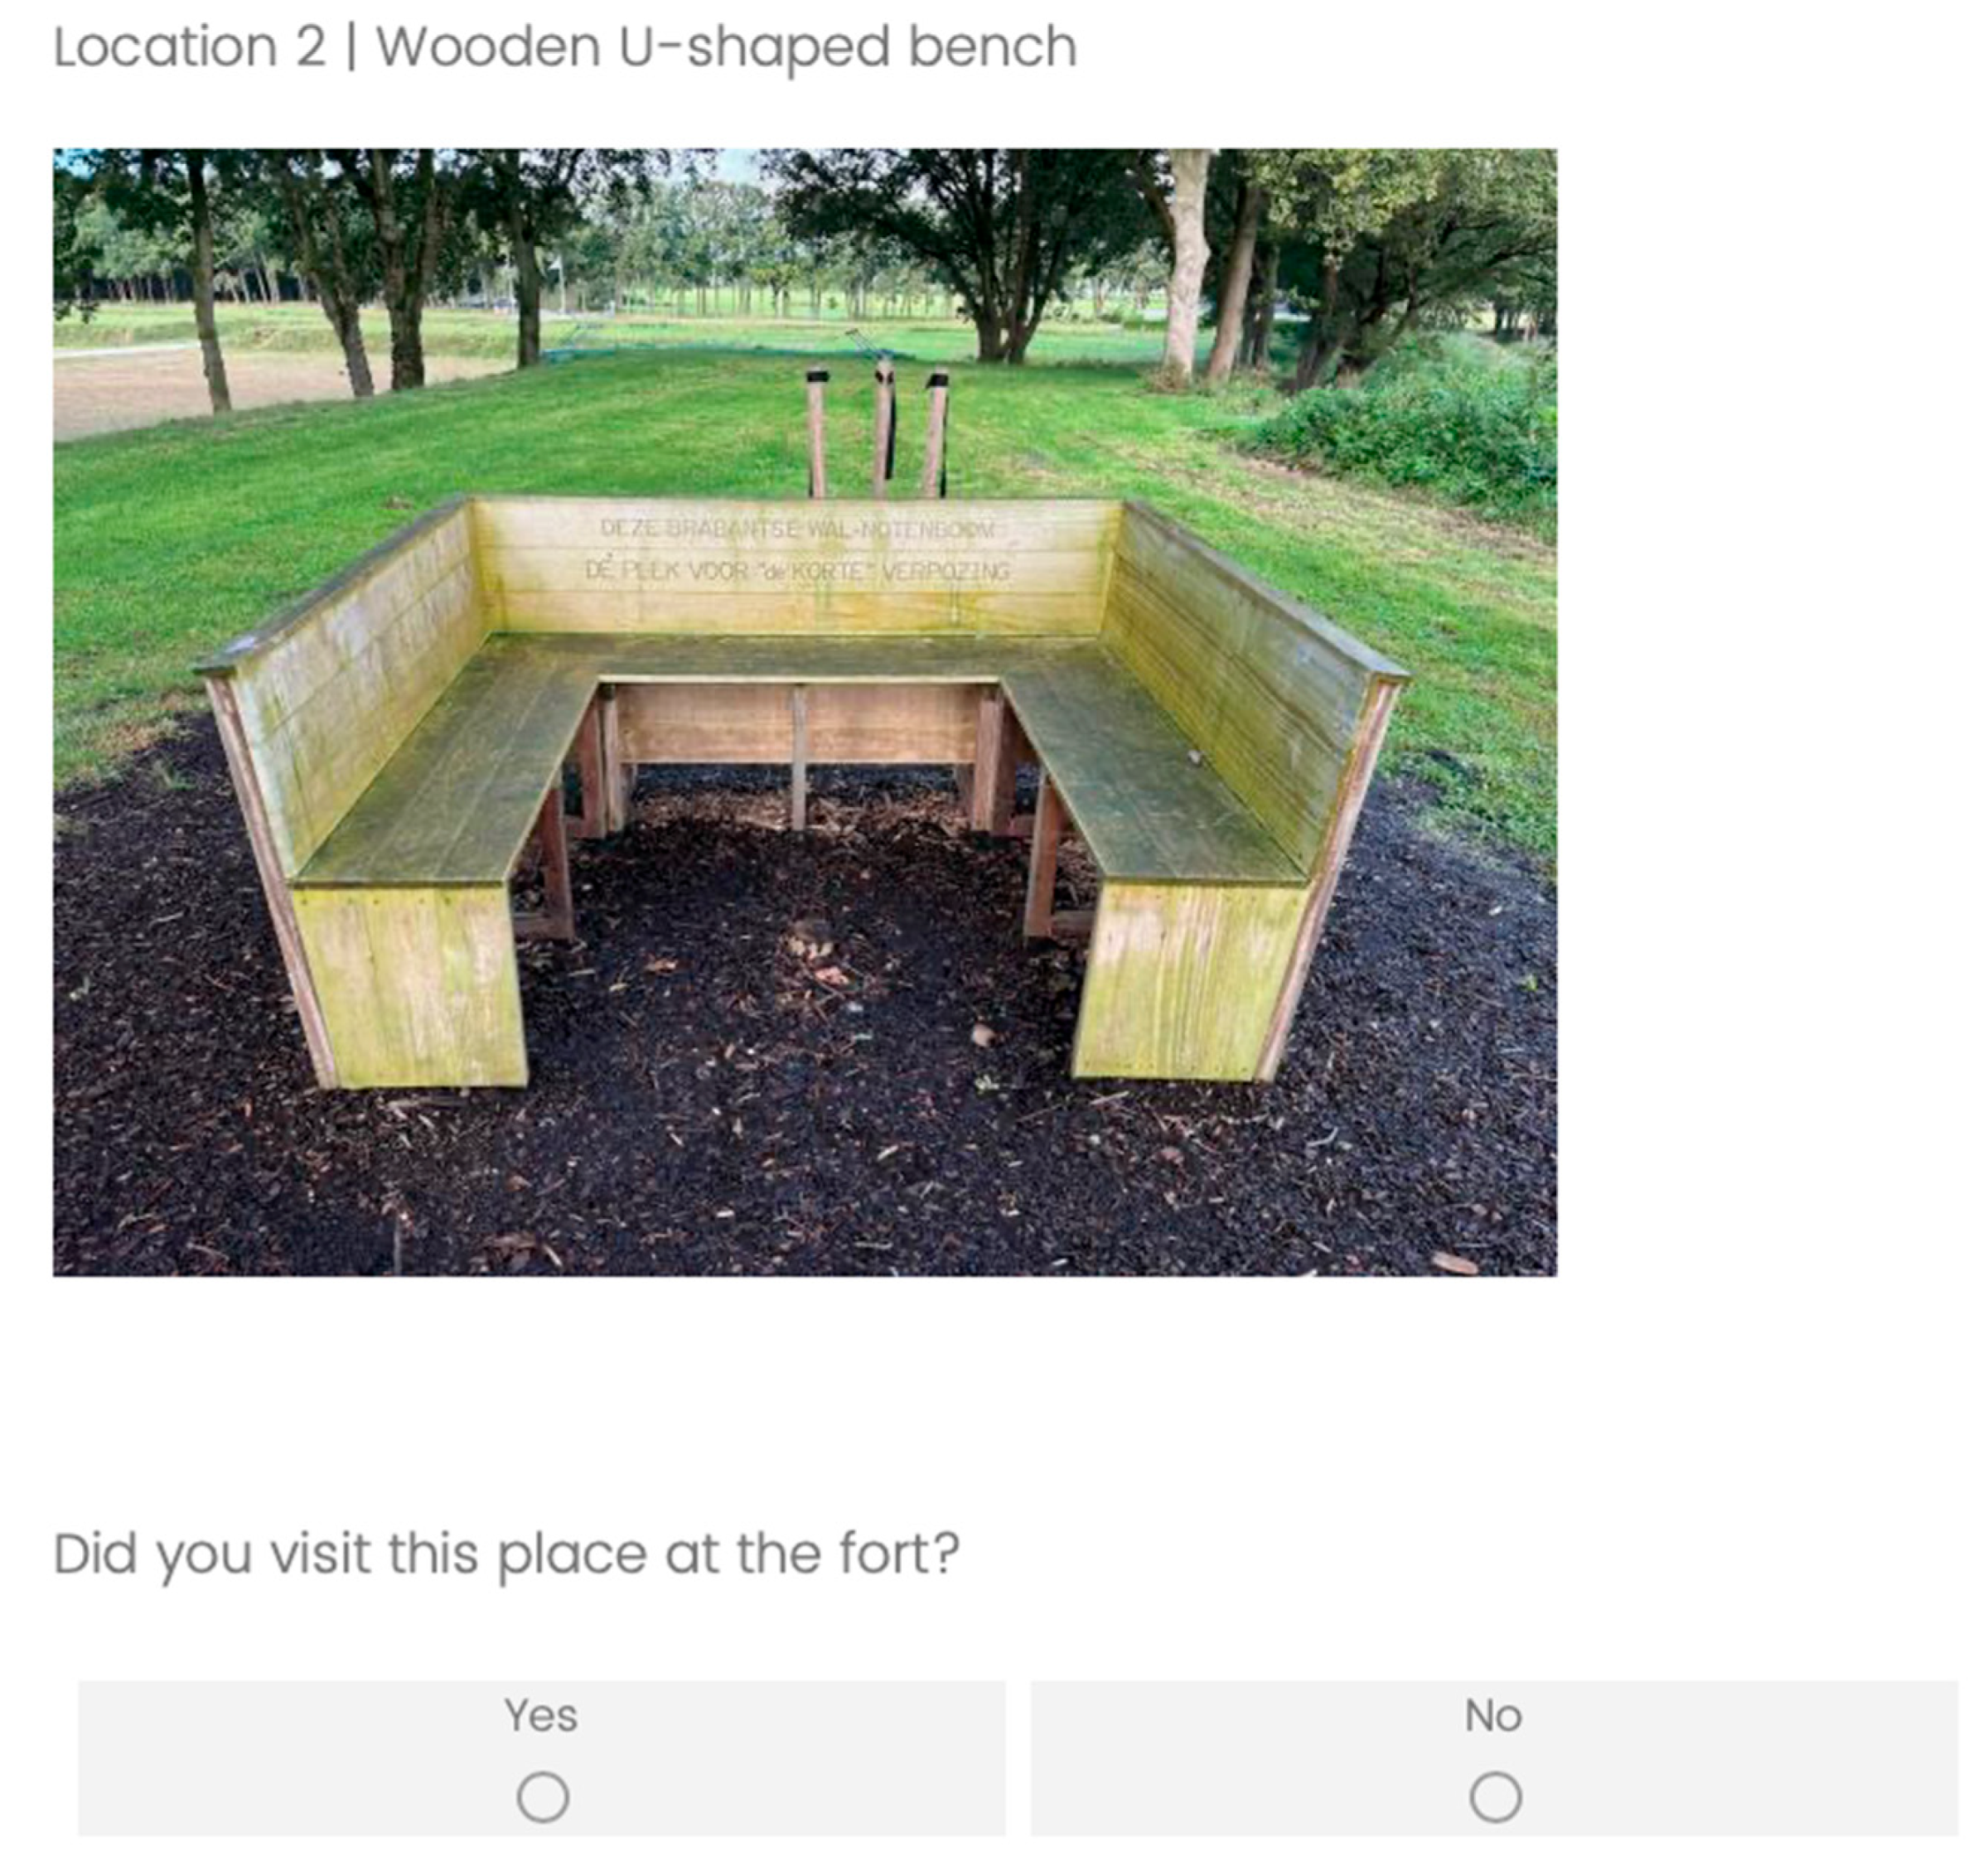
We selected six AOI locations at each fort as being recognizable and likely to be visited. In our selection of the AOI, we used a diversity sampling approach. We aimed to include AOI which were built as well as nature-based; AOI which were elevated as well as recessed; and AOI which were adapted for use in the event we were targeting as well as those outside of the event. We photographed each location to be easy to see and recognize. Photos and names of each location were displayed in the exit questionnaire (
Figure 6). We first asked participants if they had visited each location. If so, we asked how participants felt at the location on five-point semantic differential items reflecting valence (“very negative” to “very positive”) and arousal (“calm” to “excited”). These items have been validated in previous experience reconstruction research (
Strijbosch et al., 2021).
3.5. Data Analysis
3.5.1. Data Merging
We first computed descriptive statistics based on questionnaire and GPS data files. We then combined data streams based on anonymous ID numbers assigned to each participant. Using the website geojson.io, we drew polygons over areas of interest (AOI) representing locations mentioned on the experience reconstruction section of the questionnaire (
Figure 7 and
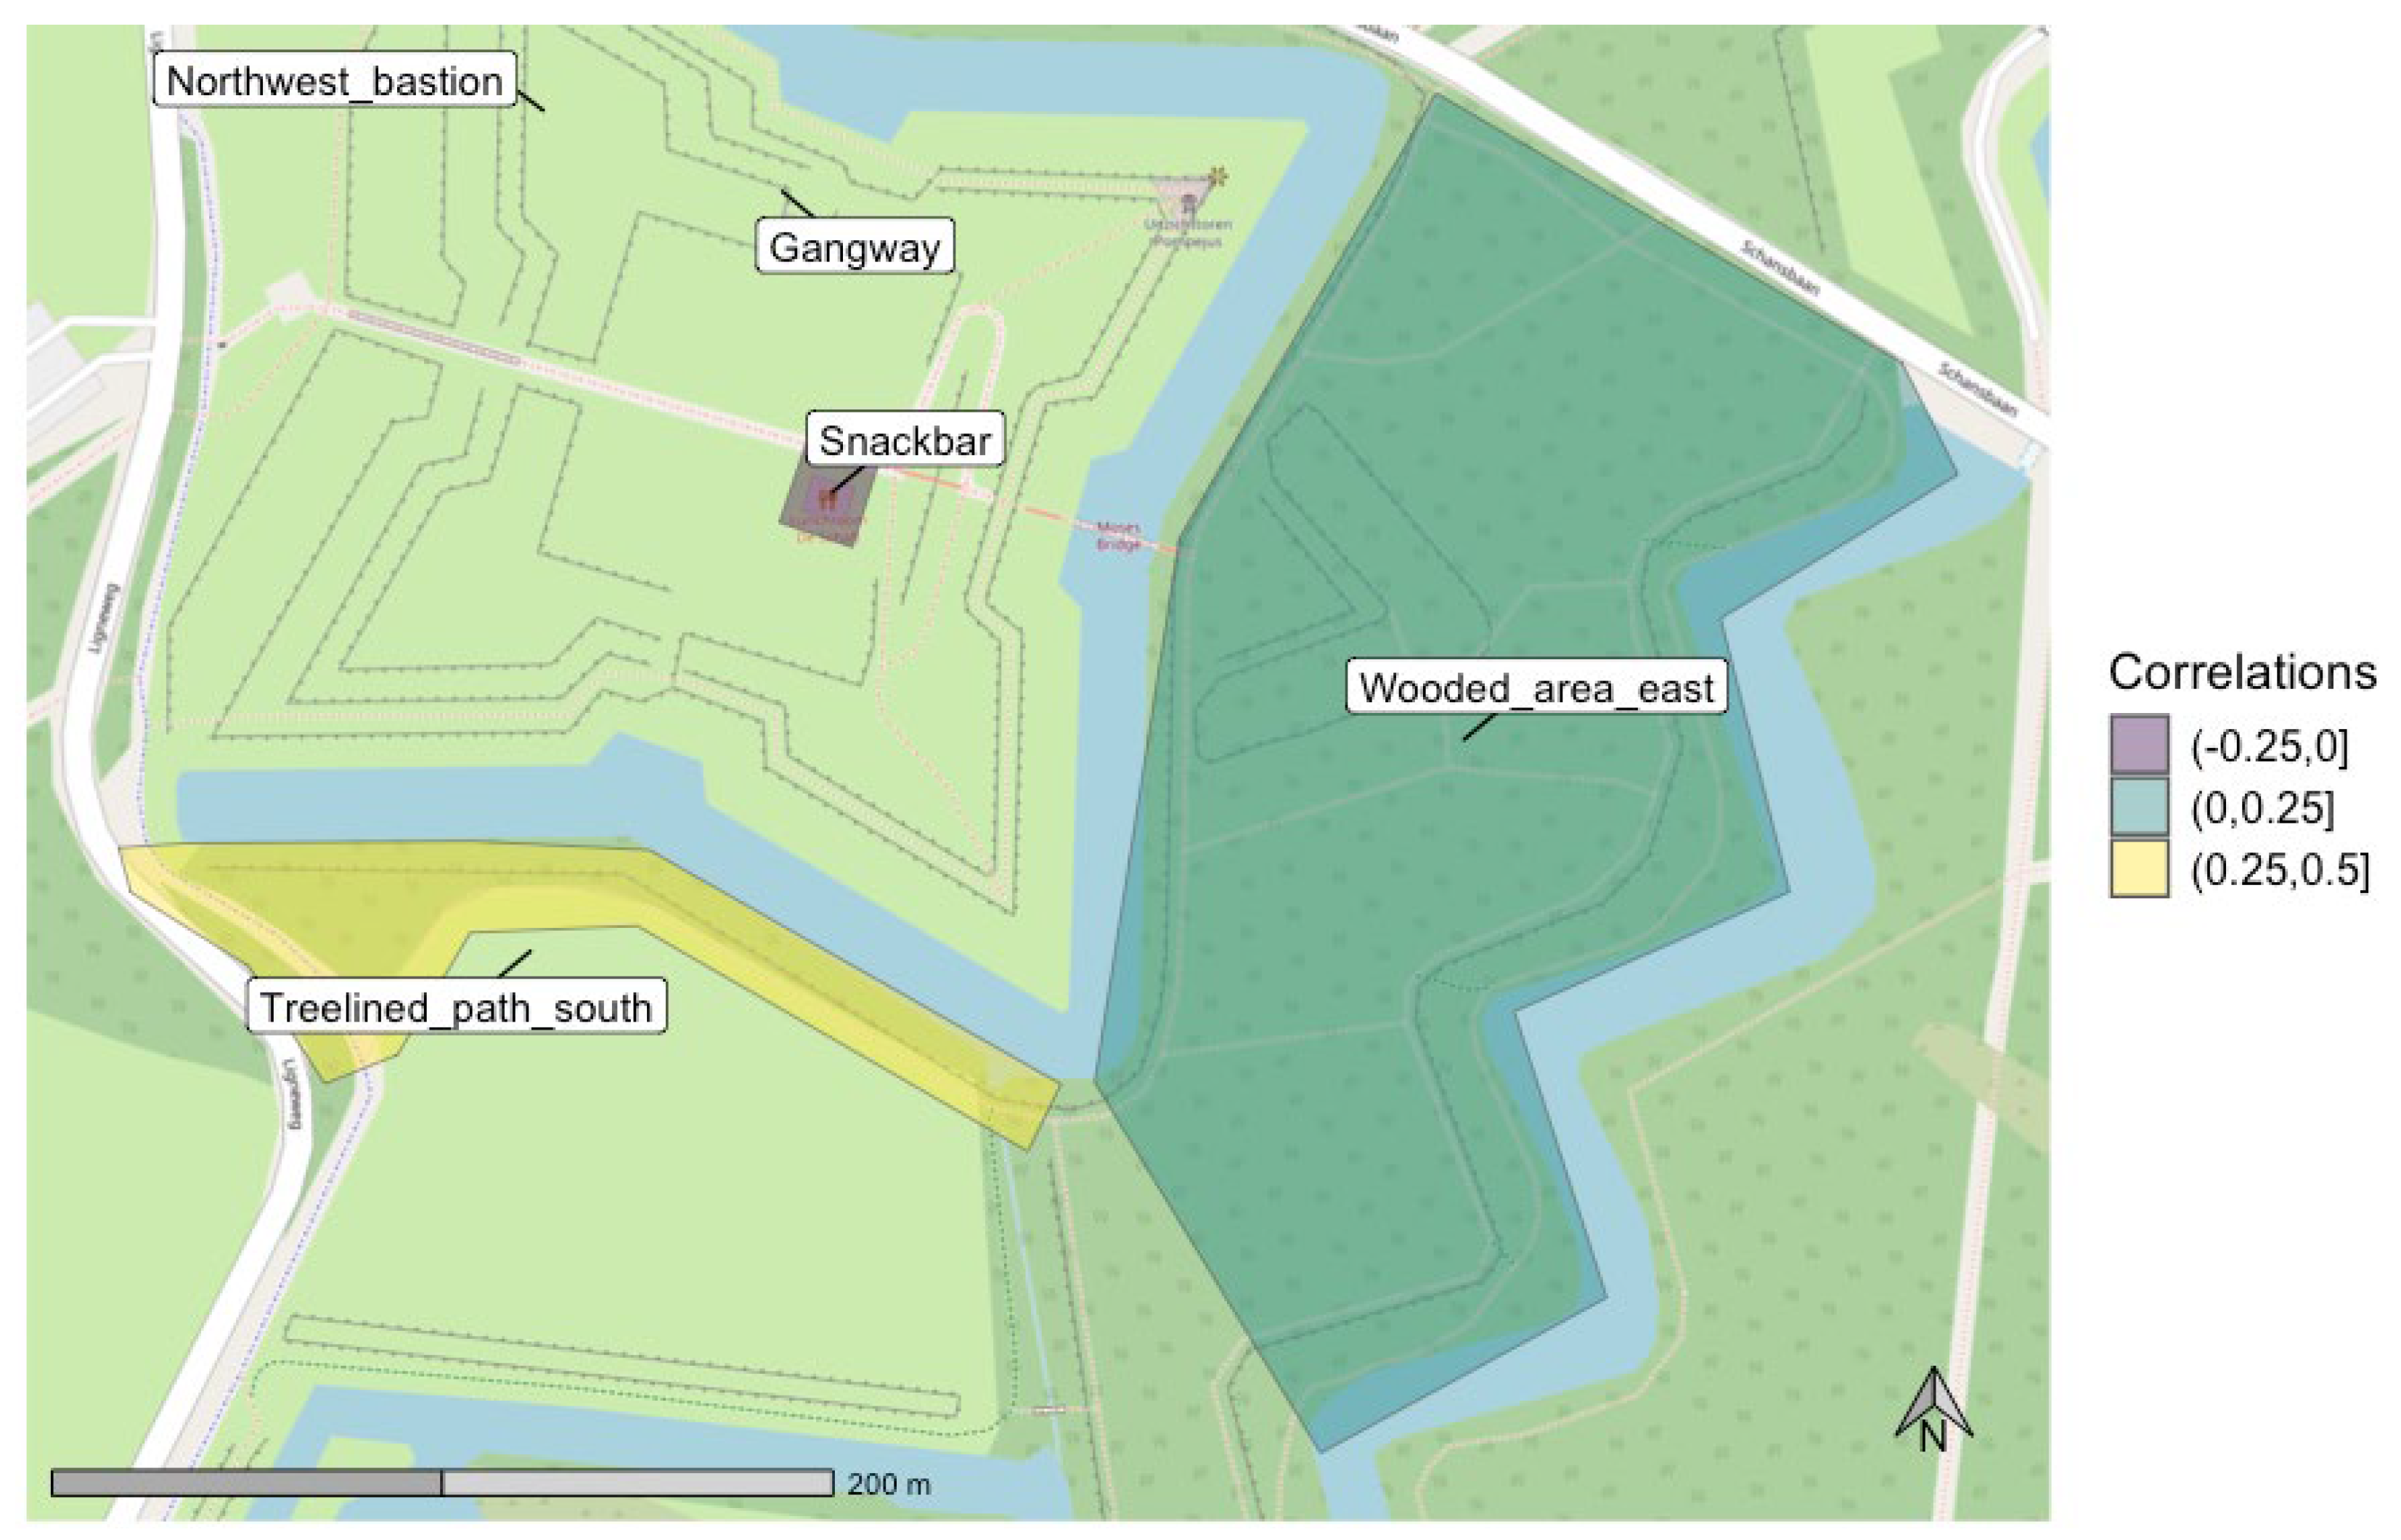
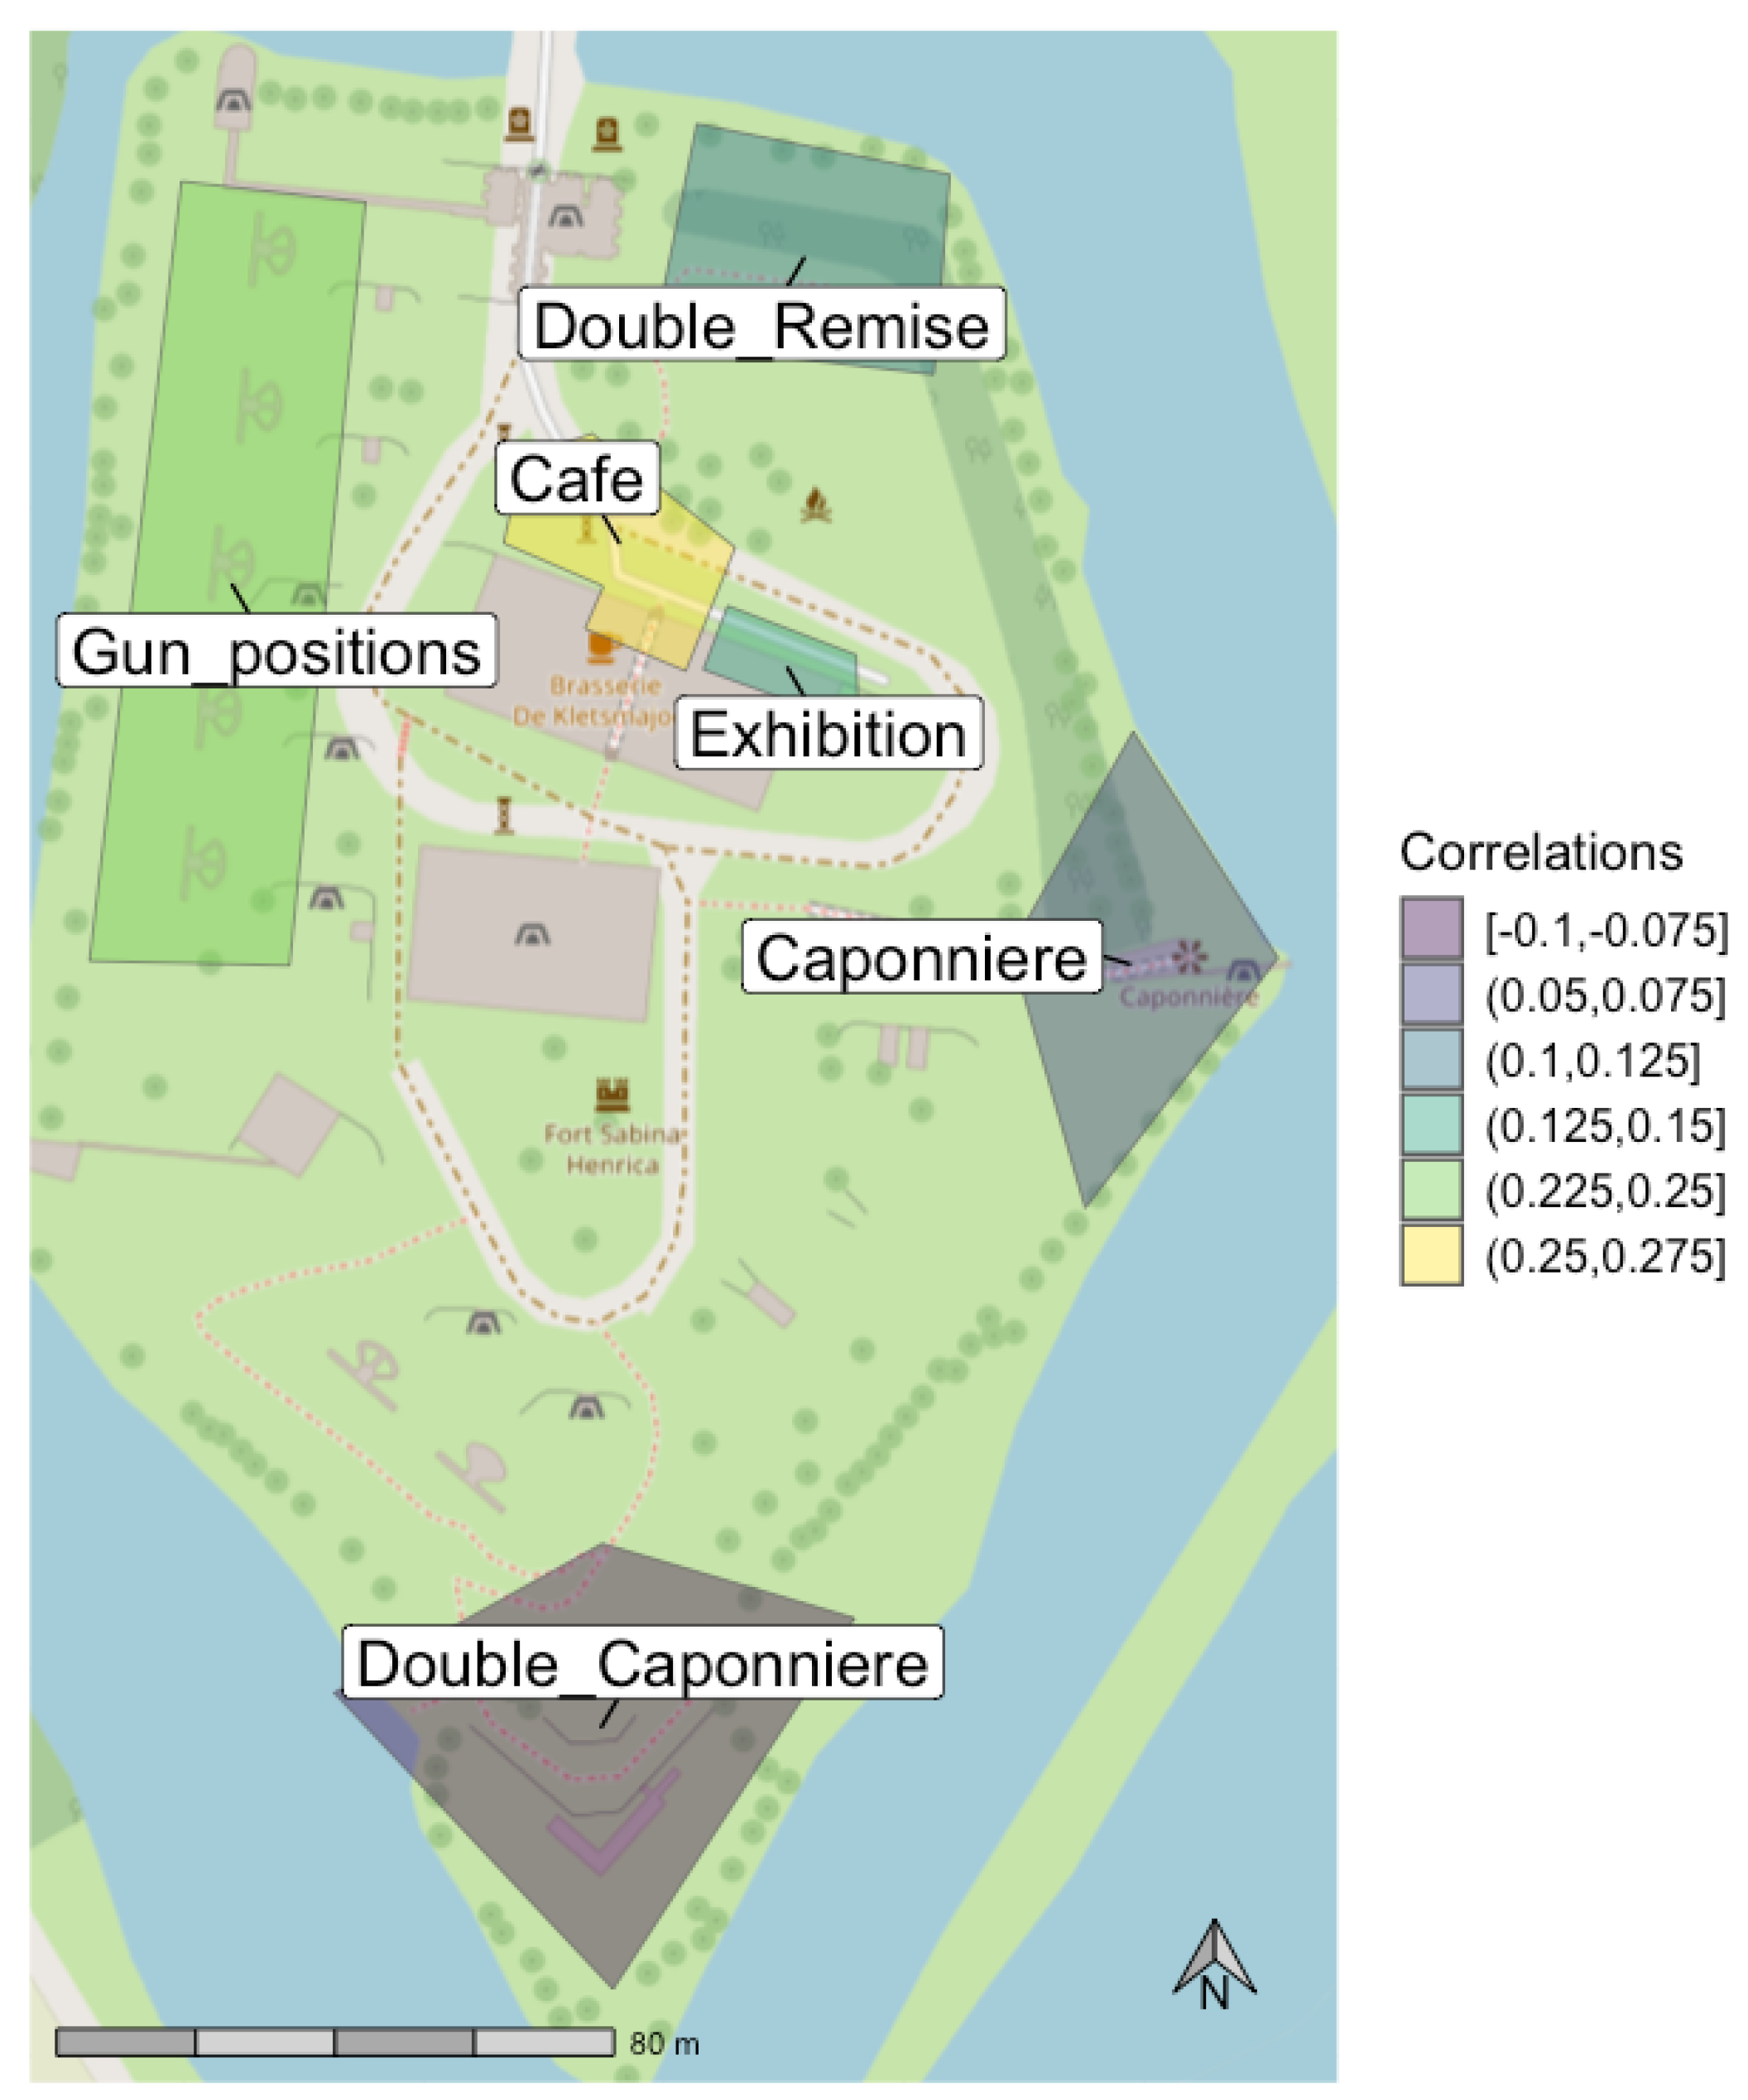
Figure 8). Each data point was then assigned a value of 0 or 1 for variables representing each polygon—1, if that data point fell inside the polygon; otherwise, 0. A similar procedure was conducted for grids of evenly sized hexagons covering each site. Merging data together with these polygon area of interest and hexagon grid geometries created the basis for mapping emotional data. As Fort de Roovere generally covered a larger site, due to remaining ancillary fortifications around the main citadel, the maps are shown at a different scale. The scale bar represents 200 m on the maps of Fort de Roovere and 80 m on the map of Fort Sabina.
3.5.2. Data Mapping
To create experience reconstruction maps, the responses to the valence item (negative to positive) were averaged together within each AOI polygon and colored according to the grand average on the five-point response scale. Emotion physiology maps were based on a georeferenced hexagonal grid over the extent of the GPS data. Based on a typical smartphone GPS error of approximately 3 m, we conservatively chose to use hexagons 6 m wide, and to include only hexagons with data from five or more participants. Hexagons were colored based on the percentile rank of the average skin conductance. For comparison purposes, we also created a version with skin conductance values averaged within the same AOI polygons as the experience reconstruction map. Skin conductance maps display quantiles, because skin conductance data distributions are extremely skewed and when displayed as even standardized averages, differences between adjacent locations are occasionally misleadingly exaggerated.
For emotion effectiveness maps, skin conductance data were averaged within each hexagon, within each participant separately. A correlation coefficient was computed between the average skin conductance per participant within each hexagon, and self-reported positive emotion change from baseline. These correlation coefficients represent the between-participant relationships between skin conductance within each hexagon and positive emotions recalled from the overall visit. The same procedure was applied to the AOI polygons for comparison to the experience reconstruction map.
3.5.3. Statistical Validation
To compare emotion maps against a statistical model of spatial emotion patterns, we followed the multilevel modeling approach in other physiological field studies (
Mitas et al., 2020;
Strijbosch et al., 2021). We first created an emotion physiology model, then built it out to an emotion effectiveness model, analogous to the emotion physiology map and emotion effectiveness map, respectively. This approach made use of the aforementioned AOI variables, coded 1 if a data point falls inside the specific area, otherwise 0. These variables were then entered into a random intercept model with z-standardized, log-transformed phasic skin conductance as the dependent variable. Since many rows of data did not fall in any AOI, the predictors represented the difference in arousal between each AOI and locations out of any AOI, within individuals. Models were derived using the lme4 library (
Bates et al., 2015) in R 4.5.2 (
R Core Team, 2025).
This model was similar to the emotion physiology map, but differed in controlling for the fact that some rows of data originated from one and the same individual (
Hox et al., 2017). Thus, between-person differences in arousal were controlled for, while within-person, between-location differences in arousal were highlighted. In a subsequent step, each of the AOI predictors is allowed to interact with self-reported positive emotion change from before to after visit. These interactions represented the extent to which participants with more positive overall experiences had higher or lower arousal in a given location. As a result, this model was similar to the emotion effectiveness map, but again controls for between-person baseline differences in arousal.
Finally, two three-way comparisons in rank order of AOI were made. We compared the rank order of AOI from most arousing to least arousing based on the experience reconstruction map of arousal self-responses, the emotion physiology map, and the emotion physiology model. Then, we compared the rank order of AOI from least positive (most negative) to most positive based on the experience reconstruction map of valence self-responses, the emotion effectiveness map, and the emotion effectiveness model.
4. Results
4.1. Descriptive Results
The 43 participant visitors to Fort de Roovere (age mean = 57.5, sd = 17.9; 50% female) spent an average of 77.60 min visiting the event at the fort (sd = 46.15 min). They reported mild positive emotions before (m = 2.18, sd = 0.39) and after (m = 2.34, sd = 0.37) their visit. Before- and after-visit positive emotion scores were identical for six of these visitors, and improved for 23. The 55 visitors to the event at Fort Sabina (age mean = 49.3, sd = 15.2; 50.7% female) stayed an average of 70.38 min (sd = 35.11 min). Their self-reported positive emotions were somewhat lower before (m = 2.04, sd = 0.45) and after (m = 2.28, sd = 0.40) their visit compared to Fort de Roovere.
4.2. Mapping the Data
4.2.1. Experience Reconstruction Maps
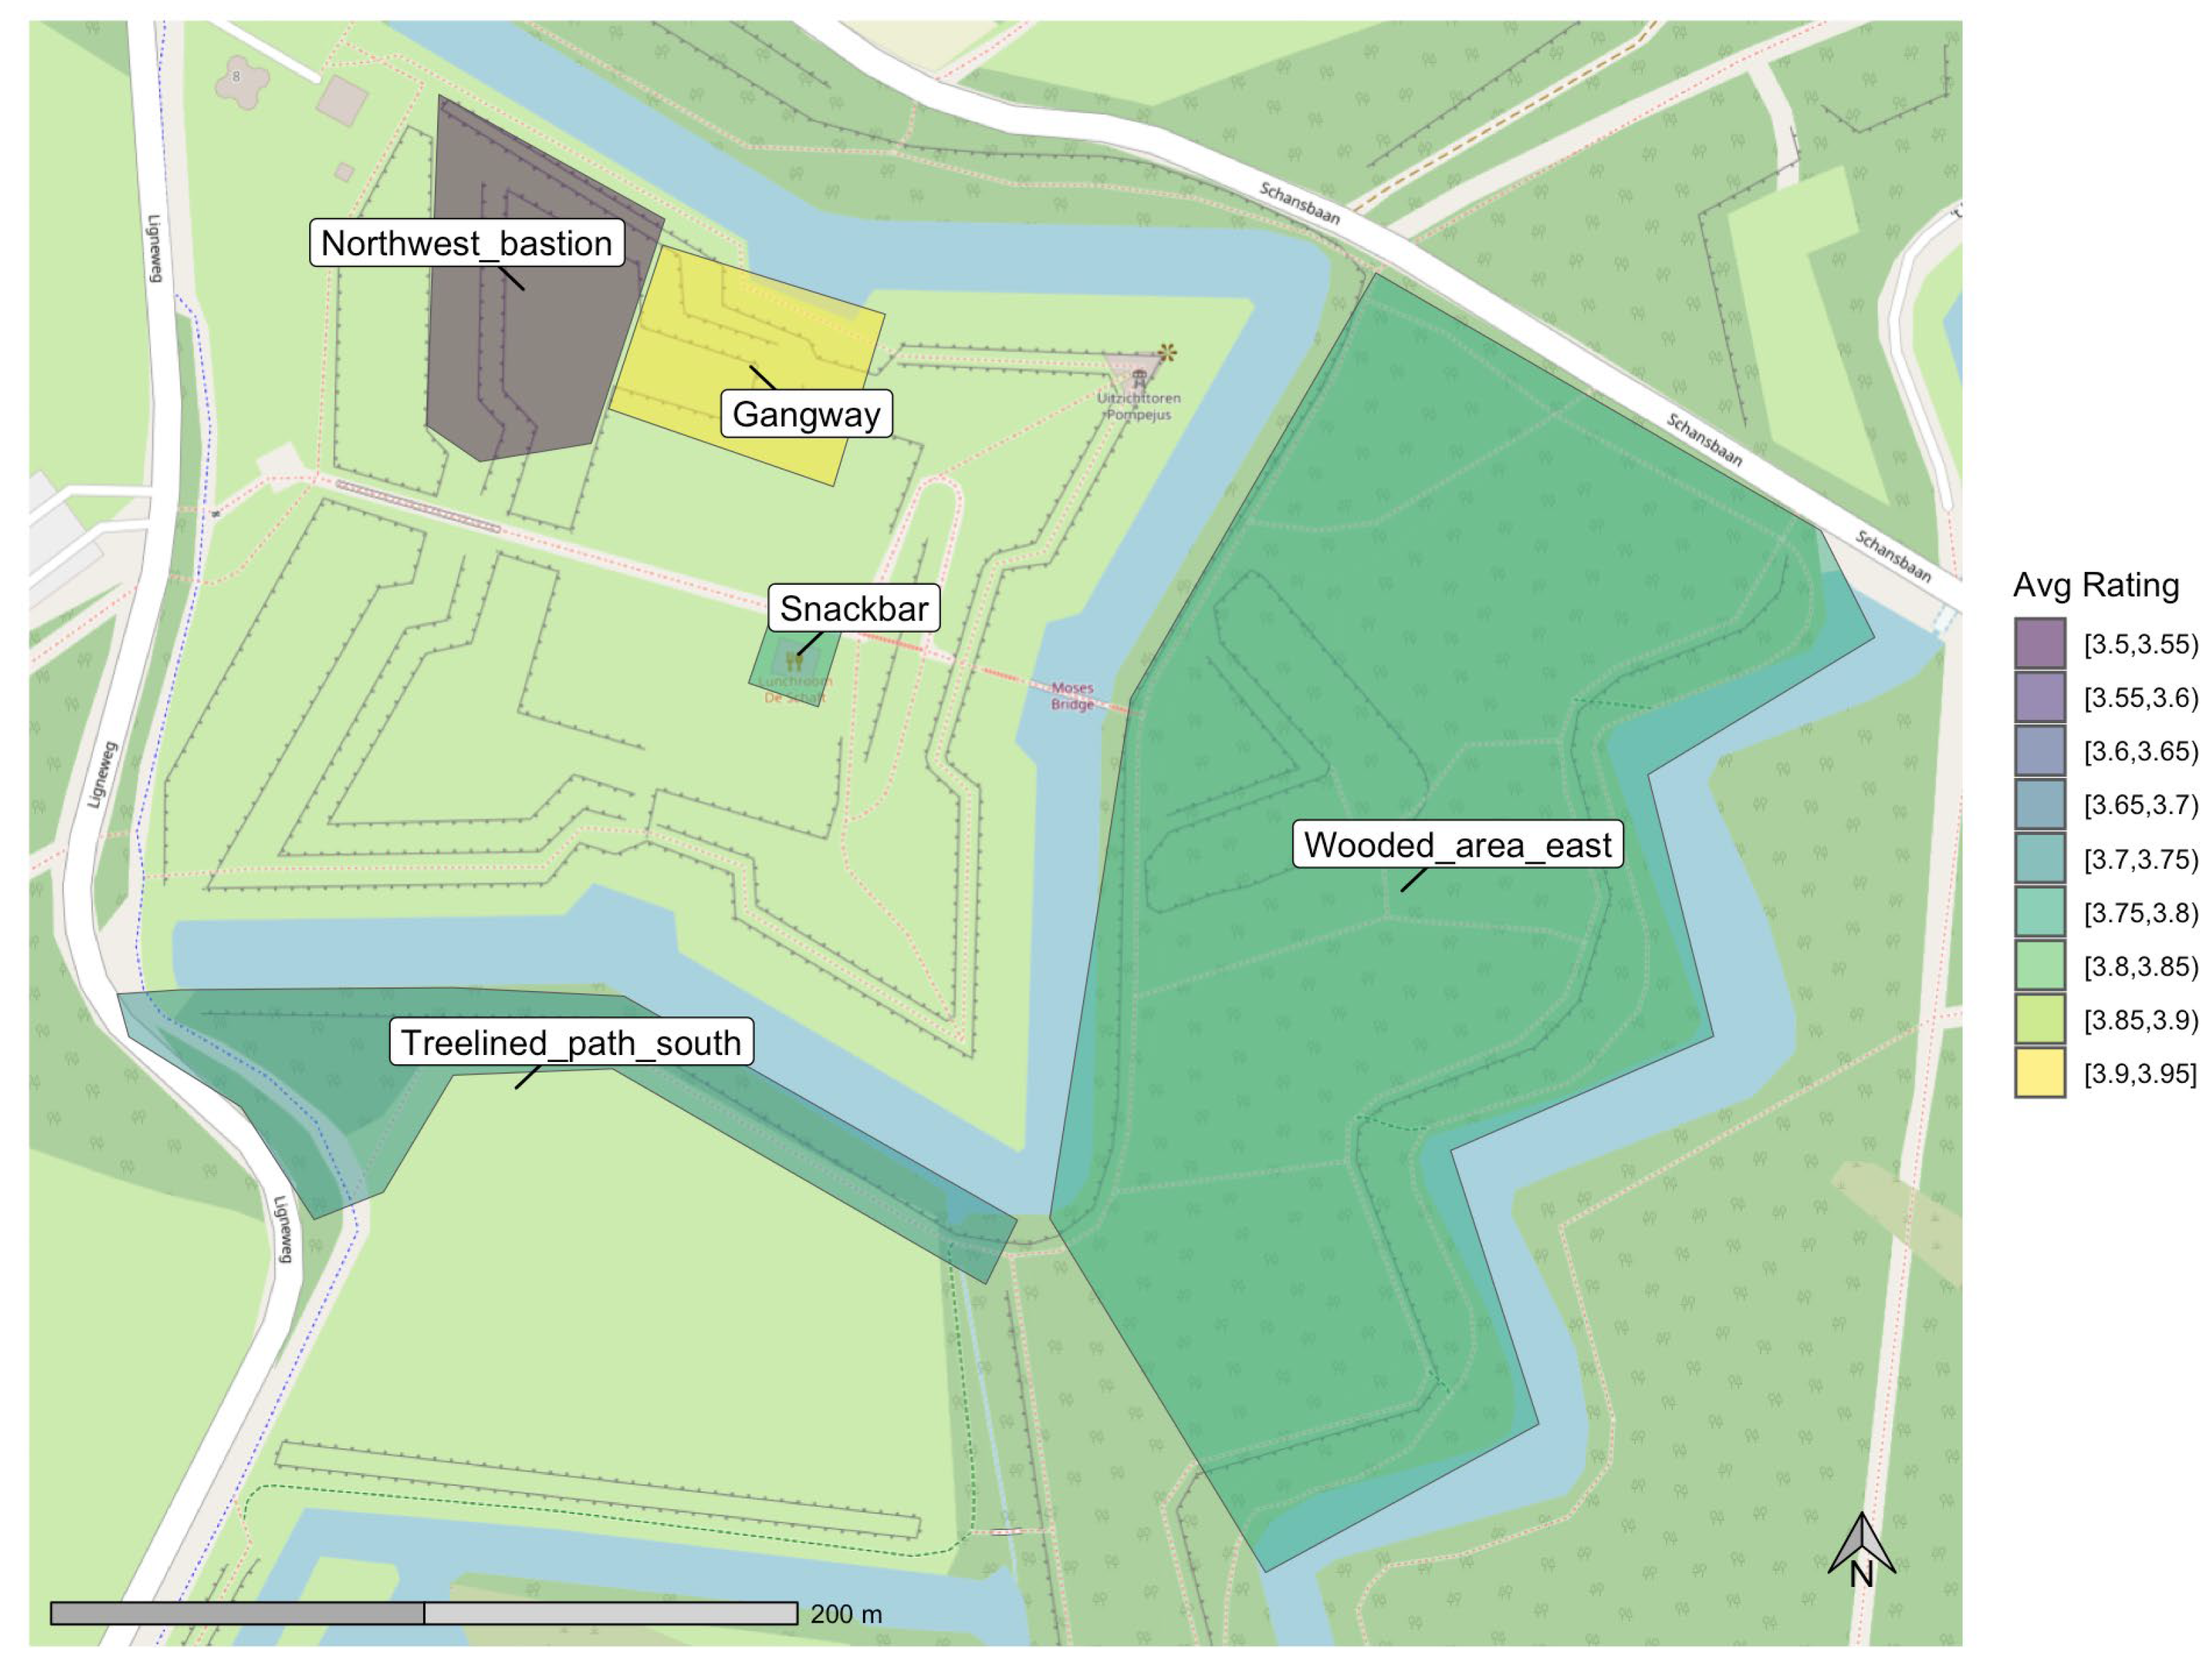
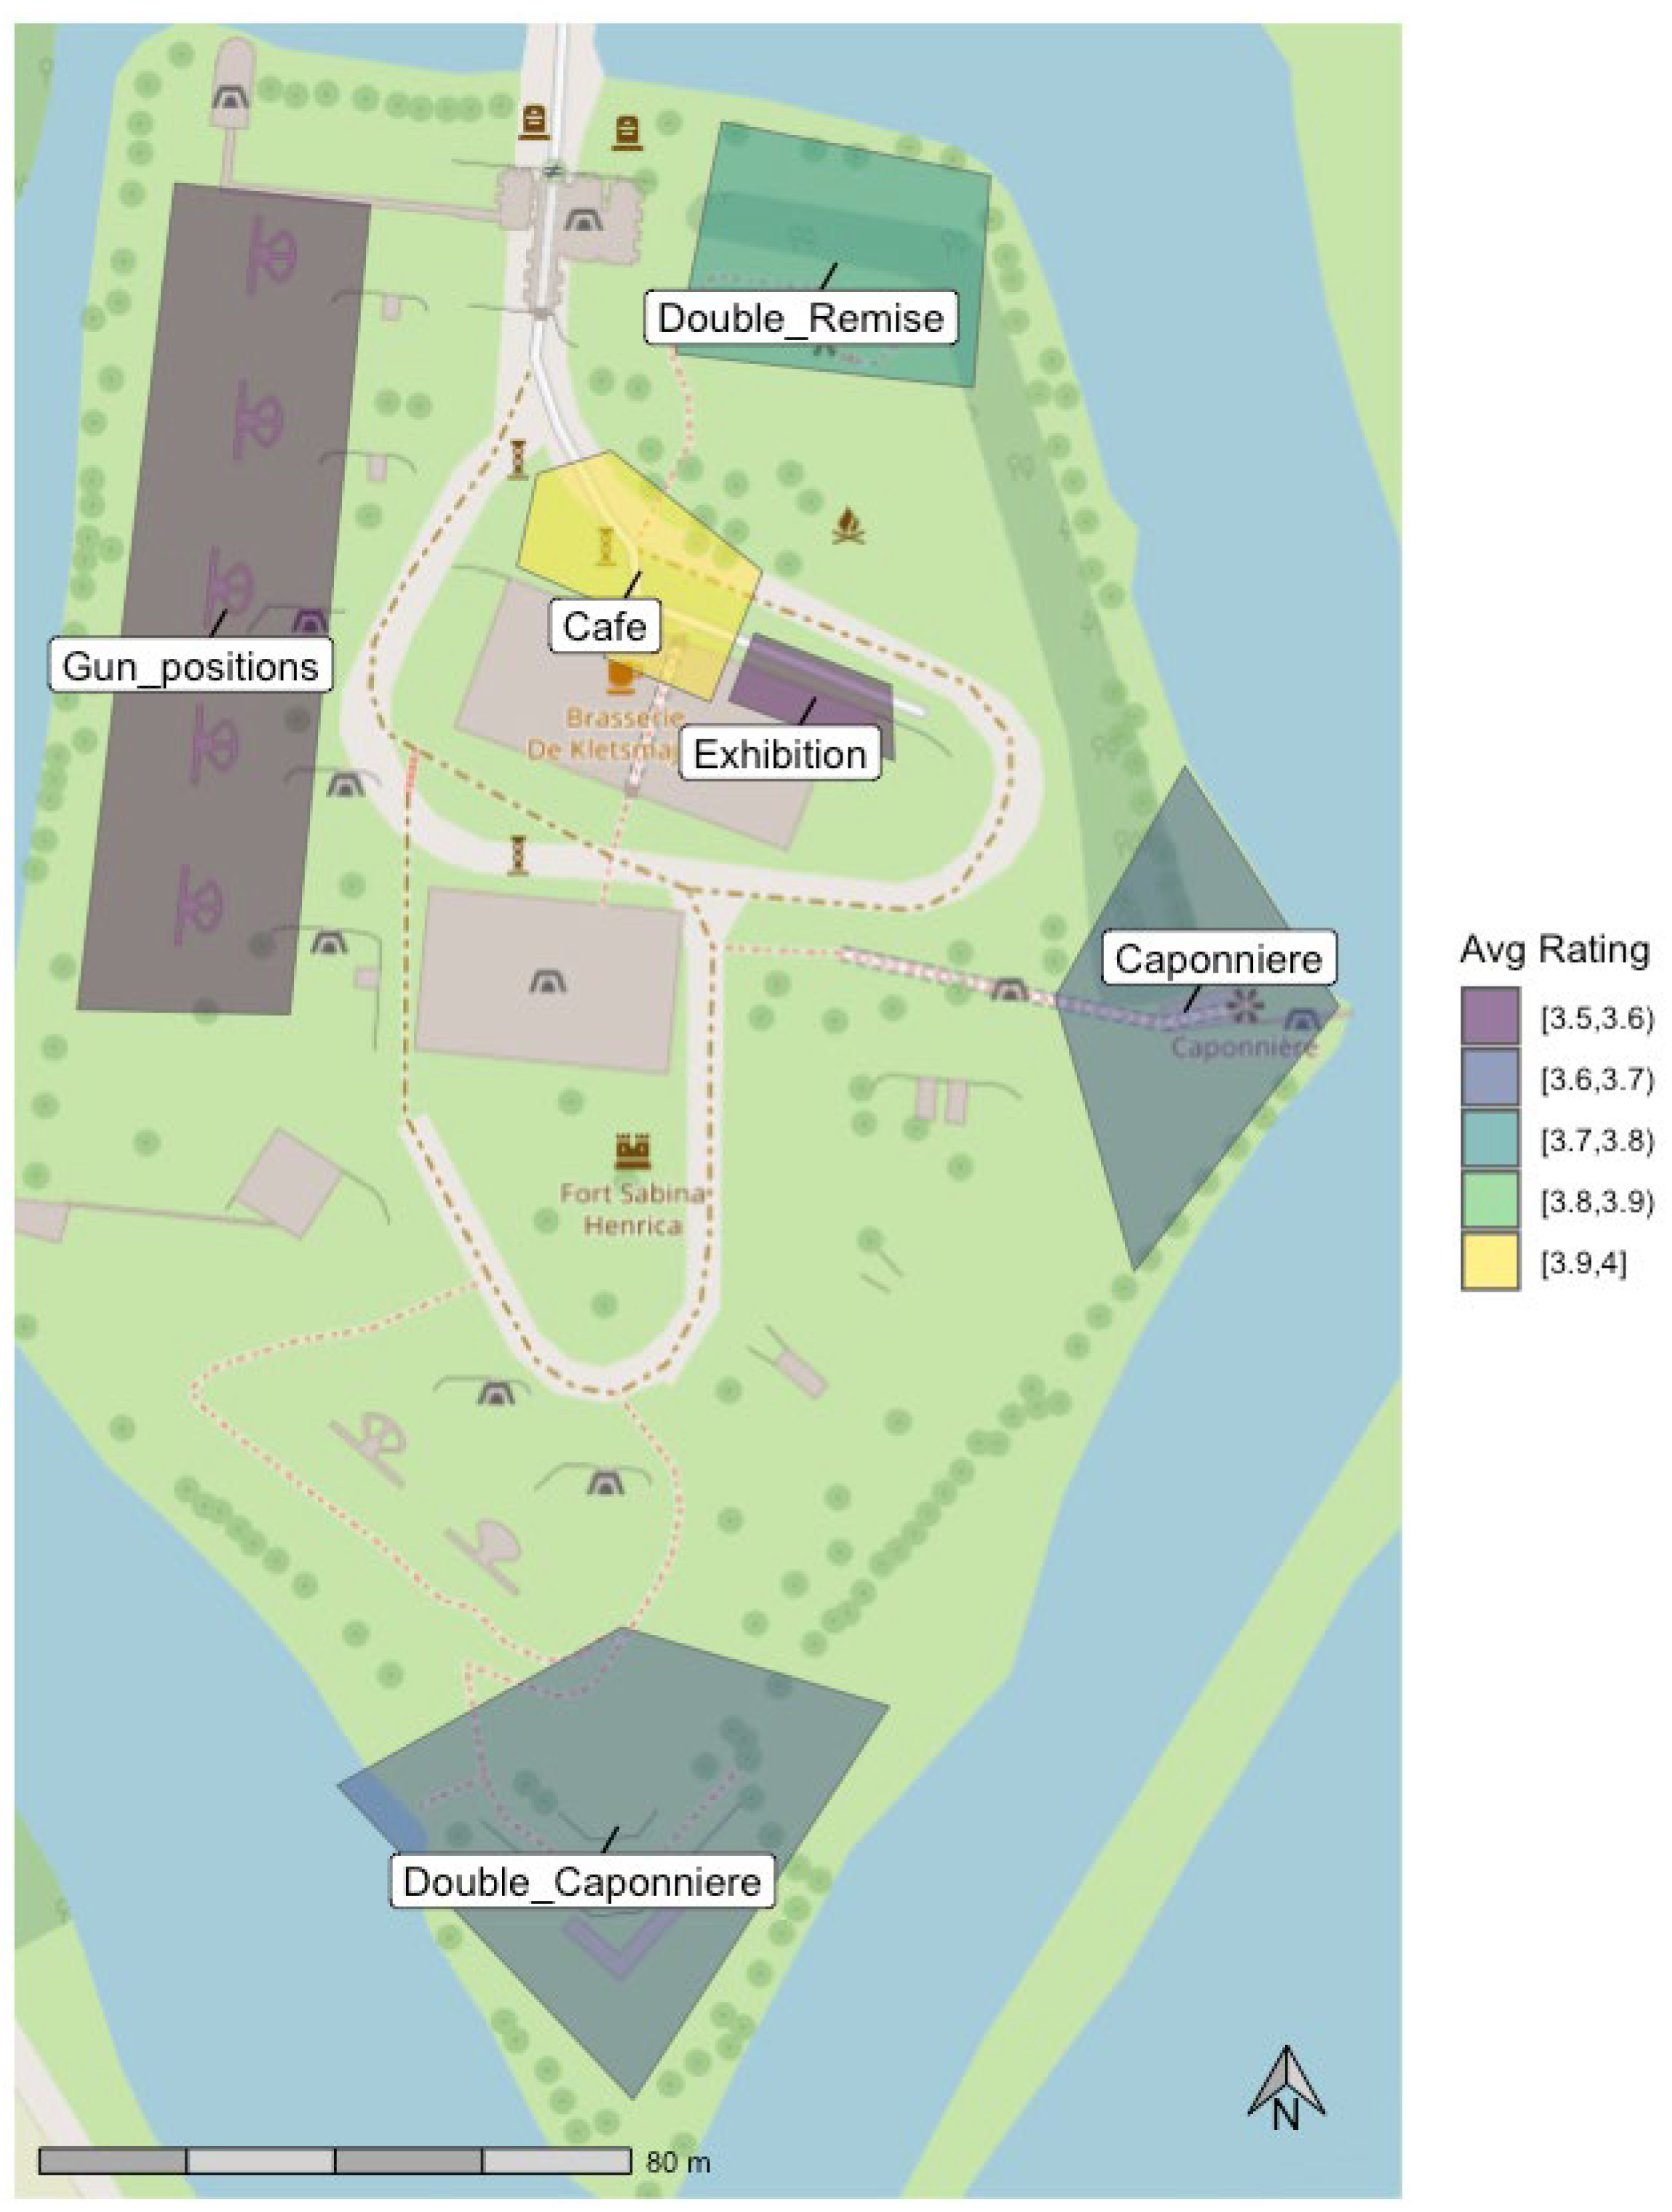
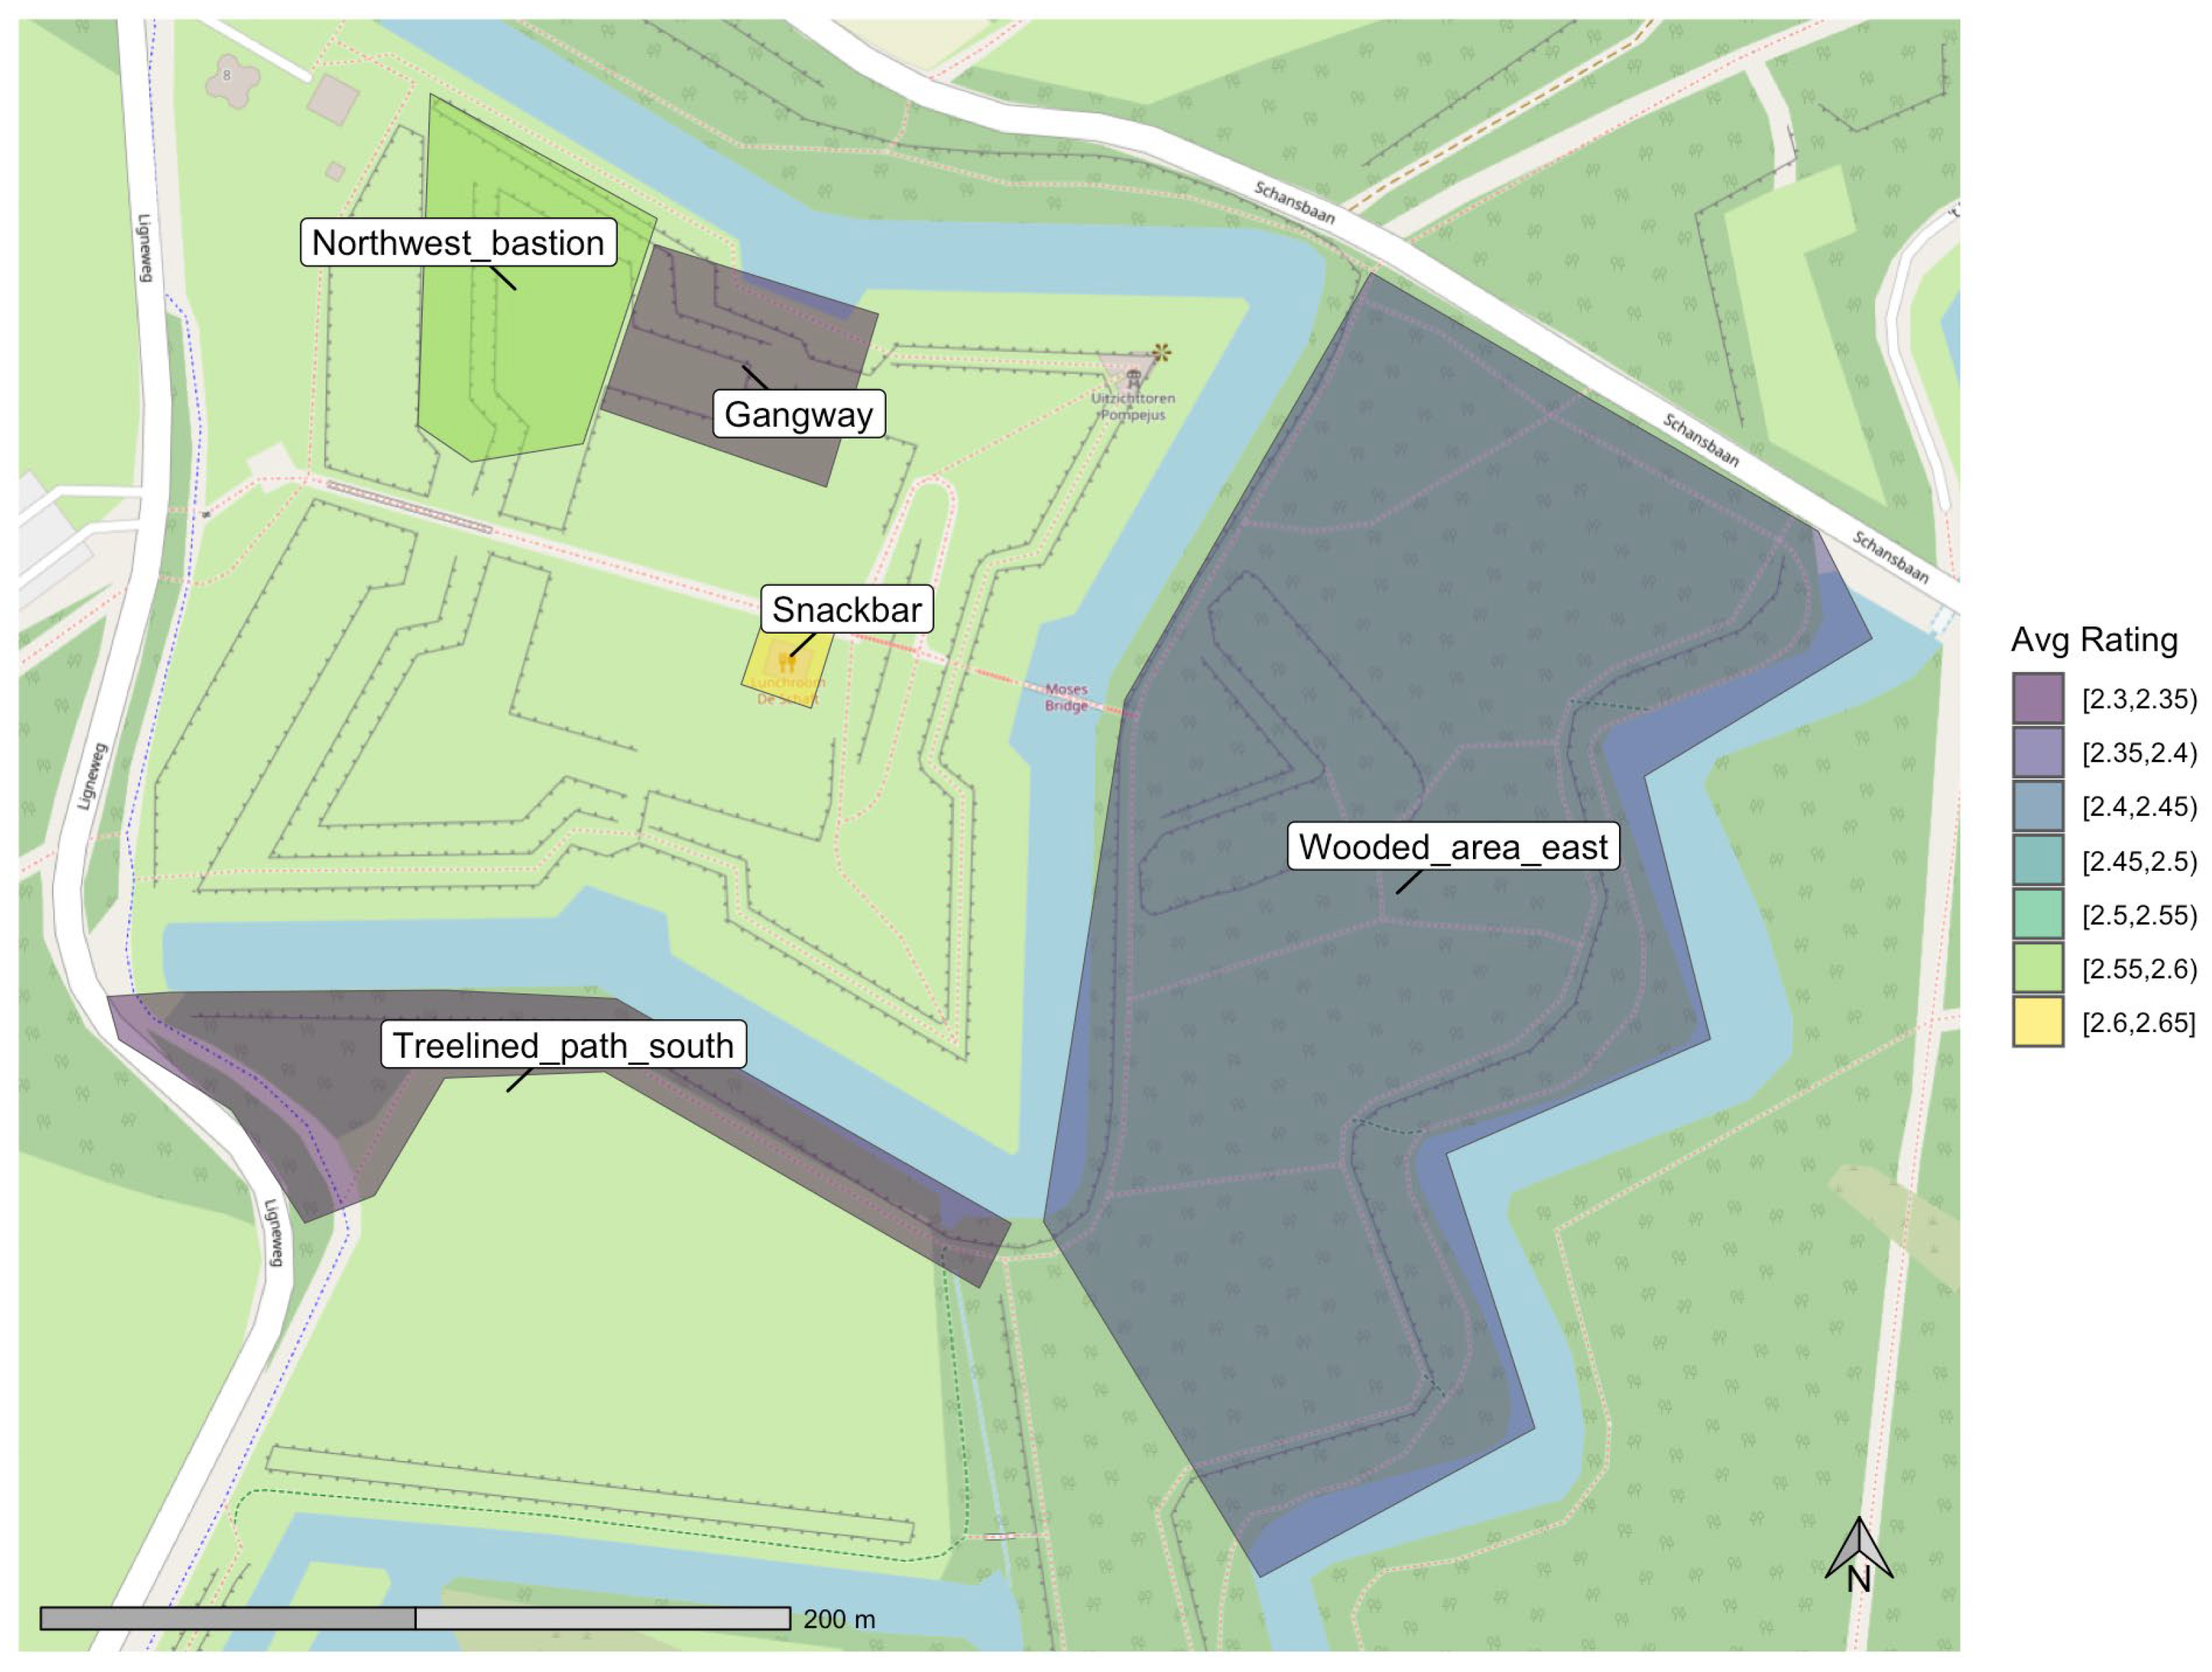
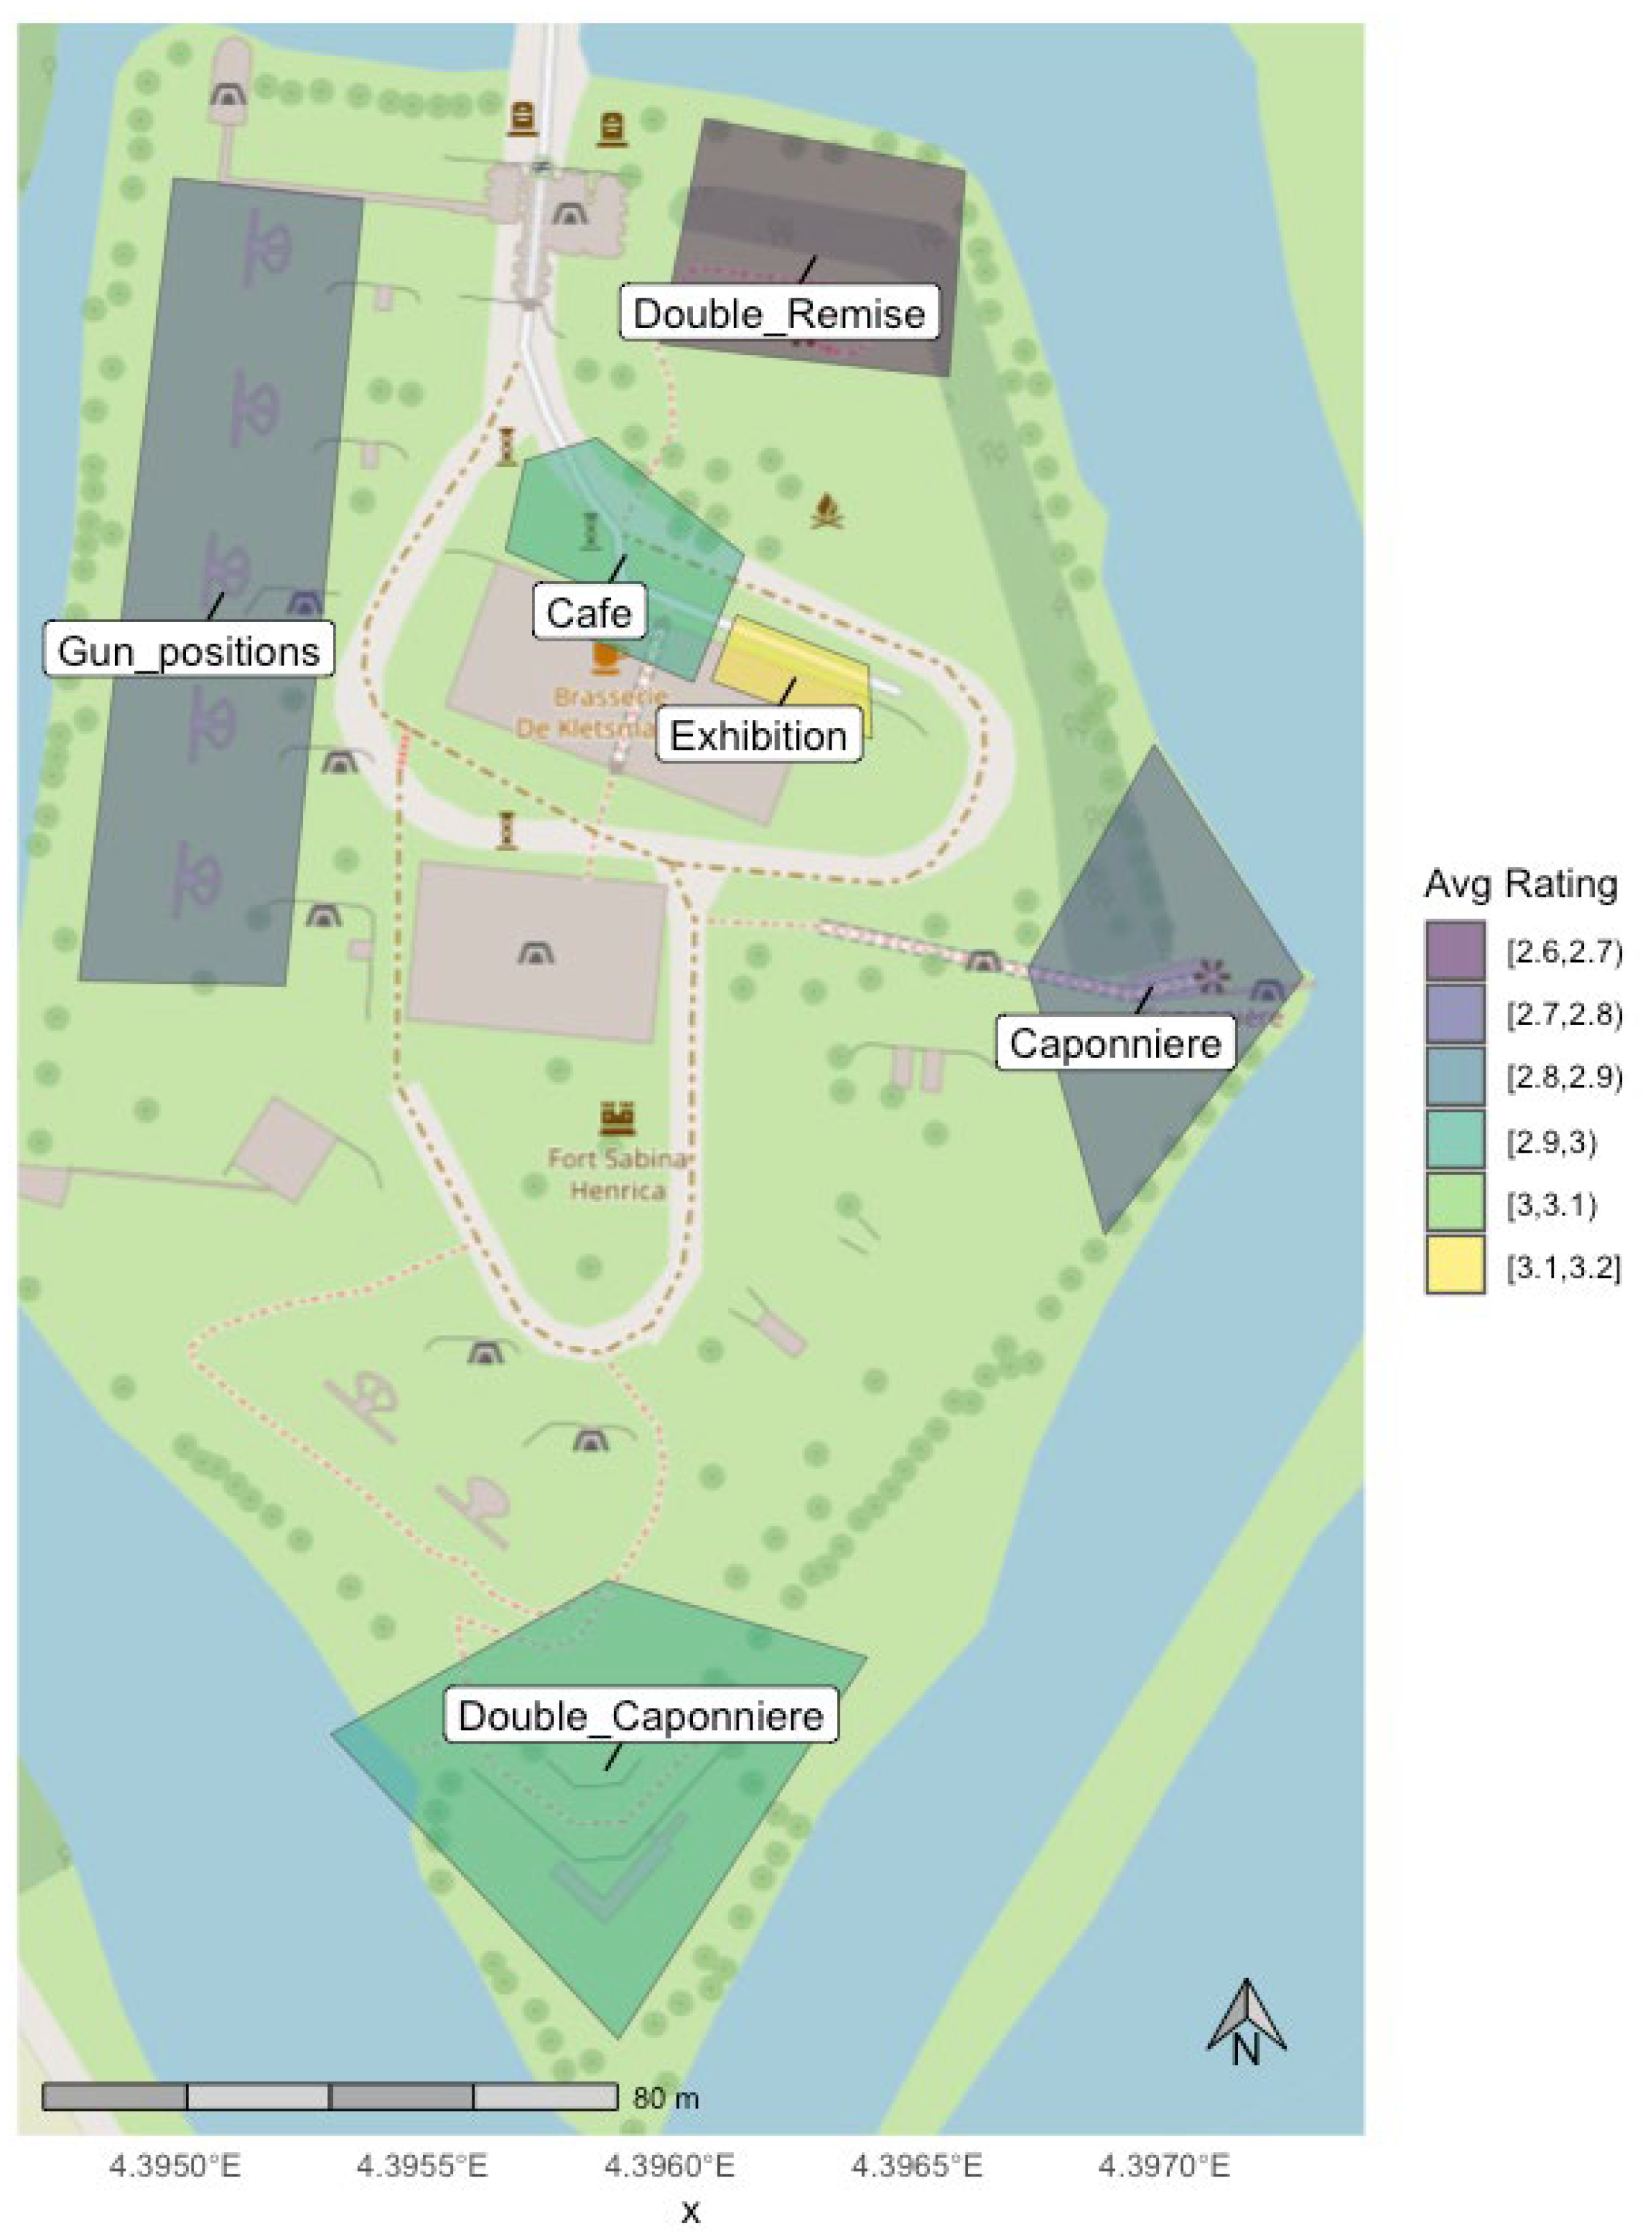
Polygons were colored by percentile rank of their average valence, so the most positive-rated locations were yellow and the least positive-rated locations blue (
Figure 9 and
Figure 10). We created similar maps for highest (yellow) and lowest (blue) self-reported arousal (
Figure 11 and
Figure 12). At Fort Sabina, the café terrace was the most positively rated, while the five gun installations on the western fort wall were the least positively rated, as well as least arousing. The exhibition terrace was rated as the most arousing. At Fort de Roovere, the gangway area was rated as the most positive, with the snack bar and eastern wooded area close behind. Least positive was the northwest bastion. Arousal ratings were nearly the opposite, with the northwest bastion rated as most arousing, while the tree-lined path on the south side of the fort was least arousing.
4.2.2. Emotion Physiology Maps
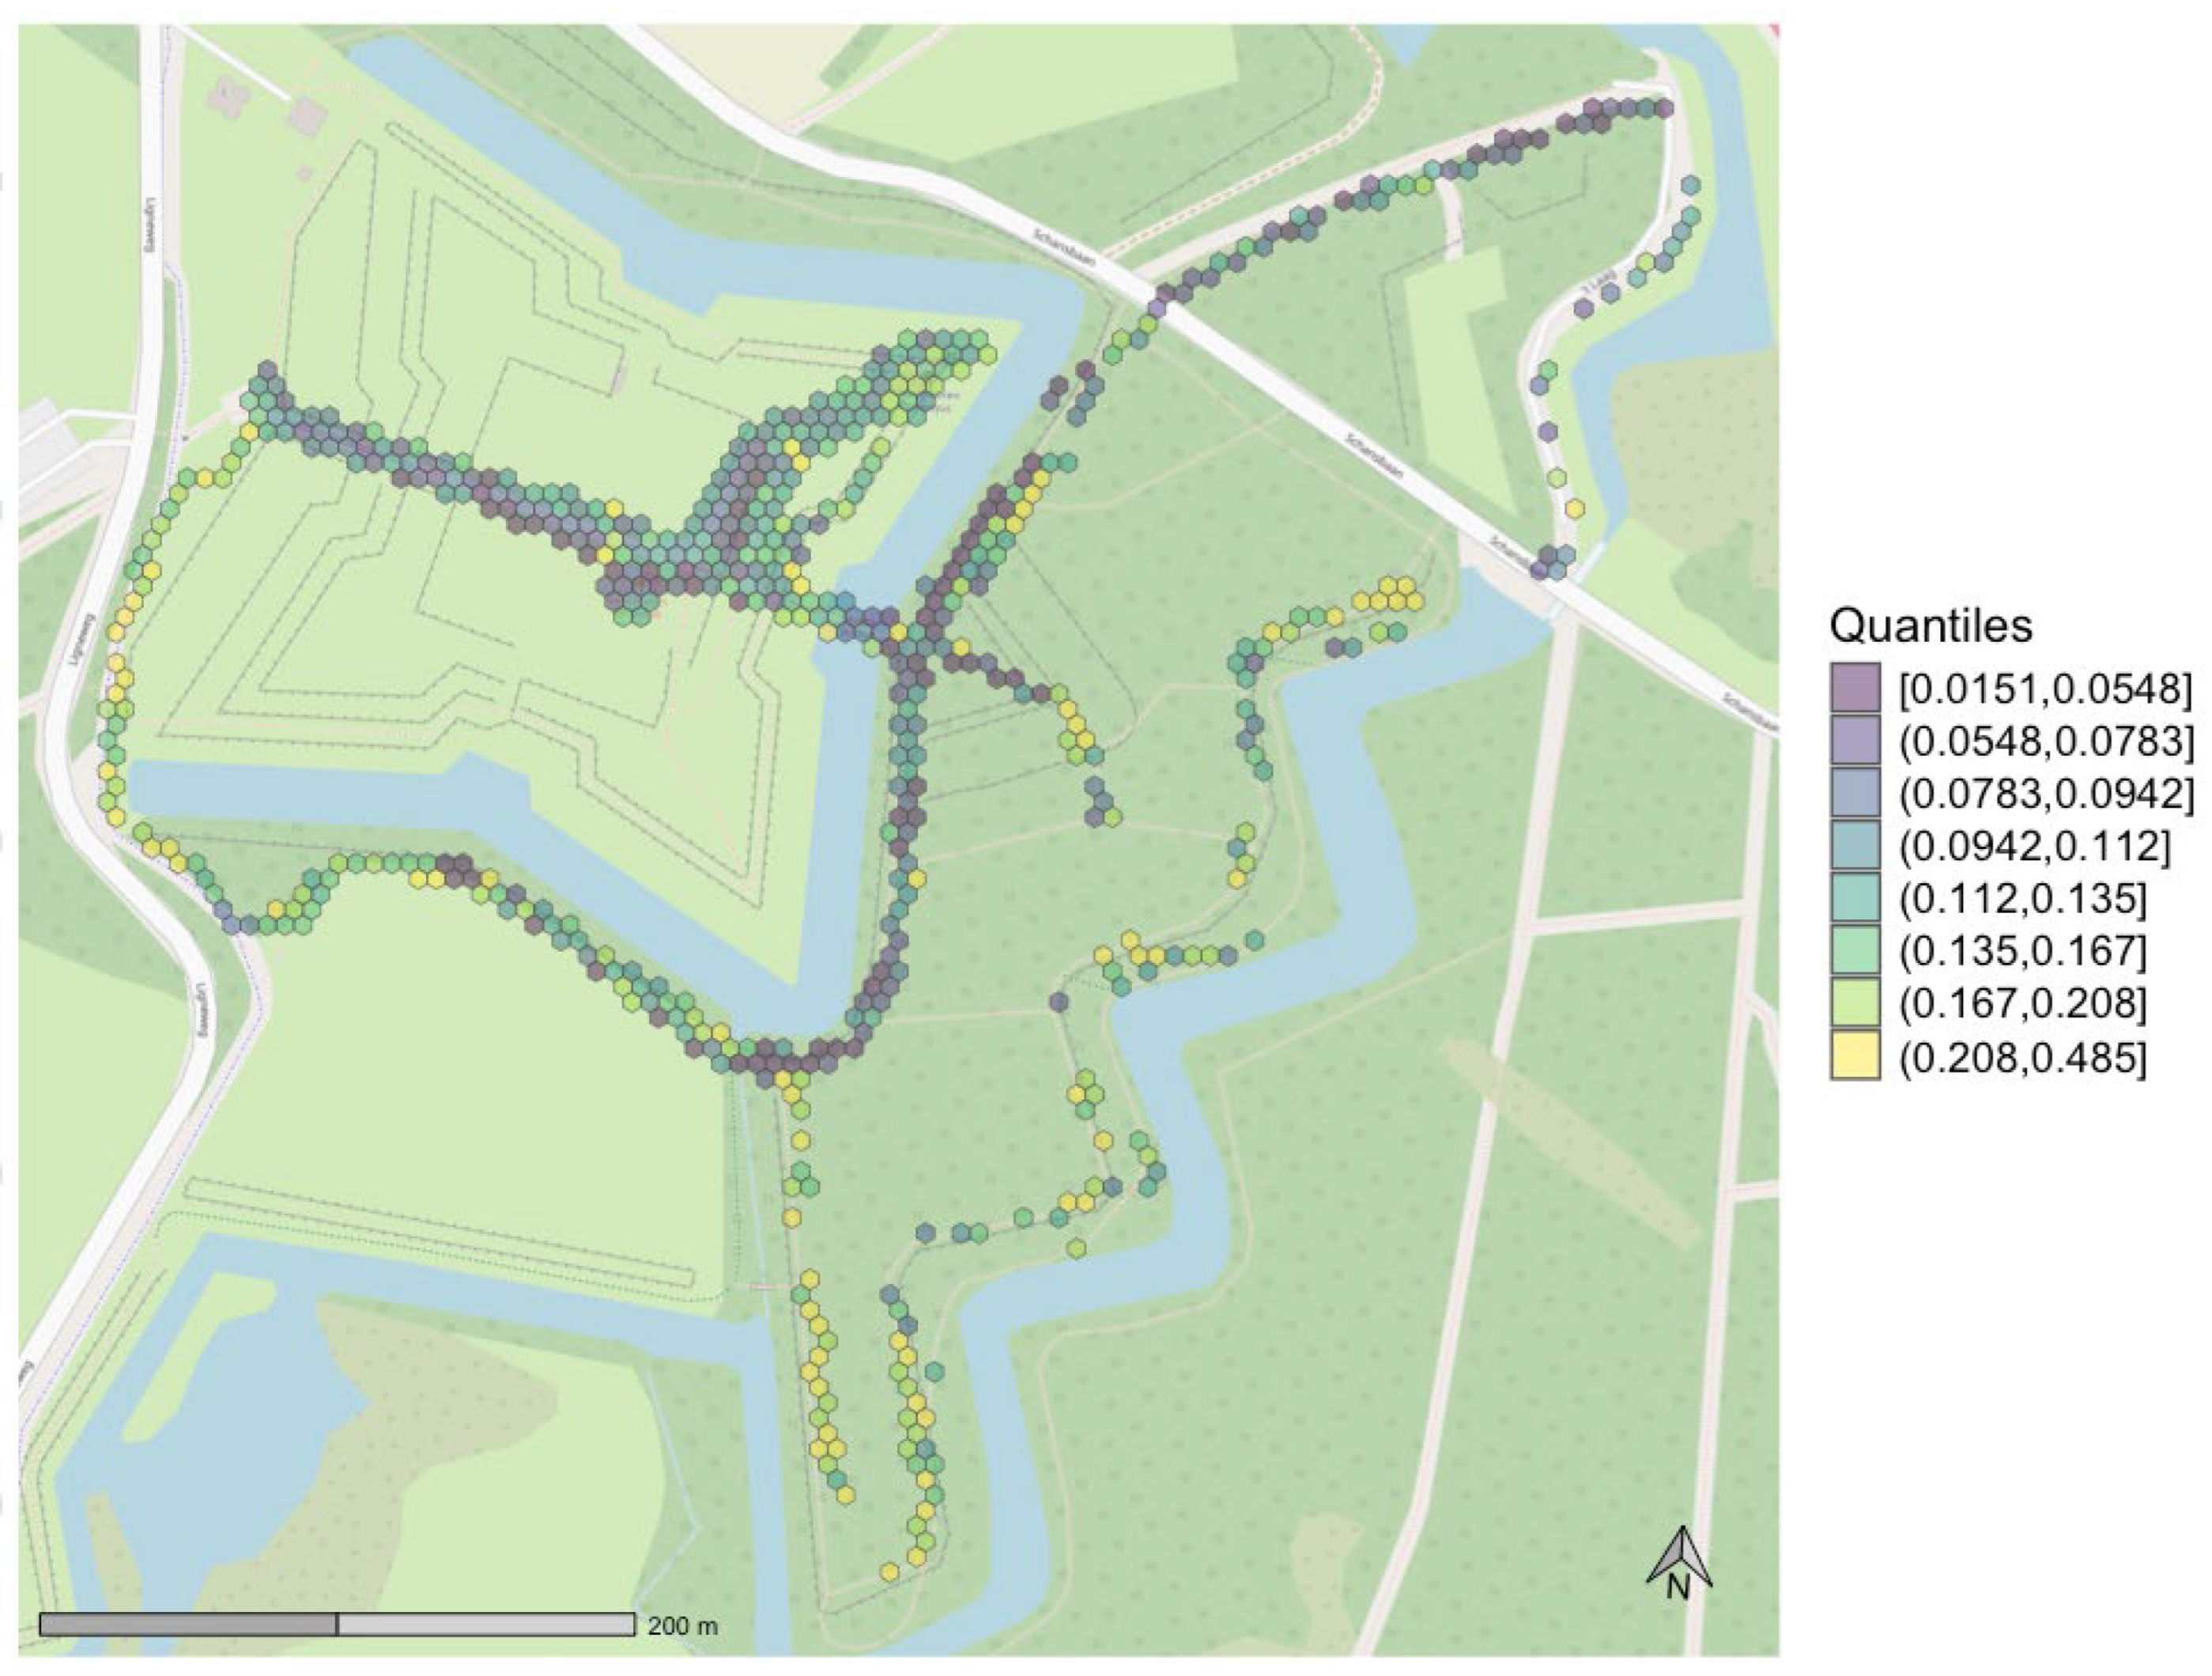
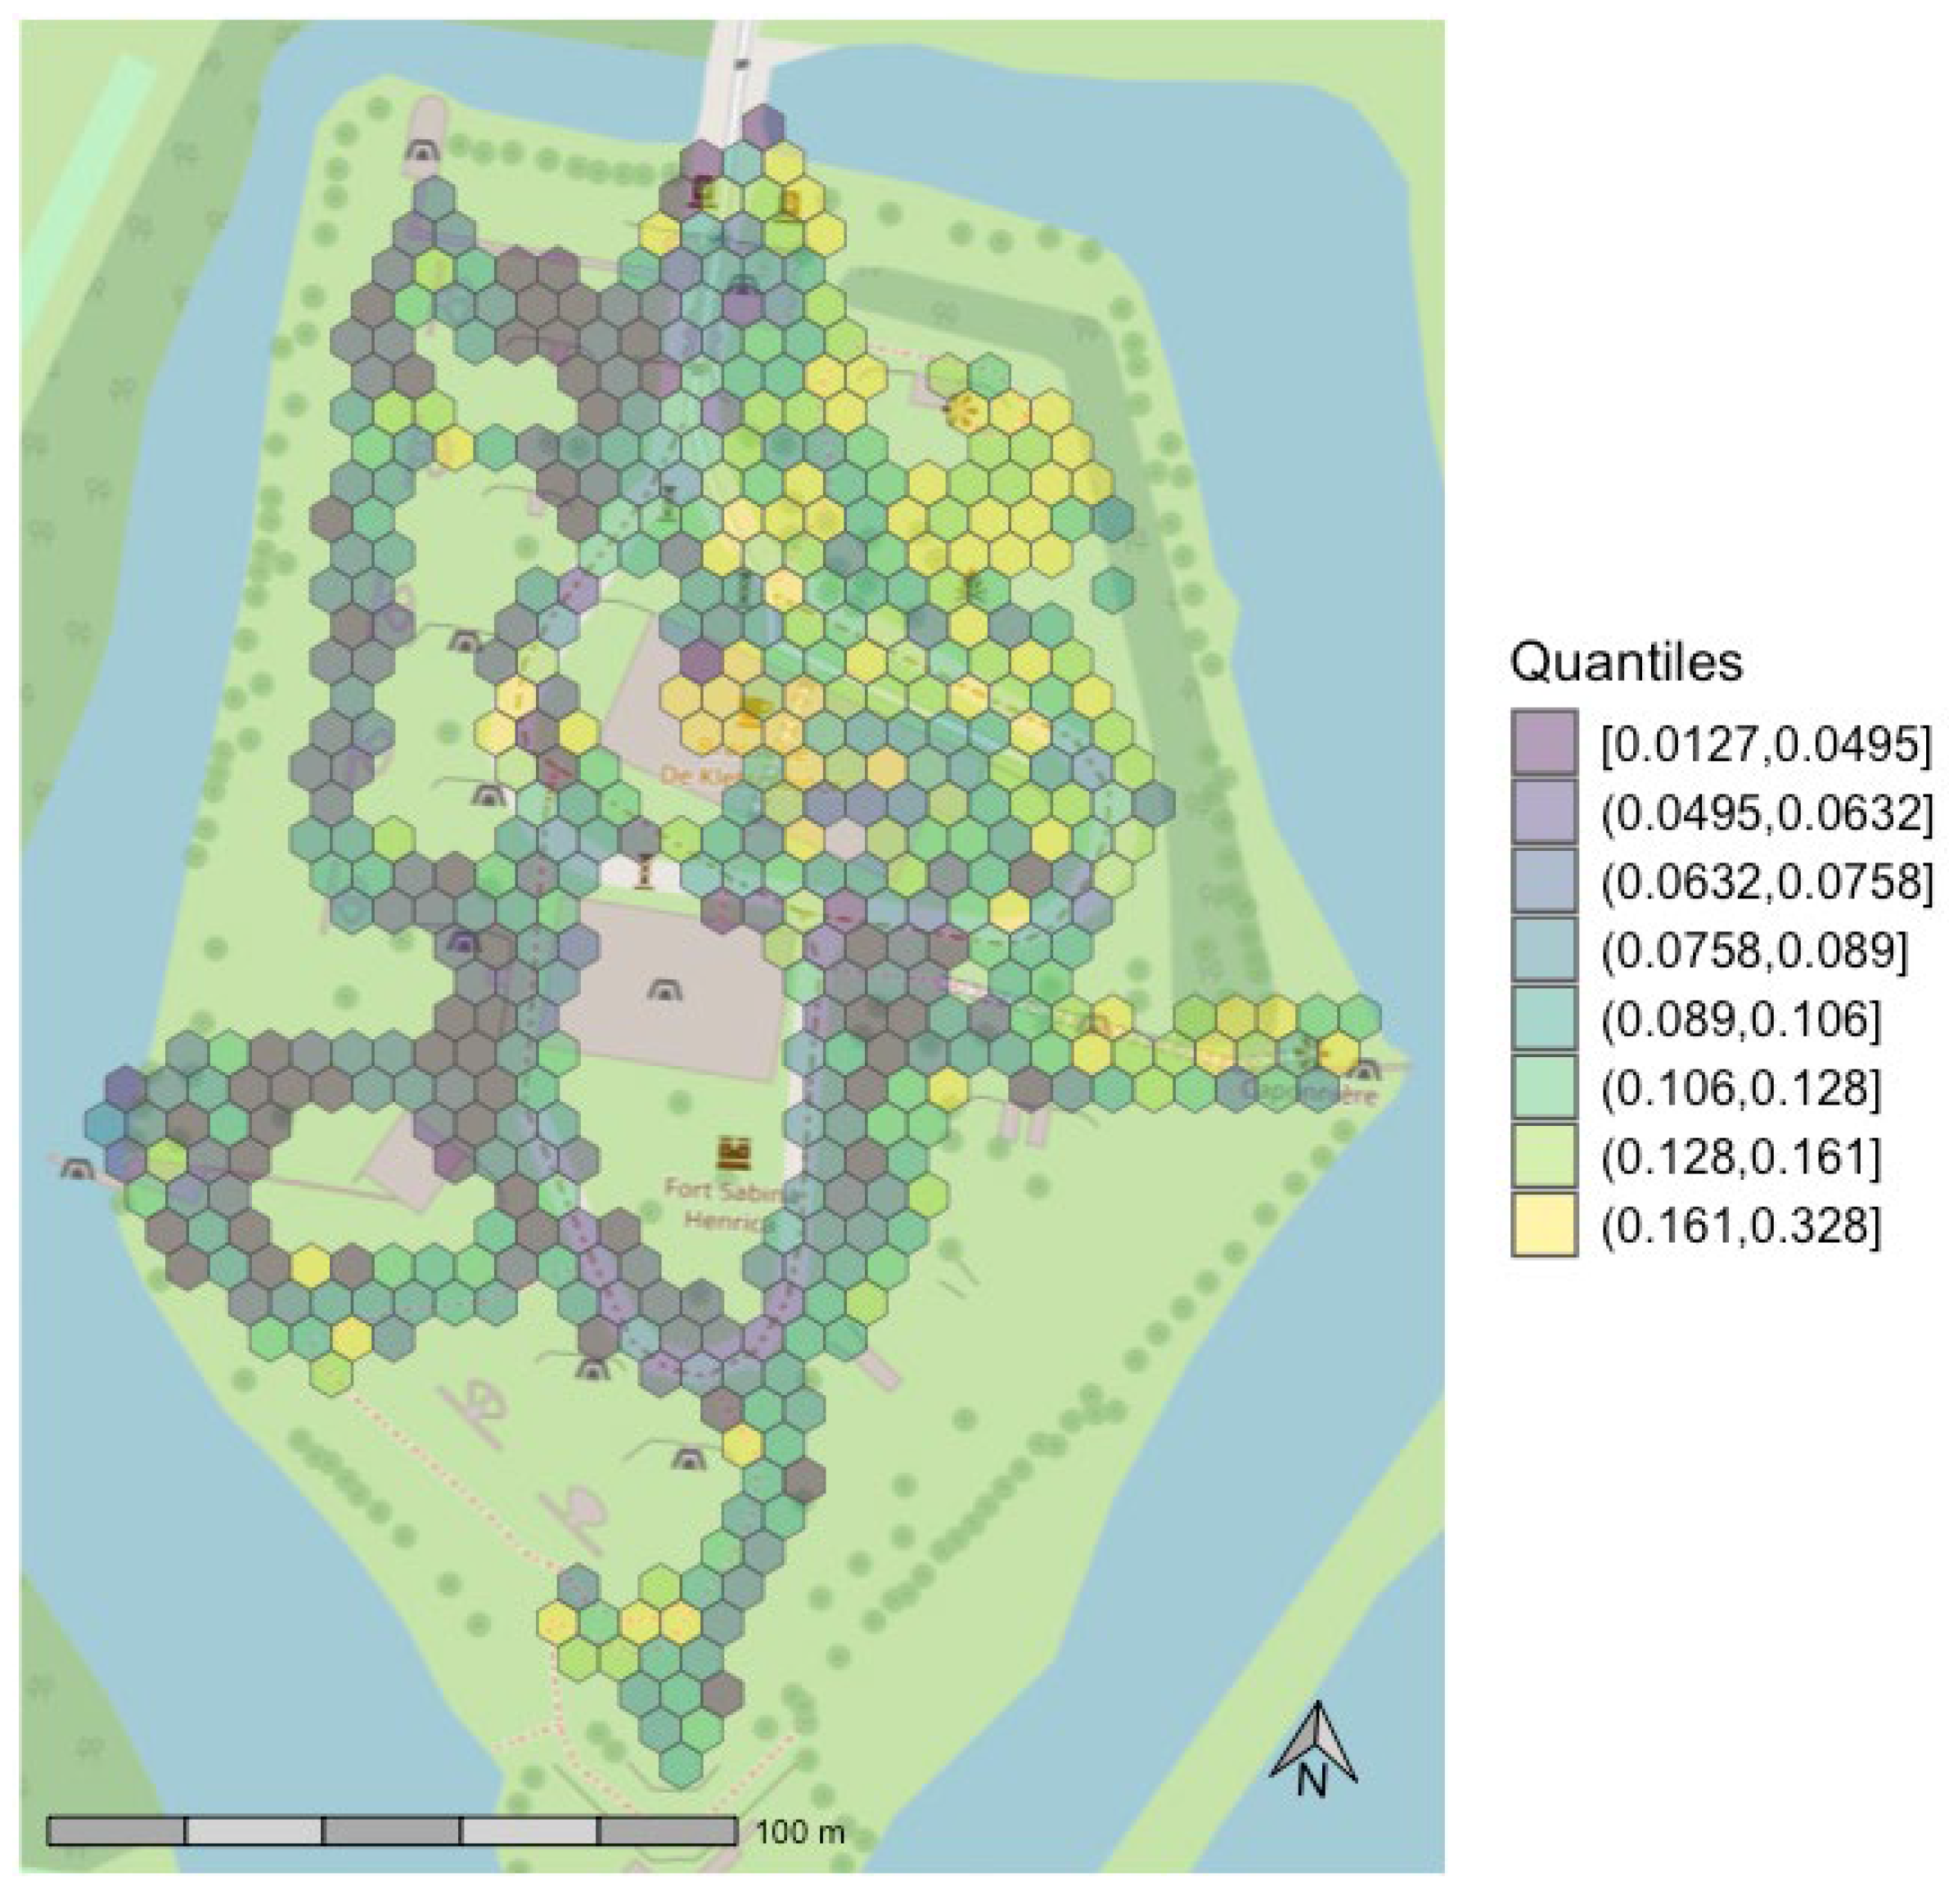
The emotion physiology maps displayed average skin conductance by hexagon (
Figure 13 and
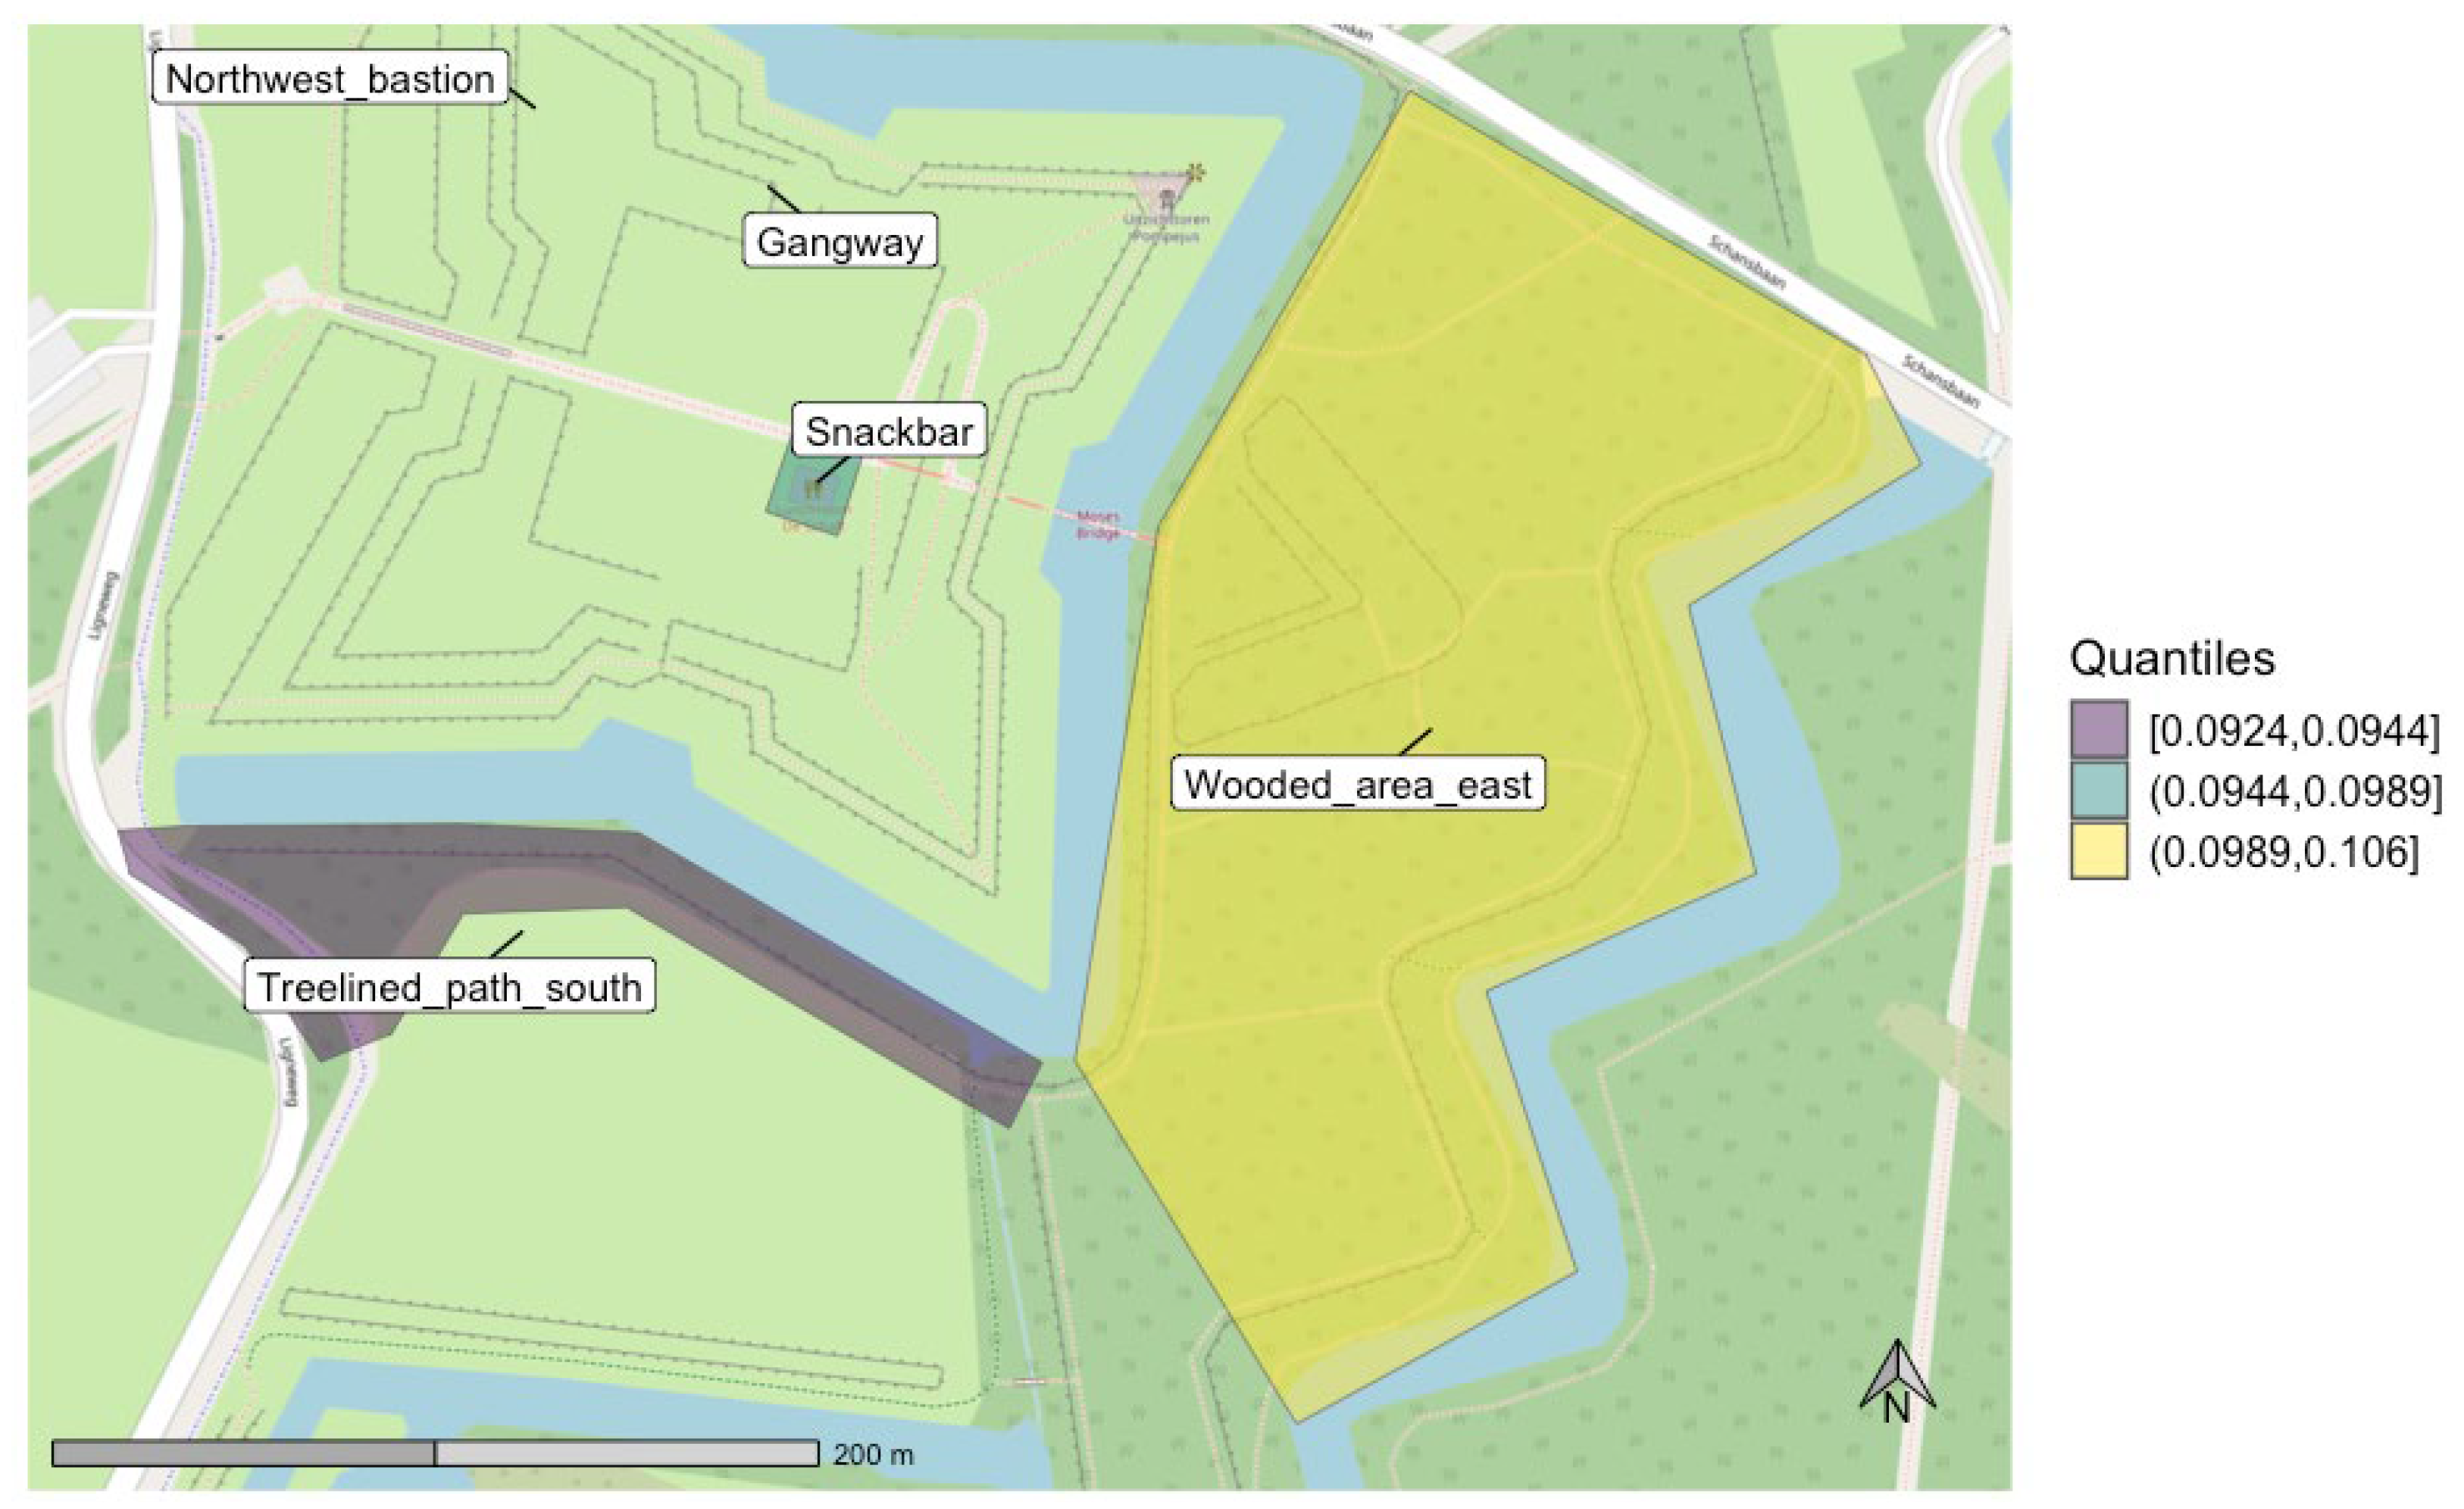
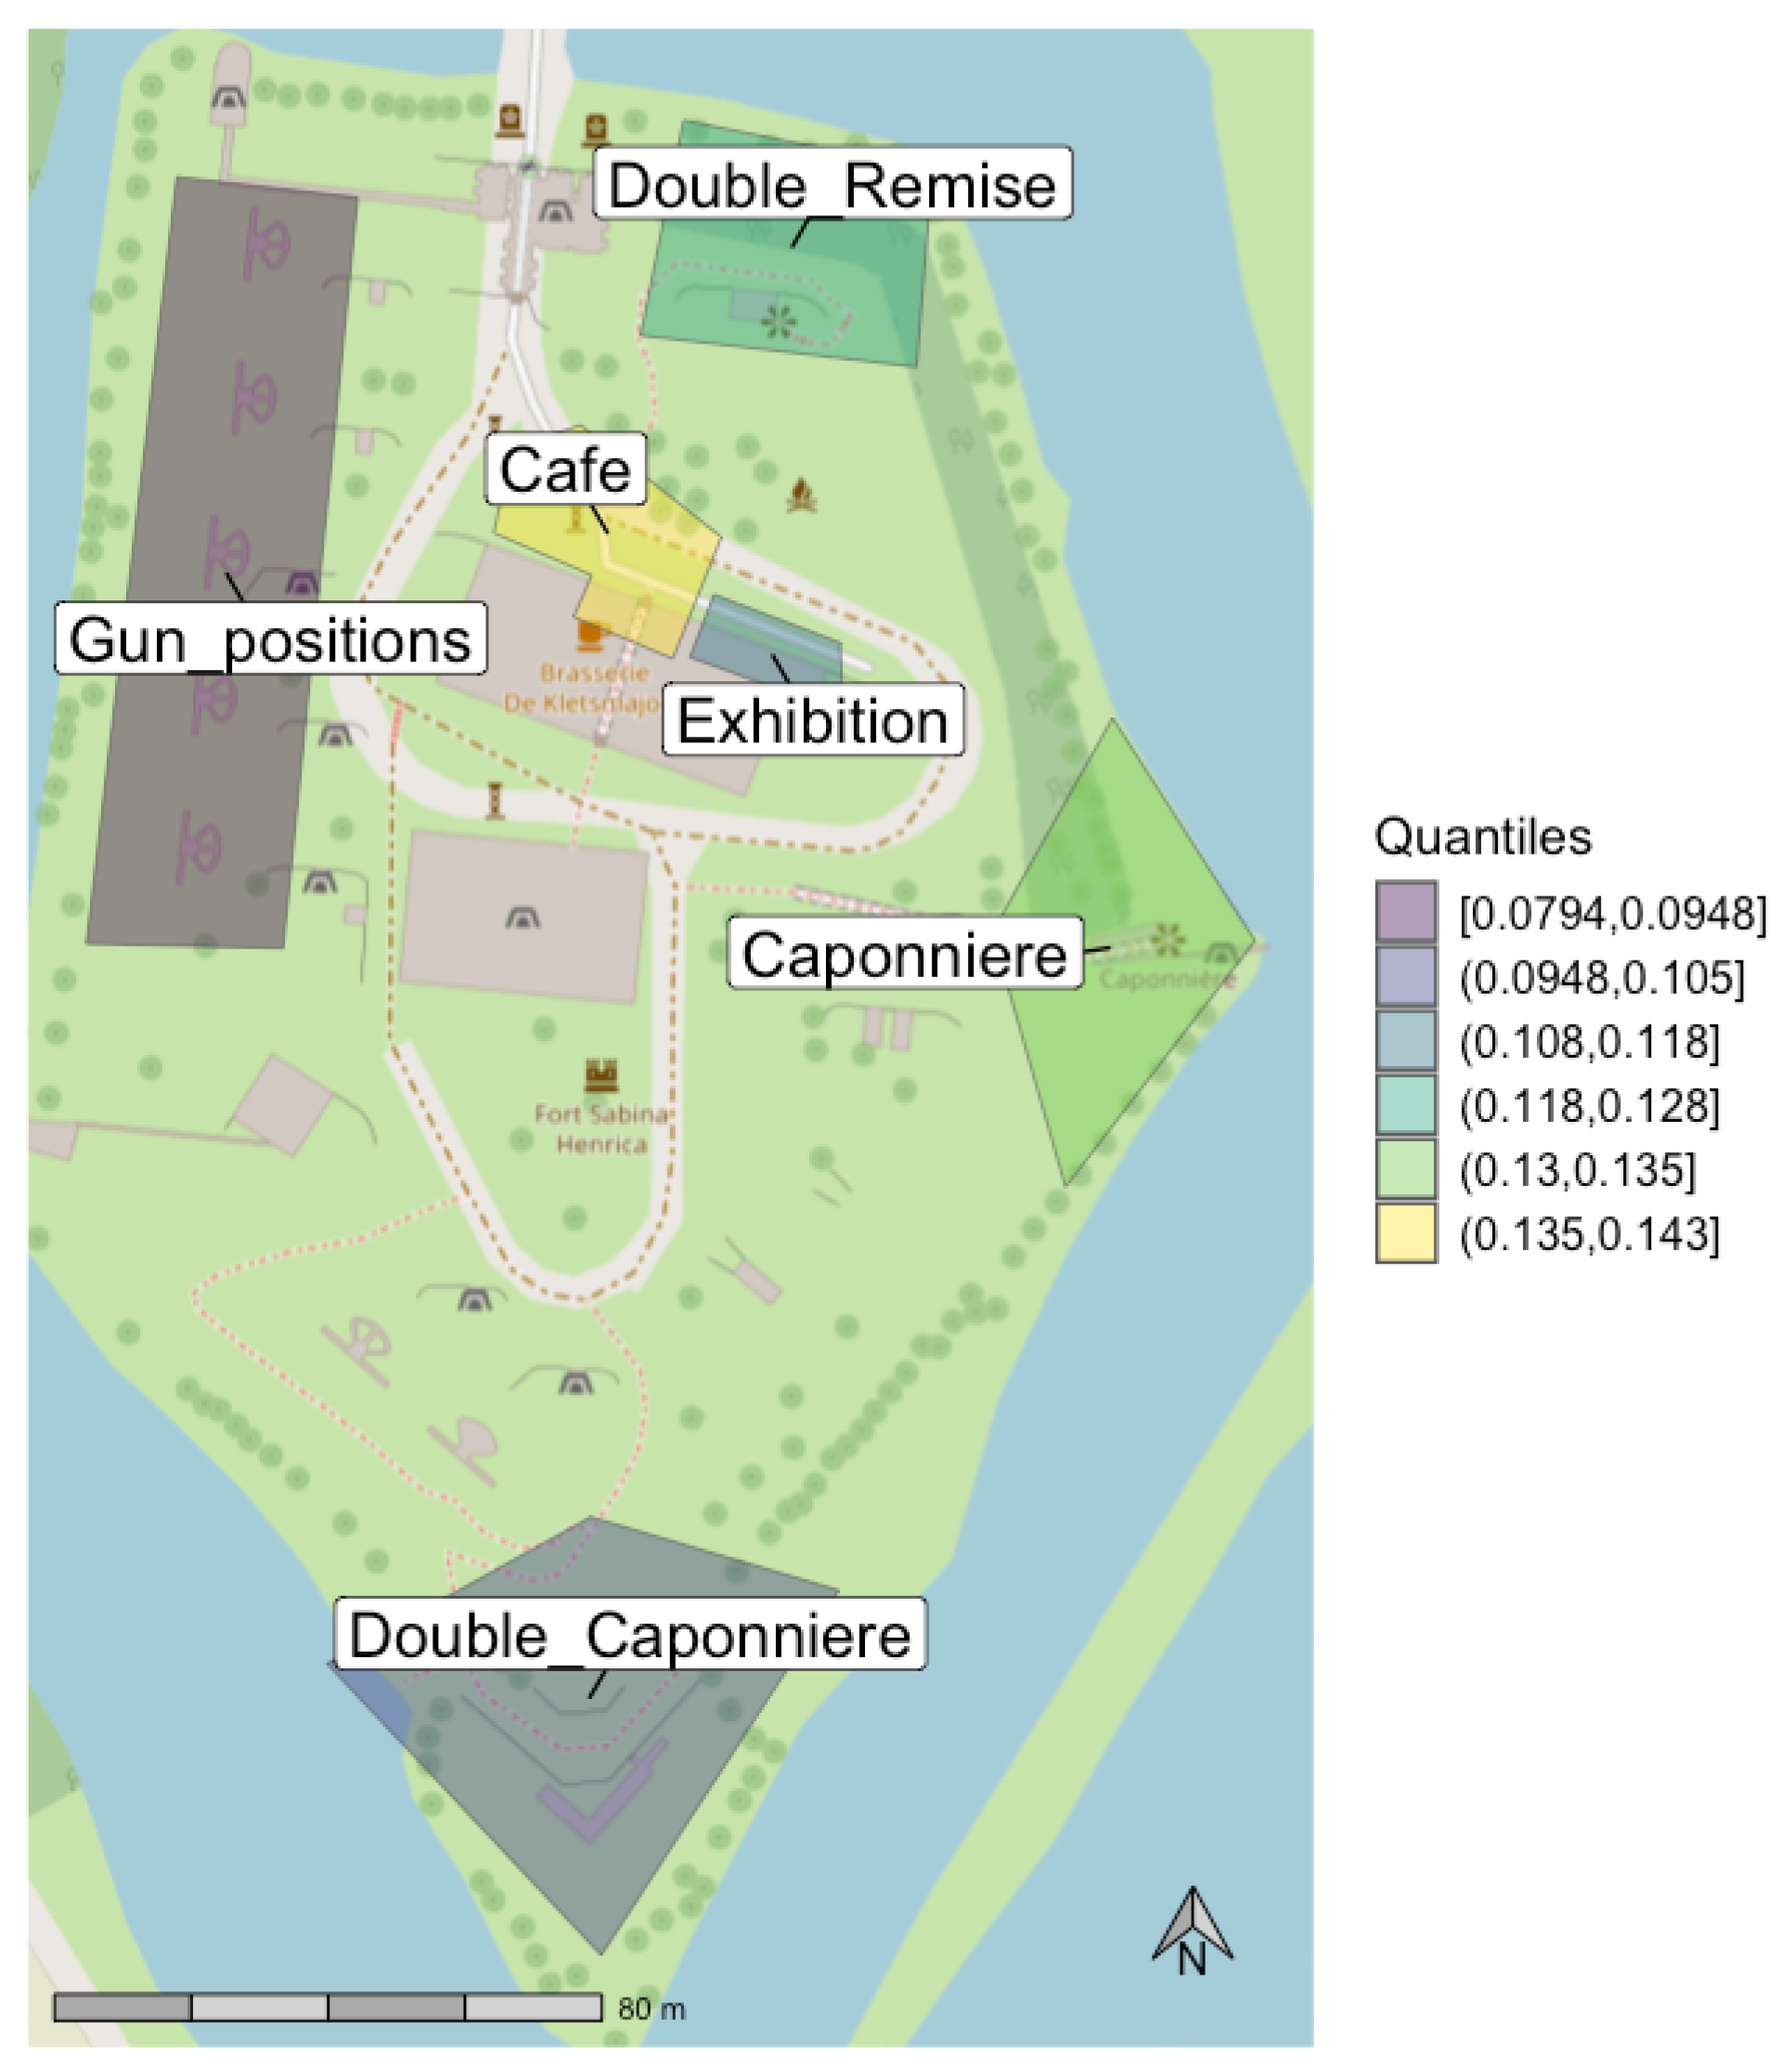
Figure 14) and by AOI polygon (
Figure 15 and
Figure 16). At Fort Sabina, the hexagon map showed relatively high arousal over the entire café area, extending to the barracks and exhibition space, and over the northern wall, where visitors can climb to a scenic overlook. There was also relatively high arousal at the entrance of the fort and the ‘caponniere’ (east) and ‘double caponniere’ (south) bastions. When averaging skin conductance over AOI polygons, the east caponniere remained relatively high, while the southern double caponniere averaged relatively low. Also, average arousal at the café was the highest of all AOI, while the adjacent exhibition area was relatively low.
At Fort de Roovere, the emotion physiology map showed relatively low arousal in the center of the fort and on the eastern, wooded side of the moat, while further east, deeper in the wooded area, arousal was high. Arousal was also relatively high along the road to the west of the fort, and, as expected, at the lookout tower. Only three of the AOI polygons featured more than five visitors: the entire wooded area, to the east of the fort, where arousal was high; the snack bar in the center, where arousal was moderate; and the tree-lined road to the south, where arousal was low.
4.2.3. Emotion Effectiveness Maps
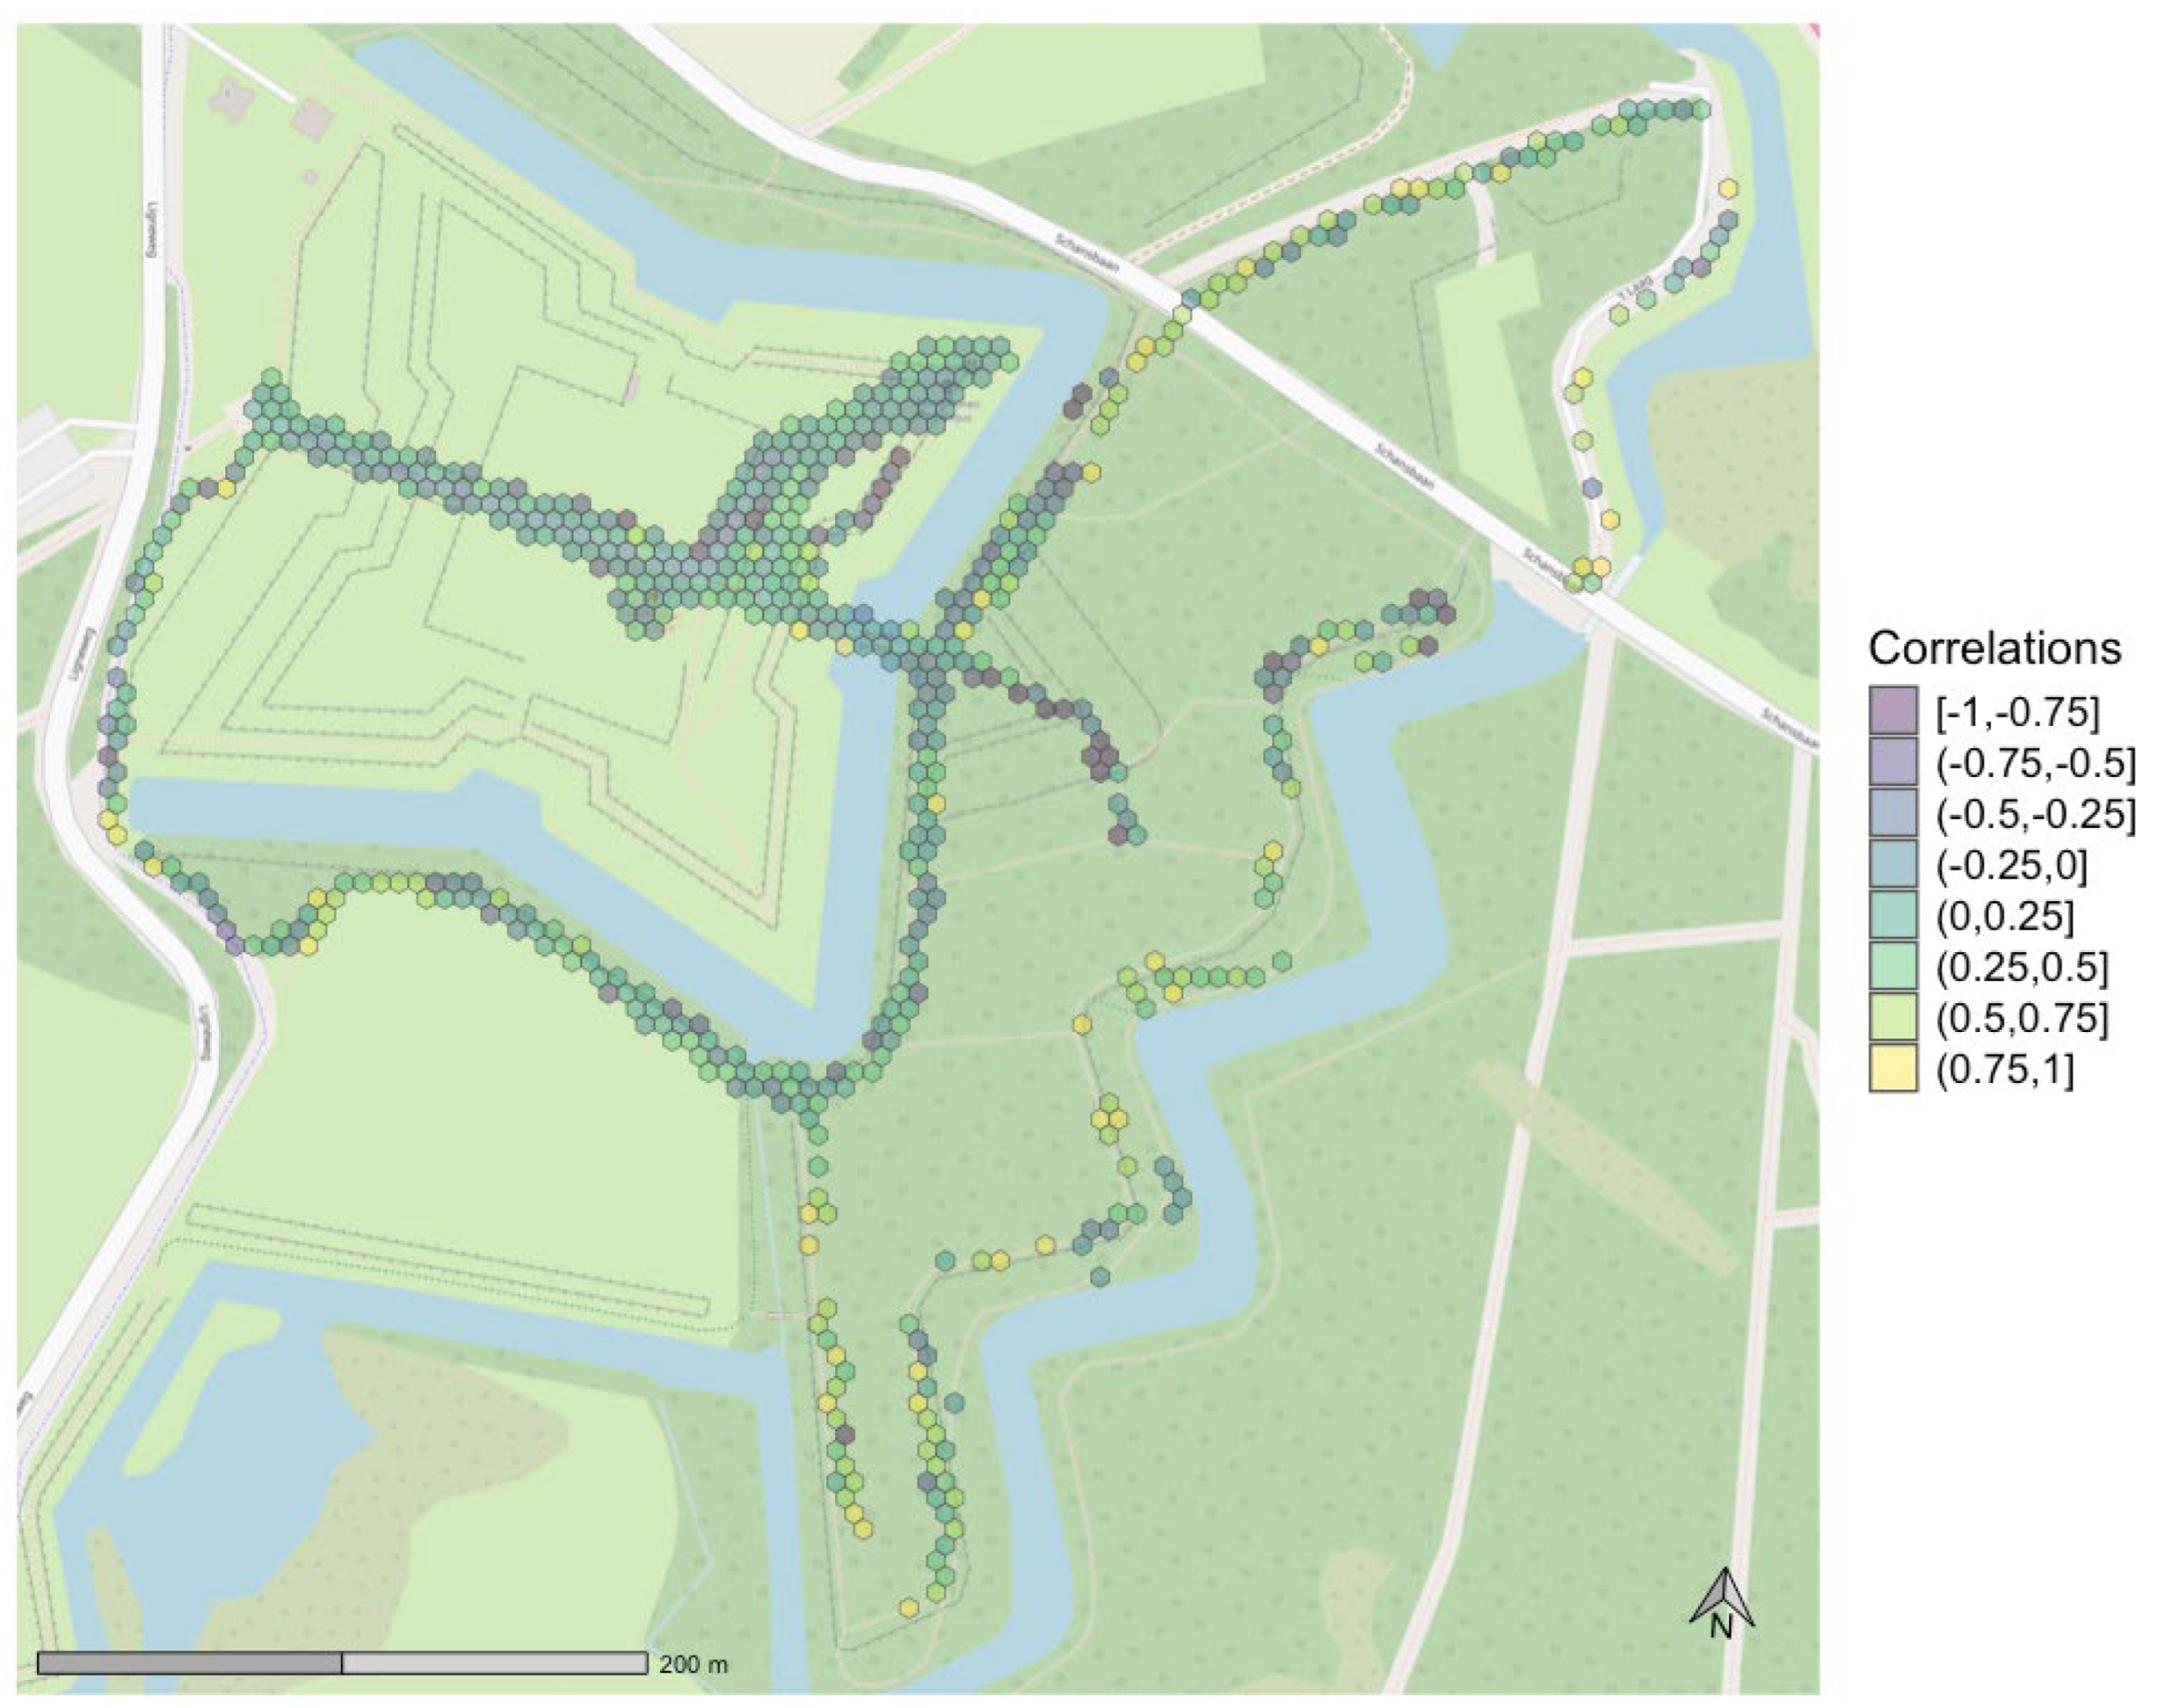
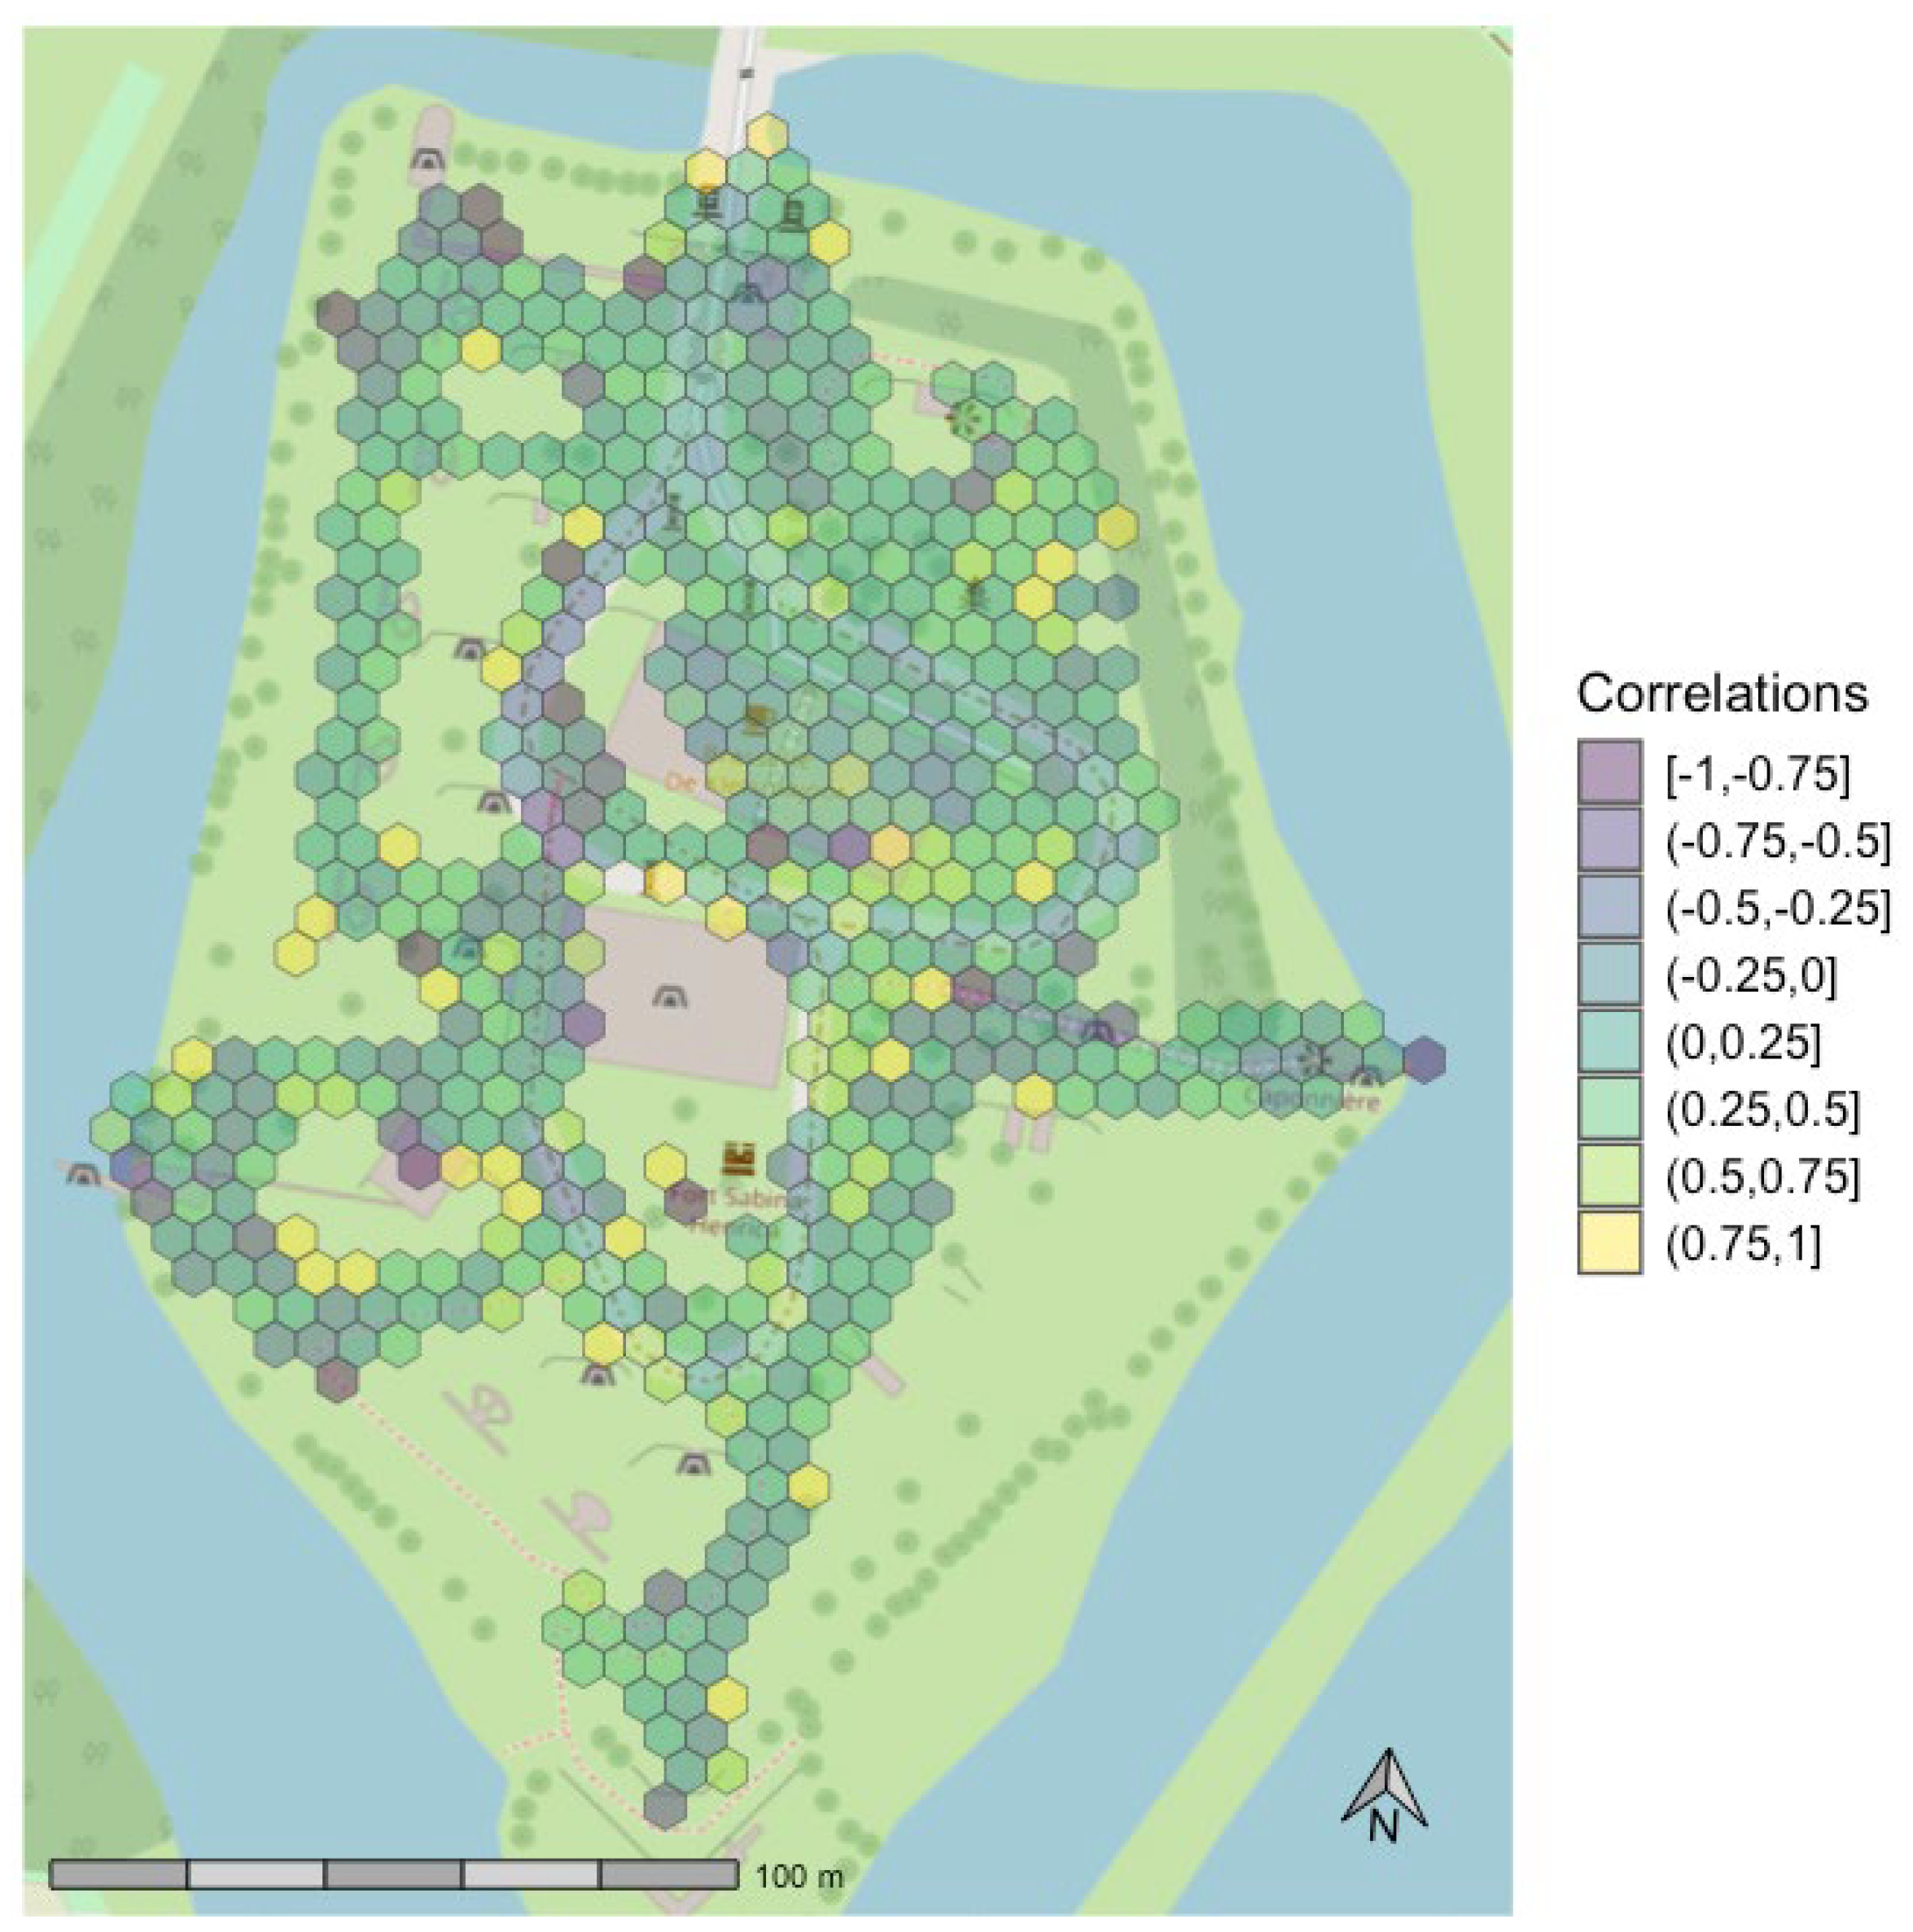
Emotion effectiveness maps show between-participant correlations between localized skin conductance and overall positive emotions. Correlations were calculated within 6 m hexagons (
Figure 17 and
Figure 18) and AOI polygons (
Figure 19 and
Figure 20). For Fort Sabina, the hexagon and AOI maps point toward somewhat different conclusions. The hexagon map suggests that the south of the barracks and the grassy north-eastern wall feature the highest associations between overall positive emotion and localized arousal. That is, participants with more arousal
in these places felt more positive
about their overall visit afterward. The eastern caponniere, the northwest corner of the fort wall, and the western section of the barracks show negative correlations. All AOI’s show positive correlations between arousal and positive emotion besides the southern double caponniere. The most positive correlation, as well as the highest self-reported valence and the highest physiological arousal, corresponded to the café terrace.
At Fort de Roovere, the emotion effectiveness map based on hexbins showed areas with positive effectiveness in some wooded paths, especially to the southwest, southeast, and northeast of the fort. In contrast, the path directly to the east of the fort showed negative effectiveness, as did most of the fort’s open central area. When calculated over AOI polygons, the snack bar had negative effectiveness, while the wooded area to the east was positive as a whole, and the tree-lined path to the south was highly positive.
4.3. Statistical Validation
The first set of validation models encapsulated the differences in log-transformed, standardized phasic skin conductance between each area of interest and the rest of the fort area (
Table 1 and
Table 2). For Fort Sabina, this model showed the double remise and café to be the most arousing, and the exhibition terrace and gun positions to be the least arousing, while for Fort de Roovere, this model showed the tree-lined path south of the fort to be the most arousing, while the wooded area to the east was the least arousing. As models of localized skin conductance, these findings aimed at within-participant change in emotional arousal over the area of the fort. As such, they are comparable to the experience reconstruction map for arousal, and the emotion physiology map. A comparison in rank order of areas of interest, from most arousing to least arousing, showed that the validation model, experience reconstruction map, and emotion physiology map arrive at largely different rank ordering of AOIs from most to least arousing (
Table 3). However, there were more similarities between the emotion physiology map and the validation model, which were also based on the same data, than between the experience reconstruction map and the validation model.
The second set of validation models extended the first by allowing self-reported positive emotion to change from the baseline to interact with each AOI predictor (
Table 4 and
Table 5). Thus, these models showed in which areas higher skin conductance was associated with a more positive overall experience. For Fort Sabina, this model showed the café and exhibition terrace as the most positive, and the double remise and double capponiere as most negative, while for Fort de Roovere, this model showed the snack bar to be relatively positive while the tree-lined path on the southern side of the fort is relatively negative. These models are arguably comparable with the experience reconstruction map for valence, and with the emotion effectiveness map. A comparison in rank order of areas of interest, from most arousing to least arousing, showed substantial differences in rank order, to the extent that a researcher or manager would come to different conclusions from these findings (
Table 6).
5. Discussion
We mapped emotional data collected during two events at green forts in the Netherlands using three mapping approaches: experience reconstruction maps, emotion physiology maps, and emotion effectiveness maps. We aimed to evaluate emotion mapping approaches in terms of their strengths and limitations and validate them against accepted statistical models for spatial experience data. While technologies such as wearable physiological recording and GPS tracking can create new possibilities, they can also carry unique limitations. We found that each of the mapping techniques we researched was useful, though in different situations. Thus, we extended emotion mapping research, as most previous works used one (e.g.,
Shoval et al., 2018) or at most two (e.g.,
Mitas et al., 2020) of these mapping approaches. We extended the state of knowledge in three ways: (1) we extended constructed emotion theory to the spatial analysis of emotion, demonstrating that physiological and recalled self-reported components of spatial emotion variation are distinct; (2) we refuted assumptions on the validity of valence mapping, arguing for continued innovation; and (3) we showed that accounting for within-individual autocorrelation changes the interpretation of findings, a challenge to the validity of emotion maps produced to date.
5.1. Multidimensionality of Constructed Emotion
Different approaches to emotion mapping resulted in widely differing conclusions in our study. A map of arousal based on experience reconstruction differed from a map of arousal based on skin conductance responses. Taking all arousal data across both forts, there was little consistency between self-report and physiological measures of arousal, not even when comparing event-adapted AOI to others. For valence, a map based on experience reconstruction differed from a map of correlations between localized skin conductance responses and overall self-reported emotions. Furthermore, as for arousal, there was no discernible pattern in valence across the AOI. Which AOI or type of AOI (restaurant vs. built area vs. natural area) participants experienced as most ‘positive’ was almost completely dependent on the metric or mapping method used. Other studies comparing self-report and skin conductance in tourism and event contexts yielded similar findings (
Strijbosch et al., 2021).
Differences between emotion physiology and self-report leant support to constructed emotion theory (
Barrett, 2017). Emotions are multidimensional by definition (
Rosenberg, 1998) and physiology triggers, but is not identical to, the subjective experience of emotion (
Cacioppo et al., 2007;
Mauss & Robinson, 2009). Constructed emotion theory asserted that physiological arousal preceded any conscious mental experiences of emotion; the latter occurred after interoception of physiological arousal triggered mental models for specific emotions (
Barrett, 2017). Extending this theory to emotion change over location, and to the context of tourism, we asserted that maps based on physiology and maps based on self-report visualize distinct emotion dimensions. Thus, if future research aimed to generalize patterns of emotional response to location features, multiple locations need to be measured with a single, carefully chosen emotion metric. Interpretations of findings should be limited to the dimension of emotion represented by the chosen metric.
Between physiology and self-report, there is no ‘gold standard’ (
Mauss & Robinson, 2009). Skin conductance was a valid metric of a single emotion dimension, namely physiological arousal (
Boucsein, 2012;
Cacioppo et al., 2007). Our emotion physiology maps showed that combining skin conductance and GPS data streams allowed for a precise map of emotional arousal across locations. Such a map is unidimensional, however. Previous research has validated skin conductance responses to arousing stimuli (
Braithwaite et al., 2015), the independence of skin conductance from bodily responses to temperature and movement (
Benedek & Kaernbach, 2010), and plausible skin conductance responses in tourism contexts (
Bastiaansen et al., 2022). Keeping in mind memory and recall errors inherent to experience reconstruction, we argued that skin conductance maps can be useful to illustrate exact locations and occasions of emotional arousal as they visit a tourism event setting.
5.2. A Valence Map?
Emotion dimensions including valence and action tendency (
Fredrickson, 1998) were lacking in maps of physiological arousal. Thus, emotion physiology maps were not useful when researchers would like to know in what way participants became emotional. Clear connections between skin conductance and emotion valence did not exist, either in theory (
Braithwaite et al., 2015) or in empirical data (
Kreibig, 2010). Valence and arousal were distinct (
Russell, 1978). In fact, a ‘gold standard’ to measure emotional valence as it unfolded from moment to moment did not exist. Experience reconstruction may produce memory errors and recall bias, while correlations between localized skin conductance and recalled self-reported valence only included a single report of valence per participant across all locations. Hence, they were characterized as emotion effectiveness maps (
Mitas et al., 2020) rather than valence maps, strictly speaking.
As such, emotion effectiveness maps integrated additional emotional information by visualizing where higher arousal was associated with a more emotionally positive experience. While each of the forts showed distinct areas of robust positive correlations, these were not consistent between the two events. While at Fort Sabina, the bustling central café terrace had the most positive emotion effectiveness, at Fort de Roovere, quiet wooded paths had the most positive emotion effectiveness. These differences may be attributable to different populations of visitors or differences between the events at each fort. While our emotion effectiveness map showed correlations between physiological arousal and self-reported valence, previous studies visualized correlations with experience evaluations instead (
Mitas et al., 2020). Thus, we improved on previous emotion effectiveness maps by using two dimensions of emotion—physiological arousal and self-reported valence—in one map. The result was more coherent than a map of momentary arousal and subsequent evaluation, which is a consequence
of emotion rather than inherent
to emotion.
Nevertheless, the lack of congruence between emotion effectiveness maps and experience reconstruction maps solidified the distinction between physiological and recall-based self-report dimensions of emotion (
Barrett, 2017;
Kahneman, 2011). These limitations constrained current approaches to mapping valence. As a result, the evidence base for a demonstrably valid valence-mapping method has remained incomplete. Simply put, the possibilities for mapping valence we carried out did not converge, and there was no robustly validated standard to compare them with. Future studies should examine the potential of experience sampling as a possible method, including controls for disrupting participant attention within their experiences.
5.3. The Influence of Within-Individual Autocorrelation
The maps suggested different conclusions than the validation models, with the latter being a truer representation of within-participant development due to the use of a random intercept (
Hox et al., 2017). Concretely, to understand which locations an average participant found more emotionally intense or positive, it was necessary to control for the fact that each participant produces (many) multiple data points, which were expected to correlate with one another more closely than two arbitrary data points from two different participants. Known as autocorrelation, none of the maps included statistical controls for this effect, nor did maps in the previous research (
Mitas et al., 2020;
Nold, 2009;
Pánek & Benediktsson, 2017;
Shoval et al., 2018). The fact that the maps yielded a different ranking than validation models that accounted for autocorrelation may indicate potential validity or interpretation concerns for prior emotion-mapping approaches.
The difference between neglecting and controlling for autocorrelation was consistent with existing knowledge of emotions, which held that people have trait-level differences in how intensely or positively they tended to react (
McCrae & John, 1992;
Rosenberg, 1998). At event sites like forts, where participants may include or omit various locations, a location that appeared emotionally intense may make the average participant more aroused or may attract more trait-level emotionally responsive visitors. This ambiguity severely limited the validity and usefulness of the emotion mapping methods shown in this and previous studies.
Therefore, we urge the development of new data aggregation techniques which account for within-pariticipant autocorrelation as a necessary condition for continued emotion mapping. An example could be AOI-level mapping of regression coefficients from multilevel models such as our validation models. While such a map would not be spatially detailed or continuous, it would portray the average emotion change within an average participant more honestly and, we argue, lead to more useful conclusions for event managers.
5.4. Caveats
Researchers often present emotion maps assuming that something about the locations shown can trigger emotions in participants. In other words, the location allegedly has stimuli which can spark emotion, such as buildings, overlooks, or crowds (
Bastiaansen et al., 2019). This was a reasonable assumption when sample sizes were large (>50). As we have demonstrated, accounting for within-individual autocorrelation improved the validity of analysis even further. Even then, however, the assumption that any specific location feature caused an emotional response was rather generous. A highly emotional street corner, for example, could be related to the sight of a parade taking place in the street, but also to a crowd of pedestrians emerging from a subway. Thus, it is important to keep in mind that emotion maps visualized the average emotions experienced in a location, not the average emotion triggered by a specific stimulus. Wearable eye tracking technology could address this limitation, and several unobtrusive headsets for mobile eye tracking are now available. These can record both participants’ field of view and the specific direction of their gaze. While still expensive in terms of devices, software, and time, wearable eye tracking could empower researchers to link emotional responses to specific stimuli.
A second crucial limitation was inherent in our choice to study events at green forts in the Netherlands. While this was a suitable research context for a methodologically focused comparison of mapping methods, it made it difficult to make concrete recommendations toward management. The reason for this limitation was that the forts did not contain sharp boundaries between temporary attractions erected only for events and permanent features for visitors within and outside of event contexts. To some extent, the events we studied included multi-sensory stimuli, such as a higher concentration of visitors and live music, which could not be precisely localized. While we focused on static, localized event features such as exhibits in our interpretation, spatially diffuse event components such as crowding and music undoubtedly affected visitor emotions as well. A more complex analysis, based on distances of each point rather than mere location, would be needed to (partly) estimate these effects. It is also important to note that many built features of the forts were erected in an entrepreneurial spirit, often to coincide with events, yet retained if there was sufficient positive feedback from visitors or political support for their maintenance.
6. Conclusions
The present study records and visualizes event experiences at two green fort sites. The management of these sites for public access is essential for planning events which highlight natural ecosystems as well as cultural heritage. Thus, management information about what visitors actually experience across an event site is potentially invaluable. Applying constructed emotion theory to understanding experience, we undertook a methodological study of different emotion mapping techniques. We have asked to what extent different emotion maps produced similar conclusions, and to what extent these conclusions overlapped with statistical models that accounted for within-individual autocorrelation. We have found that maps differed greatly from one another and from the statistical validation models. Consistent with constructed emotion theory, we suggest that differences are due to distinct physiological and recalled or reconstructed emotion components. Furthermore, while skin conductance responses comprise a valid, map-ready measurement of emotional arousal, there is no such verifiable and trustworthy method to create a map of valence. Currently available methods, as tested in the present article, fail to converge on similar results. Accordingly, these methods are best presented with careful clarification of what they concretely portray. Without appropriate caveats, labels such as a ‘happiness map’ of emotional valence may be interpreted more strongly than warranted.
The limitations of current methods and burgeoning wearable and location-tracking technology create fertile grounds for future research. While a physiological ‘signature’ for emotion valence is extremely implausible (
Barrett, 2017;
Kreibig, 2010), future studies could combine physiological measurement of arousal with innovative self-report or behavior measures, such as experience sampling or participant photography. While these approaches have been available for decades, the technology to geofence them—that is, to trigger questions or prompts based on locations—has only recently spread. Furthermore, the possibilities in quantitative coding of qualitative data increase by the day with machine learning and artificial intelligence methods, yet have hardly ever been employed for experience measurement (for an exception, see
Strijbosch et al., 2019). We encourage researchers to take up these possibilities under the strictest possible validation and triangulation approaches, supporting not only better management but unlocking new insights into people’s experience of tourism events.
Author Contributions
Conceptualization, O.M., P.W., J.F., B.W. and A.K.; methodology, O.M. and J.F.; software, O.M.; validation, O.M., P.W. and A.K.; formal analysis, O.M.; data curation, O.M. and T.S.; writing—original draft preparation, O.M. and T.S.; writing—review and editing, P.W., J.F., B.W. and A.K.; visualization, O.M.; supervision, O.M. and T.S.; project administration, O.M.; funding acquisition, O.M. All authors have read and agreed to the published version of the manuscript.
Funding
This research was funded by the Stichting Innovatie Alliantie of the Dutch Research Council, grant number MV.KIEM.01.019.
Institutional Review Board Statement
The study was conducted in accordance with the Declaration of Helsinki and approved by the Breda University of Applied Sciences Research Ethics Review Board under approval number BUas-RERB-25-03-ECEL (date of re-approval: 27 March 2025) and the Ethics Review Board of the Tilburg School of Social and Behavioural Sciences under approval number TSB_RP698 (date of approval: 2 November 2022).
Informed Consent Statement
Informed consent was obtained from all participants involved in the study.
Data Availability Statement
The raw data supporting the conclusions of this article will be made available by the authors on request.
Acknowledgments
We appreciate the input of Keri Schwab to the conceptualization of this research, Sait Durgun, Floor van den Bergh, Weronika Broda, Jona Broothaerts, Geert Coninx, Wim Debaene, Eric Goosen, Mike Hogeveen, Carolina Jordao, Anne-Wil Maris, Sander Mazeland, Chantall Spagnolo, and Nico Verwimp to the data collection, and Hans Revers to the data processing and analysis.
Conflicts of Interest
The authors declare no conflicts of interest.
Abbreviations
The following abbreviations are used in this manuscript:
References
- Baddeley, A. (2000). The episodic buffer: A new component of working memory? Trends in Cognitive Sciences, 4(11), 417–423. [Google Scholar] [CrossRef]
- Balmford, A., Green, J. M., Anderson, M., Beresford, J., Huang, C., Naidoo, R., Walpole, M., & Manica, A. (2015). Walk on the wild side: Estimating the global magnitude of visits to protected areas. PLoS Biology, 13(2), e1002074. [Google Scholar] [CrossRef]
- Barrett, L. F. (2017). How emotions are made: The secret life of the brain. Houghton Mifflin Harcourt. [Google Scholar]
- Bastiaansen, M., Lub, X., Mitas, O., Jung, T. H., Passos Acenção, M., Han, D., Moilanen, T., Smit, B., & Strijbosch, W. (2019). Emotions as core building blocks of an experience. International Journal of Contemporary Hospitality Management, 31, 651–668. [Google Scholar] [CrossRef]
- Bastiaansen, M., Oosterholt, M., Mitas, O., Han, D., & Lub, X. (2022). An emotional roller coaster: Electrophysiological evidence of emotional engagement during a roller-coaster ride with virtual reality add-on. Journal of Hospitality & Tourism Research, 46(1), 29–54. [Google Scholar]
- Bates, D., Mächler, M., Bolker, B., & Walker, S. (2015). Fitting linear mixed-effects models using lme4. Journal of Statistical Software, 67, 1–48. [Google Scholar] [CrossRef]
- Benedek, M., & Kaernbach, C. (2010). Decomposition of skin conductance data by means of nonnegative deconvolution. Psychophysiology, 47(4), 647–658. [Google Scholar] [CrossRef]
- Boucsein, W. (2012). Electrodermal activity. Springer. [Google Scholar]
- Braithwaite, J. J., Watson, D. G., Jones, R., & Rowe, M. (2015). A guide for analysing electrodermal activity (EDA) & skin conductance responses (SCRs) for psychological experiments. U. o. B. Behavioural Brain Sciences Centre. [Google Scholar]
- Brewer, W. F. (1987). Schemas versus mental models in human memory. In P. Morris (Ed.), Modelling cognition (pp. 187–197). John Wiley & Sons. [Google Scholar]
- Cacioppo, J. T., Tassinary, L. G., & Berntson, G. (2007). Handbook of psychophysiology. Cambridge University Press. [Google Scholar]
- Cziksentmihalyi, M. (1990). Flow: The psychology of optimal experience. Harper & Row. [Google Scholar]
- Cziksentmihalyi, M., & Larson, R. (1987). Validity and reliability of the experience-sampling method. The Journal of Nervous and Mental Disease, 175(9), 526–536. [Google Scholar] [CrossRef]
- Diener, E., Wirtz, D., Tov, W., Kim-Prieto, C., Choi, D.-W., Oishi, S., & Biswas-Diener, R. (2010). New well-being measures: Short scales to assess flourishing and positive and negative feelings. Social Indicators Research, 97(2), 143–156. [Google Scholar] [CrossRef]
- Ekman, P. (2007). Emotions revealed: Recognizing faces and feelings to improve communication and emotional life. Macmillan. [Google Scholar]
- Ellis, G. D., Jiang, J., Freeman, P. A., Lacanienta, A., & Jamal, T. (2020). Leisure as immediate conscious experience: Foundations, evaluation, and extension of the theory of structured experiences. Journal of Leisure Research, 51(5), 581–600. [Google Scholar] [CrossRef]
- Fan, Y., Ormsby, T., Wiringa, P., Liao, C.-F., & Wolfson, J. (2020). Visualizing transportation happiness in the Minneapolis-St. Paul region. Center for Transportation Studies, University of Minnesota. [Google Scholar]
- Fenton-O’Creevy, M., Lins, J. T., Vohra, S., Richards, D. W., Davies, G., & Schaaff, K. (2012). Emotion regulation and trader expertise: Heart rate variability on the trading floor. Journal of Neuroscience, Psychology, and Economics, 5(4), 227. [Google Scholar] [CrossRef]
- Fredman, P., & Tyrväinen, L. (2010). Frontiers in nature-based tourism. Scandinavian Journal of Hospitality and Tourism, 10(3), 177–189. [Google Scholar] [CrossRef]
- Fredrickson, B. L. (1998). What good are positive emotions? Review of General Psychology, 2(3), 300–319. [Google Scholar] [CrossRef]
- Getz, D. (2008). Event tourism: Definition, evolution, and research. Tourism Management, 29(3), 403–428. [Google Scholar] [CrossRef]
- Hox, J., Moerbeek, M., & Van de Schoot, R. (2017). Multilevel analysis: Techniques and applications. Routledge. [Google Scholar]
- i Agustí, D. P., Rutllant, J., & Fortea, J. L. (2019). Differences in the perception of urban space via mental maps and heart rate variation (HRV). Applied Geography, 112, 102084. [Google Scholar] [CrossRef]
- Kahneman, D. (2011). Thinking, fast and slow. Farrar, Straus and Giroux. [Google Scholar]
- Kahneman, D., Krueger, A. B., Schkade, D. A., Schwarz, N., & Stone, A. A. (2004). A survey method for characterizing daily life experience: The day reconstruction method. Science, 306(5702), 1776–1780. [Google Scholar] [CrossRef]
- Killingsworth, M. A., & Gilbert, D. T. (2010). A wandering mind is an unhappy mind. Science, 330(6006), 932. [Google Scholar] [CrossRef]
- Kim, J., & Fesenmaier, D. R. (2015). Measuring emotions in real time: Implications for tourism experience design. Journal of Travel Research, 54(4), 419–429. [Google Scholar] [CrossRef]
- Kirchberg, V., & Tröndle, M. (2015). The museum experience: Mapping the experience of fine art. Curator: The Museum Journal, 58(2), 169–193. [Google Scholar] [CrossRef]
- Kreibig, S. D. (2010). Autonomic nervous system activity in emotion: A review. Biological Psychology, 84(3), 394–421. [Google Scholar] [CrossRef]
- Larsen, R. J., & Fredrickson, B. L. (1999). Measurement issues in emotion research. Well-Being: The Foundations of Hedonic Psychology, 40, 60. [Google Scholar]
- Marín-Morales, J., Higuera-Trujillo, J. L., Greco, A., Guixeres, J., Llinares, C., Gentili, C., Scilingo, E. P., Alcañiz, M., & Valenza, G. (2019). Real vs. immersive-virtual emotional experience: Analysis of psycho-physiological patterns in a free exploration of an art museum. PLoS ONE, 14(10), e0223881. [Google Scholar] [CrossRef]
- Mateos, A. B., Leco, F., & Pérez, A. (2020). Visitors’ perception of the overcrowding of a protected natural area: A case applied to the natural reserve “garganta de los infiernos” (Caceres, Spain). Sustainability, 12(22), 9503. [Google Scholar] [CrossRef]
- Mauss, I. B., & Robinson, M. D. (2009). Measures of emotion: A review. Cognition & Emotion, 23(2), 209–237. [Google Scholar]
- McCrae, R. R., & John, O. P. (1992). An introduction to the five-factor model and its applications. Journal of Personality, 60(2), 175–215. [Google Scholar] [CrossRef] [PubMed]
- Meenar, M., Flamm, B., & Keenan, K. (2019). Mapping the emotional experience of travel to understand cycle-transit user behavior. Sustainability, 11(17), 4743. [Google Scholar] [CrossRef]
- Millar, G. C., Mitas, O., Boode, W., Hoeke, L., de Kruijf, J., Petrasova, A., & Mitasova, H. (2021). Space-time analytics of human physiology for urban planning. Computers, Environment and Urban Systems, 85, 101554. [Google Scholar] [CrossRef]
- Mitas, O., Bastiaansen, M., & Boode, W. (2022). If you’re happy, I’m happy: Emotion contagion at a tourist information center. In Planning and managing the experience economy in tourism (pp. 122–140). IGI Global. [Google Scholar]
- Mitas, O., Mitasova, H., Millar, G., Boode, W., Neveu, V., Hover, M., van den Eijnden, F., & Bastiaansen, M. (2020). More is not better: The emotional dynamics of an excellent experience. Journal of Hospitality & Tourism Research, 46(1), 78–99. [Google Scholar] [CrossRef]
- Mitas, O., Surla, T., Wielenga, B., Farkić, J., Ward, P., Kokkinou, A., & Thomas, S. (2025). Where is emotion? Comparing emotion mapping technologies. In A. Pucihar, M. Kljajić Borštnar, S. Blatnik, M. Marolt, R. W. H. Bons, K. Smit, & M. Glowatz (Eds.), 38th bled eConference: Empowering transformation: Shaping digital futures for all: Conference proceedings (pp. 67–84). University of Maribor Press. Available online: https://press.um.si/index.php/ump/catalog/book/947/chapter/590 (accessed on 7 September 2025).
- Moyle, B. D., Moyle, C.-l., Bec, A., & Scott, N. (2017). The next frontier in tourism emotion research. Current Issues in Tourism, 1–7. [Google Scholar] [CrossRef]
- Nenko, A., & Petrova, M. (2018). Emotional geography of St. Petersburg: Detecting emotional perception of the city space. In Digital transformation and global society. Springer. [Google Scholar]
- Nold, C. (2009). Introduction: Emotional geography technologies of the self. In C. Nold (Ed.), Emotional cartography: Technologies of the self. Space Studios. [Google Scholar]
- Panek, J. (2019). Emotional and subjective volunteered geographical information. In Crowdsourcing: Concepts, methodologies, tools, and applications (pp. 1347–1362). IGI Global. [Google Scholar]
- Pánek, J., & Benediktsson, K. (2017). Emotional mapping and its participatory potential: Opinions about cycling conditions in Reykjavík, Iceland. Cities, 61, 65–73. [Google Scholar] [CrossRef]
- Pearce, P. L., & Zare, S. (2017). The orchestra model as the basis for teaching tourism experience design. Journal of Hospitality and Tourism Management, 30, 55–64. [Google Scholar] [CrossRef]
- R Core Team. (2025). R: A language and environment for statistical computing. R Foundation for Statistical Computing. Available online: https://www.R-project.org/ (accessed on 24 October 2024).
- Rosenberg, E. L. (1998). Levels of analysis and the organization of affect. Review of General Psychology, 2(3), 247–270. [Google Scholar] [CrossRef]
- Russell, J. A. (1978). Evidence of convergent validity on the dimensions of affect. Journal of Personality and Social Psychology, 36(10), 1152. [Google Scholar] [CrossRef]
- Scott, N., & Le, D. (2017). Tourism experience: A review. In N. Scott, J. Gao, & J. Ma (Eds.), Visitor experience design (Vol. 5, p. 30). CABI. [Google Scholar]
- Shoval, N., & Isaacson, M. (2007). Tracking tourists in the digital age. Annals of Tourism Research, 34(1), 141–159. [Google Scholar] [CrossRef]
- Shoval, N., Schvimer, Y., & Tamir, M. (2018). Real-time measurement of tourists’ objective and subjective emotions in time and space. Journal of Travel Research, 57(1), 3–16. [Google Scholar] [CrossRef]
- Smith, J. W., Wilkins, E. J., & Leung, Y.-F. (2019). Attendance trends threaten future operations of America’s state park systems. Proceedings of the National Academy of Sciences, 116(26), 12775–12780. [Google Scholar] [CrossRef] [PubMed]
- Strijbosch, W. (2022). Experience Unpacked: On the Temporal Dynamics of Emotions in Tourism and Leisure Experiences [Ph.D. thesis, Tilburg University]. [Google Scholar]
- Strijbosch, W., Mitas, O., van Blaricum, T., Vugts, O., Govers, C., Hover, M., Gelissen, J., & Bastiaansen, M. (2021). When the parts of the sum are greater than the whole: Assessing the peak-and-end-theory for a heterogeneous, multi-episodic tourism experience. Journal of Destination Marketing & Management, 20, 100607. [Google Scholar] [CrossRef]
- Strijbosch, W., Mitas, O., van Gisbergen, M., Doicaru, M., Gelissen, J., & Bastiaansen, M. (2019). From experience to memory: On the robustness of the peak-and-end-rule for complex, heterogeneous experiences. Frontiers in Psychology, 10, 1705. [Google Scholar] [CrossRef]
- Tonetto, L. M., & Desmet, P. M. (2016). Why we love or hate our cars: A qualitative approach to the development of a quantitative user experience survey. Applied Ergonomics, 56, 68–74. [Google Scholar] [CrossRef]
- Winkielman, P., & Berridge, K. C. (2004). Unconscious emotion. Current Directions in Psychological Science, 13(3), 120–123. [Google Scholar] [CrossRef]
- Wirtz, D., Kruger, J., Scollon, C. N., & Diener, E. (2003). What to do on spring break? The role of predicted, on-line, and remembered experience in future choice. Psychological Science, 14(5), 520–524. [Google Scholar] [CrossRef] [PubMed]
- Zajchowski, C. A., Schwab, K. A., & Dustin, D. L. (2016). The experiencing self and the remembering self: Implications for leisure science. Leisure Sciences, 39(6), 561–568. [Google Scholar] [CrossRef]
Figure 3.
Fort de Roovere photo showing the entrance into the central square of the fort with snack bar; eastern wooded area in background.
Figure 3.
Fort de Roovere photo showing the entrance into the central square of the fort with snack bar; eastern wooded area in background.
Figure 4.
Fort Sabina, central courtyard with main (barrack) building.
Figure 4.
Fort Sabina, central courtyard with main (barrack) building.
Figure 5.
Shimmer GSR+ wristband.
Figure 5.
Shimmer GSR+ wristband.
Figure 6.
Example location question.
Figure 6.
Example location question.
Figure 7.
Fort de Roovere’s AOI polygons.
Figure 7.
Fort de Roovere’s AOI polygons.
Figure 8.
Fort Sabina’s AOI polygons.
Figure 8.
Fort Sabina’s AOI polygons.
Figure 9.
Valence self-reported map of Fort de Roovere.
Figure 9.
Valence self-reported map of Fort de Roovere.
Figure 10.
Valence self-reported map of Fort Sabina.
Figure 10.
Valence self-reported map of Fort Sabina.
Figure 11.
Arousal self-reported map of Fort de Roovere.
Figure 11.
Arousal self-reported map of Fort de Roovere.
Figure 12.
Arousal self-reported map of Fort Sabina.
Figure 12.
Arousal self-reported map of Fort Sabina.
Figure 13.
Six-meter hexbin skin conductance map of Fort de Roovere.
Figure 13.
Six-meter hexbin skin conductance map of Fort de Roovere.
Figure 14.
Six-meter hexbin skin conductance map of Fort Sabina.
Figure 14.
Six-meter hexbin skin conductance map of Fort Sabina.
Figure 15.
AOI polygon skin conductance map of Fort de Roovere.
Figure 15.
AOI polygon skin conductance map of Fort de Roovere.
Figure 16.
AOI polygon skin conductance map of Fort Sabina.
Figure 16.
AOI polygon skin conductance map of Fort Sabina.
Figure 17.
Six-meter hexbin emotion effectiveness map of Fort de Roovere.
Figure 17.
Six-meter hexbin emotion effectiveness map of Fort de Roovere.
Figure 18.
Six-meter hexbin emotion effectiveness map of Fort de Sabina.
Figure 18.
Six-meter hexbin emotion effectiveness map of Fort de Sabina.
Figure 19.
AOI polygon emotion effectiveness map of Fort de Roovere.
Figure 19.
AOI polygon emotion effectiveness map of Fort de Roovere.
Figure 20.
AOI polygon emotion effectiveness map of Fort Sabina.
Figure 20.
AOI polygon emotion effectiveness map of Fort Sabina.
Table 1.
Roovere validation model of emotion physiology.
Table 1.
Roovere validation model of emotion physiology.
| Predictors | Estimates | SE | T Statistic Estimate | p |
| (Intercept) | 0.1039 | 0.0074 | 14.0401 | <0.001 |
| Snack bar | −0.0108 | 0.0002 | −57.9488 | <0.001 |
| Wooded area east | −0.0168 | 0.0002 | −76.9611 | <0.001 |
| Tree-lined path south | −0.0120 | 0.0004 | −30.4020 | <0.001 |
| Random Effects |
| σ2 | 0.01 |
| τ00 participant | 0.00 |
| ICC | 0.16 |
| Nparticipant | 45 |
| Observations | 3,422,155 |
| Marginal R2/Conditional R2 | 0.003/0.162 |
| AIC | −5,170,899.025 |
Table 2.
Sabina validation model of emotion physiology.
Table 2.
Sabina validation model of emotion physiology.
| Predictors | Estimates | SE | T Statistic Estimate | p |
| (Intercept) | 0.1028 | 0.0079 | 13.0239 | <0.001 |
| Double remise | 0.0476 | 0.0005 | 91.7523 | <0.001 |
| Gun positions | −0.0215 | 0.0004 | −53.0097 | <0.001 |
| Double Caponniere | −0.0072 | 0.0004 | −18.2920 | <0.001 |
| Caponniere | 0.0101 | 0.0004 | 23.2651 | <0.001 |
| Café | 0.0179 | 0.0002 | 112.5409 | <0.001 |
| Exhibition | −0.0077 | 0.0003 | −30.3151 | <0.001 |
| Random Effects |
| σ2 | 0.01 |
| τ00 participant | 0.00 |
| ICC | 0.19 |
| Nparticipant | 56 |
| Observations | 3,818,870 |
| Marginal R2/Conditional R2 | 0.008/0.197 |
| AIC | −5,243,944.322 |
Table 3.
Rank order of AOI from most to least arousing.
Table 3.
Rank order of AOI from most to least arousing.
| Fort | Ordering | Experience Reconstruction Map (Arousal) | Emotion Physiology Map | Validation Model |
|---|
| Fort Sabina | Highest arousal | Exhibition | Café | Double remise |
| | | Double capponiere | Capponiere | Café |
| | | Café | Double remise | Capponiere |
| | | Capponiere | Exhibition | Double capponiere |
| | | Gun positions | Double capponiere | Exhibition |
| | Lowest arousal | Double remise | Gun positions | Gun positions |
| Fort de Roovere | Highest arousal | Snack bar | Snack bar | Tree-lined path south |
| | | Wooded area east | Tree-lined path south | Snack bar |
| | Lowest arousal | Tree-lined path south | Wooded area east | Wooded area east |
Table 4.
Roovere validation model for emotion effectiveness.
Table 4.
Roovere validation model for emotion effectiveness.
| Predictors | Estimates | SE | T Statistic | p |
| (Intercept) | 0.1106 | 0.0091 | 12.1045 | <0.001 |
| Snack bar | −0.0104 | 0.0002 | −45.0395 | <0.001 |
| Positive Emotion | −0.0071 | 0.0131 | −0.5368 | 0.591 |
| Wooded area east | −0.0263 | 0.0003 | −95.6128 | <0.001 |
| Tree-lined path south | −0.0035 | 0.0005 | −7.1072 | <0.001 |
| PosEmo × Snack bar | 0.0025 | 0.0003 | 7.9011 | <0.001 |
| PosEmo × Wooded area east | −0.0146 | 0.0004 | −35.9045 | <0.001 |
| PosEmo × Tree-lined path south | −0.0222 | 0.0006 | −35.6719 | <0.001 |
| Random Effects |
| σ2 | 0.01 |
| τ00 participant | 0.00 |
| ICC | 0.15 |
| Nparticipant | 35 |
| Observations | 2,683,359 |
| Marginal R2/Conditional R2 | 0.009/0.160 |
| AIC | −3,974,204.271 |
Table 5.
Sabina validation model for emotion effectiveness.
Table 5.
Sabina validation model for emotion effectiveness.
| Predictors | Estimates | SE | T Statistic | p |
| (Intercept) | 0.1102 | 0.0102 | 10.7590 | <0.001 |
| Double remise | 0.0424 | 0.0006 | 70.1636 | <0.001 |
| Positive Emotion | 0.0000 | 0.0142 | 0.0033 | 0.997 |
| Gun positions | −0.0222 | 0.0006 | −37.8266 | <0.001 |
| Double caponniere | −0.0104 | 0.0005 | −20.5752 | <0.001 |
| Caponniere | 0.0031 | 0.0005 | 6.0792 | <0.001 |
| Café | 0.0025 | 0.0002 | 12.5514 | <0.001 |
| Exhibition | −0.0117 | 0.0004 | −32.7824 | <0.001 |
| PosEmo × Double remise | 0.0073 | 0.0010 | 7.5505 | <0.001 |
| PosEmo × Gun positions | 0.0138 | 0.0008 | 16.2796 | <0.001 |
| PosEmo × Double caponniere | 0.0076 | 0.0007 | 10.9335 | <0.001 |
| PosEmo × Caponniere | 0.0206 | 0.0007 | 31.0681 | <0.001 |
| PosEmo × Café | 0.0411 | 0.0003 | 145.8353 | <0.001 |
| PosEmo × Exhibition | 0.0322 | 0.0005 | 59.4095 | <0.001 |
| Random Effects |
| σ2 | 0.01 |
| τ00 participant | 0.00 |
| ICC | 0.19 |
| Nparticipant | 39 |
| Observations | 2,810,219 |
| Marginal R2/Conditional R2 | 0.020/0.206 |
| AIC | −3,830,516.523 |
Table 6.
Rank order of AOI from most to least positive.
Table 6.
Rank order of AOI from most to least positive.
| Fort | Ordering | Experience Reconstruction Map (Valence) | Emotion Effectiveness Map | Validation Model |
|---|
| Fort Sabina | Most positive | Café | Café | Café |
| | | Double remise | Gun positions | Exhibition |
| | | Capponiere | Exhibition | Capponiere |
| | | Double capponiere | Double remise | Gun positions |
| | | Gun positions | Capponiere | Double capponiere |
| | Most negative | Exhibition | Double capponiere | Double remise |
| Fort de Roovere | Most positive | Wooded area east | Tree-lined path south | Snack bar |
| | | Snack bar | Wooded area east | Wooded area east |
| | Most negative | Tree-lined path south | Snack bar | Tree-lined path south |
| Disclaimer/Publisher’s Note: The statements, opinions and data contained in all publications are solely those of the individual author(s) and contributor(s) and not of MDPI and/or the editor(s). MDPI and/or the editor(s) disclaim responsibility for any injury to people or property resulting from any ideas, methods, instructions or products referred to in the content. |




 ,
,