1. Introduction
Research has shown that creating a unified vision of a tourist destination for potential tourists is one of the priority tasks for sustainable tourism development in a specific region. The sustainable development of tourism destinations is crucial for balancing the benefits and challenges of tourism. It ensures that tourism can continue to thrive without compromising the environmental, socio-cultural, and economic well-being of destinations, and research in this area helps to understand which mechanisms can contribute to digitalizing the sustainable development of tourism destinations in a non-stationary external environment (
Popova et al., 2023;
Sushchenko et al., 2021;
Rayevnyeva & Touzani, 2020;
Boiko et al., 2022) or contribute to innovative marketing technology implementation for tourism destination development (
Trunina et al., 2021;
Sushchenko et al., 2022;
Sushchenko & Aleksandrov, 2022;
Yermachenko et al., 2024;
Ozkan-Okay et al., 2024).
One aspect of this task is forming the visual component for tourism destination advertising campaigns. Eye-tracking technology is proposed to create content that truly interests potential tourists, rather than relying on the aesthetic tastes and preferences of the campaign developers. This involves forming a visual image of destinations by implementing visual content on informational websites, social media, and advertising products, selecting the most effective images in terms of fixation and interest from potential consumers.
This study investigates the potential of applying eye-tracking technology within the marketing framework of domestic tourism. The experimental results highlight the possibility of formalizing the selection of visual content based on the subconscious visual responses of the target audience, thus enabling the development of more evidence-based approaches to destination branding and promotion.
Eye-tracking technology includes several key indicators: fixations (time when eyes remain stationary on a particular point), saccades (rapid eye movements between different objects), pupil dilation (change in pupil size indicating the level of attention or interest), gaze trajectory (eye movements while scanning a visual scene), heatmaps (visual representation of the most fixed points), and attention maps (detailed analysis of gaze patterns). By analyzing these indicators, eye-tracking technology can provide valuable information about how people interact with visual stimuli, such as advertisements or websites, and help optimize their design for maximum effect. Analyzing fixation period statistics, movement speed, and distribution of visual attention conducted in eye-tracking studies allows understanding what participants focused on and why some elements were considered while others were not.
Eye-tracking technology is a valuable tool for analysis and data collection. This technology tracks eye movements when people interact with various visual stimuli such as advertisements or websites. By analyzing this data, insights can be gained into how consumers perceive and interact with advertising, optimizing campaigns for maximum effect. Eye-tracking is a psychophysiological method usually used to measure attention processes and has both advantages and disadvantages compared to other methods, such as self-report questionnaires, think-aloud protocols, and verbal interviews with respondents (
S. Li et al., 2016).
2. Review of Literature
Eye-tracking methods provide objective measurements of participants’ attention and interest, unlike self-report tools that rely on individual reflections and memory. Eye-tracking methods can measure both conscious and subconscious attention, whereas self-report tools for determining cognitive and attention processes are highly susceptible to exogenous influences. One of the key advantages of eye-tracking technology is its ability to detect subconscious reactions to advertising (
Phillips et al., 2014;
Lee et al., 2015). Consumers are unaware of where their attention is focused or which elements of an advertisement attract them the most (
MacInnis et al., 1991). By tracking eye movements, insights can be gained into which elements of an advertisement most effectively capture and hold consumers’ attention, even if these elements are not consciously noticed (
Schall & Bergstrom, 2014).
However, it is worth noting that, after the initial subconscious reaction, a person processes the information and may consciously reject the content. For example, in a study by Muñoz-Leiva F., Hernández-Méndez J., and Gómez-Carmona D., it was noted that most participants initially fixed their gaze on an advertising banner, but the overall fixation duration on the banner was significantly lower than on other areas of the site, such as posts and headlines. This suggests that users quickly surveyed the site structure and used their navigation experience to filter out banners from editorial content or avoid them during subsequent visits. Moreover, more than half of the respondents could not recall the brand or company from the banner (
Muñoz-Leiva et al., 2019).
Using this tool can reveal which areas of a webpage or mobile app users see most frequently, allowing for strategic placement of advertisements in those spots (
C.-Y. Wang et al., 2016). Additionally, eye-tracking can help understand how consumers interact with different formats and advertising designs, enabling informed decisions about the style and content of the ads (
Raudonis et al., 2013). Eye-tracking technology is a powerful tool that gives insights into how consumers perceive and interact with advertising, optimizing campaigns for maximum effect, ultimately increasing engagement, awareness, and sales.
The effectiveness of using eye-tracking technologies was vividly demonstrated by Bluhm J. and Berchtenbreiter R. in their research on a real project for a travel agency, specifically, the usability of its website. According to the experimental results, in the first task, 60% of users would not book any trip and, in the second task, 25% of test users could not successfully complete the booking process or received incorrect results. Therefore, due to a cumbersome and non-transparent booking system, the company could potentially lose a significant portion of customers, which was avoided by using eye-tracking analysis (
Bluhm & Berchtenbreiter, 2020).
Furthermore, another promising direction for tourism development is the application of eye-tracking to assess tourist interaction with virtual products, such as digital travel guides, when planning routes or using maps. Currently, eye-tracking is used to evaluate virtual scenes, especially in the context of virtual cultural heritage, such as museums, ancient architecture, and historical relics (
Gena et al., 2016).
According to research by Wang Y. and Sparks B.A, images that evoke strong arousal attract more fixed gazes and longer fixation durations. Nature images attract more attention and are held longer in the field of view. Moreover, the study showed differences in attention and scanning patterns between Australians and Chinese individuals (
Y. Wang & Sparks, 2014).
Extending this line of inquiry, Xu, Scott, and Gao employed eye-tracking technology to systematically compare how Chinese and Australian tourists visually engage with tourism advertising materials. Their findings demonstrated distinct cultural differences: Chinese tourists exhibited more systematic and detailed viewing patterns, whereas Australian tourists favored broader and faster scanning strategies. These results underscore the importance of accounting for cross-cultural variability when designing and evaluating visual marketing content, as visual engagement strategies optimized for one cultural group may not yield equivalent results across different audiences (
Xu et al., 2017).
Considering the results of this research, it can be assumed that the reaction to images from domestic and international tourists may differ, particularly because domestic tourists will inevitably recall their own experiences and find similar (or the same) tourist attractions. Therefore, research for domestic and international tourists should differ. This is indirectly confirmed by research by Li Q., Huang Z., and Christianson K. It was found that people spent more time viewing photos with text in a familiar language than photos with text in an unfamiliar language. Understanding cross-cultural differences in visual attention is critical for optimizing tourism marketing strategies. Eye-tracking technology offers an objective method to identify how audiences from diverse cultural backgrounds perceive and process visual stimuli, enabling data-driven adaptation of marketing content to maximize engagement and effectiveness across target markets. Additionally, respondents reported higher advertising effectiveness for photos containing text in a familiar language (
Q. Li et al., 2016).
As noted in a recent systematic review by Chen, eye-tracking research in hospitality and tourism has predominantly focused on advertisements, landscape perception, and tourists’ visual attention. Their findings reinforce the growing importance of understanding visual behavior for enhancing tourism marketing strategies and destination design, supporting the relevance of the current study’s approach (
Chen et al., 2025).
A review by Ma L. and Wang X. shows that 73.77% of eye-tracking studies in tourism focus on marketing, with limited research into landscape perception and sustainability. They emphasize the need to improve experimental designs, diversify samples beyond students, and combine eye-tracking with other methods for deeper behavioral insights (
Ma & Wang, 2024).
Overall, eye-tracking can help improve the design of objects and enhance user experience by testing reactions to new hotel layouts and wayfinding in public places and airports. Considering technological advancements, in the future, it will be possible to track our interaction with computer simulations in virtual reality, recording eye movements. From a management perspective, portable eye trackers can be useful for evaluating staff performance.
3. Materials and Methods
To evaluate and analyze the potential application of eye-tracking technology for the development of innovative tourism marketing tools and the improvement of informational resources for destination promotion, an experimental study was conducted. For this purpose, a dedicated website (tourism-ua.space, secured with an SSL certificate) was developed, containing all visual and textual materials used in the research. Visual content was sourced from Unsplash (under a free license) and open-access internet resources, with appropriate attribution, while additional elements were created using Adobe Photoshop. Eye-tracking data were collected via Gazerecorder, Realeye.io, and the open-source software Ogama 5.1. All screenshots, images, heatmaps, and visual stimuli analyzed and presented in this study were generated exclusively within the structure of the created website. It should be noted that the limited sample size constitutes a primary constraint of this study, potentially affecting the statistical power and generalizability of the results. For convenience and the ability to distinguish separate areas, the site was conditionally divided into five blocks: welcome block, map block, tours block, news block, and staff block.
This division was due to technical work aspects, firstly to track the reaction and depth of site exploration overall and to monitor interactions with different site elements. Secondly, it allowed for the blocks to be isolated as separate images and, if necessary, to study the reaction to these blocks separately from the entire site. Thirdly, it ensured homogeneity in the distribution of images. During analysis, it is important to remember that consumer preferences may influence gaze fixation. For more experienced tourists with extensive travel experience, fixation on certain images may last longer due to an emotional response and their empirical experience. Thus, such analysis can be applied to different groups of tourists with varying experiences and personal preferences in choosing tourist services. This opens broad opportunities for personalizing offers according to the requirements and experiences of future tourists, which makes sense when selecting visual content for planning advertising campaigns for different tourist groups.
Figure 1,
Figure 2,
Figure 3,
Figure 4 and
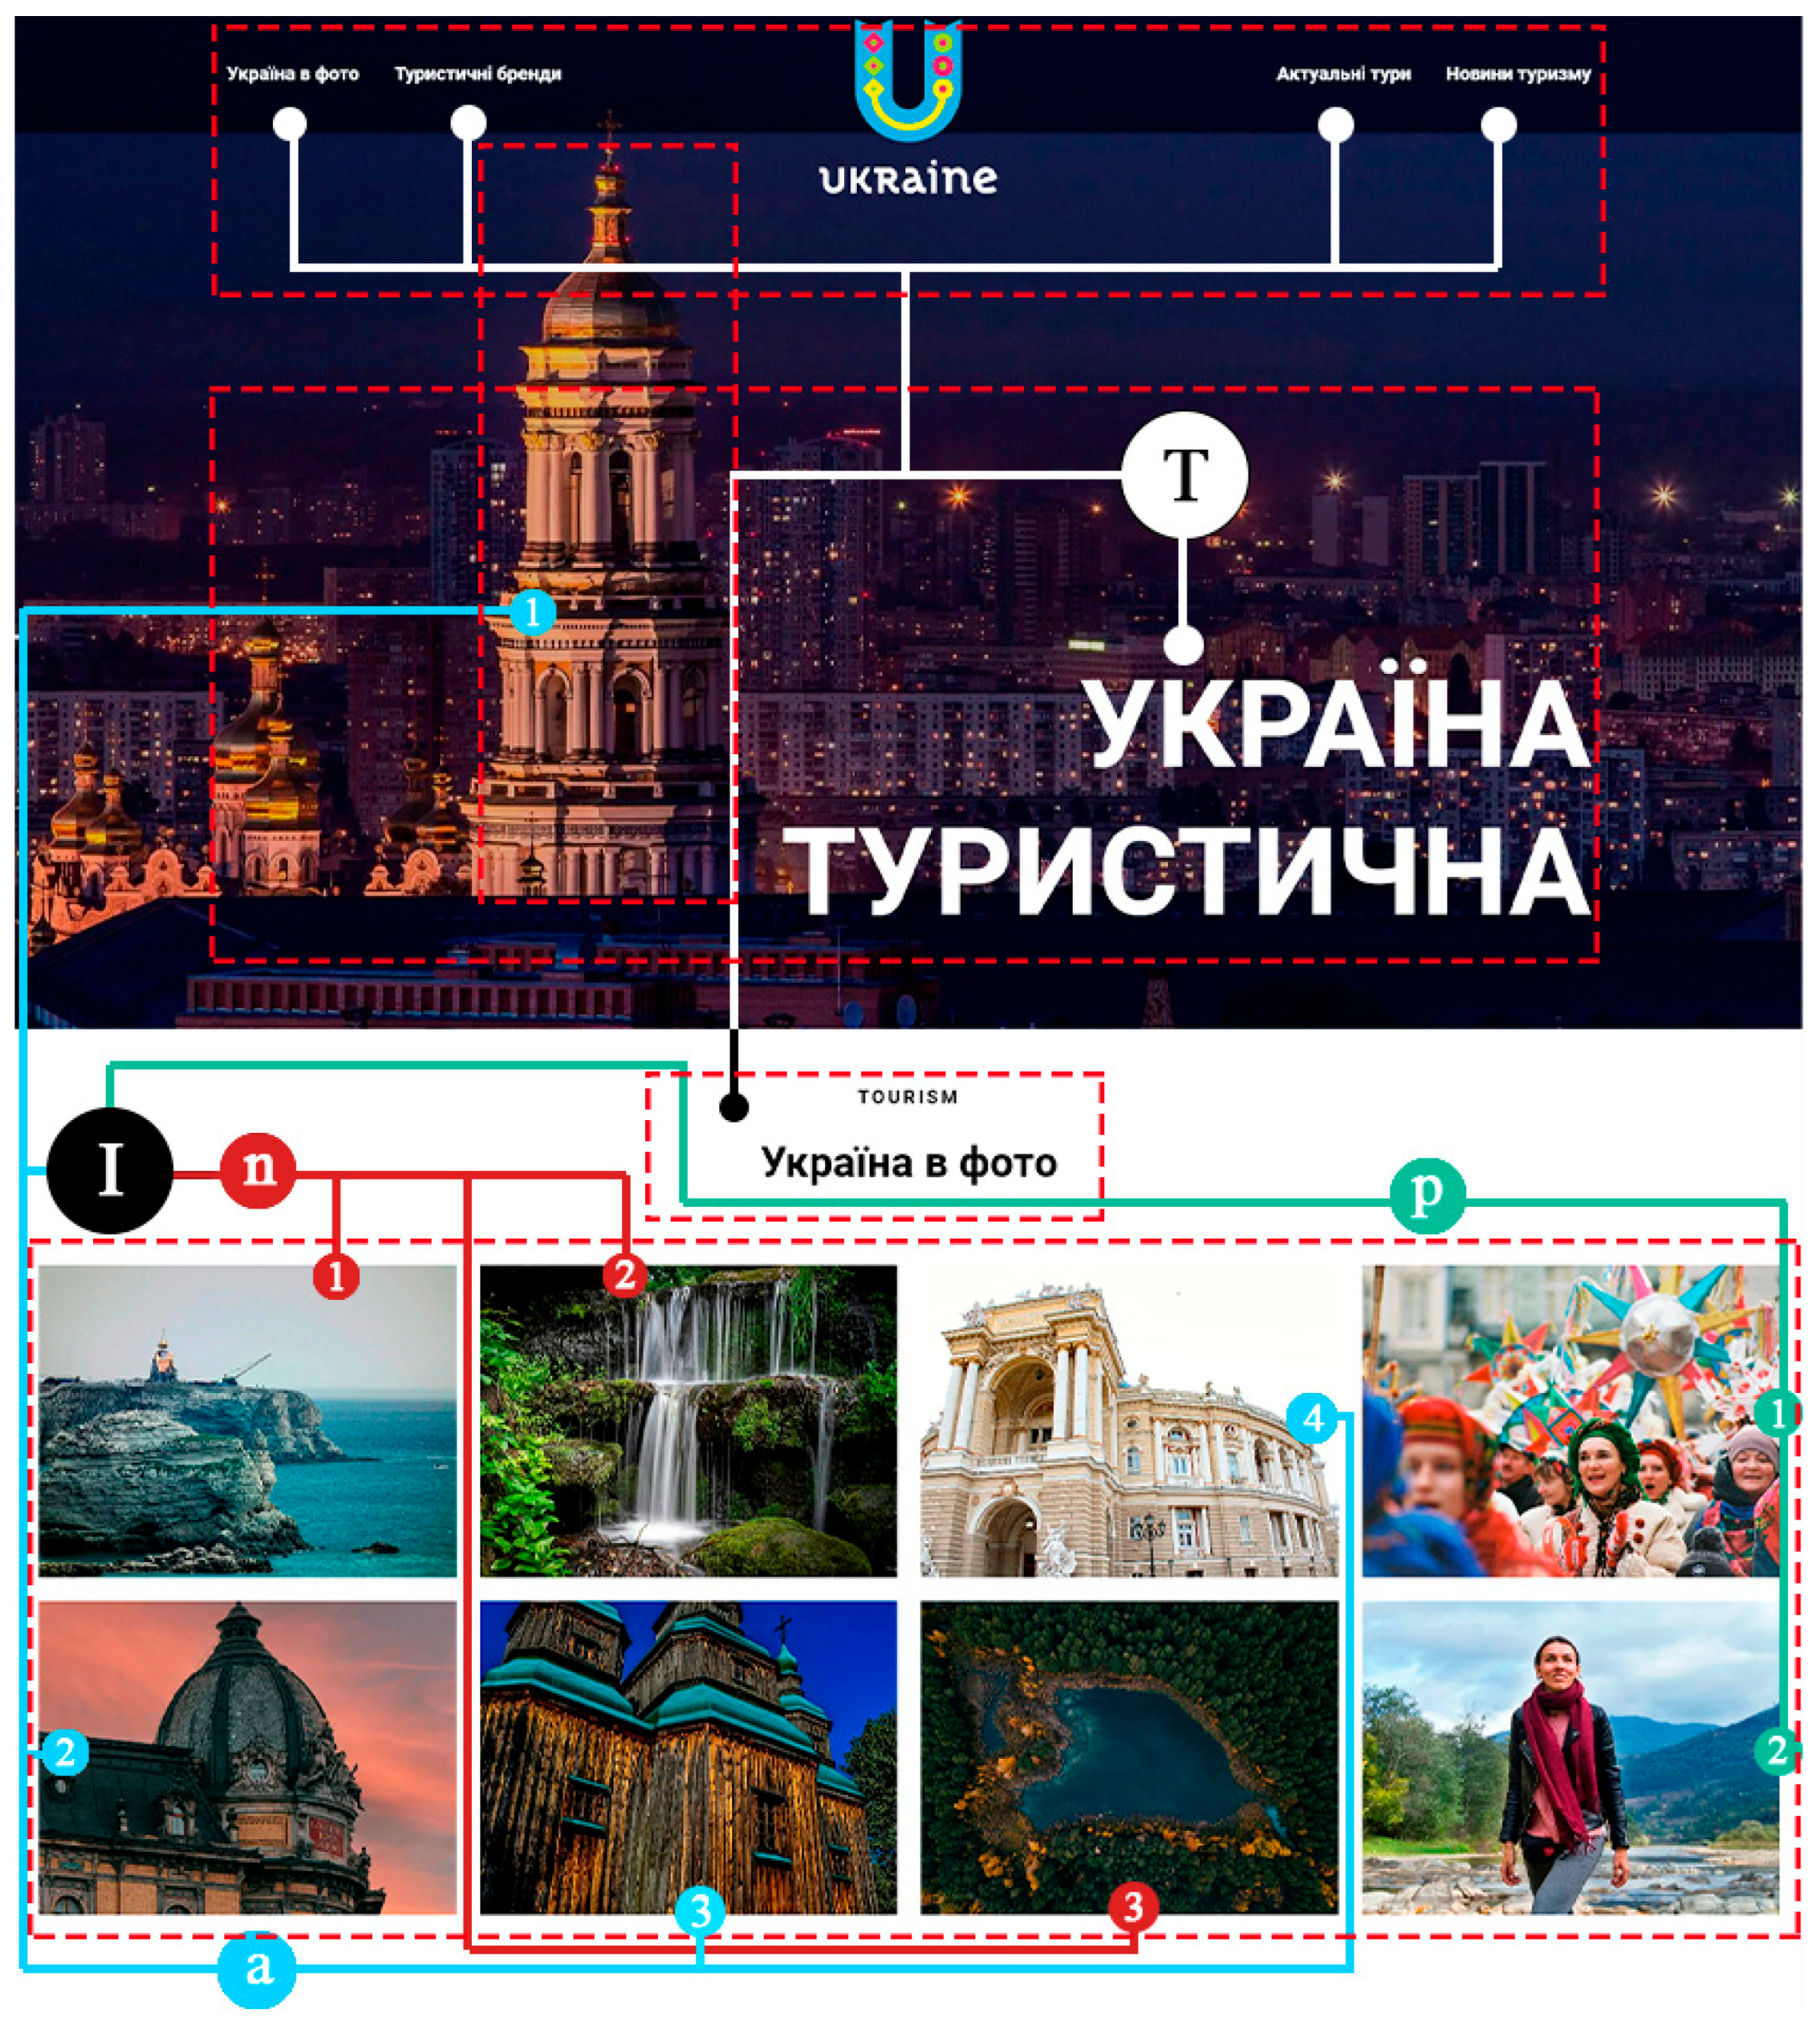
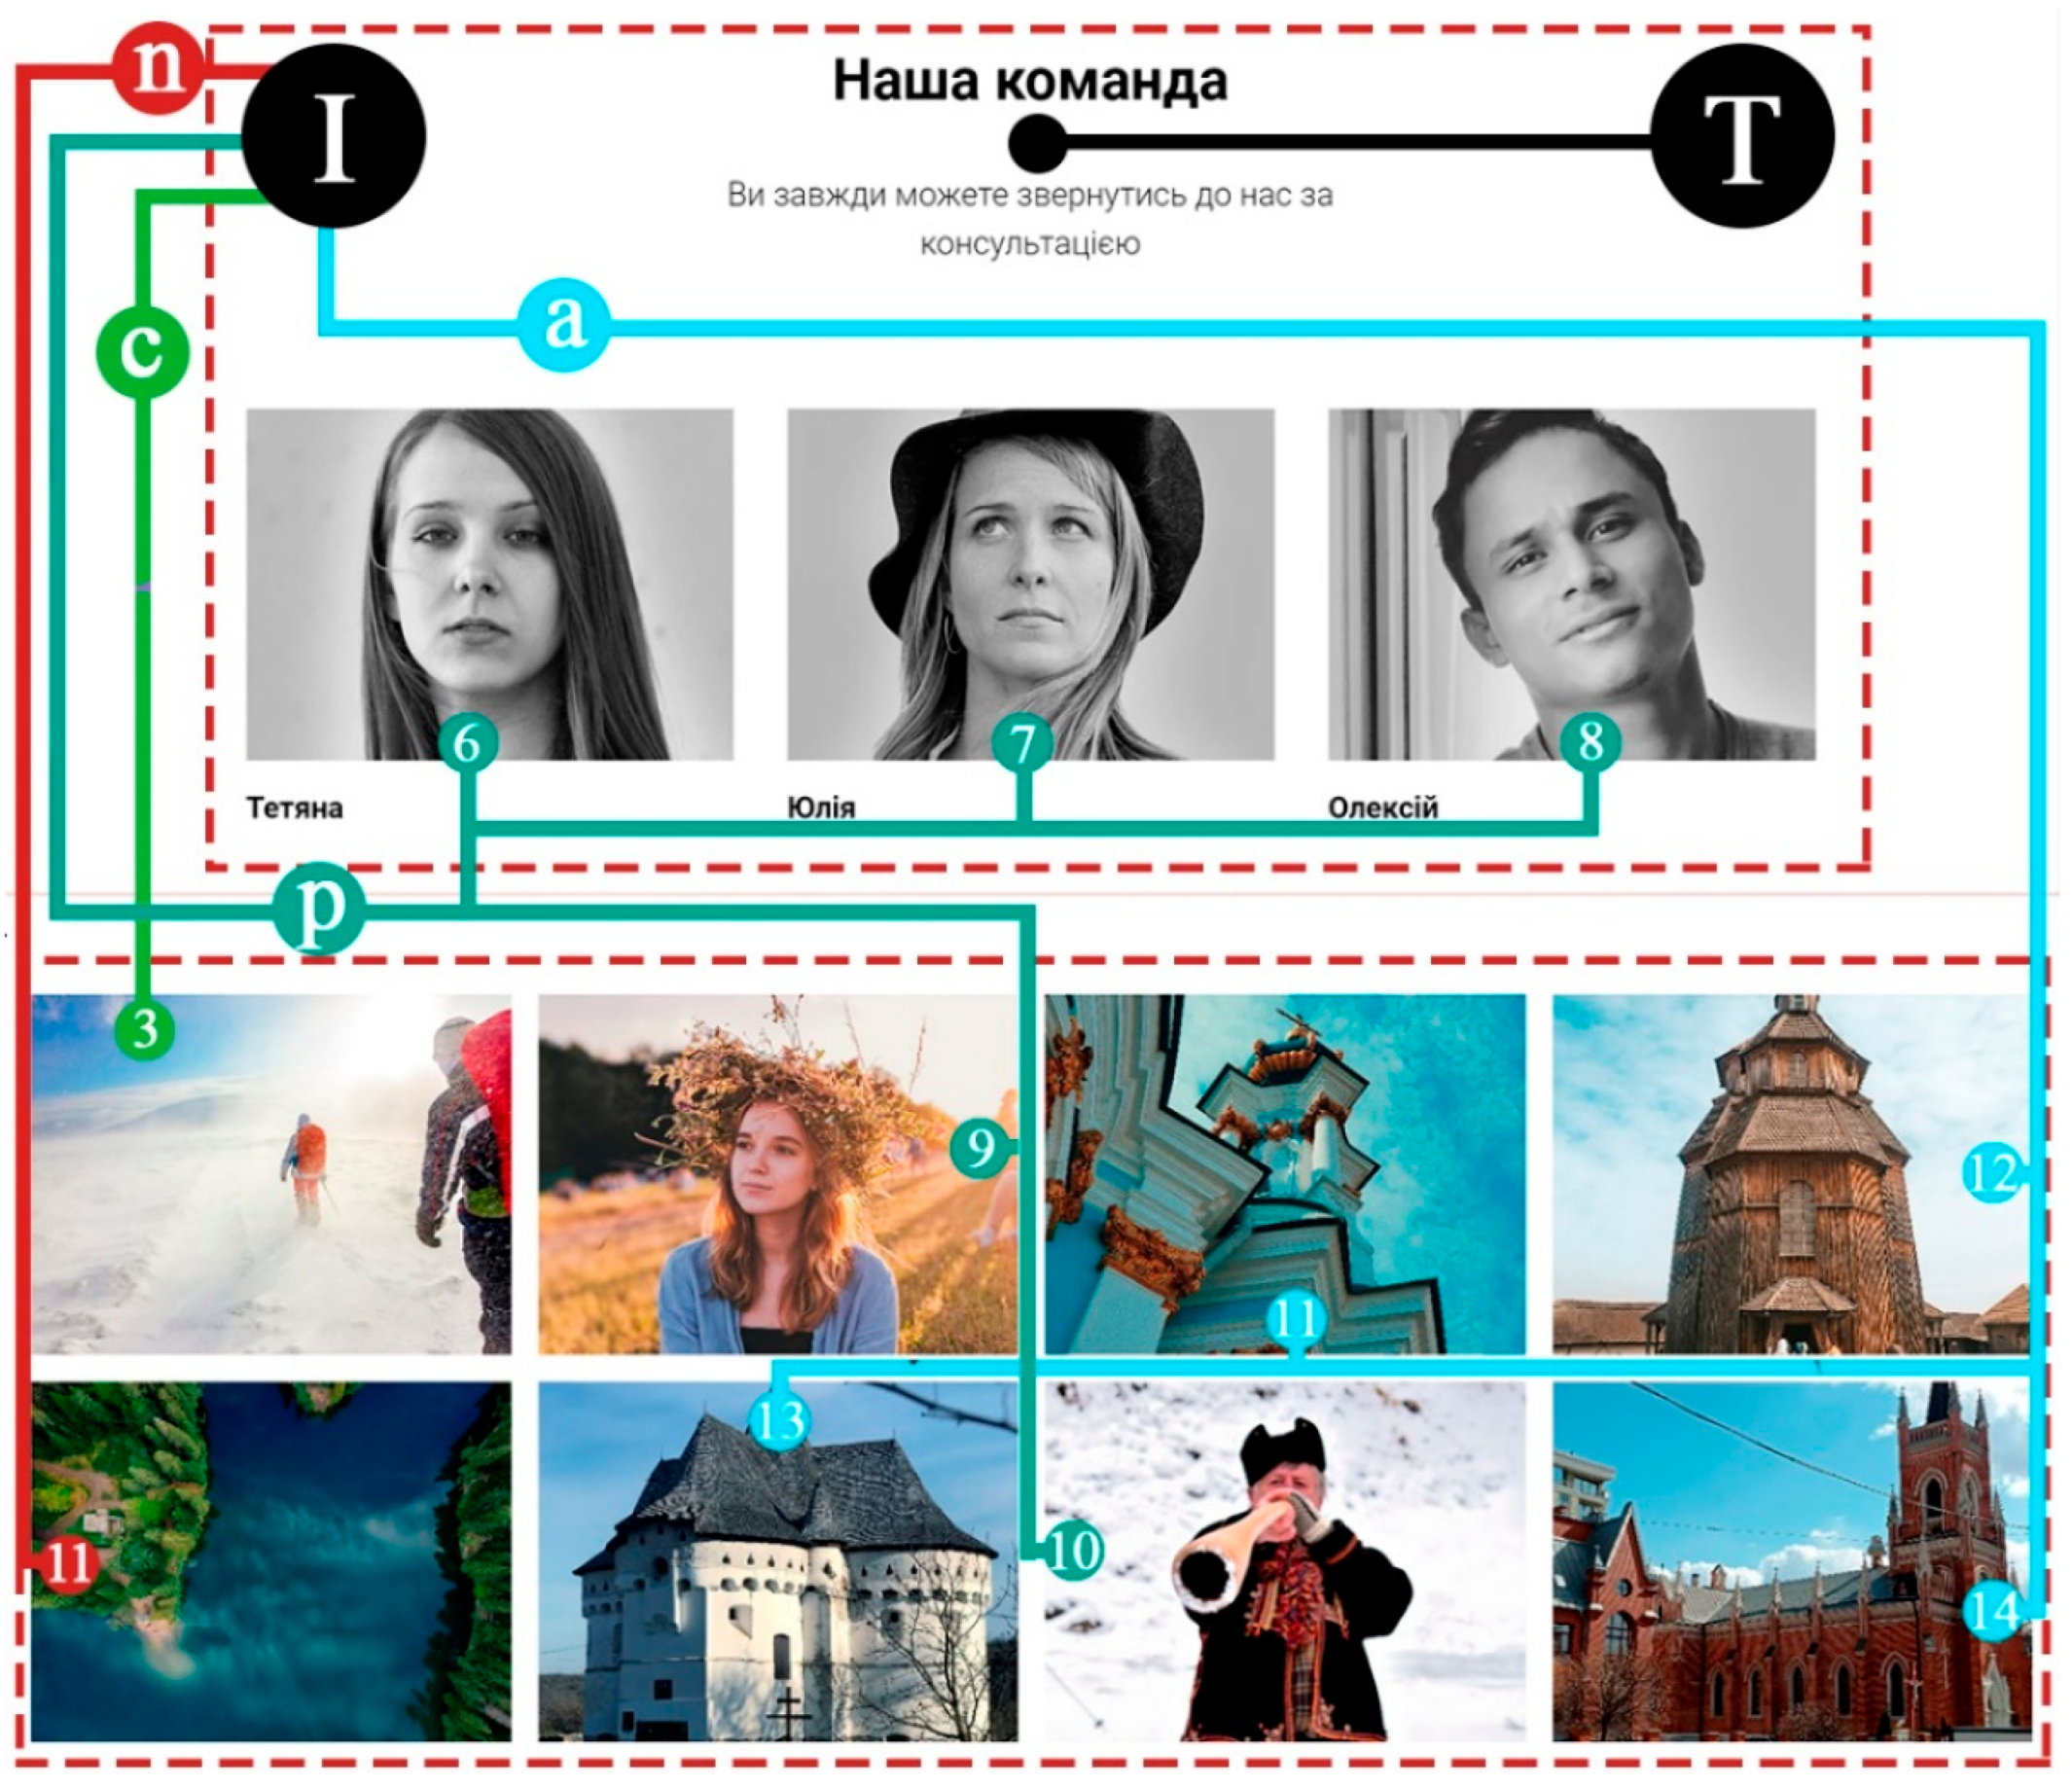
Figure 5 clearly demonstrate the distribution of content by type. This block system helps reduce error influence and compares equivalent objects for further analysis. The following types of objects were identified:
T—textual information
I—visual information—photos
In—nature images
Ia—images of architecture, buildings, cityscapes, and interiors
Ip—images of people
Ian—images of animals and birds
Ic—combination of the aforementioned types
S—schematic images, block diagrams, and maps
Visual information is distributed across all blocks but is more concentrated in the three conditional blocks with images, each containing three types of images: architecture, landscapes, and people. This distribution was necessary to track primary attention from a set of images.
All images presented in the following analysis were obtained as screenshots from the custom-developed experimental website, which exclusively featured Ukrainian destinations and attractions. Furthermore, to align the site with similar ones, 14 tours and excursions were developed, of which 12 were placed in the tours block and two in the map block. Each tour (service) card is clickable, and the filter area in the block functions to allow selection by location, price, and type. Tours and excursions are represented by 14 images, of which five fall into the nature category, three into the people category, and five into the architecture category, and two are combined images.
The site did not include images of interiors (except for one), Ukrainian cuisine dishes, mass events (as a subcategory of people images), etc., which might interest other groups of tourists. This limitation was intentionally implemented to focus on three main categories for a more extensive study due to resource constraints. Two large banners present the architecture category for a separate comparison of how gaze fixation on large banner images, which occupy a proportionally larger percentage of the display, differs from that on images presented in blocks with other categories.
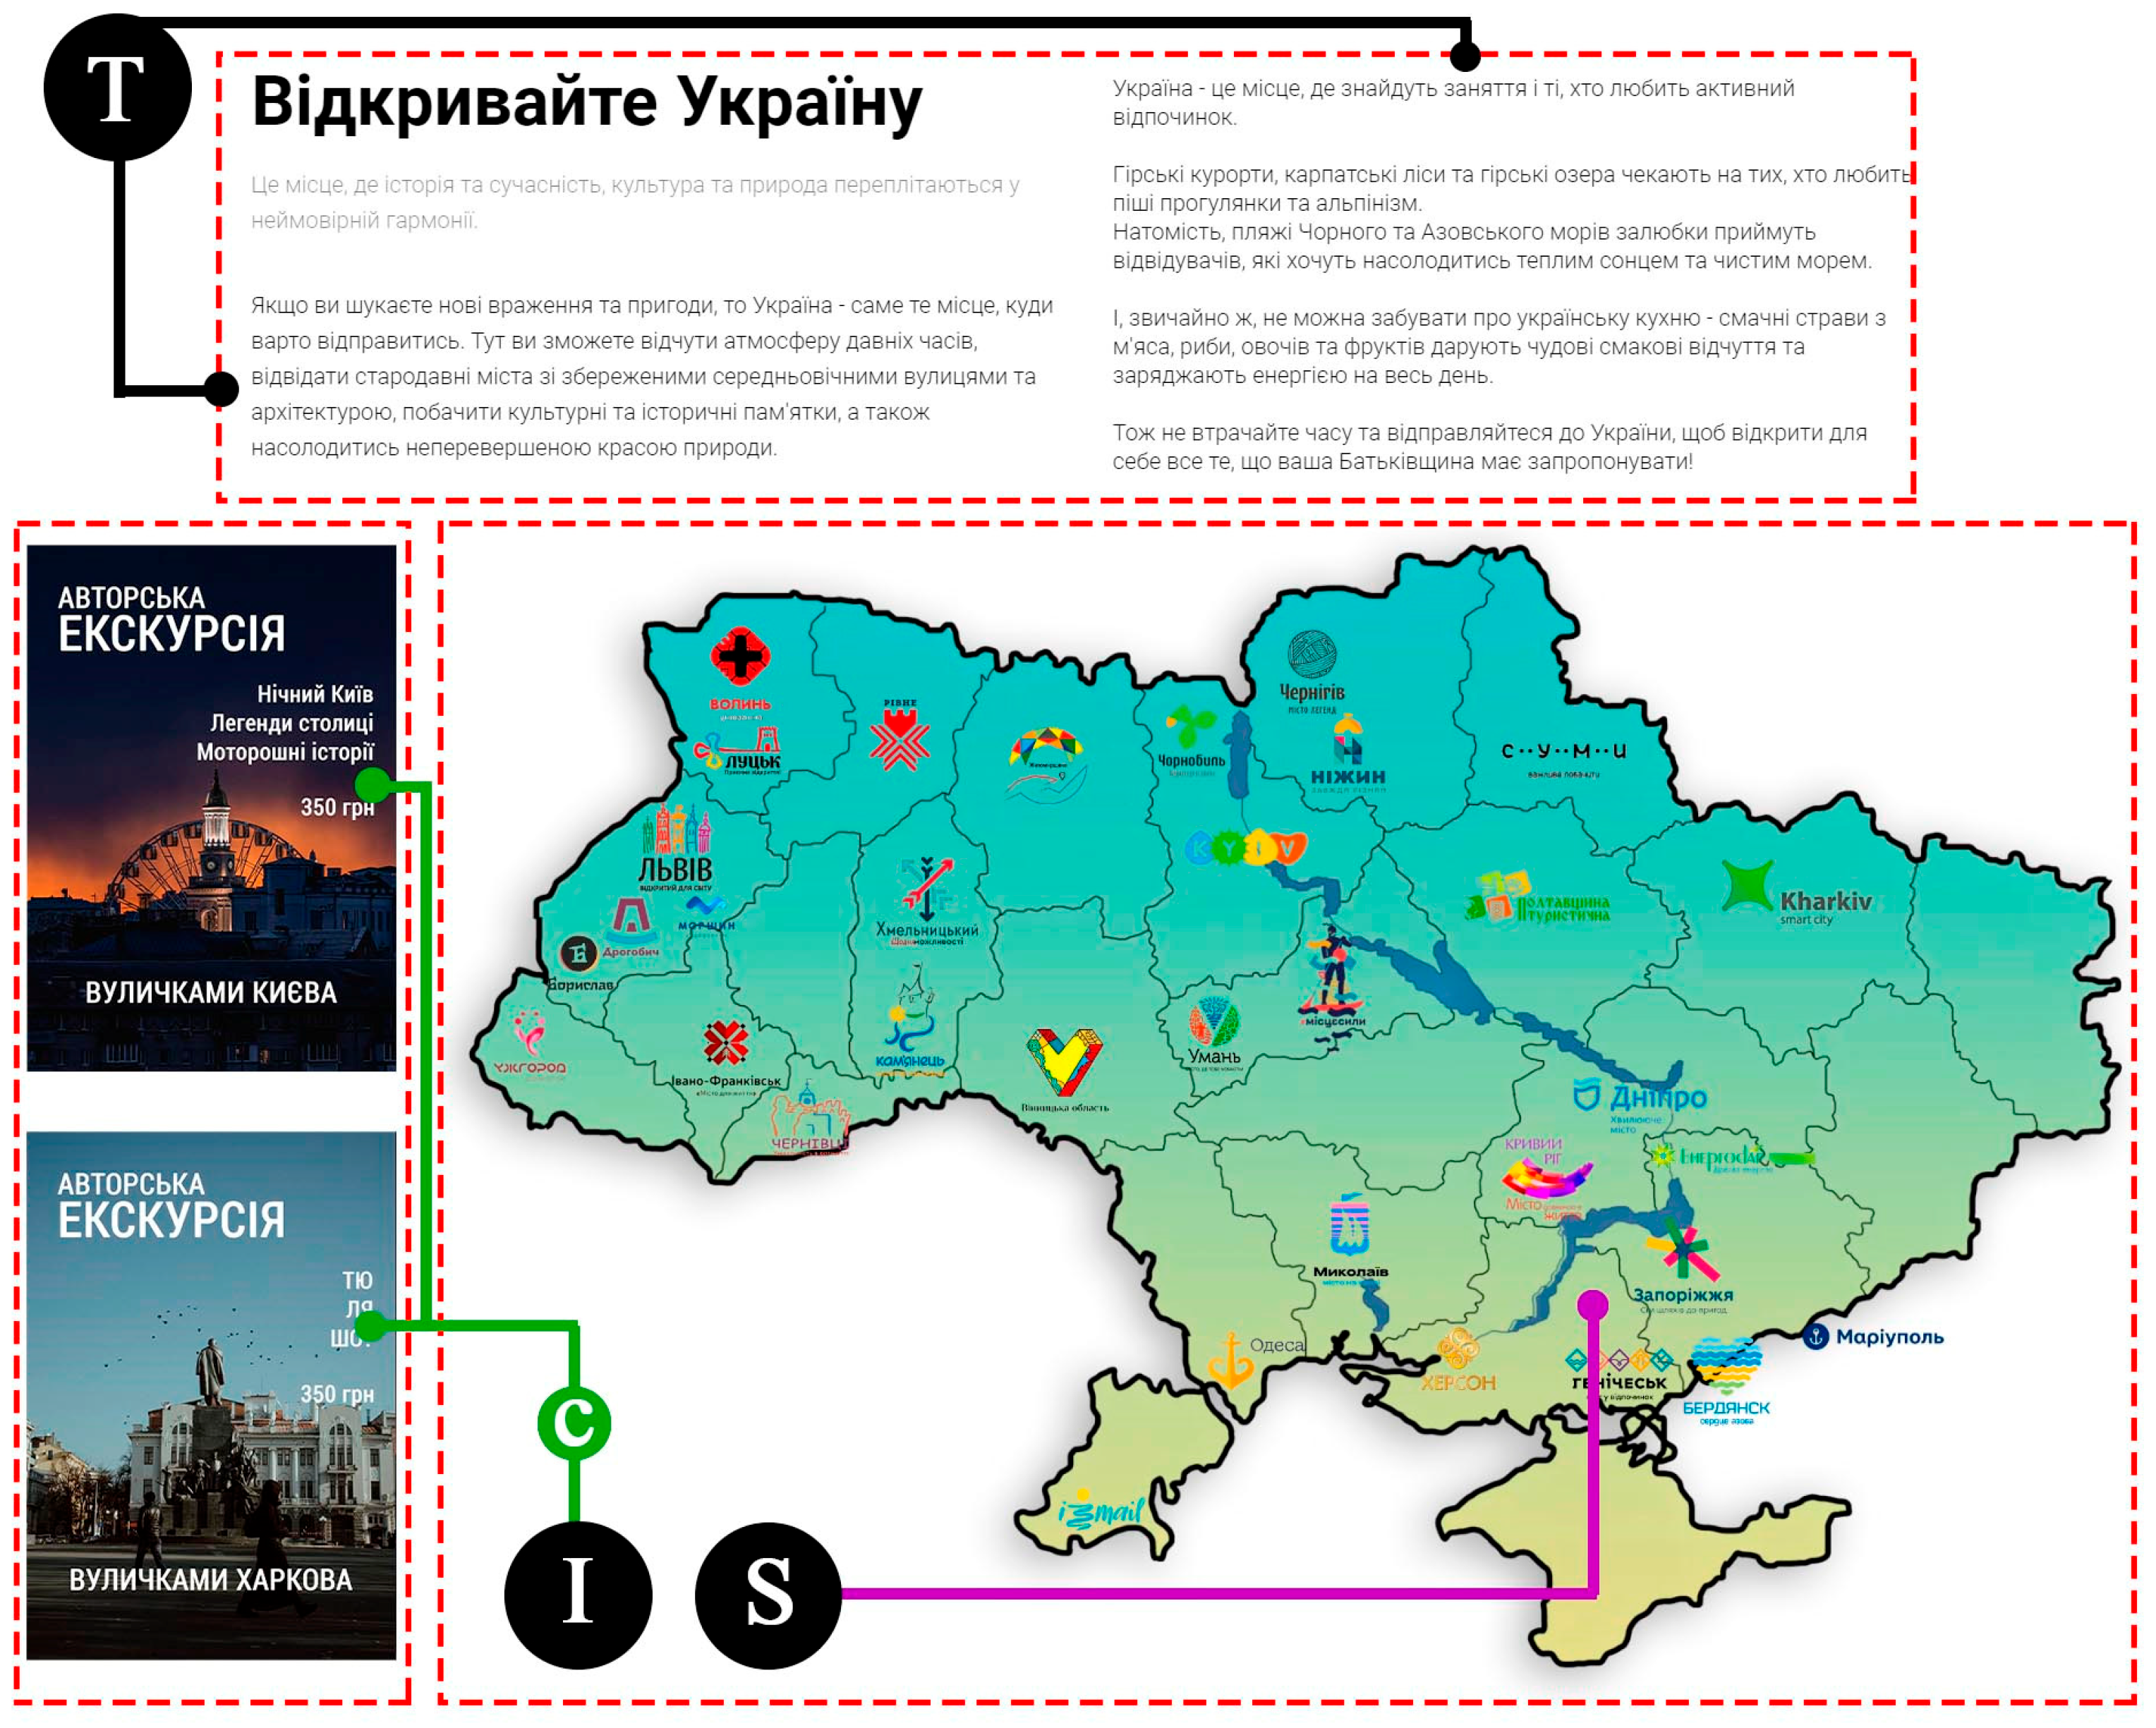
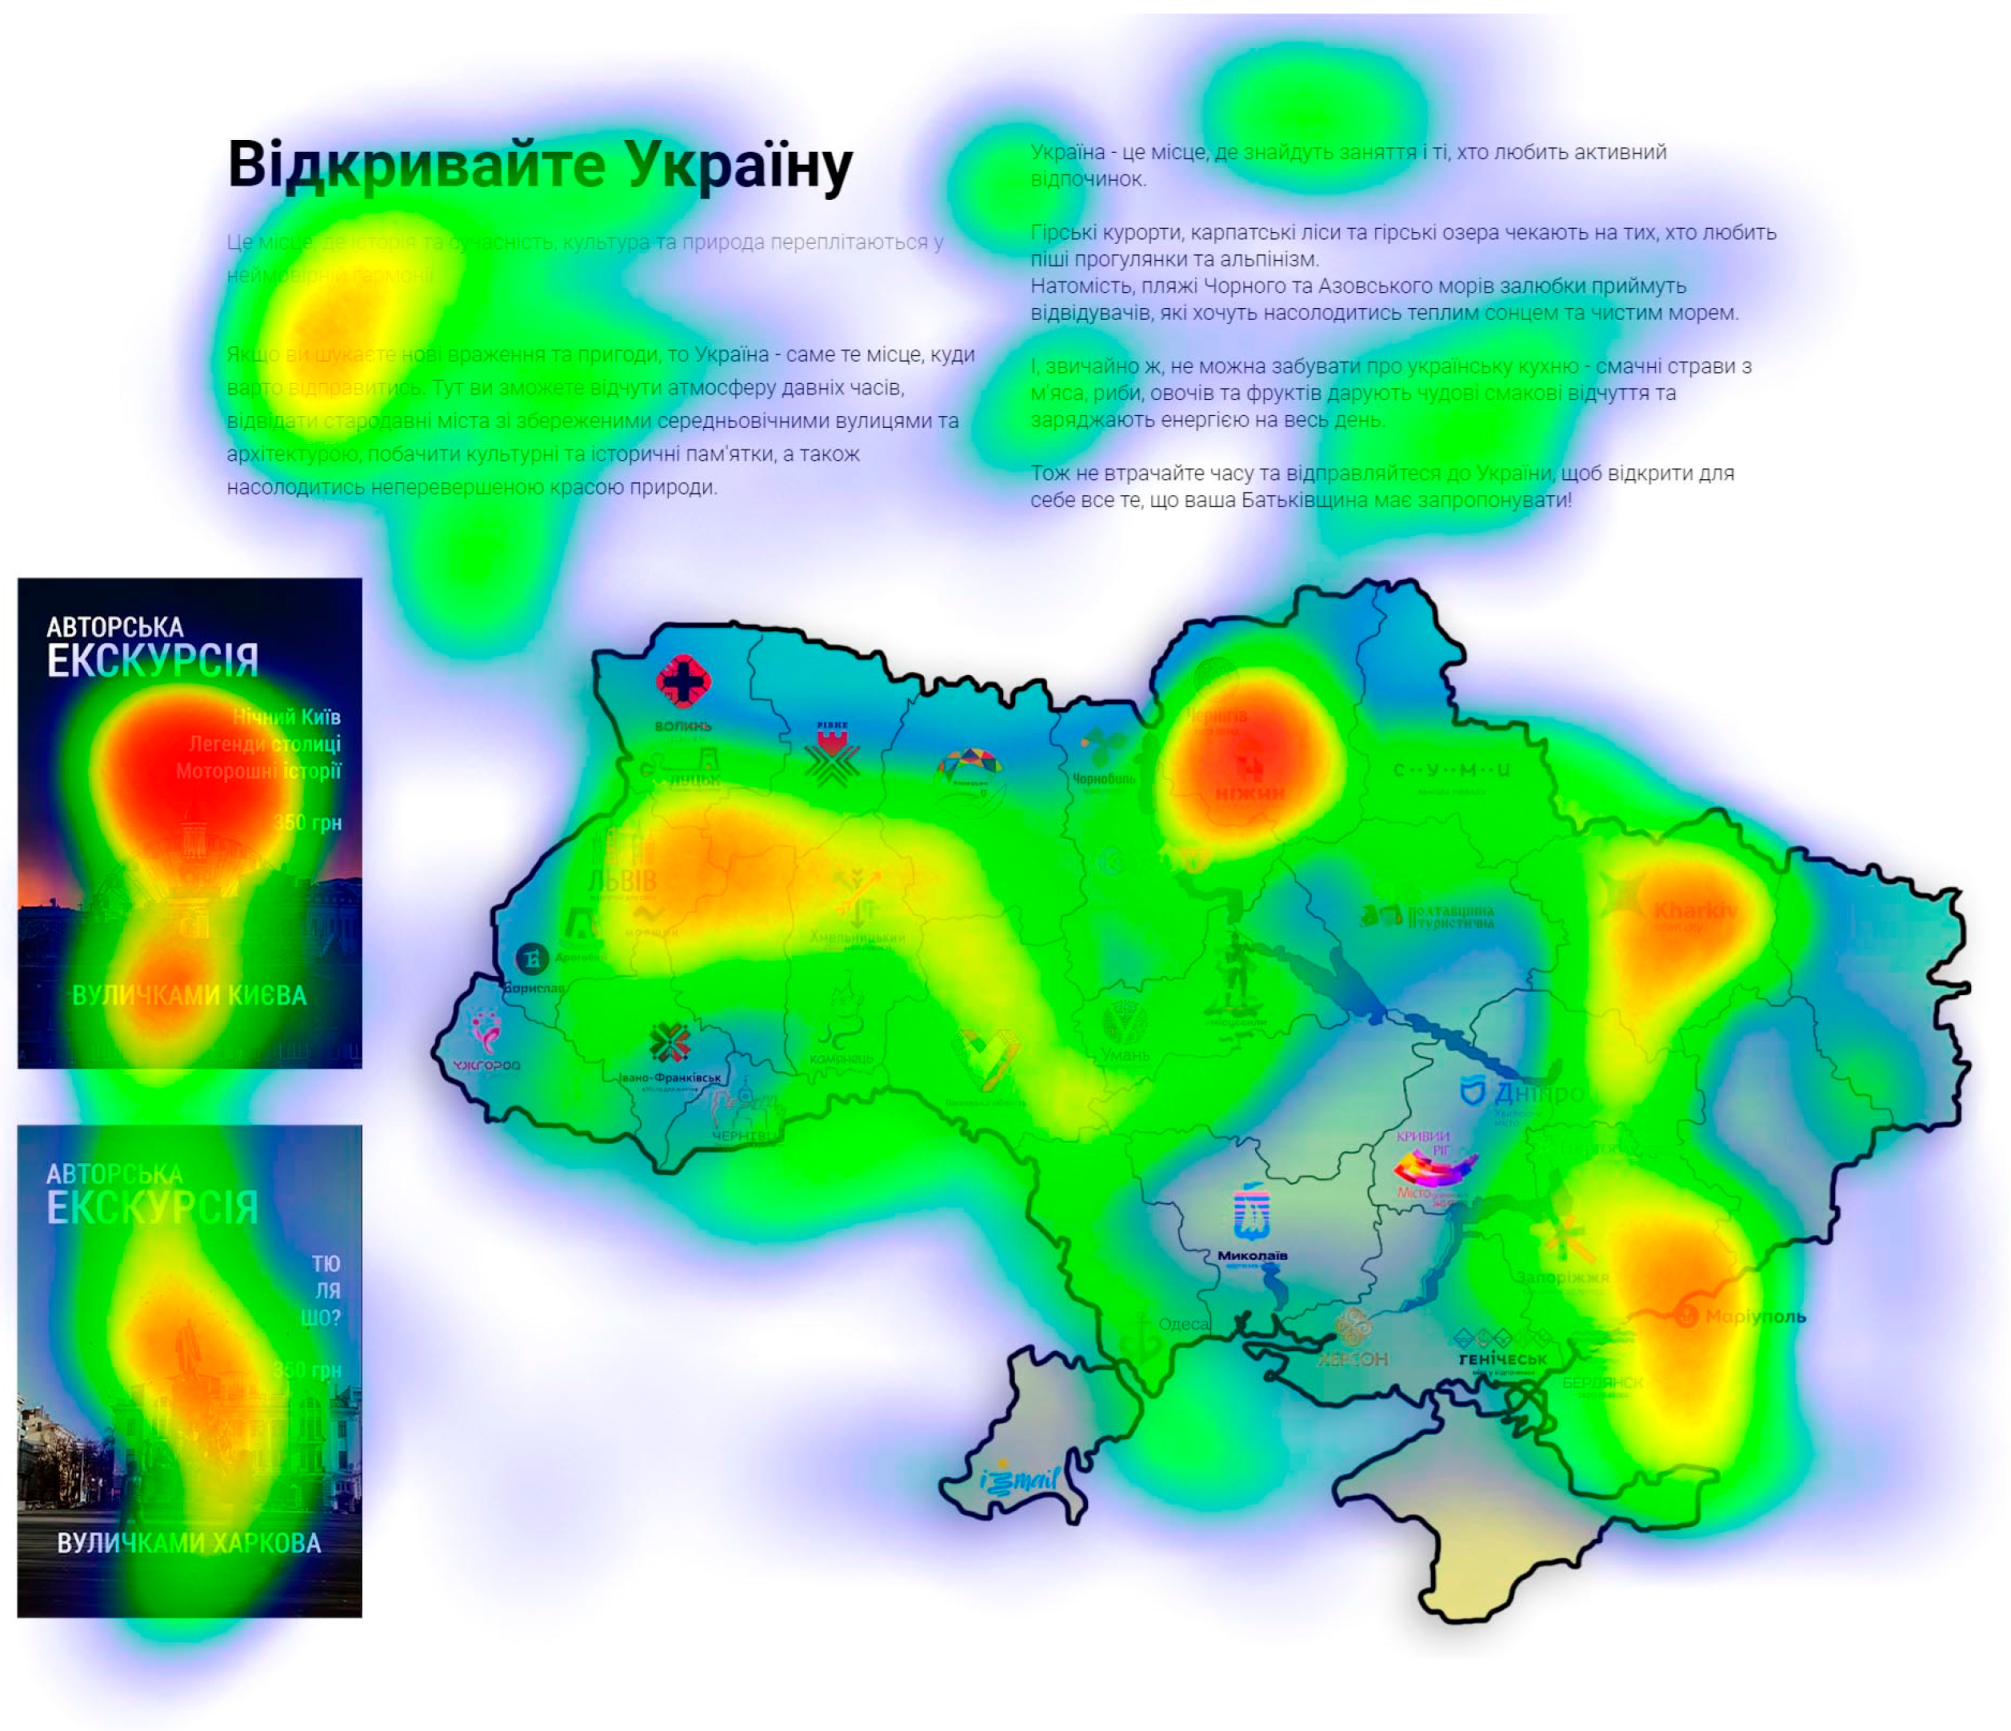
The “map” block comprises three main areas: textual, a schematic representation (the actual map of Ukraine), and combined advertising images. This block was designed to assess user reactions to images that differ from the general block in style and color scheme, and to evaluate the phenomenon of so-called “banner blindness” (
Figure 2).
Regarding the image of the map of Ukraine in the corresponding block, the map shows all existing tourist destination brands in Ukraine. However, during the post-experiment survey, all respondents indicated that they initially focused on the area of Ukraine where they were born and/or reside, and only thereafter shifted their attention to other objects marked on the map. Subsequently, they explored other areas concentrated in the block, which generally correlates with the data presented in
Table 1,
Table 2 and
Table 3. Respondents spent 56% of the total time within the map block studying the logos of tourist brands. The regions that received the most attention during the map exploration were Zaporizhzhia, Kharkiv, Chernihiv, Kyiv, Lviv, Vinnytsia, and Khmelnytskyi.
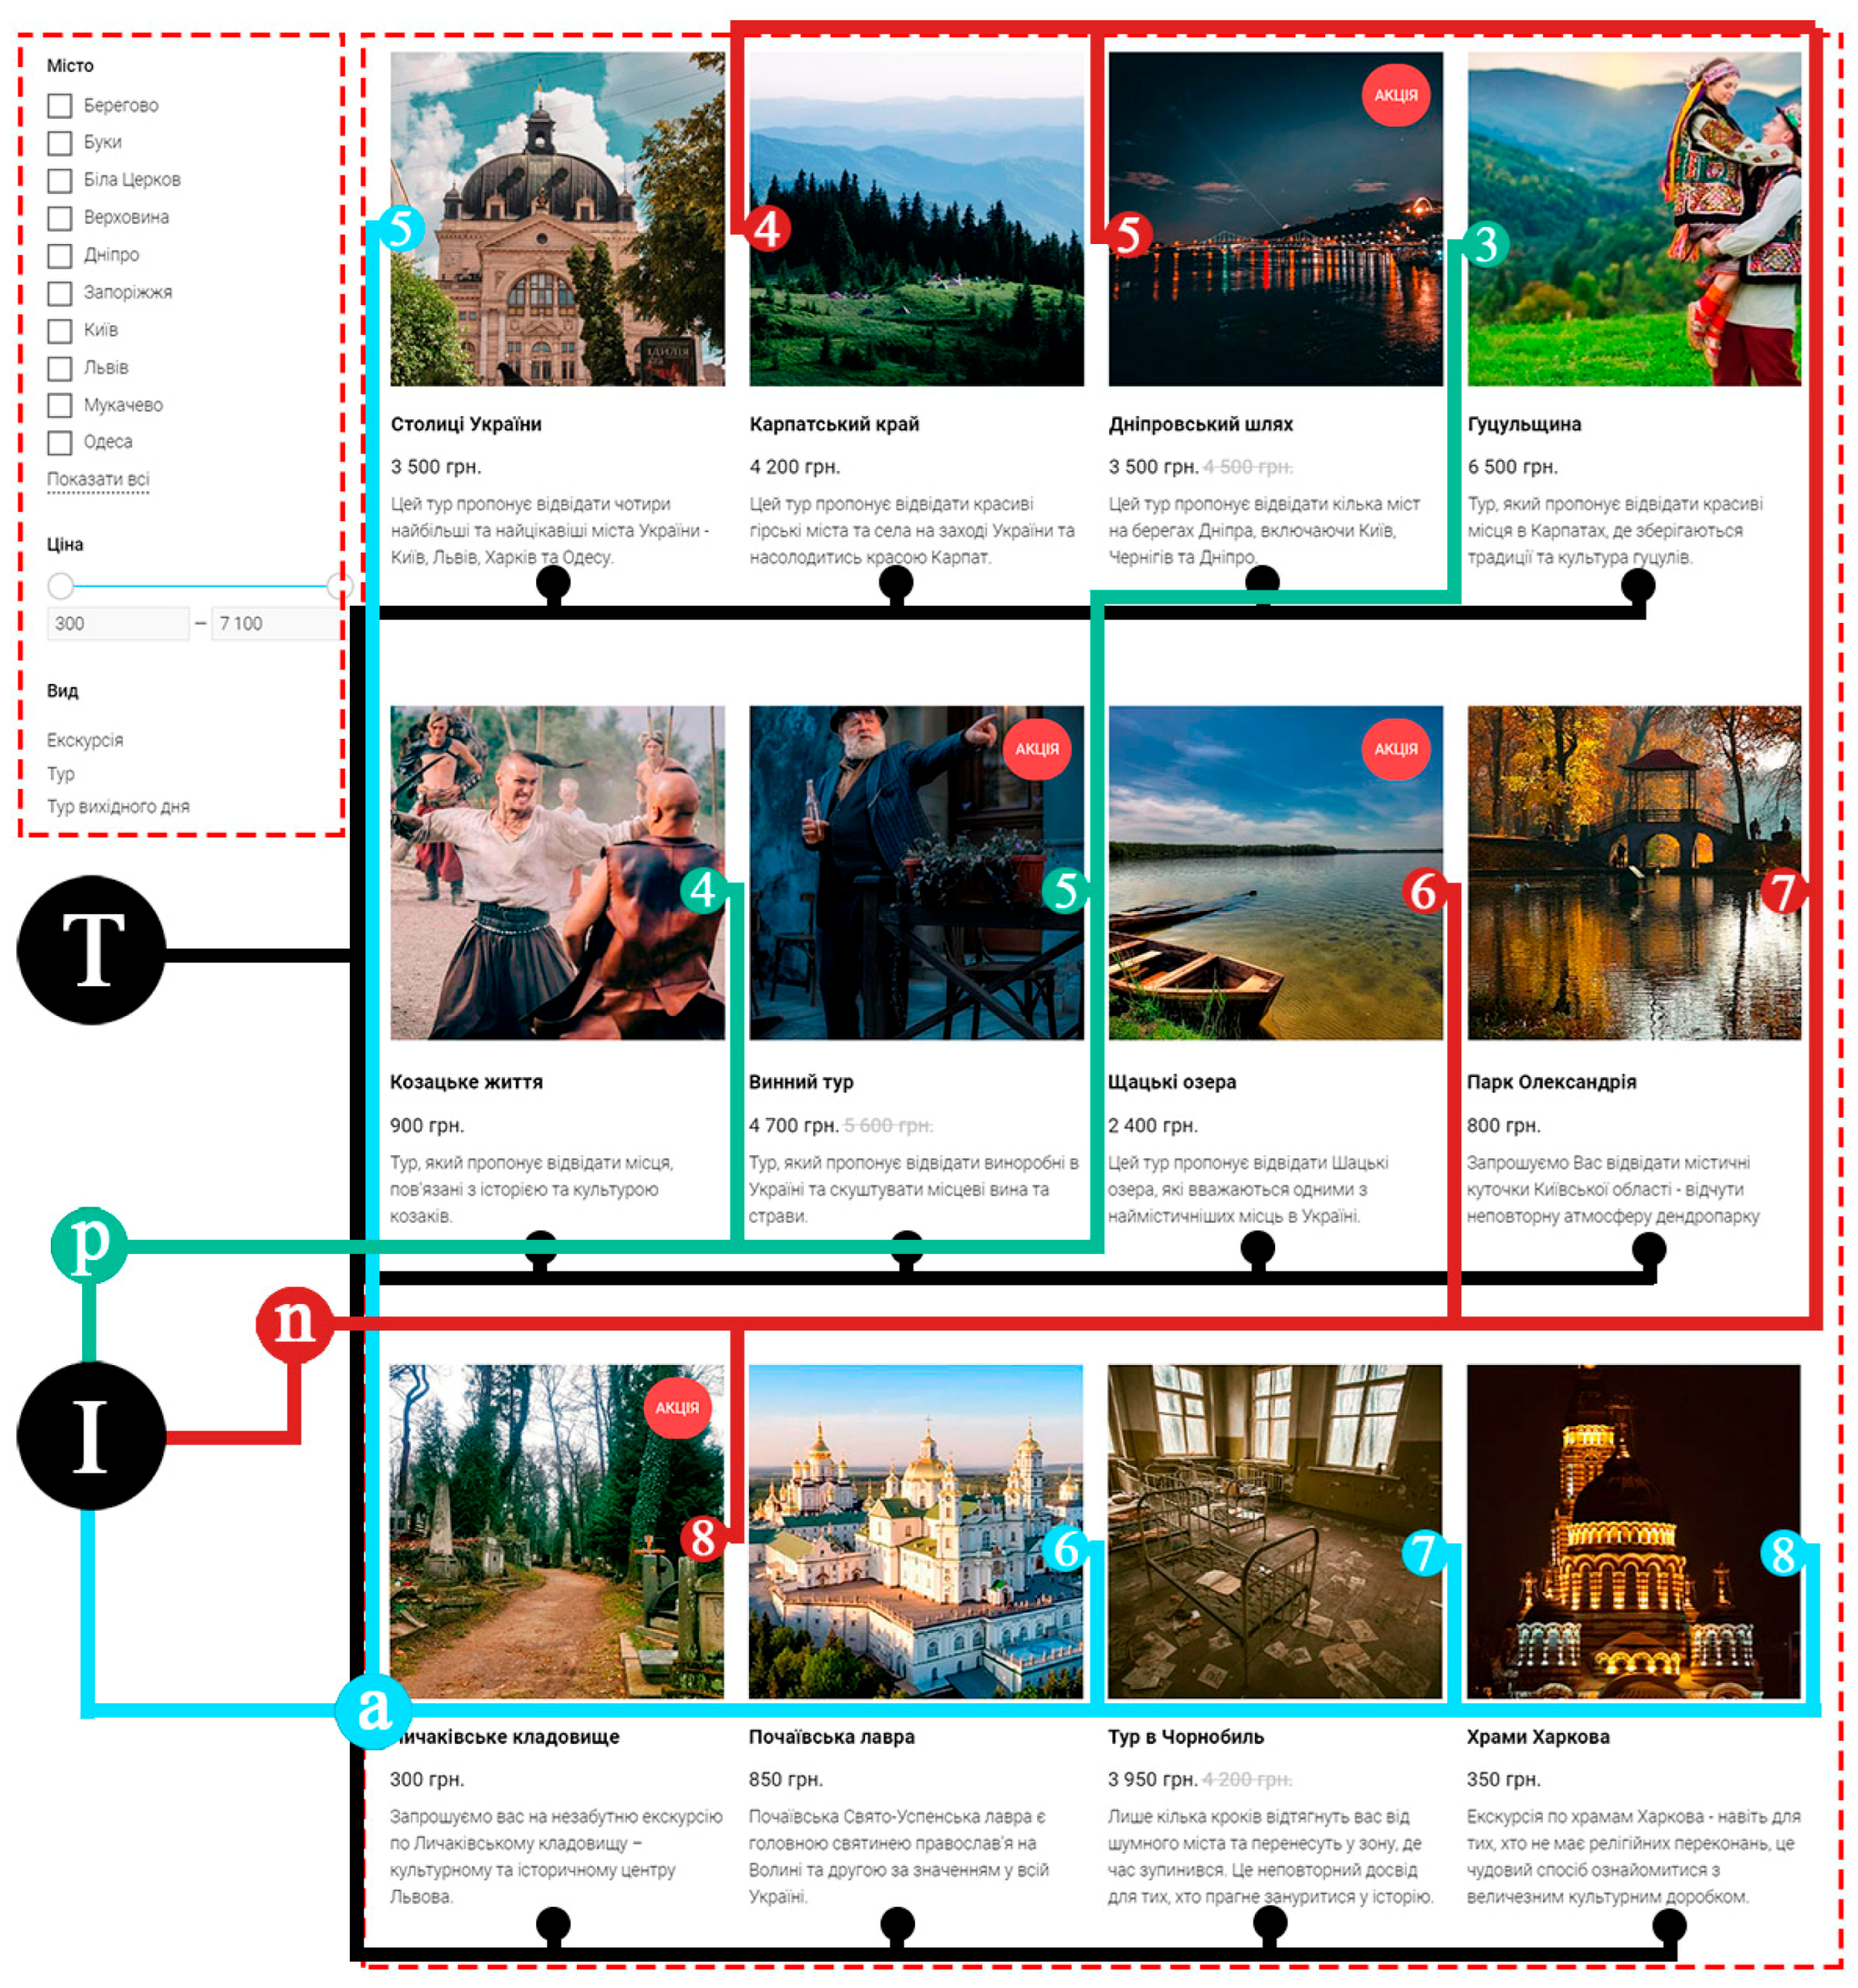
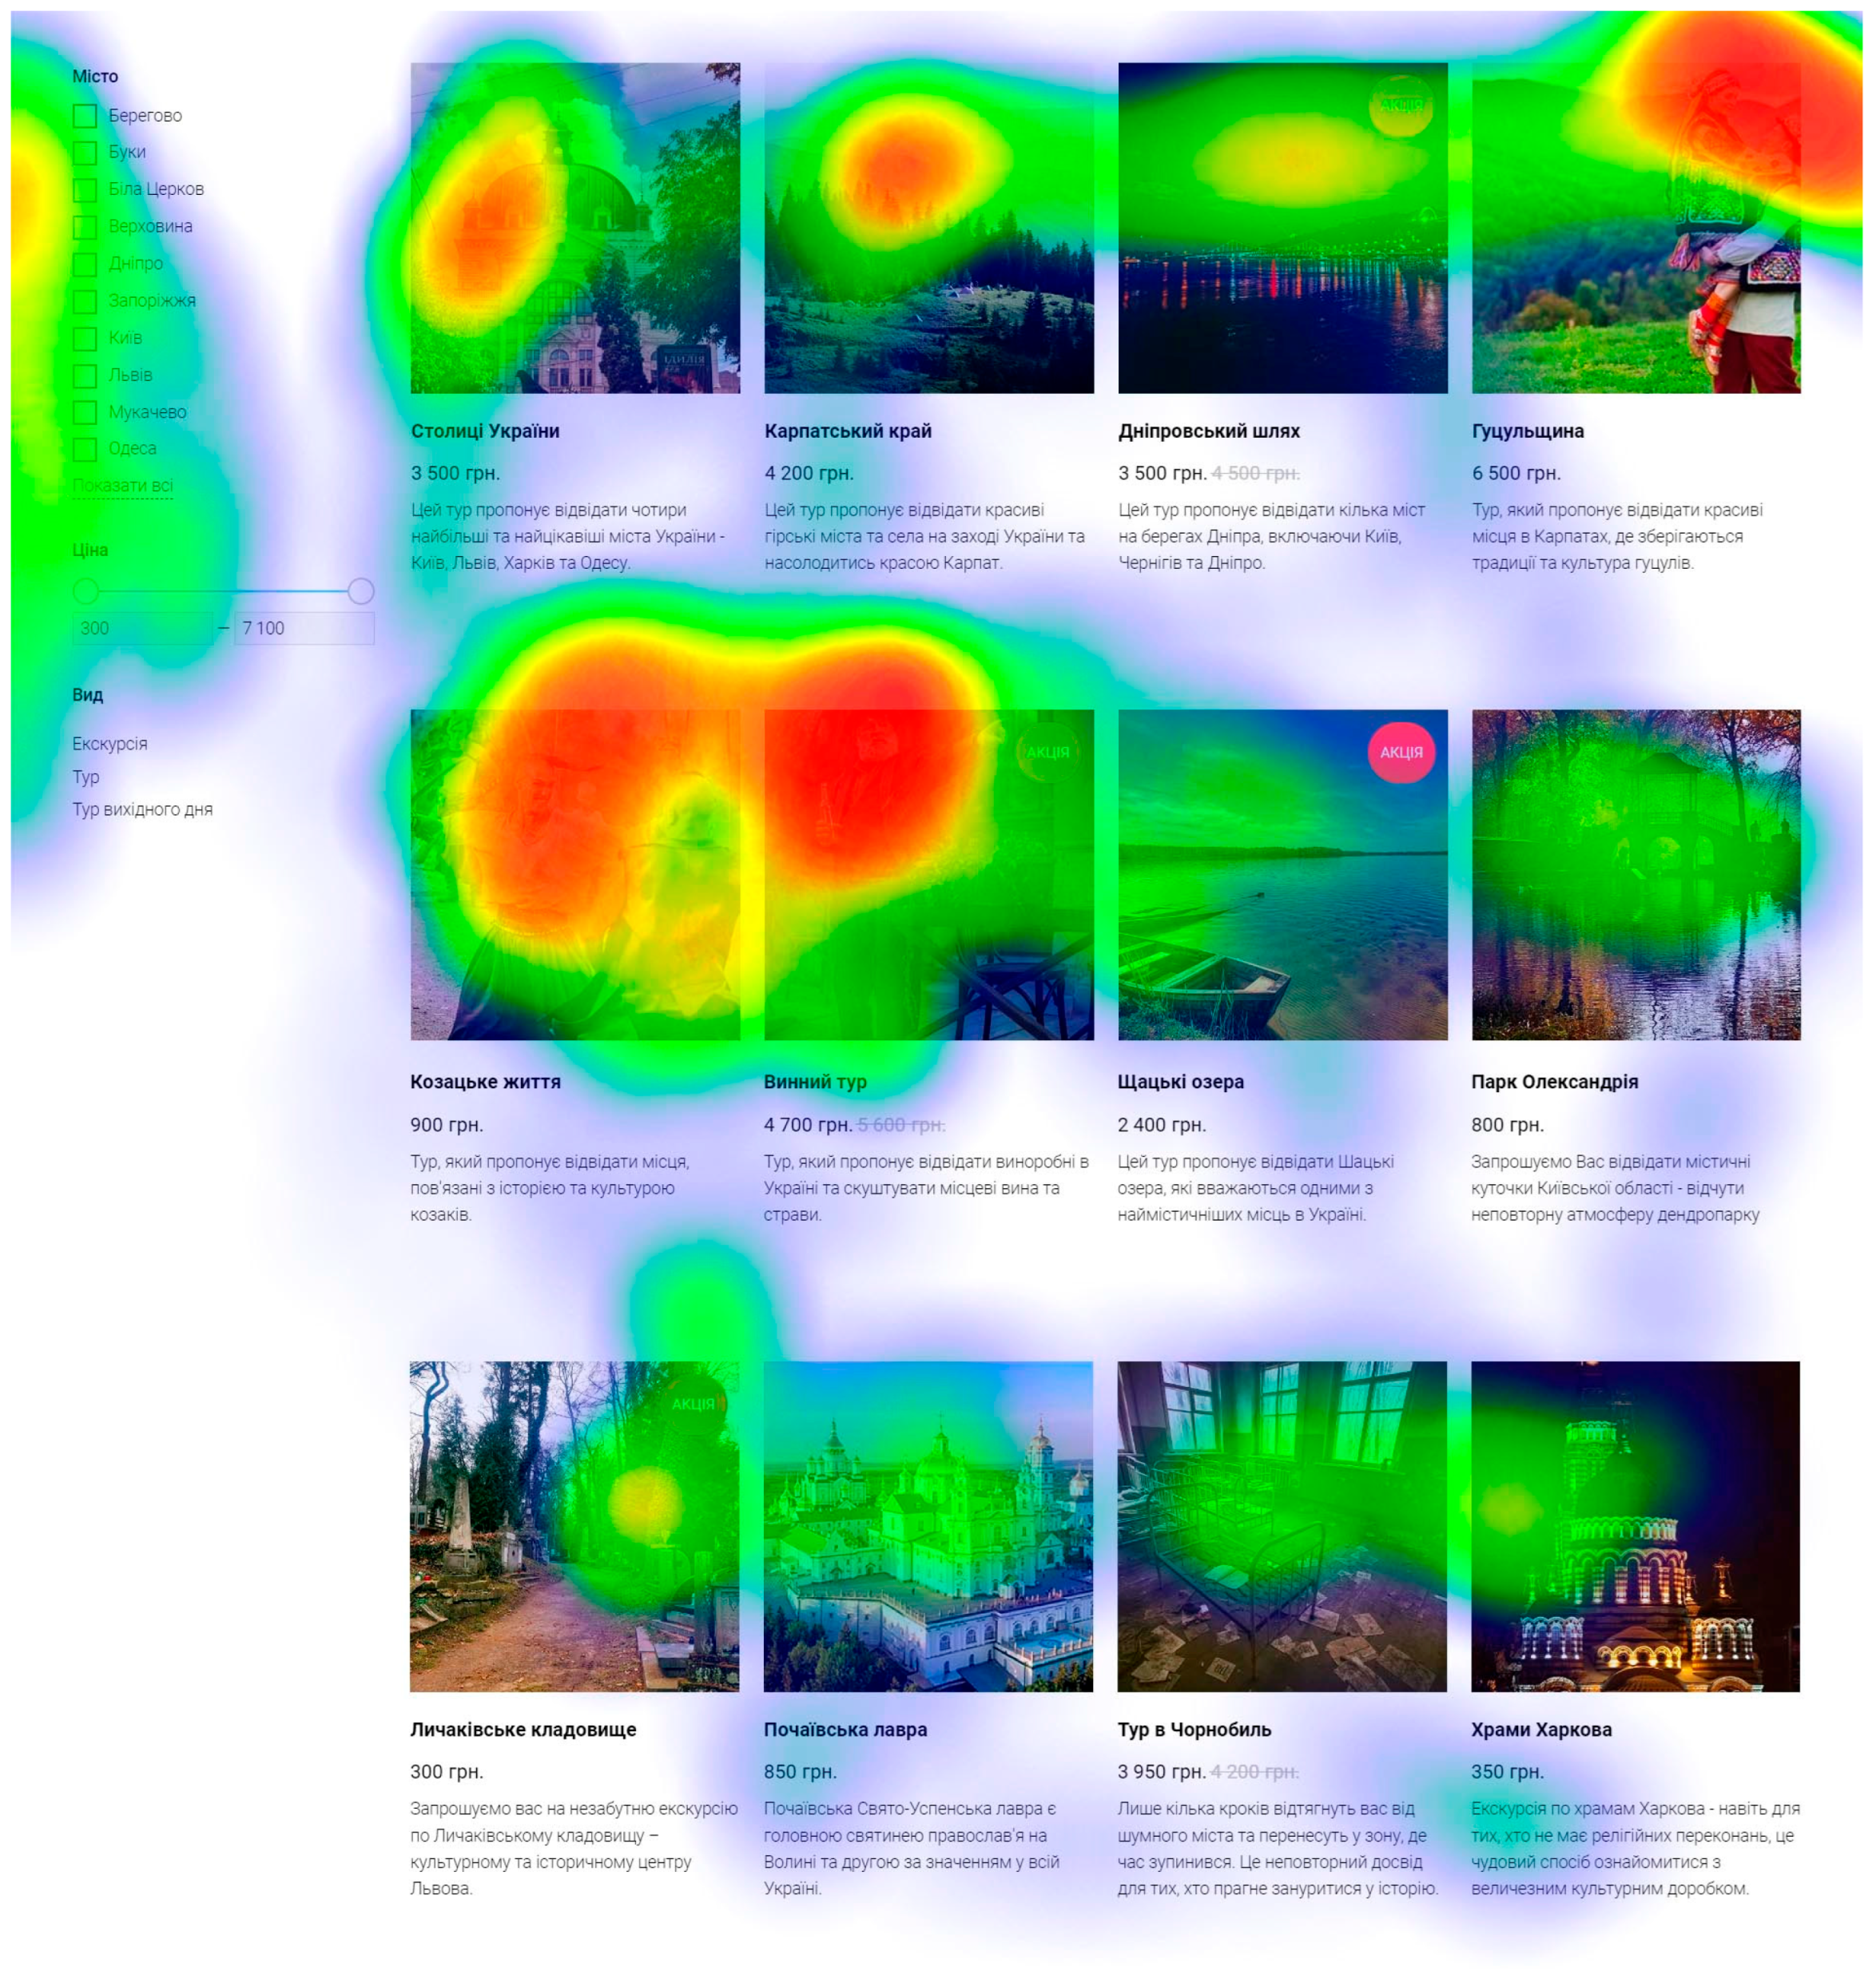
In the tours block (
Figure 3), the placement of demonstration materials was chosen considering the error in gaze-tracking calibration. The combination of images in three rows is as follows:
Ia, In, In, Ip;
Ip, Ip, In, In;
In, Ia, Ia, Ia.
During the analysis, the reaction to accompanying text was not considered (although all interactions are reflected in the heatmaps, as the tables focus exclusively on the metrics of the areas of interest—images). The experiment was primarily concerned with the reaction to visual objects. A total of 40 images were selected:
Ia—14 objects;
Ip—10 objects;
In—11 objects;
Ian—1 object;
Ic—3 objects;
S—1 object.
The website was shown to participants for the first time during the experiment to obtain a primary reaction, and the time to study the site was limited. The declared objective was to evaluate the website’s usability and form a general impression of its structure and functionality. This was necessary to avoid revealing the experiment’s primary purpose and prevent participants from making conscious, deliberate choices regarding the visual elements.
4. Results
After the experiment, a brief survey was conducted to gather feedback. To minimize bias and ensure that participants’ visual behavior reflected spontaneous attention rather than conscious decision-making, the declared objective of the experiment was framed as an evaluation of the website’s usability. Participants were informed that their task was to explore the site and provide general feedback on its structure and clarity. After the experiment, a brief supplementary questionnaire was administered to gather subjective impressions regarding navigation ease, visual attractiveness, and content accessibility. This questionnaire served a secondary role, complementing the primary eye-tracking data by providing contextual insights into user perceptions. The following data were collected during the analysis: gaze fixation time (in seconds and as a percentage of the total time spent in the block), first gaze fixation, and order of image examination. The task during the experiment was to determine which of the three categories of images—Ia (architecture), In (nature), or Ip (people)—would attract greater interest. Although there is an exhaustive list of categories that can be used to form a visual image, the scope of this study was intentionally limited to these categories.
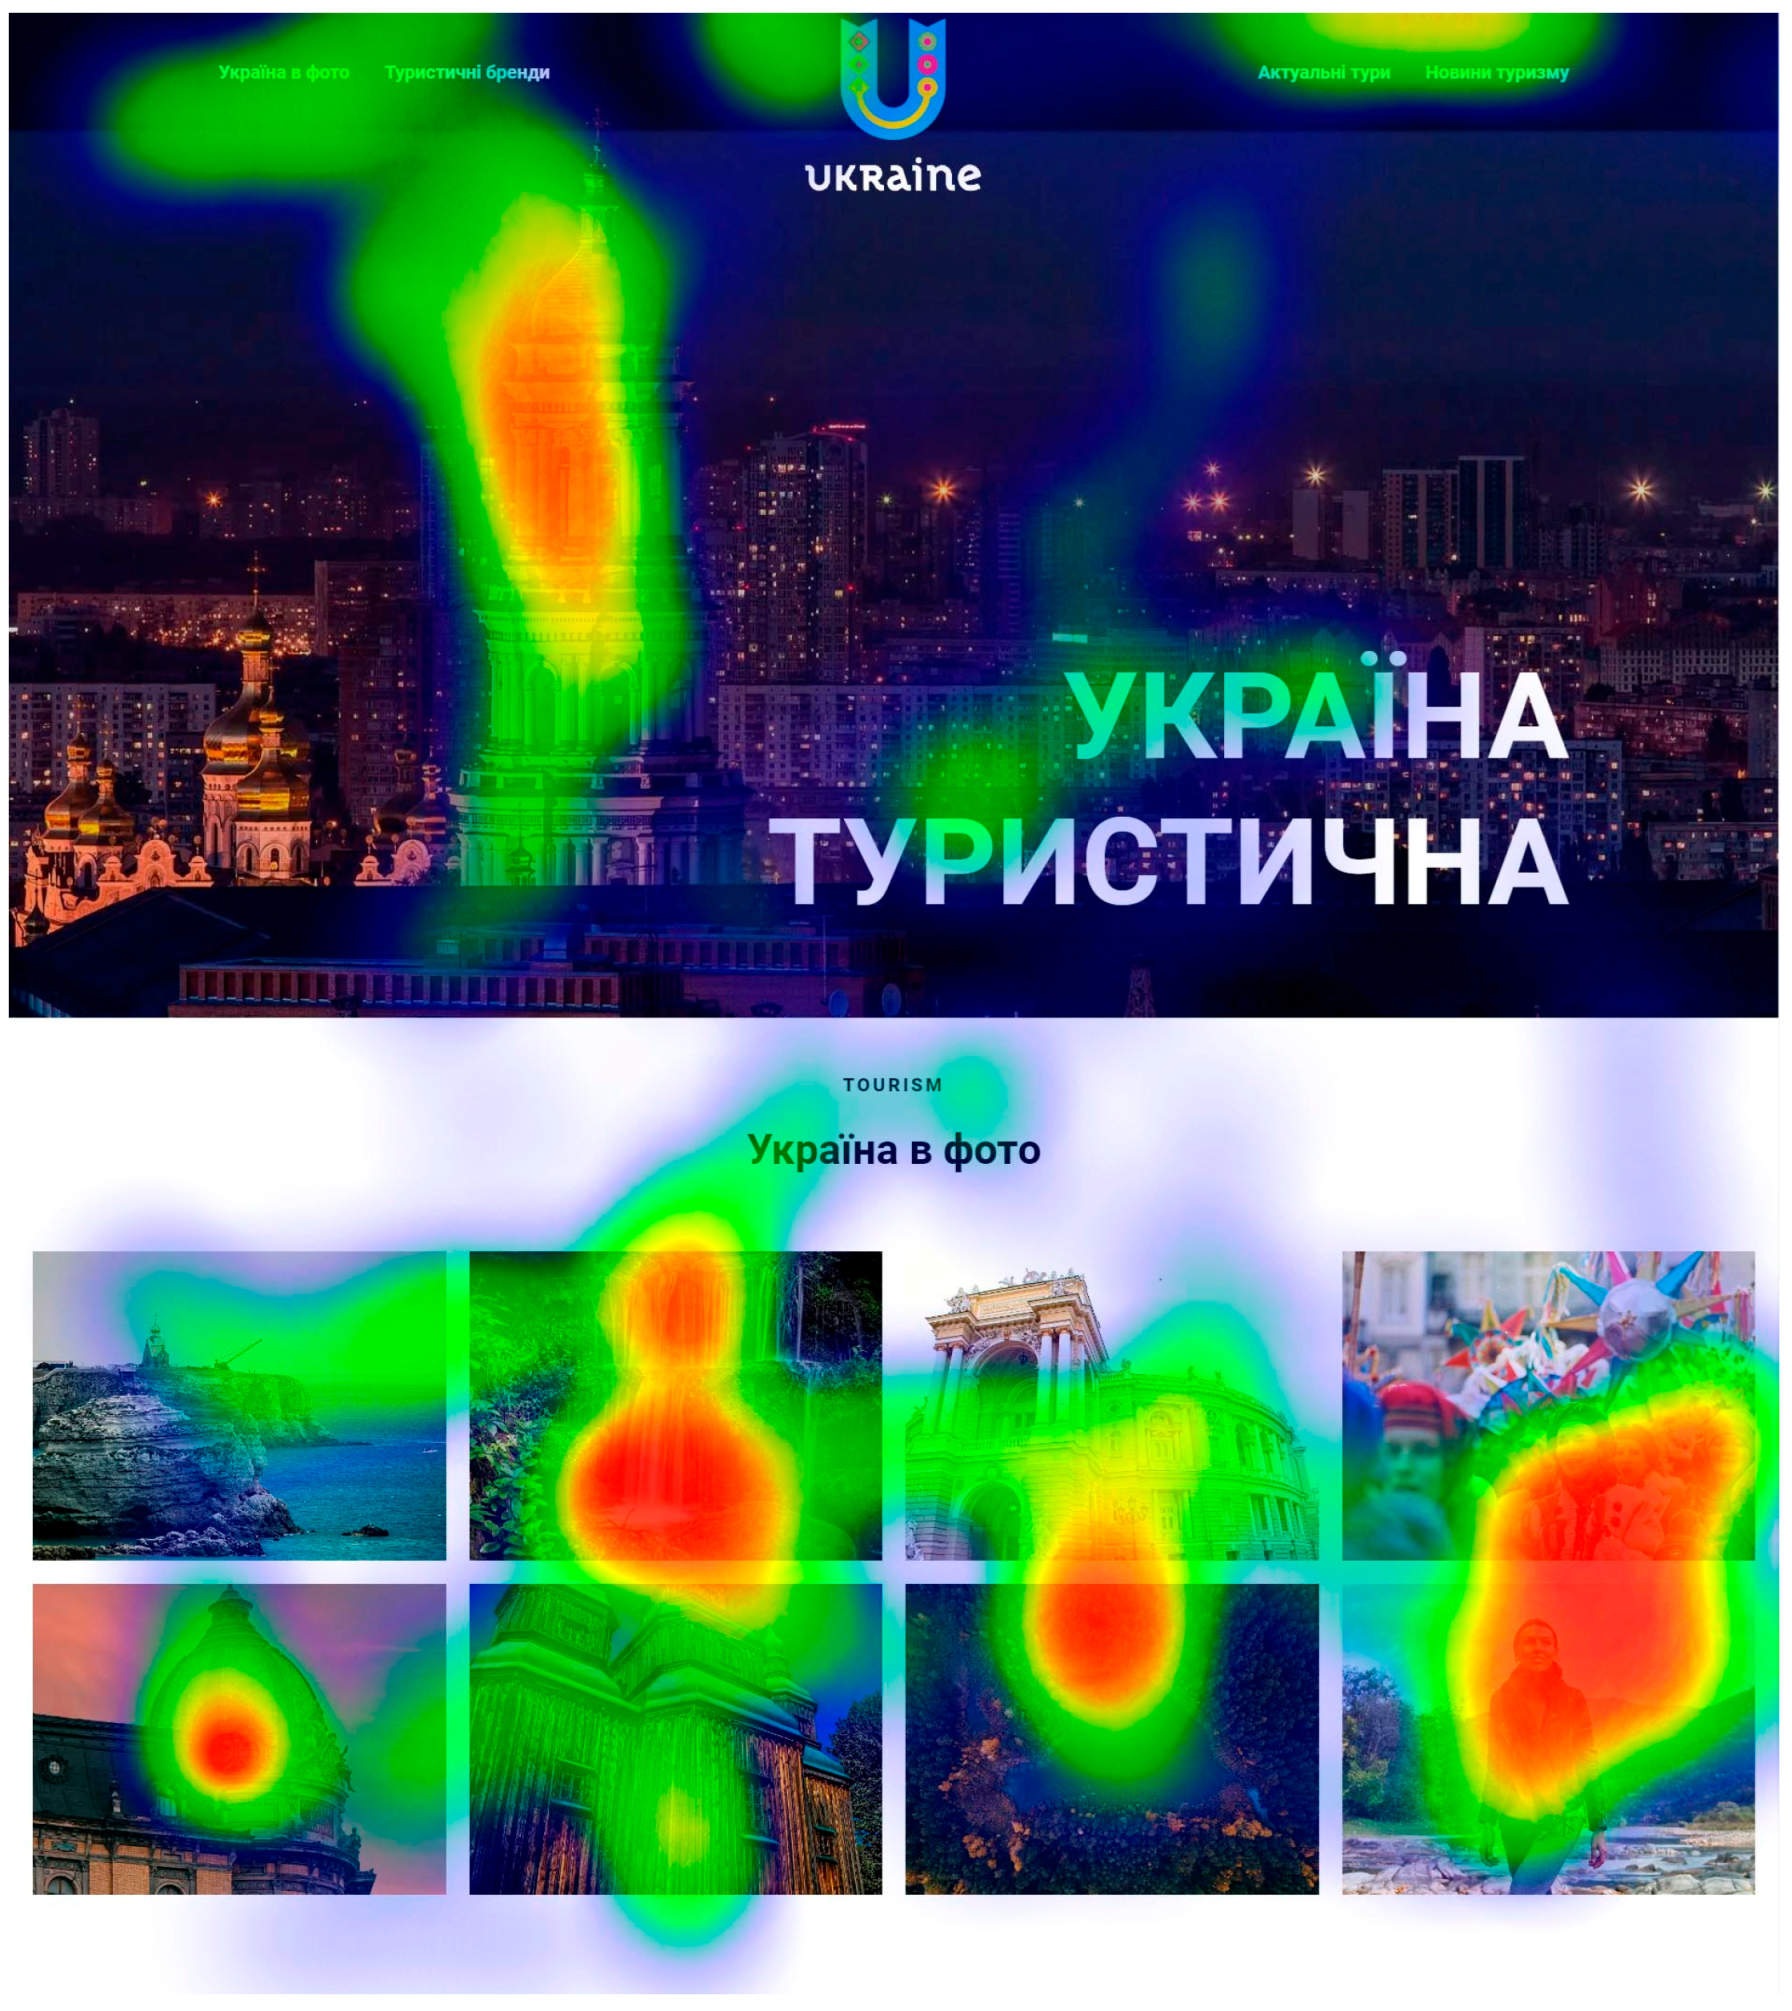
According to
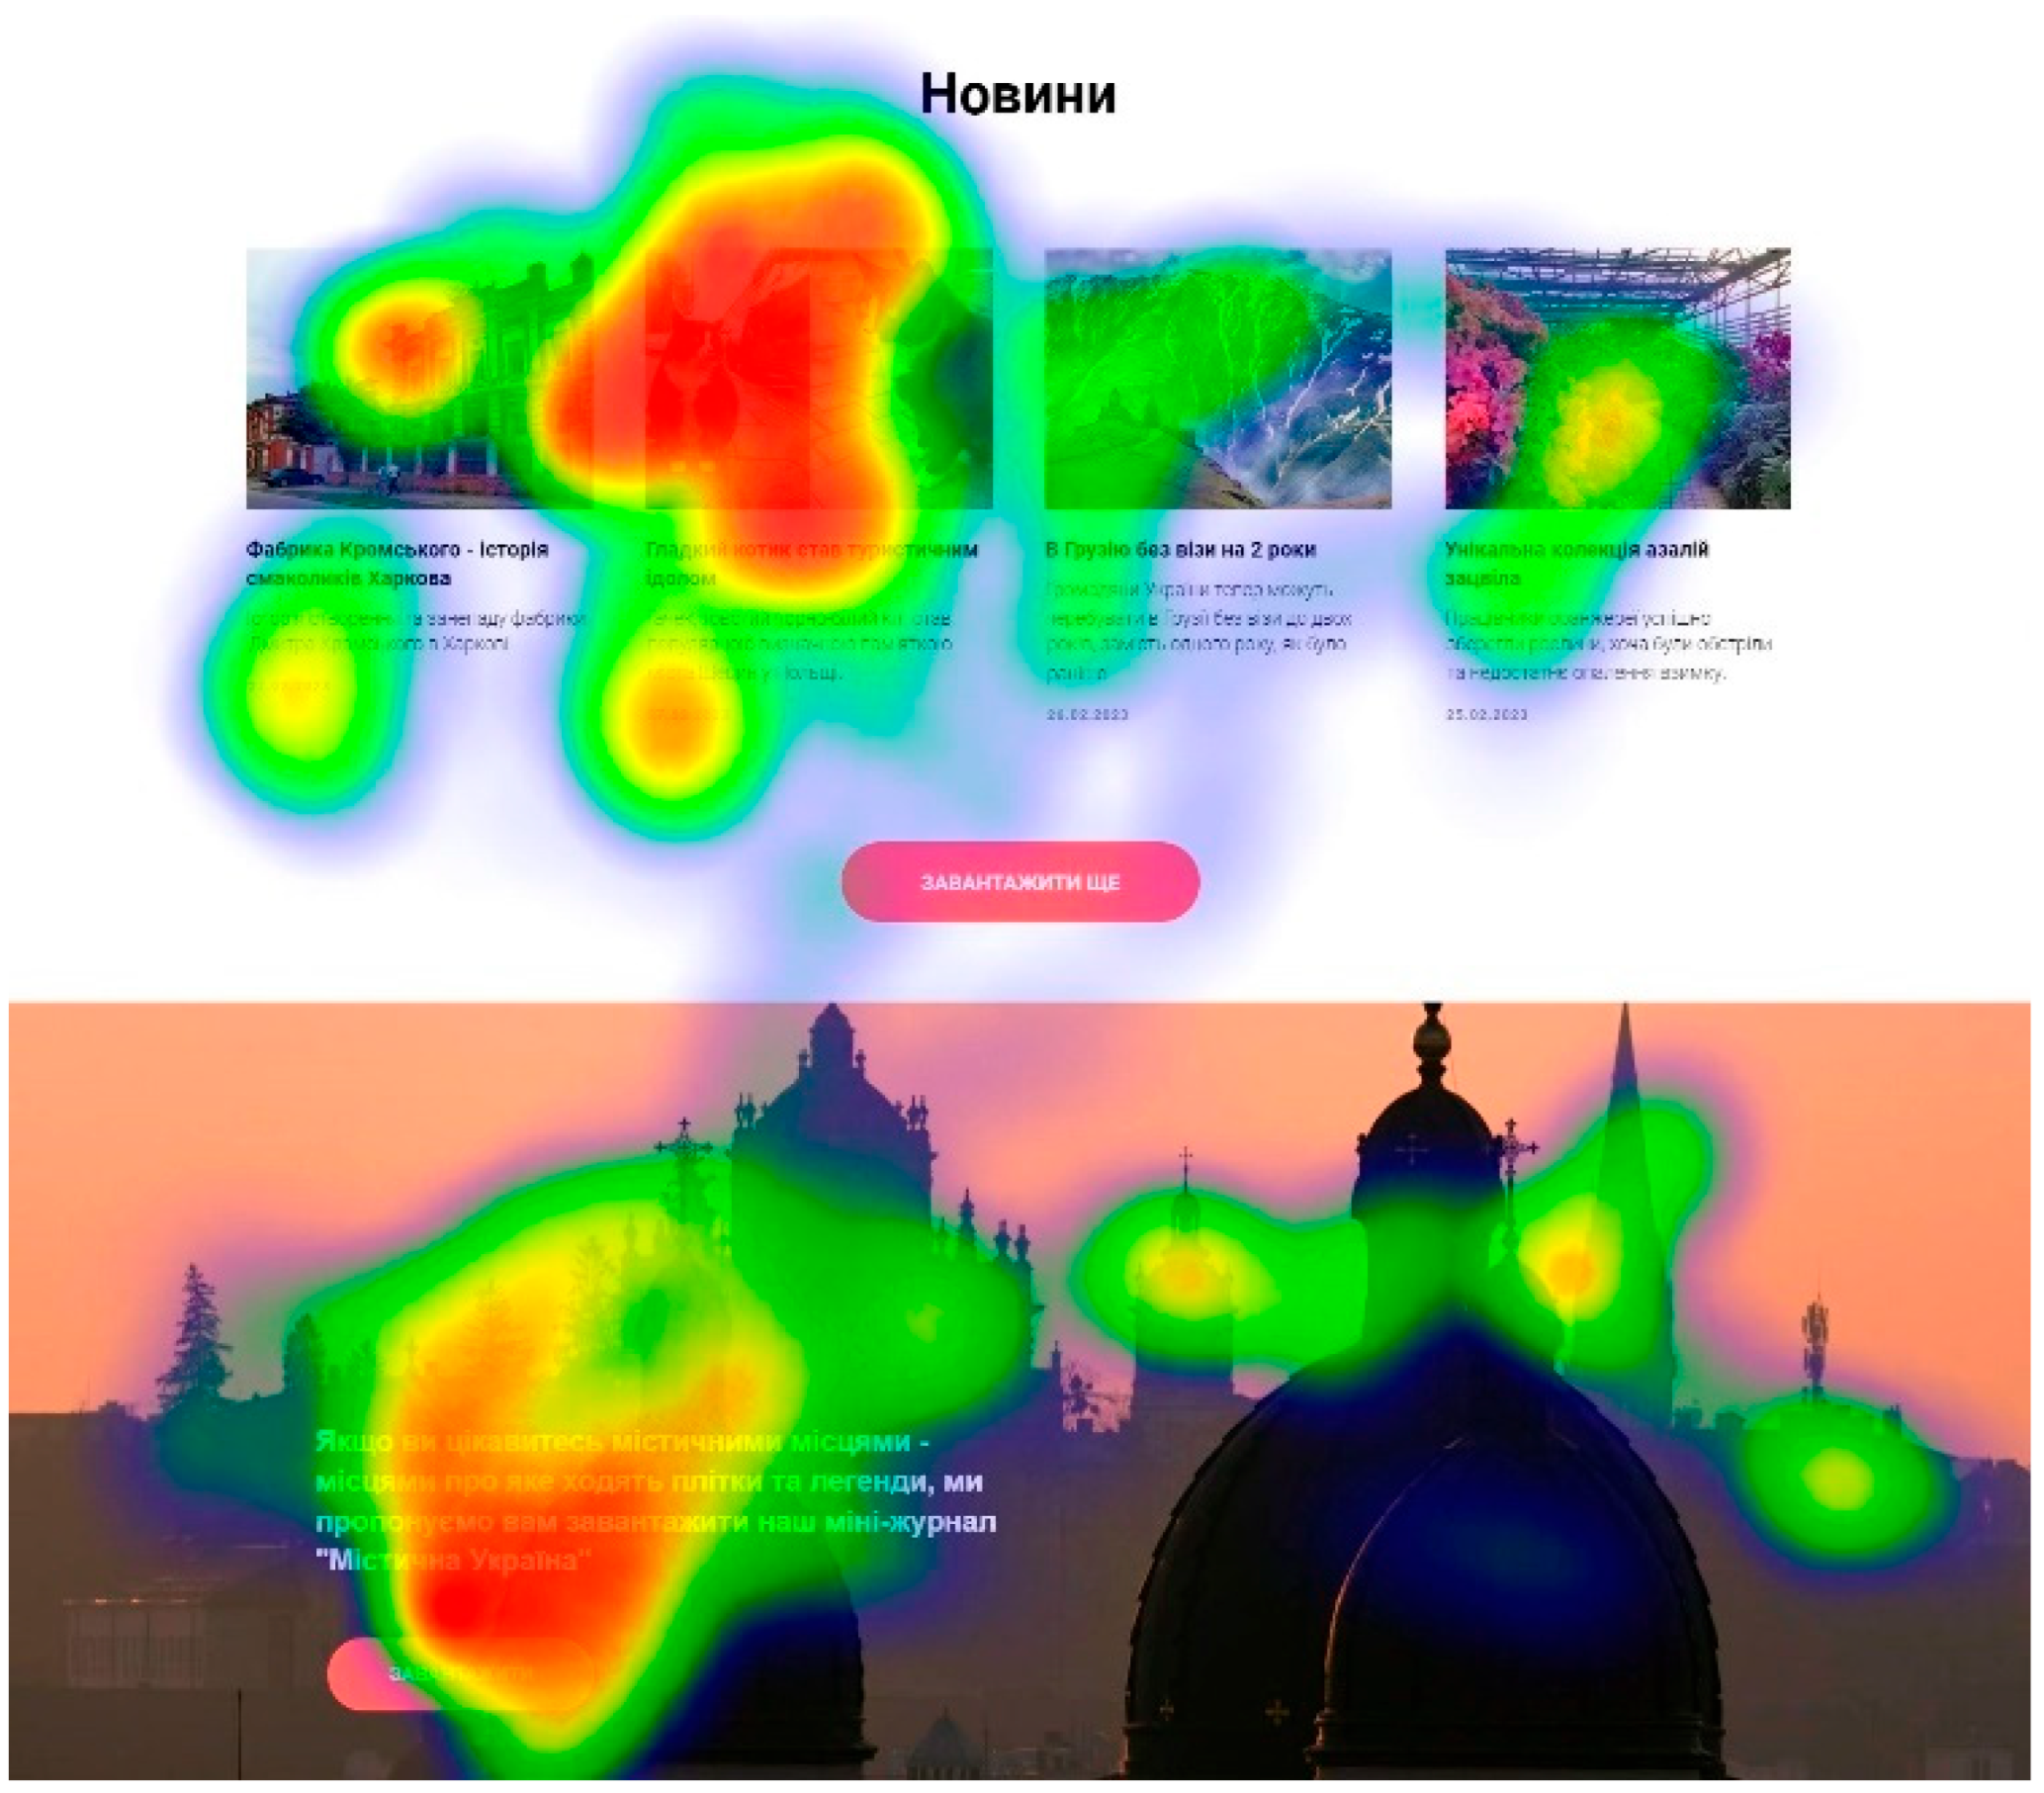
Figure 6,
Figure 7,
Figure 8 and
Figure 9, the most intense areas of visual attention are on people’s faces. In
Figure 6, this effect may be influenced by the placement of images on the right edge of the webpage.
Figure 7, however, clearly shows users also focus strongly on the most touristically popular attractions.
Figure 8 demonstrates that attention does not depend on the placement, as the images are on different rows, not one below the other. These findings are generally consistent with results reported in other studies.
For example, according to studies by Gianluigi Guido, Marco Pichierri, Giovanni Pino, and Rajan Nataraajan, it was found that advertisements containing faces and pareidolia can attract more attention than other types of advertisements. People look for faces in advertisements due to an orienting response that stems from the higher significance of faces in emotional and biological terms, particularly under conditions of short exposure time. However, with increased exposure time, attention decreases, indicating that more prolonged exposure mitigates the attention-attracting effect of faces. It was also found that advertisements with faces and pareidolia contributed to increased brand recognition, regardless of exposure duration, compared to alternative advertisements without such elements (
Guido et al., 2018).
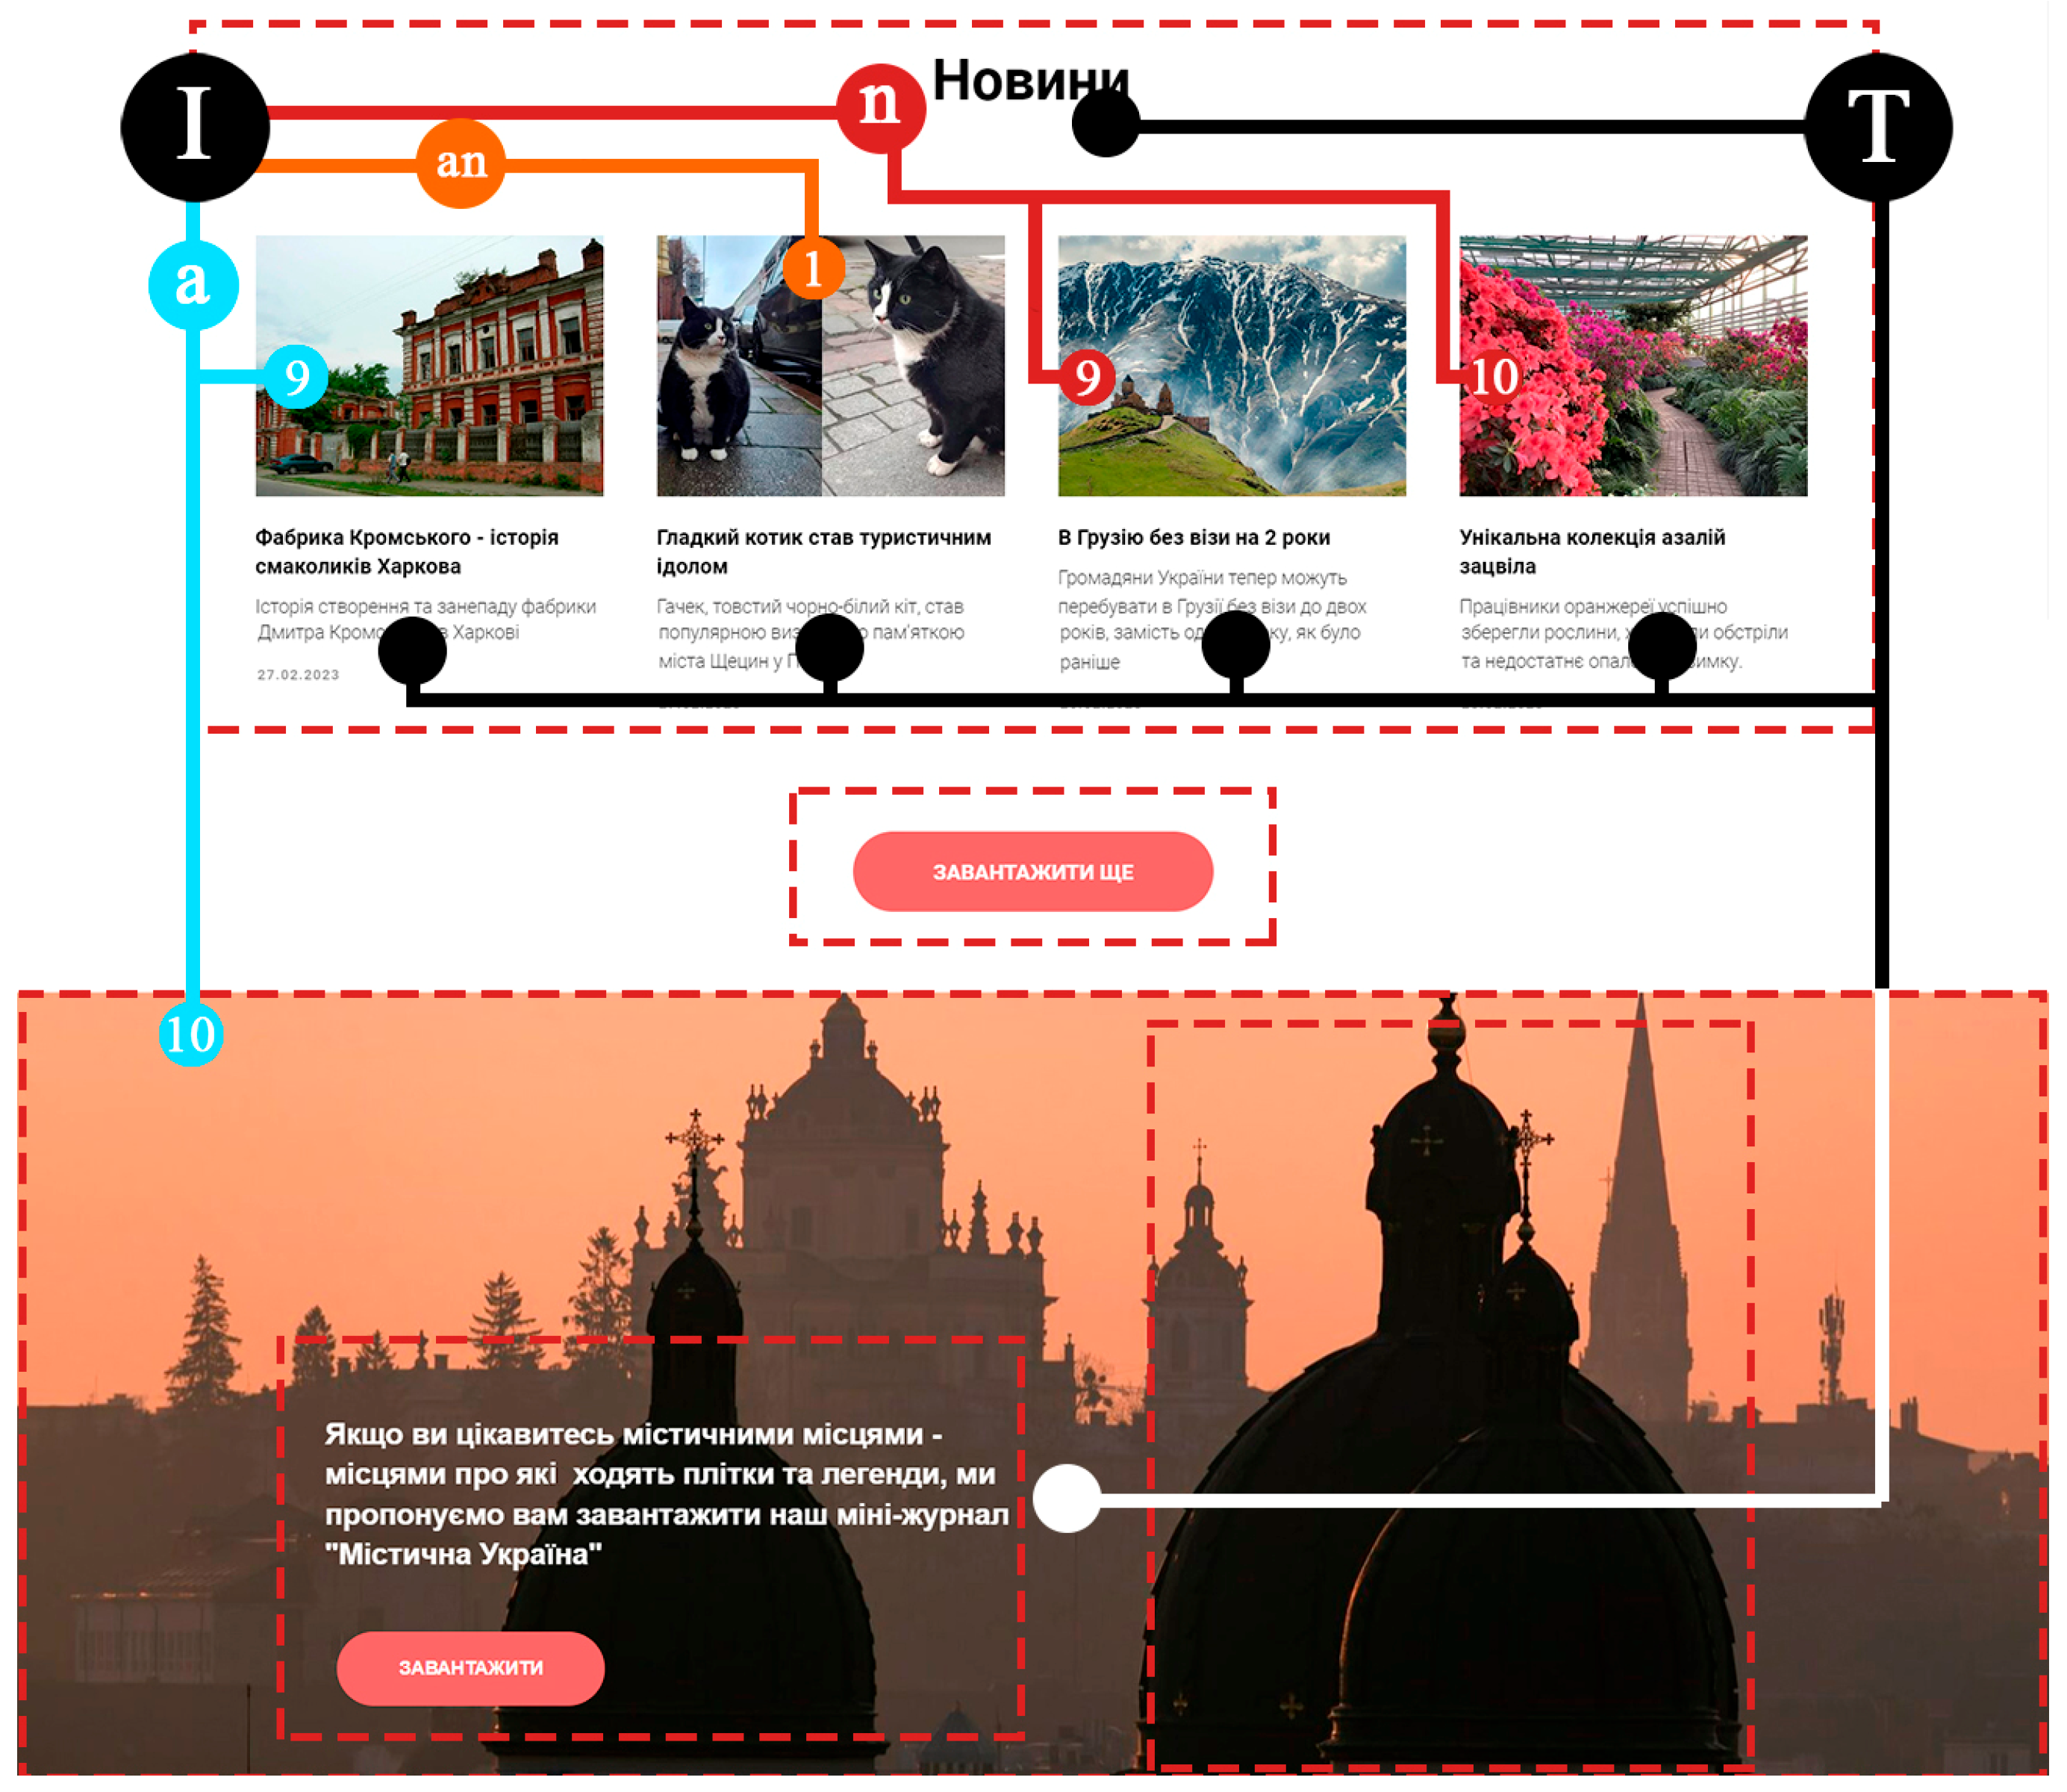
An interesting point in the analysis was the Ian category—animals. The website contained only a single image of an animal (in this case, a cat), and this image recorded the highest fixation time of all blocks—7.59 s.
Overall, based on the obtained data, it can be concluded that the Ip (people) category attracts more user attention than the other categories, regardless of pose, angle, or clothing. However, when comparing individual objects within this category, specifically from Ip3–Ip5 (people in authentic clothing, photographed in motion) to Ip6–Ip8 (regular portrait photos in static), people show more interest in the first group—an average of 3.3 s compared to 1.3 s, respectively.
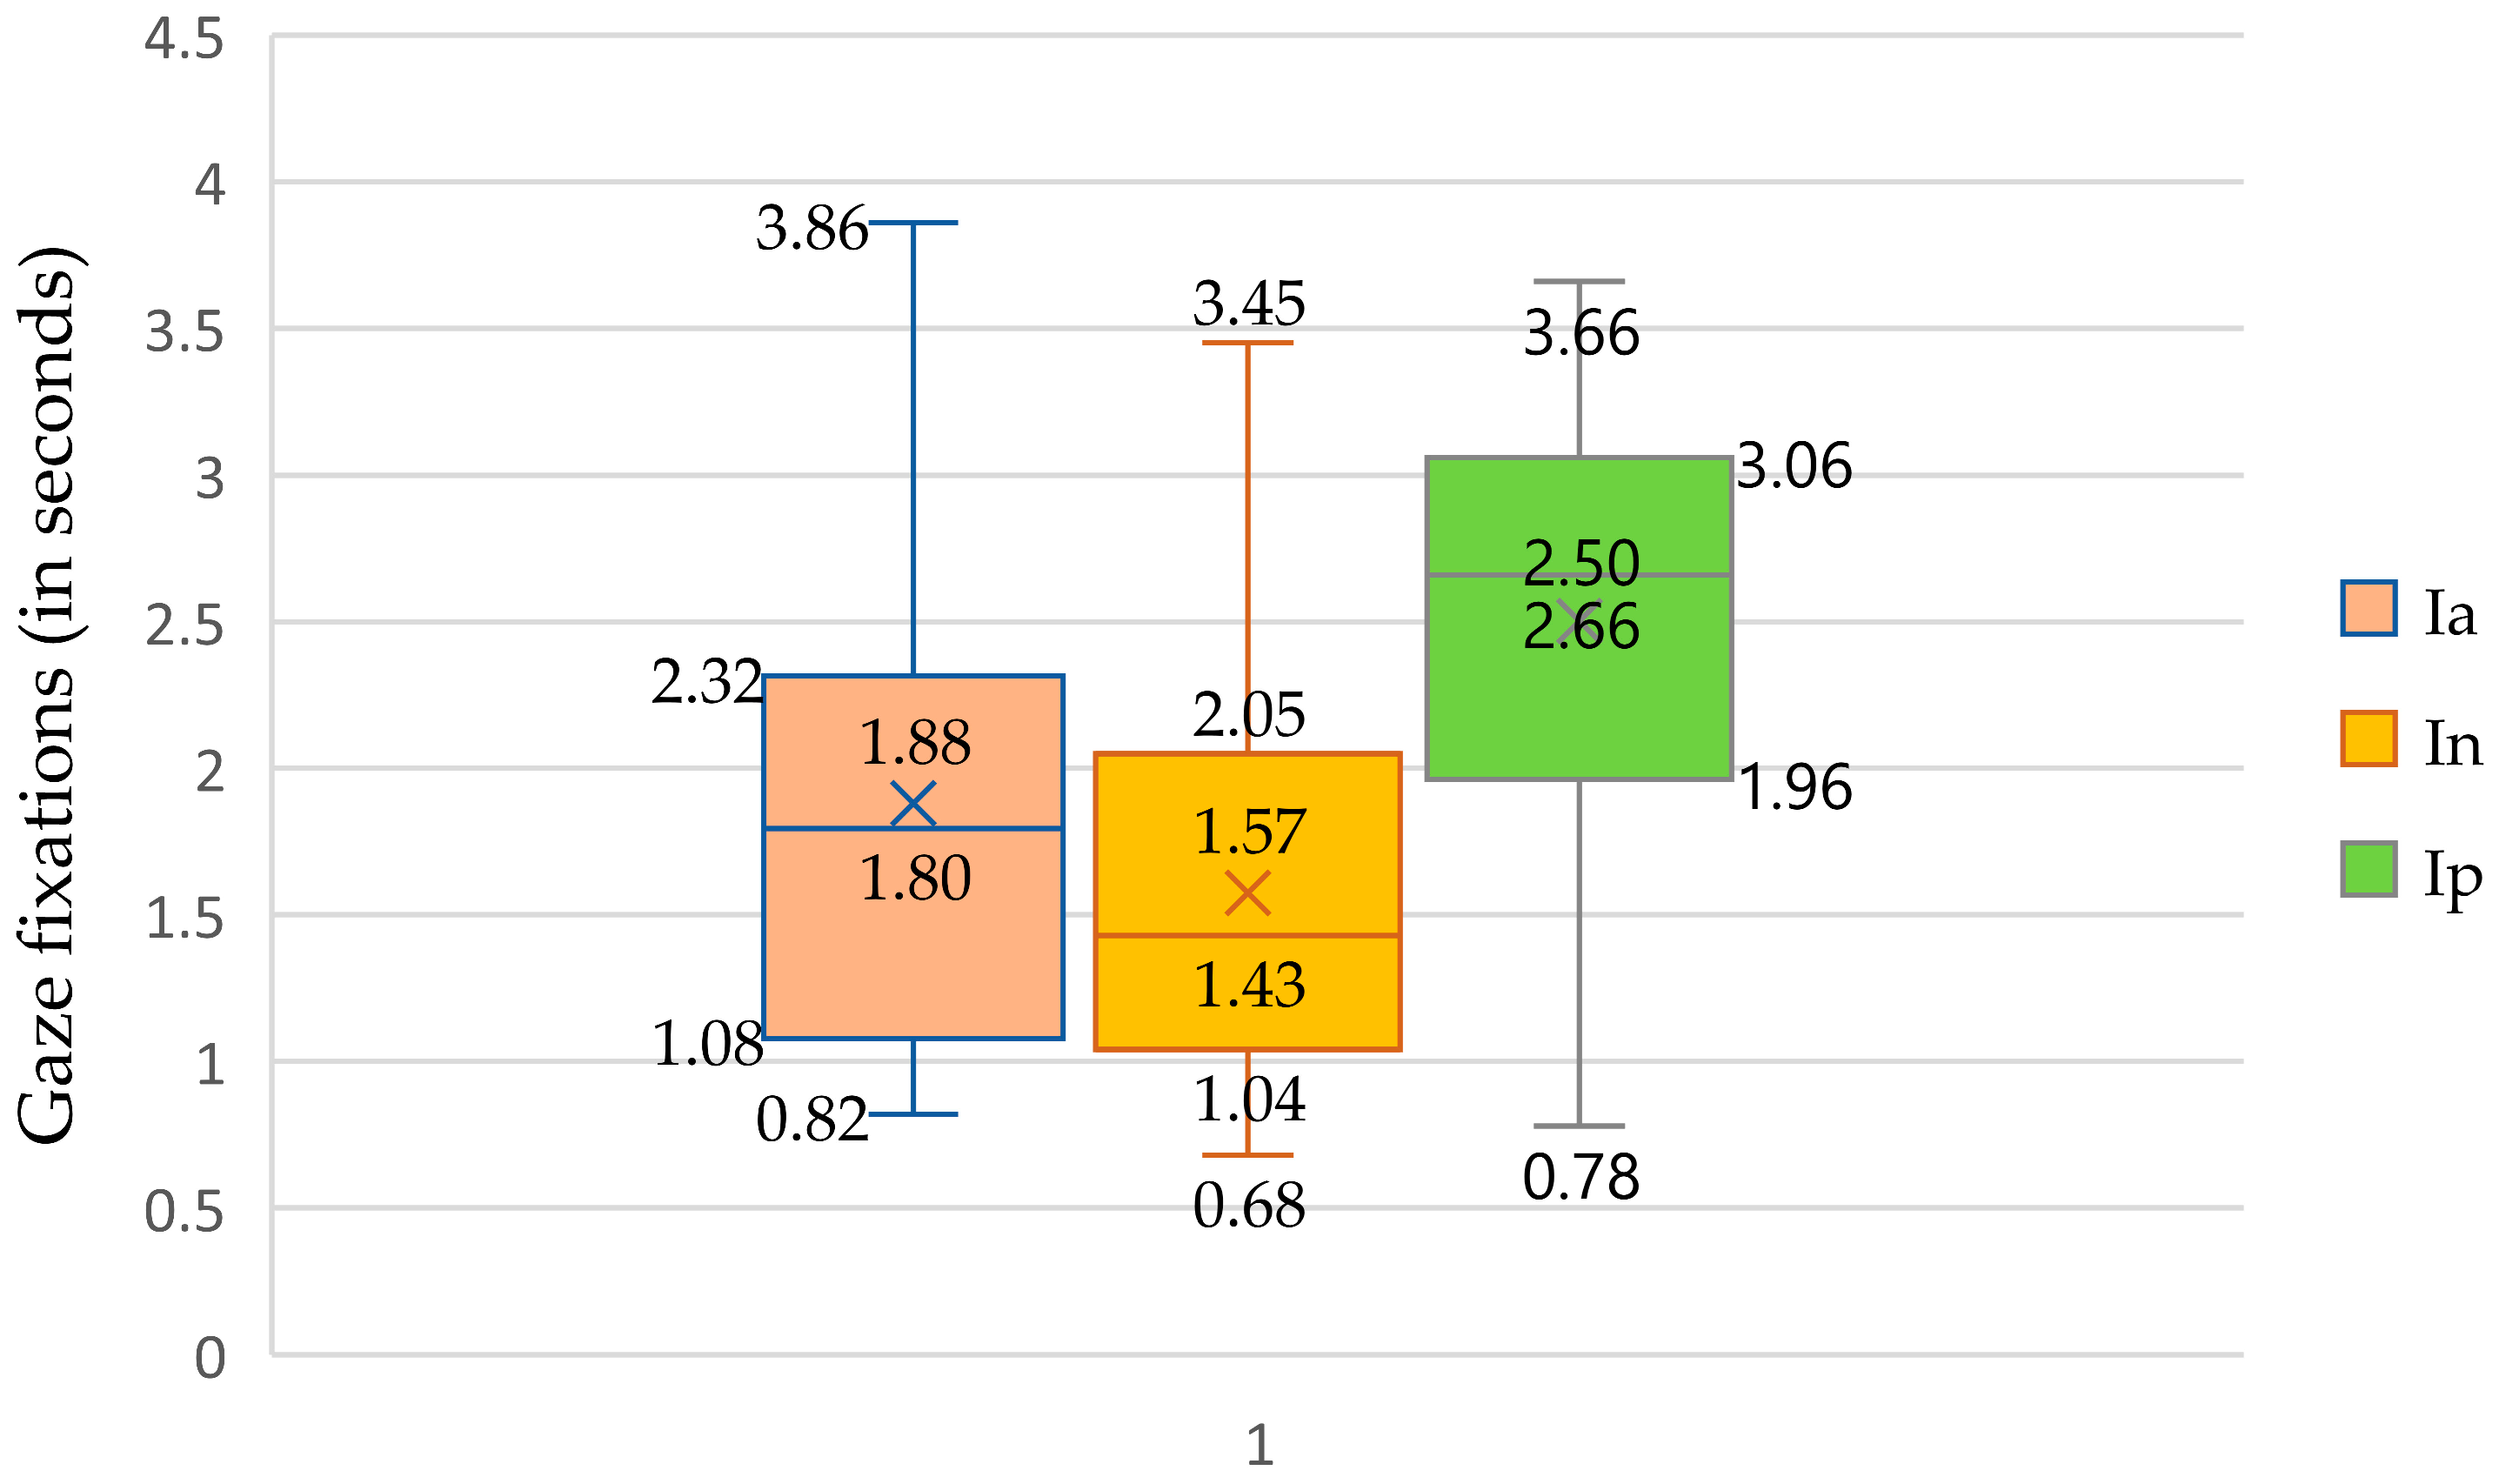
According to the data presented in
Figure 10, the Ip category generally generates more interest among respondents. Nevertheless, the dispersion of Ip and Ia is approximately the same. Images in the In category (nature landscapes) generate less tourist interest. However, this study lacks sufficient statistical power and is more about exploring the potential use of this technology for addressing various issues in the context of domestic tourism marketing.
People (Ip) category: The box plot shows that the average gaze fixation on the Ip category is notably higher, with a median of approximately 2.66 s, compared to 1.88 s for Ia and 1.57 s for In. The upper quartile for Ip extends to about 3.66 s, suggesting that specific images within this category captured attention for extended periods. This further supports the conclusion that the Ip category is the most engaging.
Architecture (Ia) category: The fixation duration for Ia is lower, with a median of approximately 1.8 s, with data ranging up to 3.86 s. Although some images did attract attention, on average, architecture was less engaging than images of people.
Nature (In) category: The median gaze duration for In was 1.57 s, and the data extends to a maximum of 3.45 s. Like architecture, nature images attracted less attention than people.
Subcategory comparison within Ip: The experiment revealed a significant difference between subcategories within Ip. Specifically, dynamic images of people in authentic clothing (Ip3–Ip5) were more engaging, with an average fixation time of 3.3 s, compared to static portrait photos (Ip6–Ip8), which only held attention for an average of 1.3 s. This suggests that movement and authenticity in people-focused images are key factors in capturing viewer interest. When considering the possibilities of this technology, it is important to note the potential for analyzing respondents’ emotional reactions. Currently, the technology enables assessing concentration levels and various emotional responses while participants view specific content.
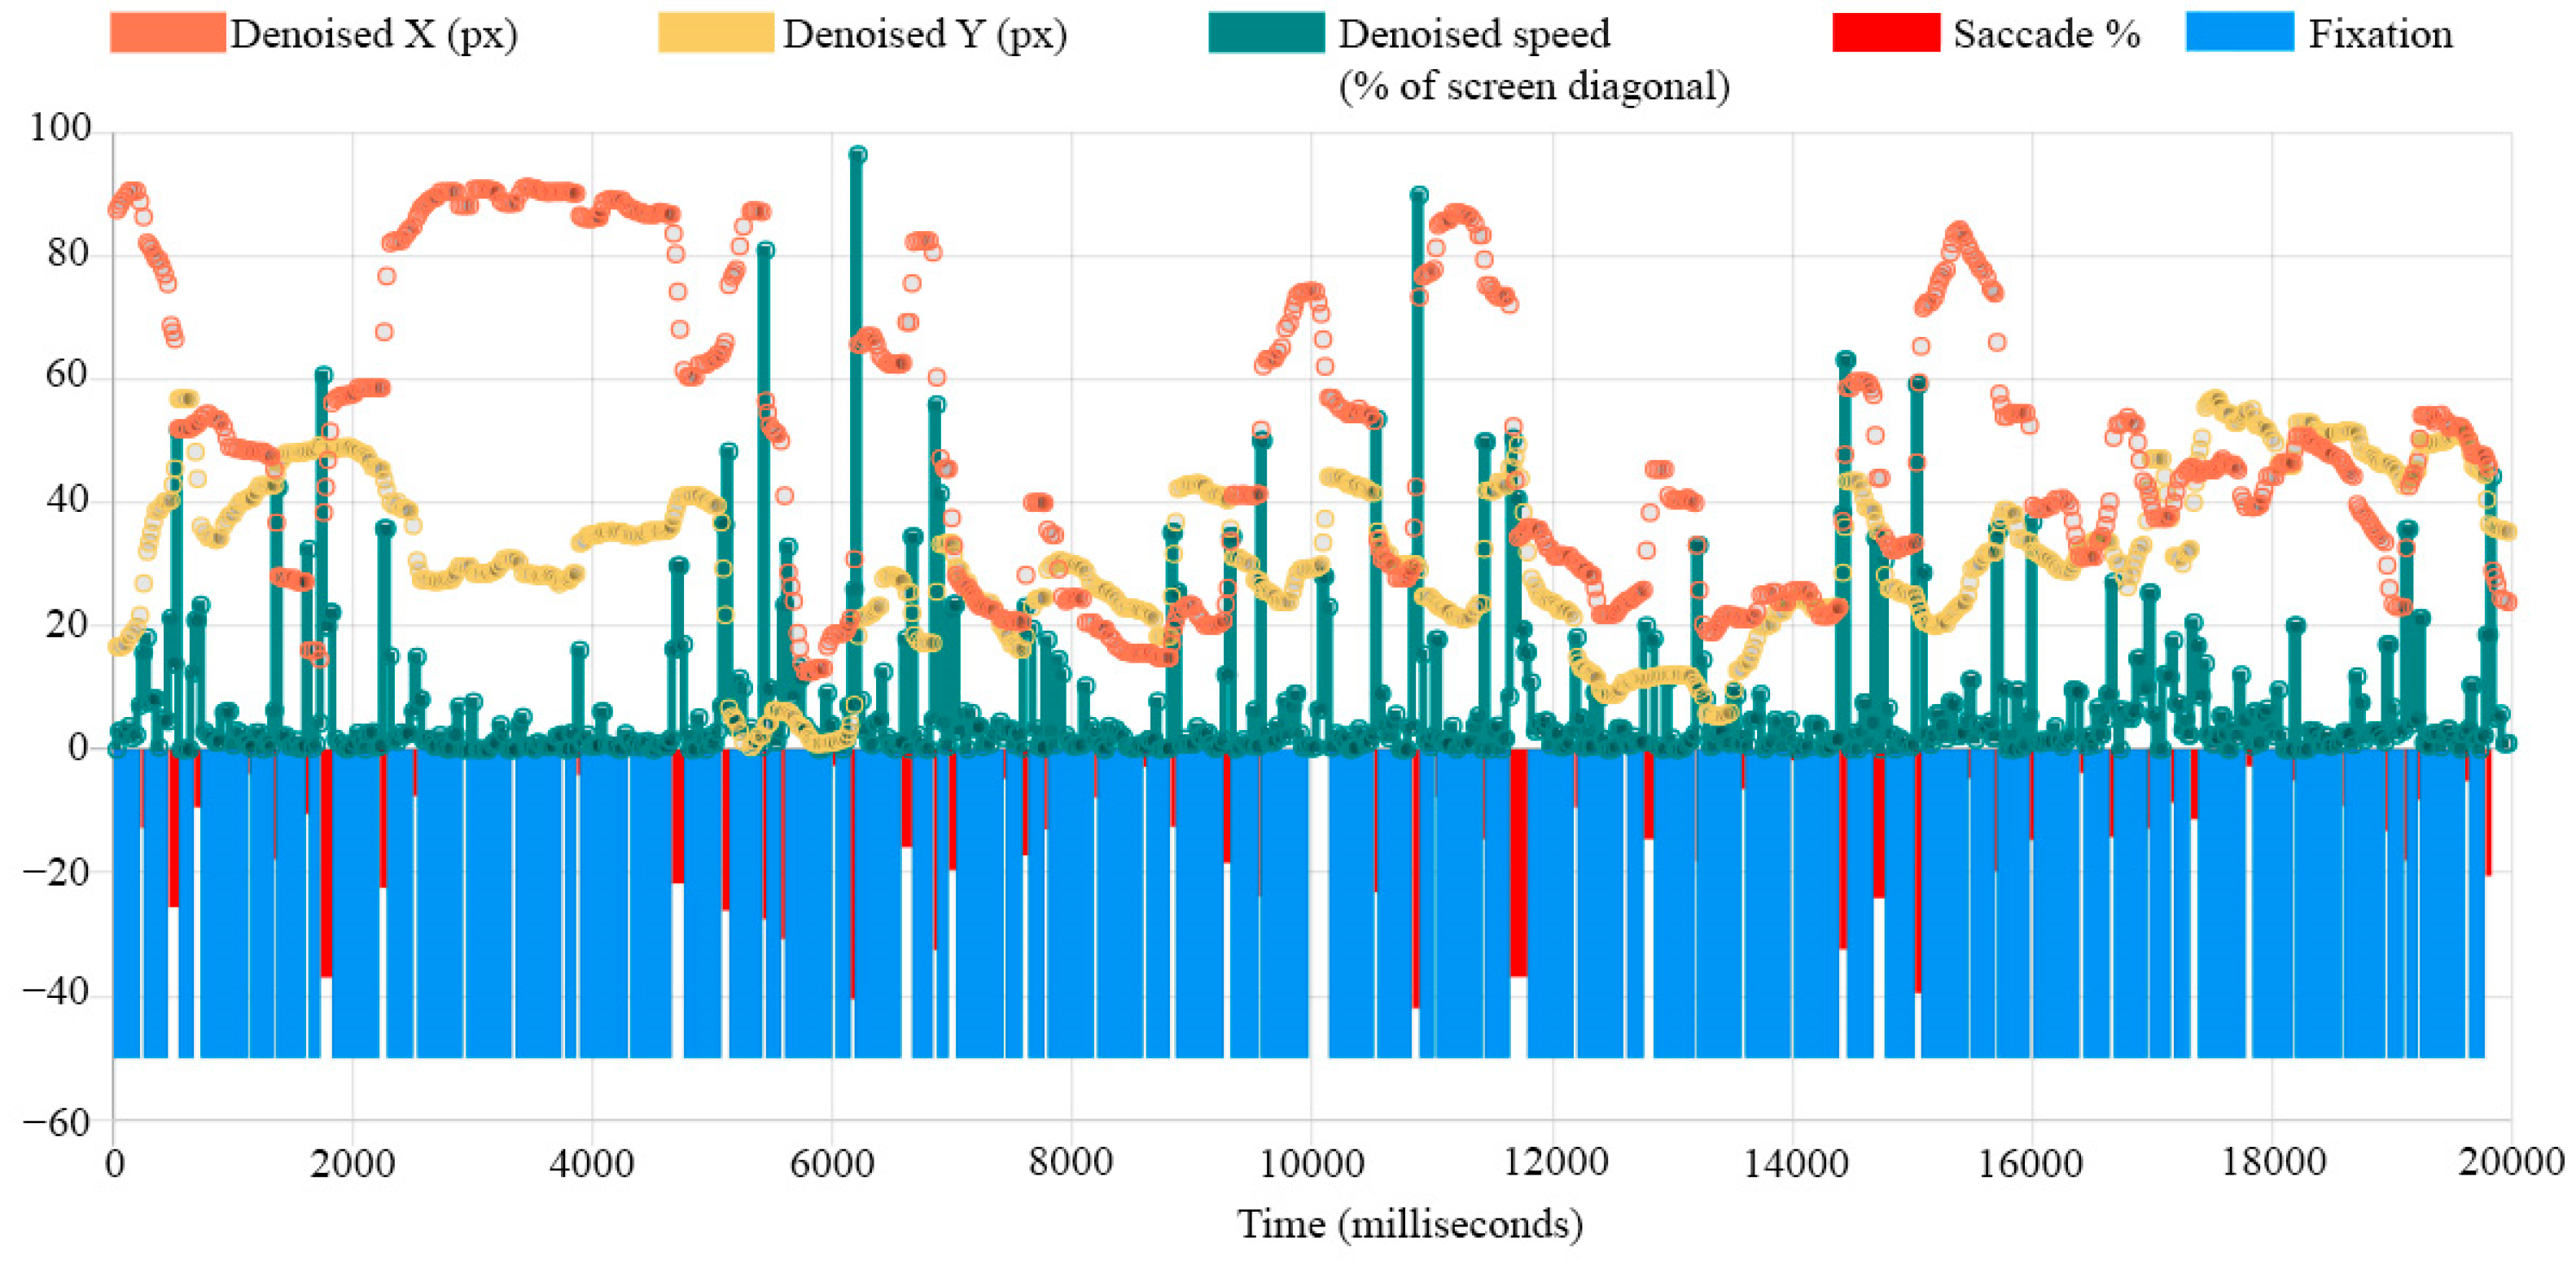
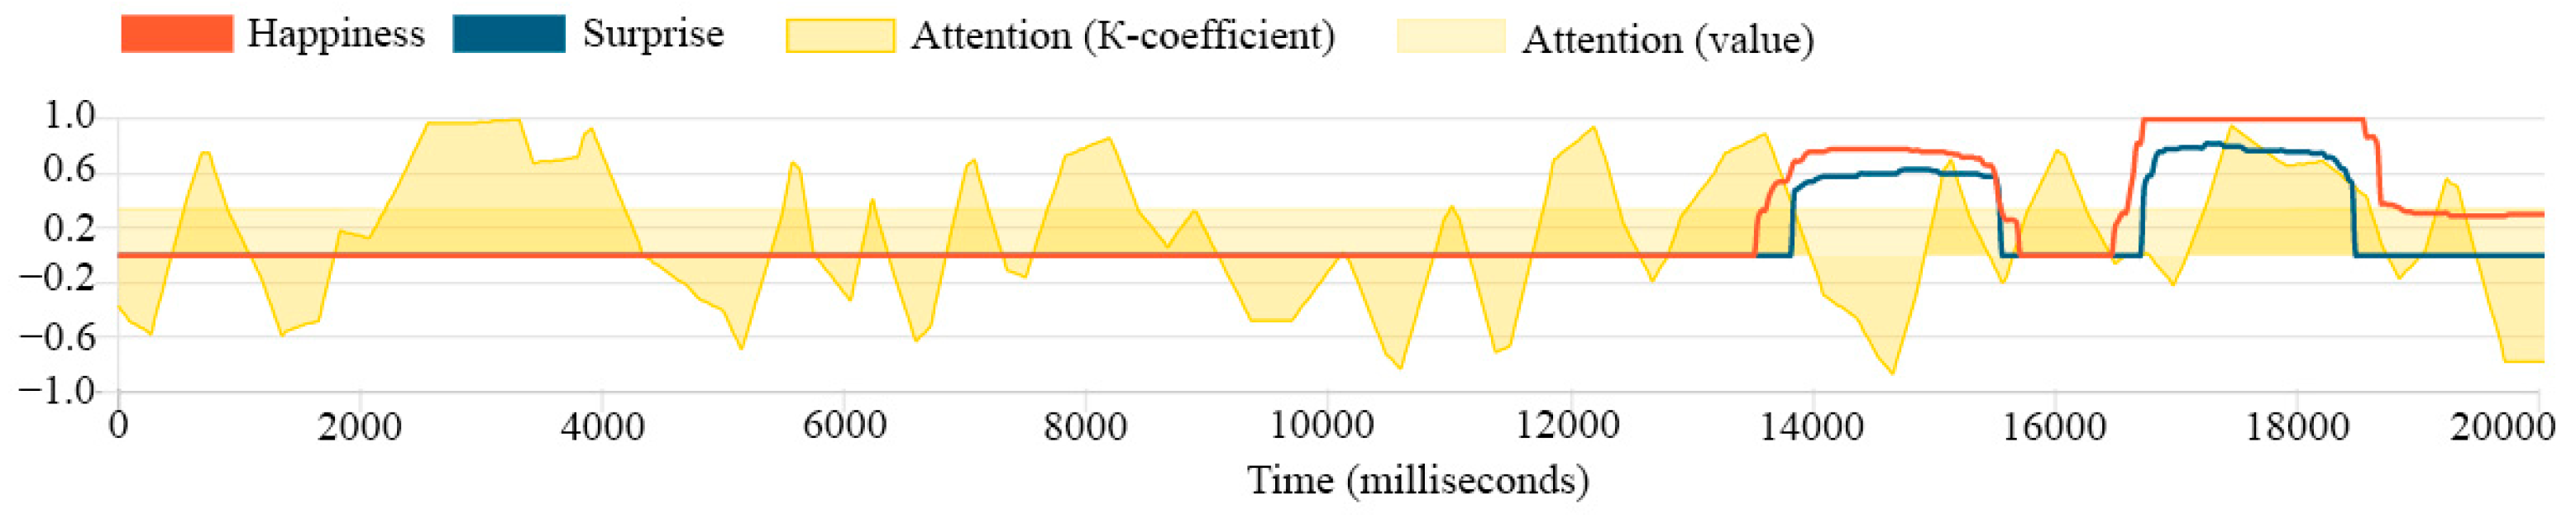
Figure 11 and
Figure 12 present the metrics of one of the respondents. In
Figure 11, two emotional peaks can be tracked which, as it turned out, were caused by the Ian1 object—an image of a cat illustrating one of the news stories. No other emotional peaks were recorded throughout the site review.
Emotions are an important component in analyzing metrics and in selecting visual objects to form a destination image. Gaze fixation does not answer the question of what emotions the respondent is experiencing, which may include negative reactions—disgust, anger, revulsion, etc.
Forming a unified vision of a destination for potential tourists is a complex task that requires a systematic and comprehensive approach. One of the key elements of this approach is developing a strong visual component for advertising campaigns. Eye-tracking technology enables campaign developers to create content that genuinely captures the interest of potential tourists.
This is achieved by selecting the most effective images, in terms of the fixation and interest of potential consumers, for use in advertising materials, on informational websites, and in social media. Eye-tracking technology facilitates the analysis of people’s reactions to various visual elements and the placement of objects on the screen, helping campaign developers create more effective content. Overall, eye-tracking technology can support the sustainable development of tourism by promoting the formation of a favorable and unified visual image of the destination for potential tourists.
5. Discussion
The experimental results indicate that dynamic images of individuals in authentic clothing elicited significantly higher visual attention than static portraits or representations of architectural and natural elements. This observation is consistent with prior research emphasizing the inherent salience of human faces and motion within visual stimuli (
P. Li et al., 2023). The findings corroborate the importance of dynamic and culturally specific imagery in enhancing viewer engagement in tourism marketing contexts (
Ortanderl & Bausch, 2023).
Furthermore, participants’ tendency to initially focus on familiar geographic regions within the presented map suggests that personal relevance greatly influences visual attention allocation, a phenomenon previously documented in tourism perception studies (
Navrátil et al., 2012). This indicates that individual background factors may systematically shape the cognitive processing of destination imagery.
The principal contribution of this study lies in the proposed measurement framework, which combines fixation duration, first gaze fixation, and sequential gaze order as integrated indicators of visual engagement. This structure provides a replicable basis for subsequent research aiming to evaluate the effectiveness of visual stimuli in tourism-related digital environments. Future methodological enhancements may incorporate emotional arousal metrics or cognitive load assessments, facilitating a more comprehensive analysis of user interactions with tourism content.
However, this study is subject to certain limitations. The relatively small sample size and cultural specificity of the sample may constrain the generalizability of the results. Further investigations employing larger and more diverse populations and cross-cultural comparisons are necessary to validate and extend the applicability of the proposed framework.
6. Conclusions
Implementing eye-tracking technology has demonstrated significant potential across various scientific domains, including cognitive psychology, neuroscience, and human–computer interaction, offering quantitative and qualitative insights into human behavior. For example, eye-tracking has been extensively employed in cognitive psychology to measure visual attention and information processing (
Wolf & Ueda, 2021). Research indicates that eye-tracking data can reveal how individuals allocate attention when presented with complex visual tasks, with fixation durations typically ranging between 200 and 600 milliseconds, depending on task complexity and cognitive load (
Moro et al., 2010).
The theoretical implications of the present research extend to the fields of tourism marketing and consumer psychology. This study supports integrating advanced visual perception models into marketing theory by demonstrating that specific visual cues, particularly dynamic images of people in authentic settings, significantly enhance user attention. This suggests that traditional tourism marketing strategies often rely on self-reported measures that could be substantially improved by incorporating objective attention-tracking metrics. Consequently, future marketing models should account for conscious and subconscious factors influencing consumer decision-making.
Empirical evidence from related research also highlights the importance of visual placement. For instance, a study on user interaction with digital interfaces found that participants spent approximately 70% of their time fixated on the upper half of webpages, emphasizing the critical role of content positioning in user experience optimization (
Simola et al., 2011). Similarly, advertisements placed at the center of screens were shown to attract up to 40% more visual attention than those positioned peripherally, leading to strategic adjustments in advertising design and improved campaign effectiveness.
From a managerial perspective, the current findings offer practical insights into optimizing tourism advertising strategies. The demonstrated advantage of dynamic, authentic imagery suggests marketers should prioritize using people-centered visuals that evoke cultural or emotional resonance. Furthermore, eye-tracking data provide a powerful tool for identifying the most engaging elements within promotional content, facilitating more targeted, evidence-based marketing strategies. This approach may enhance engagement rates, strengthen brand recall, and increase tourist flows.
Nevertheless, it is important to acknowledge the limitations of eye-tracking as a standalone method. While eye-tracking excels in capturing overt attentional patterns, metrics such as fixation duration, saccade length, and pupil dilation do not directly reveal the underlying cognitive or emotional states that drive these visual behaviors. To address this limitation, researchers increasingly advocate for the combination of eye-tracking with complementary physiological methods, such as electroencephalography (EEG) or functional magnetic resonance imaging (fMRI) (
Katus et al., 2019). Such multimodal approaches enable a deeper understanding of visual engagement’s cognitive and emotional dimensions.
The primary objective of this study was to demonstrate the potential of applying eye-tracking technology for the optimization of visual content in tourism marketing. Rather than aiming for comprehensive generalizations, the research focused on exploring initial patterns of visual engagement and highlighting methodological approaches that could be further developed and validated in subsequent studies. The experimental design was intended to illustrate the feasibility of using objective visual attention metrics, such as fixation duration, first gaze, and gaze sequence, as practical tools for refining marketing strategies and enhancing destination image formation.
In conclusion, eye-tracking technology provides a precise and robust method for investigating human visual attention, offering critical insights for optimizing digital content and marketing materials. However, to fully understand the complexity of user behavior, future research should consider integrating eye-tracking with additional psychophysiological techniques. This holistic methodological approach would enable a more comprehensive and nuanced visual processing analysis, benefiting theoretical models and practical applications across tourism marketing and related fields.
The principal limitation of the present study is the small sample size, which constrains the generalizability of the findings. Limited statistical power necessitates cautious interpretation, and future research should aim to validate these results using larger, more diverse samples. Additionally, the study’s focus on domestic tourism within Ukraine may limit the applicability of the findings to broader international contexts. Finally, individual differences in visual perception stemming from prior experiences, cognitive styles, or cultural backgrounds were not explicitly controlled for, suggesting another avenue for refinement in future investigations.
7. Future Research
Future research will continue focusing on applying eye-tracking technology within the tourism industry. Future studies will explore how tourists interact with digital content, such as websites, virtual tours, and mobile applications, across different journey stages—from the planning phase to the on-site experience and post-visit sharing. The research will identify patterns in tourists’ visual engagement, determining what elements capture their attention and what may cause friction or disinterest.
Plans include examining the effectiveness of visual cues on tourism websites, specifically, how they guide users to essential information like booking options or destination highlights. By analyzing eye-tracking data with metrics like time spent on a page and conversion rates, the research will aim to assess and improve the design and functionality of tourism websites.
Additionally, a future study will focus on understanding how tourists’ attention shifts during in-person experiences, such as guided tours or museum visits. This will help optimize the design and layout of attractions, enhancing visitor engagement and overall satisfaction. The goal is to develop more intuitive and user-friendly digital tools for tourism marketing and improve on-site experiences, leading to greater visitor satisfaction and increased revenue within the tourism sector.


