Article

Contributions of Sustainable Tourist Behavior in Food Events to the Cultural Identity of Destinations

by
María-Dolores Sánchez-Sánchez
1,*,
Carmen de Pablos-Heredero
2 and
José Luis Montes-Botella
1
1
Department of Applied Economy, Rey Juan Carlos University, 28032 Madrid, Spain
2
Department of Business Organization, Rey Juan Carlos University, 28032 Madrid, Spain
*
Author to whom correspondence should be addressed.
Tour. Hosp. 2025, 6(2), 93; https://doi.org/10.3390/tourhosp6020093
Submission received: 20 March 2025 / Revised: 15 May 2025 / Accepted: 19 May 2025 / Published: 22 May 2025
(This article belongs to the Special Issue Innovations as a Factor of Competitiveness in Tourism 2.0)

Abstract

:
Gastronomic event tourism is an emerging phenomenon that attracts an increasing number of tourists seeking a memorable gastronomic experience based on its cultural uniqueness, highlighting the need to understand the behavior of this tourism demand. This study proposes a model to determine the importance of food tourism events in developing the cultural identity of tourist destinations by analyzing the tourist experience concerning their motivation, satisfaction, and loyalty, understood as variables of sustainable tourism behavior. The hypotheses in the model have been tested using non-linear structural equations modeling (SEM), estimated with data from the Resident Tourism Survey of the National Statistics Institute (NSI), on domestic demand for value-added gastronomic tourism in Spain. The data analyzed covers the period from January 2019 to December 2022 (n = 3483). The results show a significant relationship between the variables influencing overall tourist satisfaction with gastronomic events and tourist loyalty. This research provides knowledge on the behavior of gastronomically motivated tourists with practical implications for destinations, aimed at improving decision-making in the definition of tourism strategies, focusing on the preservation and enhancement of their gastronomic offer as a cultural identity through the offer of food events.

1. Introduction

After COVID-19, the trend, driven by tourists during the pandemic, of choosing national destinations with a lower tourist flow and cultural offer has continued. This has consolidated proximity tourism, deseasonalisation, and tourist ethnocentrism (Zenker & Kock, 2020). This shift has encouraged the development of new, less overcrowded destinations and more sustainable tourism (Santos-Roldán et al., 2020). It confirms that sustainable tourism development results from the behavior of tourism demand. Tourists are aware of the need to limit mass tourism’s growth and prefer economically, environmentally and socially sustainable options (Cottrell et al., 2004).
This scenario requires a balance between new tourism products that are attractive to consumers, respectful of destinations, and sustainable in the three dimensions mentioned (Streimikiene et al., 2021). In this sense, various studies consider that gastronomic tourism, through the local food offered to visitors, has an essential influence on the economic, environmental, and social sustainability of destinations (Sims, 2009; Leer, 2020; Apak & Gürbüz, 2023; Estrada et al., 2023). Gastronomic tourism also helps preserve and disseminate local culinary traditions. A satisfactory gastronomic experience results from a sustainable intercultural encounter between tourism and the preservation of food customs (Everett & Aitchison, 2008; Sims, 2009).
In the case of food tourism events, social sustainability is a central aspect. These events must integrate social, cultural, and community considerations in the planning and management of these events to help create the cultural image of the destination (Hjalager & Johansen, 2013). These include, among others, preserving cultural heritage by promoting local gastronomic traditions and being a channel for transmitting authenticity to visitors (Fusté-Forné, 2016). In addition to enabling the social cohesion of the local community (López-Guzmán et al., 2017; Le et al., 2024).
In tourism, several empirical studies have analyzed the causal relationships between various factors and satisfaction (Yoon & Uysal, 2005; Chi & Qu, 2008; Eusébio & Vieira, 2013; Domínguez et al., 2017) and specifically for festivals (Molina-Gómez et al., 2021). However, according to the review of the scientific literature to date, there is no significant empirical research using non-linear models to explore these relationships (Sánchez-Sánchez et al., 2021).
The elements addressed confirm the importance of the relationships between tourism, sustainability and tourist satisfaction. Therefore, it is necessary to study these aspects in depth by analyzing the behavior of the demand for gastronomic events. Providing information on how this segment of demand has changed during and after the pandemic is essential. This will help to design memorable experiences that increase tourist satisfaction and develop specific tourism promotion and marketing policies and actions based on enhancing the value of gastronomy. As well as its social sustainability and competitiveness within the tourism market.
Therefore, this study aims to evaluate the role of food event tourism in developing the cultural identity of tourist destinations. It focuses on the experience of food events in Spain, concerning the satisfaction and loyalty of gastronomically motivated tourists. These are understood as variables of sustainable tourism behavior. They are linked to enhancing the value of the gastronomic traditions of the destination by allowing the tourist to get to know the cultural identity of the place through the activities carried out at food events. Ultimately, the values perceived and experienced by tourists also contribute to the sustainable growth of a tourism destination (Azinuddin et al., 2022).
A non-linear structural equation model (SEM) was proposed to determine the significance of the relationships of the hypotheses raised. It uses data from the Spanish National Statistics Institute (NSI) Resident Tourism Survey on domestic demand in Spain. Value-added gastronomic activities have been used as a proxy variable to analyze tourists’ experiences of food events. The sample covers data from January 2019 to December 2022.
This research provides knowledge on the behavior of gastronomically motivated tourists. It offers practical implications so that tourist destinations with gastronomic events to define tourism strategies that conserve and enhance their culinary identity. It also contributes to a greater understanding of the sociodemographic characteristics that influence sustainable social behavior through the satisfaction of food event tourists.
After this introduction, Section 2 presents the conceptual framework and the hypotheses. Section 3 describes the methodology of analysis, and Section 4 presents the results. Section 5 provides the discussion, and Section 6 presents the conclusions.

2. Conceptual Framework and Literature Review

2.1. Gastronomy as a Value for Preserving the Cultural Identity of Destinations

In its report, the World Tourism Organization (UNWTO, 2012) points out the importance of food as an integral part of all cultures and a relevant component of the world’s intangible heritage. Gastronomic tourism thus includes intangible characteristics linked to moral qualities or cultural authenticity.
The enhancement of local gastronomy by cultural tourism (Hall & Mitchell, 2007), as an expression of a culture, has led to an increasing number of tourists whose primary motivation is to engage in gastronomic activities and events. These tourists seek to enjoy traditional local products, flavors, or unique gastronomic events (Kivela & Crotts, 2006; Y. G. Kim & Eves, 2012), aiming for a unique and authentic gastronomic experience. Traditional local food is associated with authenticity and is memorable as part of the history and cultural identity of the place visited (Tsai, 2016; Ellis et al., 2018). Each destination, region, or country becomes linked to its culinary offerings (Björk & Kauppinen-Räisänen, 2014), making food a symbol of collective identity.
The literature has proven the role of local food in enhancing the value creation of destinations in terms of tourism social sustainability by fostering their cultural identity (Everett & Aitchison, 2008; Q. Chen & Huang, 2019). Tourists support local restaurants and food events to fulfill gastronomic expectations, integrating into the destination’s food culture and reinforcing its social sustainability (Sims, 2009).

2.2. Tourist Satisfaction as a Variable of Social Sustainability in Destinations

Among the sustainability principles for tourism activity (UNWTO, 2004) is respecting the socio-cultural authenticity of the destinations visited, which form part of the identity of each territory. This aligns with the post-modern tourist who seeks authentic and unique experiences, such as gastronomic experiences, to get to know the cultural identities of the place visited (Fusté-Forné, 2019), thus promoting the revaluation of the community’s identity.
To achieve this, tourists must obtain high levels of satisfaction through a meaningful experience, which makes their behavior socially sustainable with the destination and favors respectful exchange between the community and visitors As a result, tourists develop an appreciation for the cultural identity of the destination. Tourist satisfaction thus plays a critical role as an indicator of sustainable tourism (UNWTO, 2004). It is essential to analyze the variables influencing this construct to better understand and promote sustainable tourism practices.

2.3. Types of Variables That Influence Tourist Satisfaction

This section reviews the conceptual foundations of the various factors influencing cultural tourist satisfaction, focusing on the variables included in the Resident Survey (NSI) used in the proposed model. A systematic review of the scientific literature was conducted using the Web of Science and Scopus databases. The keyword used was gastronomic tourist satisfaction, and the review covered the period from 2000 to 2024. A total of 30 articles directly related to the research topic were selected. Table 1 below presents the ten most relevant contributions and the justification for the variables used, based on the reviewed literature.
Tourist satisfaction is a complex concept influenced by several attributes such as the destination type, the tourist’s sociodemographic profile (C. Chen & Chen, 2010), the primary motivation for traveling, or the activities undertaken (Yoon & Uysal, 2005). Local gastronomic experiences also influence their satisfaction (Björk & Kauppinen-Räisänen, 2014; Babolian Hendijani, 2016).
Tourist satisfaction involves both tangible and intangible elements. Tangible aspects include the destination’s resources, infrastructure, and climate. Intangible elements. On the other hand, intangible elements are linked to emotions and the fulfillment of expectations. The latter are complex factors to measure but are highly influential (Fernández & Picos, 2005).
Satisfaction also includes a positive evaluation of the activities and experiences carried out at different times. Those carried out during their stay at the destination, as well as those derived from the trip preparation, create the expectations of the consumer-visitors and evaluate the experiences after “consuming” the tourist destination.
In short, satisfaction is influenced not only by the relationship between benefit and reward but also by factors related to the consumer (cultural, personal, or experiential) and others outside the consumer.
Following the above, this study classifies the variables into endogenous and exogenous categories for the satisfaction analysis. This classification follows previous research that distinguishes between internal and external factors affecting tourist behavior (Bigné et al., 2001). Thus, the different attributes of the gastronomic tourist (income level, culture, age, and gender) are called endogenous variables. Exogenous variables are related to the characteristics of the destination, in this case, to its geographical location, as they are the indicators in the Residents’ Survey included in the model (NSI, 2016).
The following is a review of the conceptual foundations in the scientific literature of the different factors that make up the proposed model.

2.3.1. Endogenous Variables: Attributes of the Gastronomic Tourist

Several studies have analyzed how the sociodemographic characteristics of food tourists influence their choice of destination and tourism experience.
Previous studies describe that most culinary tourists are women (Pérez-Priego et al., 2019; Carvache-Franco et al., 2018). Gender has been found to affect, as a discriminating factor, perceptions of the destination, being more positive in the case of women (Callan & Bowman, 2000). Gender would also influence motivation, being more linked to knowledge acquisition in women and, therefore, more attracted to gastronomic destinations than men. However, some studies do not find gender differences in cultural motivation or satisfaction with the destination’s infrastructure and resources (Bautista et al., 2015).
Concerning age, food tourists are more likely to sample local food and beverages the higher their age profile and monthly income, as they have time and money (Balderas-Cejudo et al., 2019; Nicoletti et al., 2019). However, this relationship is not present in other research that places the food tourist in the 35–45 age segment (Correia et al., 2013; Getz et al., 2015). There are also no significant differences in the spending of gastronomic tourists among the Baby Boomers, Generation X, and Millennials (Williams et al., 2018).
The level of education of gastronomic tourists is high, with university or secondary education (Jiménez Beltrán et al., 2016; Valverde-Roda et al., 2023) and a monthly income of over 2,000 euros (Pérez-Priego et al., 2019). However, some analyses show that the level of education is not an explanatory variable for the consumption of typical local foods. This level of education would positively impact satisfaction by providing a better understanding and interpretation of the cultural resources visited. In turn, having higher education would impact a higher level of demand on the part of tourists, which has a decisive influence on their satisfaction (Testa et al., 2019).
Following the review of the conceptual framework, the following hypotheses are proposed:
H1. 
Gender influences the overall satisfaction of food tourists;
H2. 
The age of the food tourists influences their satisfaction;
H3. 
The level of education influences the satisfaction of food tourists;
H4. 
The range of economic income influences the satisfaction of food tourists.

2.3.2. Exogenous Variables Related to Tourism Destination Attributes

The geographical location of the destination, where the food festival takes place, conditions the place of origin of the attendees. Stojanović et al. (2020) confirm that the variables of origin of most visitors is from the same country. This is often driven by a motivation to preserve culinary traditions. As part of a region’s cultural heritage and identity, local cuisine significantly shapes customer satisfaction (Babolian Hendijani, 2016). These cultural and geographical factors are therefore essential in understanding tourist behavior.
As a result of the above, the following hypothesis is posited:
H5. 
The country of destination influences the satisfaction of food tourists.

2.4. The Loyalty of the Gastronomic Tourist

The analysis of loyalty in tourism studies comes from the concept of customer loyalty that applies to the destination, the product category composed of services and products (Backman & Crompton, 1991; Yoon & Uysal, 2005). Just as with products, the consumption of a destination leads to an evaluation that, if positive, results in satisfaction. In this study, satisfaction with the food event is the tourist’s positive response to that type of tourism experience.
In the scientific literature of service marketing, satisfaction is considered an antecedent of loyalty and future purchase behavior (Barlow, 2001). Shifted to tourism, it is analyzed as an antecedent of destination loyalty related to repeated visits and destination recommendation (Kozak, 2001; C. Chen & Chen, 2010).
However, the current centrality of experience tourism (Clatworthy, 2019) calls for a broader theoretical framework that includes intangible elements of the overall experience (Kao et al., 2008). Memorable sensory experiences linked to gastronomy, such as smell and taste, can define a more satisfying personal gastronomic experience (Di-Clemente et al., 2019). Thus, the memory of a positive gastronomic experience allows the tourist to become a prescriber of the cultural identity of a place (Fusté-Forné, 2019; Carvalho et al., 2023).
Therefore, the experience of tourists’ enjoyment of local food can influence the intention to revisit and encourage destination recommendation (Björk & Kauppinen-Räisänen, 2014; San Martín et al., 2018; Wu et al., 2018; Rodríguez-Gutiérrez et al., 2020). Experiential satisfaction thus becomes a key determinant of visitor loyalty (Piramanayagam et al., 2020). In this sense, Q. Chen and Huang (2019) confirm that the gastronomic satisfaction of Chinese tourists is directly related to destination loyalty. Similar findings are reported for food festivals in Malaysia, where tourists express intentions to revisit and recommend the event (Muhammad et al., 2016).
Against this background, the following hypothesis is proposed:
H6. 
Tourist satisfaction with the food event will significantly predict their loyalty to the event.

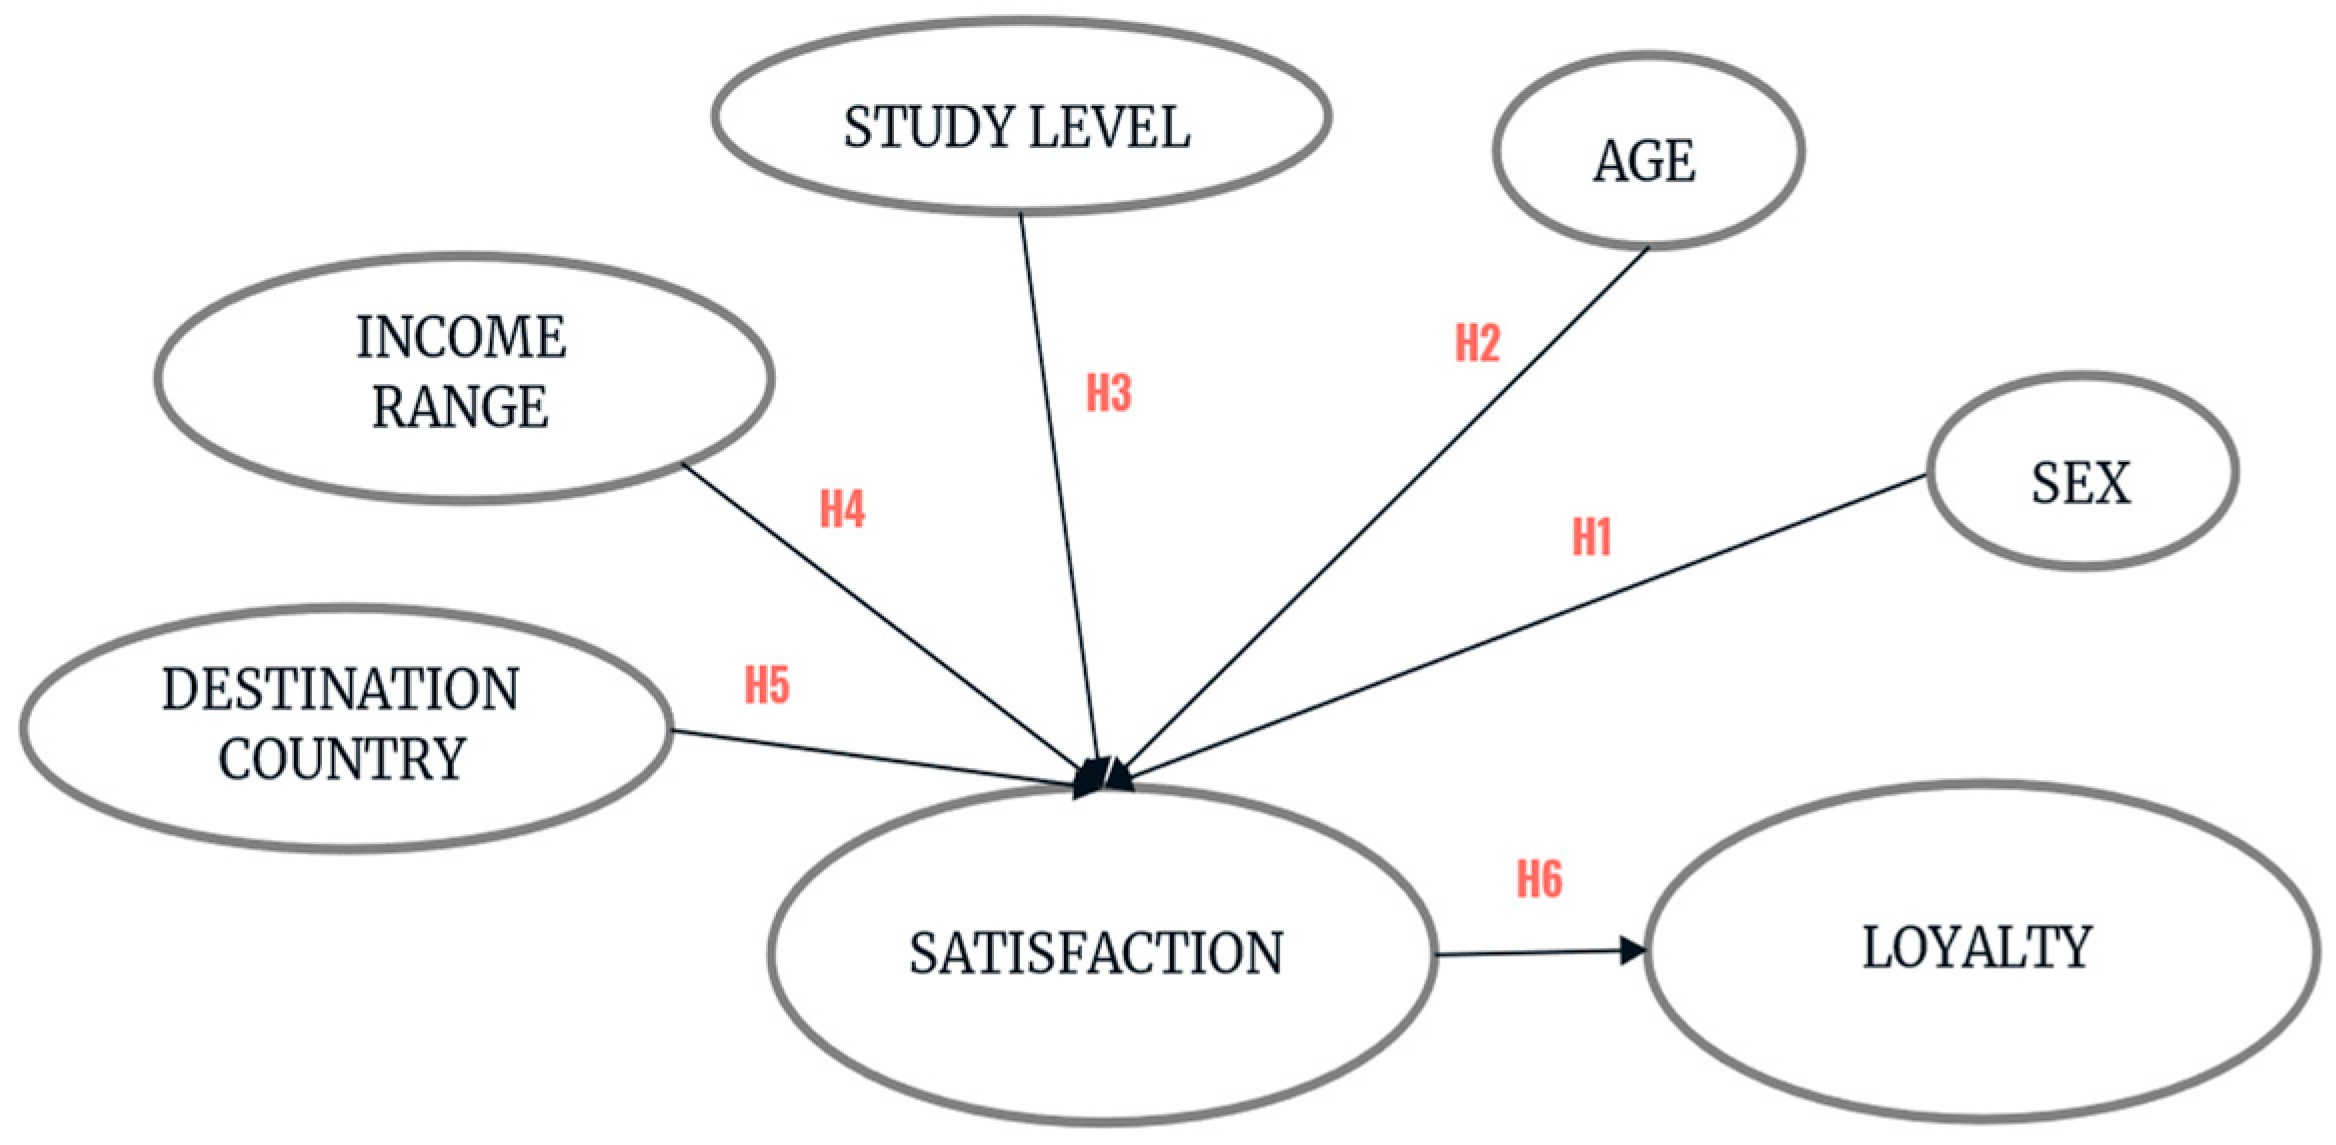
2.5. Proposed Conceptual Model

From the theoretical foundations analyzed, the Resident Tourism Survey questionnaire variables estimated to influence the behavior of gastronomically motivated tourists about gastronomic events have been identified. It allows for the following conceptual model, its interdependent relationships, and specific effects (Figure 1).
The model includes seven factors: age, gender, educational level, income range, destination country, satisfaction, and loyalty. The relationships between the hypotheses are established between the five independent variables (age, gender, educational level, income range, and destination country) with the dependent variable, overall satisfaction. Satisfaction, in turn, is linked to tourist loyalty to the food event.
Each factor is integrated and measured by indicators: two indicators for the gender factor (male/female), one for the age factor, four for the different levels of education, seven for the different household income ranges; two indicators for the travel factor, depending on whether the destination is Spain or abroad.
Overall satisfaction is composed of a single indicator, as is the loyalty factor. In this study, tourist loyalty to the food event is investigated from the behavioral theory, estimated through repeat visits to the gastronomic event from January 2019 to December 2022, as it is the indicator used in the Resident Tourism Survey (NSI, 2016).
The total number of indicator variables that make up the model is 18.

3. Methodology

3.1. Data

The data, empirically contrasted for estimating the model and the stated hypotheses, have been obtained from the National Statistics Institute’s Resident Tourism Survey, https://www.ine.es/index.htm (accessed on 2 october 2024) (NSI, 2022). This survey analyzes tourist trips and excursions in Spain and abroad by the resident population. Those cases (tourists) whose primary motivation is gastronomic have been selected. The Residents’ Tourism Survey has, among other variables, detailed information on the type of trip, the profile of the traveler, and his or her motivation (Mascuñano, 2013). To measure the degree of satisfaction, it uses a 10-point Likert-type scale ranging from 1 (totally dissatisfied) to 10 (totally satisfied) (NSI, 2016).
The study period analyzed is extensive, from January 2019 to December 2022, as they were the last ones available for the data processing for this research. The total sample size of n = 3483. Of these, 1339 surveys were conducted before COVID-19 and 2144 during the pandemic. Table 2 presents their main characteristics.

3.2. Data Analysis

The research framework shows the causal relationships between the five factors (age, gender, educational level, income range, and destination country) with overall satisfaction and its relationship with loyalty to the food event. These relationships were estimated using a non-linear structural equation model (SEM, Structural Equations Modeling). The tourism experience of gastronomic events was analyzed using a proxy variable for value-added gastronomic activities.
The exploratory nature of the research justifies the adoption of structural equations modeling as the methodological approach in this study. SEM is particularly well-suited for examining the relationships between latent constructs (theoretical variables) and their corresponding indicators (empirical measures), especially in studies with a predictive orientation (Henlein & Kaplan, 2004).
This methodological framework is therefore appropriate for identifying potential causal relationships among conceptual variables in empirical research within the social sciences.
It also takes up the recommendations made by Tanford and Jung (2017) to use structural equation modeling in future festival studies to confirm the hypothesis that tangible attributes influence loyalty through attendee satisfaction.
Estimating the model parameters was performed using the statistical software WarpPLS 8.0 (Kock, 2024), which allows estimating non-linear effects. This enables a more realistic representation of the relationships between variables.
Additionally, there are several advantages of using non-linear structural equation modeling, as WarpPLS, over linear SEM models in capturing complex relationships: non-linear SEM models can capture complex relationships between variables that linear models cannot adequately describe. Parameter values were obtained by bootstrap (Tibshirani & Efron, 1993) with 100 samples of a size equal to the sample size n = 9791.
Several key considerations guided the selection of the model estimation technique. First, the exploratory nature of the research problem supports the use of Partial Least Squares (PLS), particularly in contexts where the theoretical model is still emerging. Second, PLS is appropriate when working with relatively small sample sizes, as it imposes less stringent requirements than other estimation methods. Moreover, it is well suited for predictive modeling in situations where data do not meet the assumptions of multivariate normality (Jöreskog & Wold, 1982; Henseler et al., 2009). The importance–performance map was performed using the statistical software SmartPLS (Ringle et al., 2024).

3.3. Model Estimation and Fit Indices

The quality of the model has been verified by analyzing the measurement models that constitute the different factors considered and then by examining the structural model. The analysis of the measurement models includes their validity and reliability.
Table 3 shows a summary of the values obtained, together with the values of the indicators generally accepted in the literature. The overall fit of the total theoretical model was assessed by evaluating the following fit indices (Table 3).
The model supports two of the six hypotheses proposed, which are accepted with a confidence level above 99%, as indicated by p-values < 0.05.

4. Results

Figure 2 presents the proposed hypotheses and the values of the model coefficients and their p-values.
Of the 6 hypotheses put forward, the model supports 2 hypotheses, accepted with a confidence level above 99%, as shown by the results of p value < 0.05. Two of the five hypotheses of the model concerning the direct influence of various factors on satisfaction have been confirmed. Hypothesis 3 (H3) has not been confirmed (p = 0.10) at the 95% confidence level, being slightly lower. Therefore, the level of education of the gastronomic tourist would not significantly affect his overall satisfaction (H3). Hypothesis 2 (H2) and hypothesis 5 (H5) are also not confirmed. Neither age nor whether the destination is in Spain or abroad influences the degree of satisfaction of the food event tourist.
Regarding the confirmed variables, in hypothesis 1 (H1), the sign of the coefficient (β = −0.09) indicates that women obtain a higher degree of satisfaction than men. Hypothesis 4 (H4) confirms the positive influence of income level on satisfaction. Its beta coefficient (β = 0.04, p < 0.01) shows that it is the factor with the most substantial influence on satisfaction. The beta coefficient (β = 0.02, p = 0.11) of hypothesis 6 (H6) reveals a weak relationship, suggesting that satisfaction does not significantly predict loyalty through repeat visits. Table 4 presents the results and ratings for each hypothesis:
The importance–performance map (Figure 3), developed using SmartPLS 4 software, shows the influence of the variables in the model on loyalty and the level of performance achieved in practice.
This graphical representation helps identify how well each variable performs and where improvements can be made.
The most essential variable is satisfaction, which also operates at a high performance level. In addition, the highest level of performance stands out for the level of education and the country of destination, leaving less room for improvement. In contrast, age and gender, together with home income, although less critical, offer considerable potential for increasing performance.

5. Discussion

The results obtained support two of the six hypotheses proposed. The influence of the gender of the food event tourist in relation to the degree of satisfaction (H1) is confirmed, with greater satisfaction being observed in female tourists. The results align with previous studies’ conclusions (López-Guzmán et al., 2017).
The relationship between income level and satisfaction (H4) is also confirmed, whereby the higher the income of the attendees, the higher their degree of satisfaction. Tourists with higher purchasing power are more likely to spend more to meet their expectations, increasing their overall satisfaction. The result aligns with other studies that suggest a direct relationship between food expenditure at a food event and satisfaction (Y. H. Kim et al., 2011; Carvache-Franco et al., 2020).
Regarding hypothesis two (H2), the result does not allow us to verify that the attendees’ age at food festivals is a variable that can predict more significant or lesser satisfaction with the destination. This finding contradicts earlier research (Balderas-Cejudo et al., 2019; Nicoletti et al., 2019). Thus, the gastronomic experience of the event is linked to entertainment aspects for all ages, given the relationship between everyday life and food (Wan & Chan, 2013).
As with age, no significant association was detected between the level of education and satisfaction (H3). In contrast to cultural tourists, whose behavior aligns with the hypothesis that higher education facilitates access to and interpretation of cultural experiences (Sánchez-Sánchez et al., 2021), tourists attending food-related events appear to follow a different pattern. Although this group generally possesses higher levels of education, such educational attainment does not seem to function as a primary mechanism for engaging with or deriving meaning from the experiences offered (Bourdieu, 1990). Consequently, their level of satisfaction does not appear to be significantly mediated by their educational background. The results agree with studies that do not relate the level of education as an explanatory variable for the consumption of local products by tourists (Testa et al., 2019).
In the case of hypothesis five (H5), there is no significant influence between the geographical location of the food festival in the same country of origin of the tourist or abroad, and increase or decrease in the degree of satisfaction. The results follow the research of Baloglu and Mangaloglu (2001), who do not find conclusive the relationship between the geographical location or distance of the tourist and their perception of the destination. Ultimately, this relationship also appears to have limited influence on the tourist’s actual level of satisfaction.
The influence of tourist satisfaction as a predictor of repeated visits to the food event (H6) is not confirmed, although it performs highly for loyalty. Thus, satisfaction may not linearly affect loyalty (Fullerton & Taylor, 2002). Therefore, the results presented an original finding related to the current trends of tourism focused on the search for new experiences. This reflects a shift in tourist behavior, where novelty and discovery are increasingly prioritized. Such a trend leads tourists to seek out new destinations, even when they report a high degree of satisfaction with previous experiences (Dolnicar et al., 2015).
This would hinder loyalty to a destination (Pearce & Kang, 2009) and, therefore, to the same food event. Tourists may develop loyalty to a type of experience as a product category rather than to an event or destination, even if they are satisfied (McKercher et al., 2012; Li et al., 2021).

6. Conclusions

6.1. Theoretical and Practical Implications

Research indicates that local food events are a channel that allows tourists to experience the gastronomic culture of a particular destination or geographical area. These events facilitate a deeper connection between visitors and the local culture. This has implications for the development of socially sustainable tourism in these territories. Successful gastronomic experiences reinforce the place’s cultural identity through loyalty by revisiting the gastronomic event, thus valuing its cultural identity. Therefore, preserving a destination’s unique characteristics or irreplaceable gastronomic resources as a competitive advantage is essential for sustainable tourism management.
From the demand side, the findings of this research provide valuable information on the sociodemographic and geographical distance variables that influence tourist behavior. These variables help explain how a satisfactory experience can enhance the identity of a place and act as a predictor of loyalty to the event. Thus, a thorough knowledge of the demand makes it easier for destinations to create an authentic and attractive offer. This offer enables tourists to enjoy memorable experiences that enhance their satisfaction and strengthen their emotional connection with local gastronomic traditions.
On the other hand, it is also necessary to understand the variables that make up tourism demand. This understanding is crucial to promote the development of sustainable gastronomic tourism and responsible consumption aligned with the strategies to achieve the United Nations Sustainable Development Goals (SDGs).
The relationships between the factors of the proposed model have been verified through quantitative methods using non-linear structural equation functions (SEM, Structural Equations Modeling) as a significant contribution. This approach has enabled the modeling of non-linear effects, offering a more accurate approximation of reality.
Thus, as a general result of this empirical study, a model has been confirmed that allows the establishment of actions to increase satisfaction and loyalty. These actions specifically target tourists whose primary motivation for travel is gastronomic.
Derived from the above, as an important finding, the results show the relationship of overall satisfaction with the visit to the gastronomic event as non-linear with tourist loyalty. This result raises the need to review the concept of tourist loyalty, not linked to a destination or resource, but to a similar type of experience. This will favor the demand for new gastronomic products of this type, enhancing their role as a driver of the cultural identity of destinations.
Consequently, this more profound understanding of tourist behavior enables destination managers and professionals to design experiential marketing strategies. These strategies are aimed at a segment of tourist demand that seeks sensory experiences related to gastronomy. In addition, it supports the development of policies focused on the socially sustainable tourism development of these destinations. Such policies consider not only the needs of tourists but also those of the resident population.
Furthermore, the gender bias in satisfaction with food events is confirmed. The results show the importance of gastronomic experiences as a variable of female satisfaction. In this sense, the performance map points to the possibility of improving satisfaction concerning loyalty. This could be promoted by developing strategies focused on generating complementary gastronomic offers. These offers should be designed to be more appealing to the male segment of tourist demand.
The fact that the level of education is not related to the degree of satisfaction provides relevant information on the satisfaction of food event tourists with lower levels of education. This suggests that their satisfaction is not hindered by a “cultural distance” from the destination, unlike the influence of geographical location. This opens up even greater possibilities for food event tourism as a transmitter of the cultural identity of destinations.
Finally, the study provides representative results and conclusions for food event tourism in Spain, due to the extensive data analyzed from the Residents’ Tourism Survey, which covers a national framework. These findings confirm that gastronomy event tourism is a creative and dynamic segment within the broader tourism industry.

6.2. Limitations and Future Lines of Research

The study’s limitations derive from its methodological nature due to the use of the variables present in the Residents’ Tourism Survey (NSI), framed within the general guidelines of the World Tourism Organization (WTO) for the study of demand. For this reason, the satisfaction analysis is generally conducted and not by attributes. This limits the precision of insights into how tourists evaluate food events. Also, the study does not include other indicators that could allow us to analyze other aspects of the behavior of food event tourists, as they are not included in the survey.
In future research to further advance the proposed model, addressing the limitations identified in this study would be valuable. Specifically, the analysis of the degree of general satisfaction about tourist motivation could be extended, depending on whether the tourist has gastronomic activities as a primary or secondary motivation.
The analysis could also be extended to foreign tourists to validate the model proposed in this study and expand the geographical scope of the study to other countries with different culinary cultures. This would allow for a comparative analysis that could enrich understanding of gastronomic tourism across diverse cultural contexts.
It would also be interesting to complete the exploratory model with data beyond that available from the NSI. For example, using other data sources such as Big Data, in-depth interviews, or analyses of reputational content of different Internet channels (e.g., social networks, news, forums, etc.). Furthermore, incorporating variables on the authenticity of the gastronomic experience would be of interest. These variables could offer helpful information for designing gastronomic events to foster greater visitor loyalty.

Author Contributions

M.-D.S.-S.: theoretical framework and writing; C.d.P.-H.: discussion and conclusions; J.L.M.-B.: statistical analysis. All authors have read and agreed to the published version of the manuscript.

Funding

This article has been funded with the project research, MODELTUR: Impact of Crisis Scenarios on the Tourist Experience: An Explanatory Model for Climate Sustainability and the Resilience of Tourist Destinations in Spain (V-1569) (Rey Juan Carlos University). Thanks to OPENINNOVA (V-1539) (Rey Juan Carlos University) for the support of this research.

Institutional Review Board Statement

Not applicable.

Informed Consent Statement

Not applicable.

Data Availability Statement

The data have been obtained from the National Statistics Institute’s Resident Tourism Survey, https://www.ine.es/index.htm (accessed on 2 October 2024) (NSI, 2022).

Conflicts of Interest

The authors declare no conflicts of interest.

Abbreviations

The following abbreviations are used in this manuscript:
NSINational Statistics Institute
UNWTOWorld Tourism Organization
SEMStructural Equation Model

References

  1. Apak, Ö. C., & Gürbüz, A. (2023). The effect of local food consumption of domestic tourists on sustainable tourism. Journal of Retailing and Consumer Services, 71, 103192. [Google Scholar] [CrossRef]
  2. Azinuddin, M., Som, A. P. M., Saufi, S. A. M., Zarhari, N. A. A., Amin, W. A. A. W. M., & Shariffuddin, N. S. M. (2022). Investigating overtourism impacts, perceived man-made risk and tourist revisit intention. Planning Malaysia, 20(3), 239–254. [Google Scholar] [CrossRef]
  3. Babolian Hendijani, R. (2016). Effect of food experience on tourist satisfaction: The case of Indonesia. International Journal of Culture, Tourism and Hospitality Research, 10(3), 272–282. [Google Scholar] [CrossRef]
  4. Backman, S. J., & Crompton, J. L. (1991). Using loyalty matrix to differentiate between high, Spurius, latent and low loyalty participants in two leisure services. Journal of Park and Recreation Administration, 9(2), 1–17. [Google Scholar]
  5. Balderas-Cejudo, A., Patterson, I., & Leeson, G. W. (2019). Senior Foodies: A developing niche market in gastronomic tourism. International Journal of Gastronomy and Food Science, 16, 100152. [Google Scholar] [CrossRef]
  6. Baloglu, S., & Mangaloglu, M. (2001). Tourism destinations images of Turkey, Egypt, Greece, and Italy as perceived by US-based tour operators and travel agents. Tourism Management, 22, 1–9. [Google Scholar] [CrossRef]
  7. Barlow, R. (2001). Coalitions can support customer loyalty. Brandweek, 42(19), 48–49. [Google Scholar]
  8. Bautista, V., Martín, C., Fernández, J., & Da Silva, R. (2015). Relationships between sociodemographic factors, gender, age, nationality, motivation and tourist satisfaction: Exploratory analysis in a tourist sample from the city of Madrid. Revista de Análisis Turístico, 20, 39–45. [Google Scholar]
  9. Bigné, J. E., Sánchez, M. I., & Sánchez, J. (2001). Tourism image, evaluation variables and after purchase behaviour: Inter-relationship. Tourism Management, 22(6), 607–616. [Google Scholar] [CrossRef]
  10. Björk, P., & Kauppinen-Räisänen, H. (2014). Exploring the multi-dimensionality of travellers’ culinary-gastronomic experiences. Current Issues in Tourism, 19(12), 1260–1280. [Google Scholar] [CrossRef]
  11. Bourdieu, P. (1990). Espacio social y génesis de las clases. In Bourdieu pierre, sociology and culture. Grijalbo. [Google Scholar]
  12. Callan, R. J., & Bowman, L. (2000). Selecting a hotel and determining salient quality attributes: A preliminary study of mature British travellers. International Journal of Tourism Research, 2, 97–118. [Google Scholar] [CrossRef]
  13. Carvache-Franco, M., Carvache-Franco, O., Carvache-Franco, W., & Villagómez-Buele, C. (2020). Relationship between sociodemographic aspects, satisfaction and loyalty in gastronomic festivals. GeoJournal of Tourism and Geosites, 32(4), 1324–1329. [Google Scholar] [CrossRef]
  14. Carvache-Franco, M., Carvache-Franco, W., Borja Morán, J. L., & Contreras Moscol, D. (2018). Tourist demand characterization. Andean cultural festival Inti Raymi (Ecuador). Journal of Convention & Event Tourism, 19(3), 248–267. [Google Scholar] [CrossRef]
  15. Carvalho, M., Kastenholz, E., Carneiro, M. J., & Souza, L. (2023). Co-creation of food tourism experiences: Tourists’ perspectives of a Lisbon food tour. Tourist Studies, 23(2), 128–148. [Google Scholar] [CrossRef]
  16. Chen, C., & Chen, F. (2010). Experience quality, perceived value, satisfaction and behavioral, intentions for heritage tourist. Tourism Management, 31, 29–35. [Google Scholar] [CrossRef]
  17. Chen, Q., & Huang, R. (2019). Understanding the role of local food in sustaining Chinese destinations. Current Issues in Tourism, 22(5), 544–560. [Google Scholar] [CrossRef]
  18. Chi, C., & Qu, H. (2008). Examining the structural relationships of destination image tourist satisfaction and destination loyalty: An integrated approach. Tourism Management, 29, 624–636. [Google Scholar] [CrossRef]
  19. Clatworthy, S. D. (2019). The experience centric organization. How to win through customer experience. O’Reilly. [Google Scholar]
  20. Correia, A., Kozak, M., & Ferradeira, J. (2013). From tourist motivations to tourist satisfaction. International Journal of Culture, Tourism and Hospitality Research, 7(4), 411–424. [Google Scholar] [CrossRef]
  21. Cottrell, S. P., van der Duim, V. R., Ankersmid, P., & Kelder, L. (2004). Measuring the sustainability of tourism in Manuel Antonio and Texel: A tourist perspective. Journal of Sustainable Tourism, 12(5), 409–431. [Google Scholar] [CrossRef]
  22. Di-Clemente, E., Hernández-Mogollón, J. M., & Campon-Cerro, A. M. (2019). Food-based experiences as antecedents of destination loyalty. British Food Journal, 121(7), 1495–1507. [Google Scholar] [CrossRef]
  23. Dolnicar, S., Coltman, T., & Sharma, R. (2015). Do satisfied tourists really intend to come back? Three concerns with empirical studies of the link between satisfaction and behavioral intention. Journal of Travel Research, 54(2), 152–178. [Google Scholar] [CrossRef]
  24. Domínguez, A. M., Camuñez, J. A., Pérez, M. D., & González, M. R. (2017). Analysis of the influence of motivation and authenticity in satisfaction and loyalty in cultural tourism. Proceedings Book. [Google Scholar]
  25. Ellis, A., Park, E., Kim, S., & Yeoman, I. (2018). What is food tourism? Tourism Management, 68, 250–263. [Google Scholar] [CrossRef]
  26. Estrada, M., Moliner, M. Á., Monferrer, D., & Vidal, L. (2023). Sustainability and local food at tourist destinations: A study from the transformative perspective. Journal of Sustainable Tourism, 32(5), 1008–1026. [Google Scholar] [CrossRef]
  27. Eusébio, C., & Vieira, A. L. (2013). Destination attributes’ evaluation, satisfaction and behavioural intentions: A structural modelling approach. International Journal of Tourism Research, 15(1), 66–80. [Google Scholar] [CrossRef]
  28. Everett, S., & Aitchison, C. (2008). The role of food tourism in sustaining regional identity: A case study of Cornwall, South West England. Journal of Sustainable Tourism, 16(2), 150–167. [Google Scholar] [CrossRef]
  29. Fernández, M. D., & Picos, A. P. (2005). Predictions in the level of satisfaction perceived by tourists based on motivational variables and valuation of the visit. ICE, Revista de Economía, 821, 241–256. [Google Scholar]
  30. Fullerton, G., & Taylor, S. (2002). Mediating, interactive and non-linear effects in service quality and satisfaction with services research. Canadian Journal of Administrative Sciences, 19(2), 124–136. [Google Scholar] [CrossRef]
  31. Fusté-Forné, F. (2016). Landscapes of culture: Gastronomy and culinary heritage. Dixit, 24, 4–16. [Google Scholar] [CrossRef]
  32. Fusté-Forné, F. (2019). Seasonality in food tourism: Wild foods in peripheral areas. Tourism Geographies, 24(4–5), 578–598. [Google Scholar] [CrossRef]
  33. Getz, D., Andersson, T., Vujicic, S., & Robinson, R. N. (2015). Food events in lifestyle and travel. Event Management, 19(3), 407–419. [Google Scholar] [CrossRef]
  34. Hall, C. M., & Mitchell, R. (2007). Gastronomic tourism: Comparing food and wine tourism experiences. In M. Novelli (Ed.), Niche tourism (pp. 87–102). Routledge. [Google Scholar]
  35. Henlein, M., & Kaplan, A. (2004). A beginner’s guide to partial least squares analysis. Understanding Statistics, 3(4), 283–297. [Google Scholar] [CrossRef]
  36. Henseler, J., Ringle, C., & Sinkovics, R. (2009). The use of partial least squares path modelling in international marketing. Advances in International Marketing, 20, 277–320. [Google Scholar] [CrossRef]
  37. Hjalager, A.-M., & Johansen, P. H. (2013). Food tourism in protected areas—Sustainability for producers, the environment and tourism? Journal of Sustainable Tourism, 21(3), 417–433. [Google Scholar] [CrossRef]
  38. Jiménez Beltrán, J., López-Guzmán, T., & Santa-Cruz, F. G. (2016). Gastronomy and tourism: Profile and motivation of international tourism in the city of Córdoba, Spain. Journal of Culinary Science & Technology, 14(4), 347–362. [Google Scholar] [CrossRef]
  39. Jöreskog, K. G., & Wold, H. O. (1982). Systems under indirect observation: Causality, structure, prediction. North-Holland. [Google Scholar]
  40. Kao, Y.-F., Huang, L.-S., & Wu, C.-H. (2008). Effects of theatrical elements on experiential quality. Asia Pacific Journal of Tourism Research, 13(2), 163–174. [Google Scholar] [CrossRef]
  41. Kim, Y. G., & Eves, A. (2012). Construction and validation of a scale to measure tourist motivation to consume local food. Tourism Management, 33(6), 1458–1467. [Google Scholar] [CrossRef]
  42. Kim, Y. H., Kim, M., Goh, B. K., & Antun, J. (2011). The role of money: The impact on food tourists’ satisfaction and intention to revisit food events. Journal of Culinary Science & Technology, 9(2), 85–98. [Google Scholar] [CrossRef]
  43. Kivela, J., & Crotts, J. C. (2006). Tourism and gastronomy: Gastronomy’s influence on how tourists experience a destination. Journal of Hospitality & Tourism Research, 30(3), 354–377. [Google Scholar] [CrossRef]
  44. Kock, N. (2024). Warp PLS 8.0. ScriptWarp Systems. [Google Scholar]
  45. Kozak, M. (2001). Repeaters’ behavior at two distinct destinations. Annals of Tourism Research, 28(3), 784–807. [Google Scholar] [CrossRef]
  46. Le, T. H., Novais, M. A., Arcodia, C., Berchtenbreiter, R., Humpe, A., & Nguyen, N. (2024). How authenticity in events fosters social sustainability: Towards an authenticity ecosystem and implications for destination management. Tourism Management Perspectives, 51, 101222. [Google Scholar] [CrossRef]
  47. Leer, J. (2020). Designing sustainable food experiences: Rethinking sustainable food tourism. International Journal of Food Design, 5(1–2), 65–82. [Google Scholar] [CrossRef] [PubMed]
  48. Li, T., Liu, F., & Soutar, G. (2021). Experiences, post-trip destination image, satisfaction, and loyalty: A study in an ecotourism context. Journal of Destination Marketing & Management, 19, 100547. [Google Scholar] [CrossRef]
  49. López-Guzmán, T., Uribe Lotero, C. P., Pérez Gálvez, J. C., & Ríos Rivera, I. (2017). Gastronomic festivals: Attitude, motivation and satisfaction of the tourist. British Food Journal, 119(2), 267–283. [Google Scholar] [CrossRef]
  50. Mascuñano, J. P. (2013). The logic of tourism statistics in Spain and the role of the Institute of Tourism Studies. Index: Journal of Statistics and Society, 56, 24–26. [Google Scholar]
  51. Mckercher, B., Denizci-Guillet, B., & Ng, E. (2012). Rethinking loyalty. Annals of Tourism Research, 39(2), 708–734. [Google Scholar] [CrossRef]
  52. Molina-Gómez, J., Mercadé-Melé, P., Almeida-García, F., & Ruiz-Berrón, R. (2021). New perspectives on satisfaction and loyalty in festival tourism: The function of tangible and intangible attributes. PLoS ONE, 16(2), e0246562. [Google Scholar] [CrossRef]
  53. Muhammad, R., Ramli, N., Yusoff, N. M., & Ismail, T. A. T. (2016). Are visitors satisfied and intend to revisit Rumah Terbuka Aidilfitri: Malaysian community in Perak. Procedia-Social and Behavioral Sciences, 222, 351–357. [Google Scholar] [CrossRef]
  54. Nicoletti, S., Medina-Viruel, M. J., Di-Clemente, E., & Fruet-Cardozo, J. V. (2019). Motivations of the culinary tourist in the city of Trapani, Italy. Sustainability, 11(9), 2686. [Google Scholar] [CrossRef]
  55. NSI (National Statistics Institute). (2016). Resident tourism survey. Metodology. Available online: https://www.ine.es/buscar/searchResults.do?Menu_botonBuscador=&searchType=DEF_SEARCH&startat=0&L=0&searchString=familitur (accessed on 12 October 2024).
  56. NSI (National Statistics Institute). (2022). Resident tourism survey. Available online: https://www.ine.es (accessed on 2 October 2024).
  57. Pearce, P. L., & Kang, M. H. (2009). The effects of prior and recent experience on continuing interest in tourist settings. Annals of Tourism Research, 36(2), 172–190. [Google Scholar] [CrossRef]
  58. Pérez-Priego, M. A., García-Moreno Garcia, M. D. L. B., Gómez-Casero, G., & Caridad y López del Rio, L. (2019). Segmentation based on the gastronomic motivations of tourists: The case of the Costa Del Sol (Spain). Sustainability, 11(2), 409. [Google Scholar] [CrossRef]
  59. Piramanayagam, S., Sud, S., & Seal, P. P. (2020). Relationship between tourists’ local food experiencescape, satisfaction and behavioural intention. Anatolia, 31(2), 316–330. [Google Scholar] [CrossRef]
  60. Ringle, C. M., Wende, S., & Becker, J.-M. (2024). SmartPLS 4. SmartPLS. Available online: https://www.smartpls.com (accessed on 19 November 2024).
  61. Rodríguez-Gutiérrez, P., González Santa Cruz, F., Pemberthy Gallo, L. S., & López-Guzmán, T. (2020). Gastronomic satisfaction of the tourist: Empirical study in the Creative City of Popayán, Colombia. Journal of Ethnic Foods, 7, 8. [Google Scholar] [CrossRef]
  62. San Martín, H., Herrero, A., & García de los Salmones, M. d. M. (2018). An integrative model of destination brand equity and tourist satisfaction. Current Issues in Tourism, 22(16), 1992–2013. [Google Scholar] [CrossRef]
  63. Santos-Roldán, L., Castillo Canalejo, A. M., Berbel-Pineda, J. M., & Palacios-Florencio, B. (2020). Sustainable tourism as a source of healthy tourism. International Journal of Environmental Research and Public Health, 17(15), 5353. [Google Scholar] [CrossRef]
  64. Sánchez-Sánchez, M. D., Pablos-Heredero, C. D., & Montes-Botella, J. L. (2021). The internal demand of cultural tourism: Understanding satisfaction and fidelity to destination in spain through a non-linear structural model. Sustainability, 13(23), 13487. [Google Scholar] [CrossRef]
  65. Sims, R. (2009). Food, place and authenticity: Local food and the sustainable tourism experience. Journal of Sustainable Tourism, 17(3), 321–336. [Google Scholar] [CrossRef]
  66. Stojanović, D., Vukić, M., Vukić, K., & Jovanović, V. (2020). Satisfaction of visitors with food offer at gastronomic festivals in rural areas. Economics of Agriculture, 67(2), 523–536. [Google Scholar] [CrossRef]
  67. Streimikiene, D., Svagzdiene, B., Jasinskas, E., & Simanavicius, A. (2021). Sustainable tourism development and competitiveness: The systematic literature review. Sustainable Development, 29(1), 259–271. [Google Scholar] [CrossRef]
  68. Tanford, S., & Jung, S. (2017). Festival attributes and perceptions: A meta-analysis of relationships with satisfaction and loyalty. Tourism Management, 61, 209–220. [Google Scholar] [CrossRef]
  69. Testa, R., Galati, A., Schifani, G., Di Trapani, A. M., & Migliore, G. (2019). Culinary tourism experiences in agri-tourism destinations and sustainable consumption-understanding Italian tourists’ motivations. Sustainability, 11(17), 4588. [Google Scholar] [CrossRef]
  70. Tibshirani, R. J., & Efron, B. (1993). An introduction to the bootstrap. Monographs on Statistics and Applied Probability, 57(1), 1–436. [Google Scholar]
  71. Tsai, C. T. (2016). Memorable tourist experiences and place attachment when consuming local food. International Journal of Tourism Research, 18(6), 536–548. [Google Scholar] [CrossRef]
  72. UNWTO (United Nations World Tourism Organization). (2004). Indicators of sustainable development for tourism destinations. A guidebook (English version). UNWTO. [Google Scholar] [CrossRef]
  73. UNWTO (United Nations World Tourism Organization). (2012). Global report on food tourism: The United Nations. World Tourism Organization: UNWTO. Available online: http://cf.cdn.unwto.org/sites/all/files/pdf/food_tourism_ok.pdf (accessed on 18 April 2023).
  74. Valverde-Roda, J., Medina Viruel, M. J., Castano Prieto, L., & Solano Sanchez, M. A. (2023). Interests, motivations and gastronomic experiences in the world heritage site destination of Granada (Spain): Satisfaction analysis. British Food Journal, 125(13), 61–80. [Google Scholar] [CrossRef]
  75. Wan, Y. K., & Chan, S. H. (2013). Factors that affect the levels of tourists’ satisfaction and loyalty towards food festivals: A case study of Macau. International Journal of Tourism Research, 15(3), 226–240. [Google Scholar] [CrossRef]
  76. Williams, H. A., Yuan, J. J., & Williams, R. L. (2018). Characteristics and practices of gastro-tourists: Application for a 6+ gastro-cluster destination development model. Journal of Gastronomy and Tourism, 3(3), 177–190. [Google Scholar] [CrossRef]
  77. Wu, H. C., Li, M. Y., & Li, T. (2018). A study of experiential quality, experiential value, experiential satisfaction, theme park image, and revisit intention. Journal of Hospitality & Tourism Research, 42(1), 26–73. [Google Scholar] [CrossRef]
  78. Yoon, Y., & Uysal, M. (2005). An examination of the effects of motivation and satisfaction on destination loyalty: A structural model. Tourism Management, 26, 45–56. [Google Scholar] [CrossRef]
  79. Zenker, S., & Kock, F. (2020). The coronavirus pandemic—A critical discussion of a tourism research agenda. Tourism Management, 81, 104164. [Google Scholar] [CrossRef]
Figure 1. Proposed model Source: own elaboration.
Tourismhosp 06 00093 g001
Figure 2. Model values. Source: The authors process data using WarpPLS 8.0.
Tourismhosp 06 00093 g002
Figure 3. Importance–performance map (color figure) Source: own elaboration.
Tourismhosp 06 00093 g003
Table 1. Studies on variables that affect gastronomic tourist satisfaction. Source: Own elaboration.
AuthorsYearStudy Variables
SOCIO DEMOGRAPHIC PROFILE
Pérez-Priego et al.2019Gender
Carvache-Franco et al.2018Gender
Valverde-Roda et al.2023Level of education
Testa et al.2019Higher education
Getz et al.2015Age and generation
Correia et al.2013Age
Williams, Yuan & Williams2018Age and household income
Balderas-Cejudo, Patterson & Leeson 2019Age and household income
COUNTRY OF DESTINATION
Babolian Hendijani2016Country of destination
Stojanović et al.2020Country of destination
Table 2. Characteristics of the sample. Source: NSI (2016).
Type of SurveyContinues Every Quarterly
Population outreachPopulation aged 15 and over residing in the main family dwelling.
ScopeThe entire national territory.
Reference periodMonthly.
Sample sizeAround 16,400 interviews are conducted each month.
Collection of informationTelephone interviews and, in some cases, face-to-face interviews.
Table 3. Model fit and reliability indices. Source: own elaboration.
Average path coefficient (APC) = 0.033, p = 0.013
Average R-squared (ARS) = 0.005, p = 0.190
Average adjusted R-squared (AARS) = 0.004, p = 0.200
Average block VIF (AVIF) = 1.008, acceptable if ≤5, ideally ≤ 3.3
Average full collinearity VIF (AFVIF) = 1.057, acceptable if ≤5, ideally ≤ 3.3
Tenenhaus GoF (GoF) = 0.072, small ≥ 0.1, medium ≥ 0.25, large ≥ 0.36
Simpson’s paradox ratio (SPR) = 0.833, acceptable if ≥0.7, ideally = 1
R-squared contribution ratio (RSCR) = 0.999, acceptable if ≥0.9, ideally = 1
Statistical suppression ratio (SSR) = 0.833, acceptable if ≥0.7
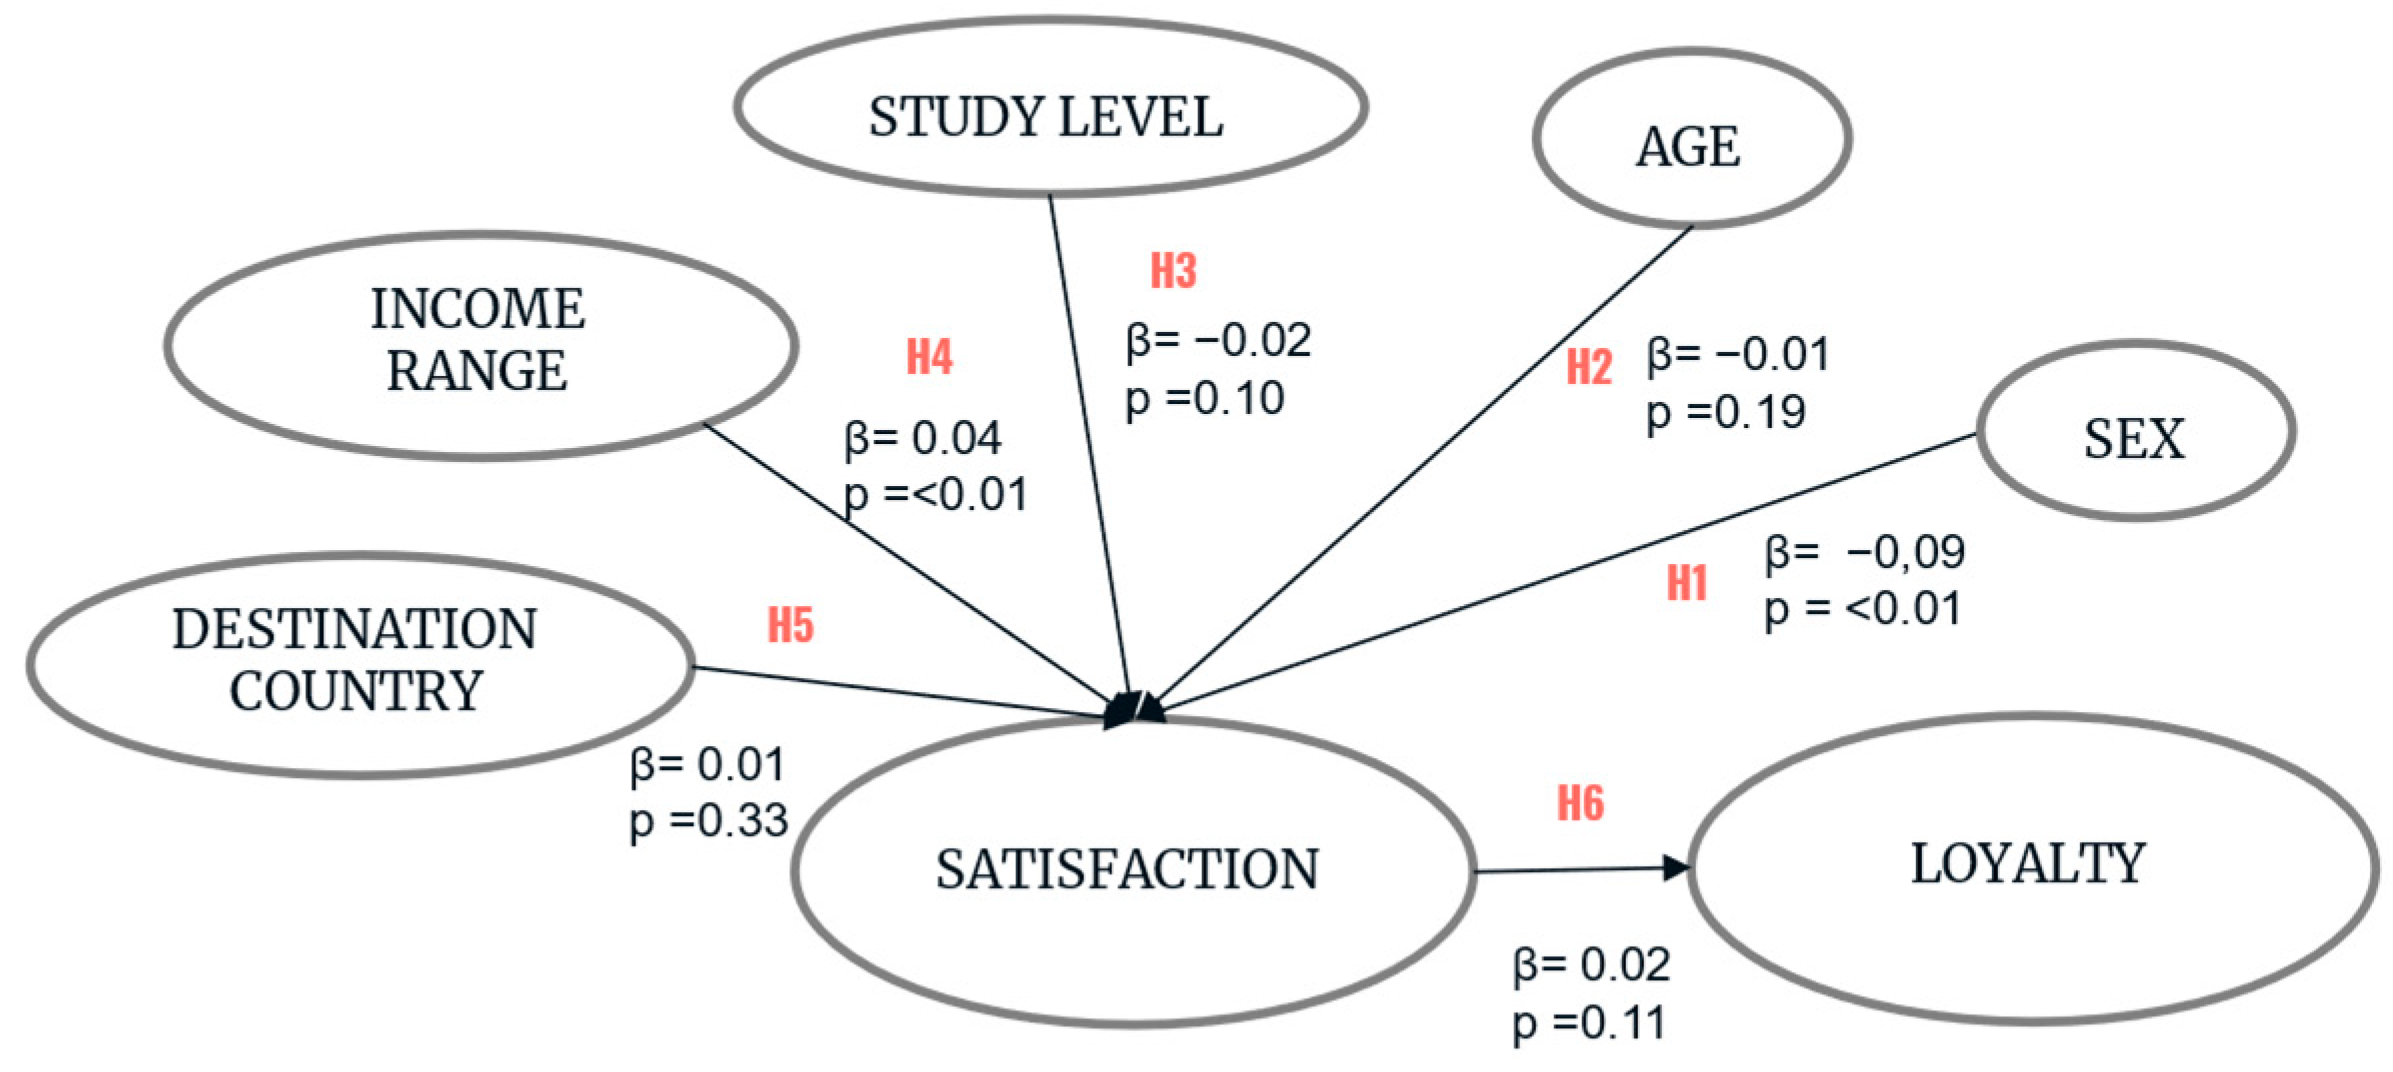
Table 4. Assessment of the hypotheses. Source: own elaboration.
H1Gender → Satisfaction (β = −0.09, p < 0.01). Confirmed
H2Age → Satisfaction (β = −0.01, p = 0.19). Not confirmed
H3Educational level → Satisfaction (β = −0.02, p = 0.10). Not confirmed
H4Income range→ Satisfaction (β = 0.04, p < 0.01). Confirmed
H5Destination country → Satisfaction (β = 0.01, p = 0.33). Not confirmed
H6Satisfaction → Loyalty (β = 0.02, p = 0.11). Not confirmed
Disclaimer/Publisher’s Note: The statements, opinions and data contained in all publications are solely those of the individual author(s) and contributor(s) and not of MDPI and/or the editor(s). MDPI and/or the editor(s) disclaim responsibility for any injury to people or property resulting from any ideas, methods, instructions or products referred to in the content.

