
Investigating Visitor Activity on a Safari Drive


Abstract
:1. Introduction
- Can the average speed of visitor vehicles be used to investigate visitor activity on a safari drive?
- Does average speed differ between exhibits on a safari drive?
- Can average speed be used to determine exhibit (and therefore species) popularity?
- What is the impact of different species traits and exhibit features on the average speed of cars on a safari drive?
- Are species traits comparable to findings made in traditional zoo studies?
2. Materials and Methods
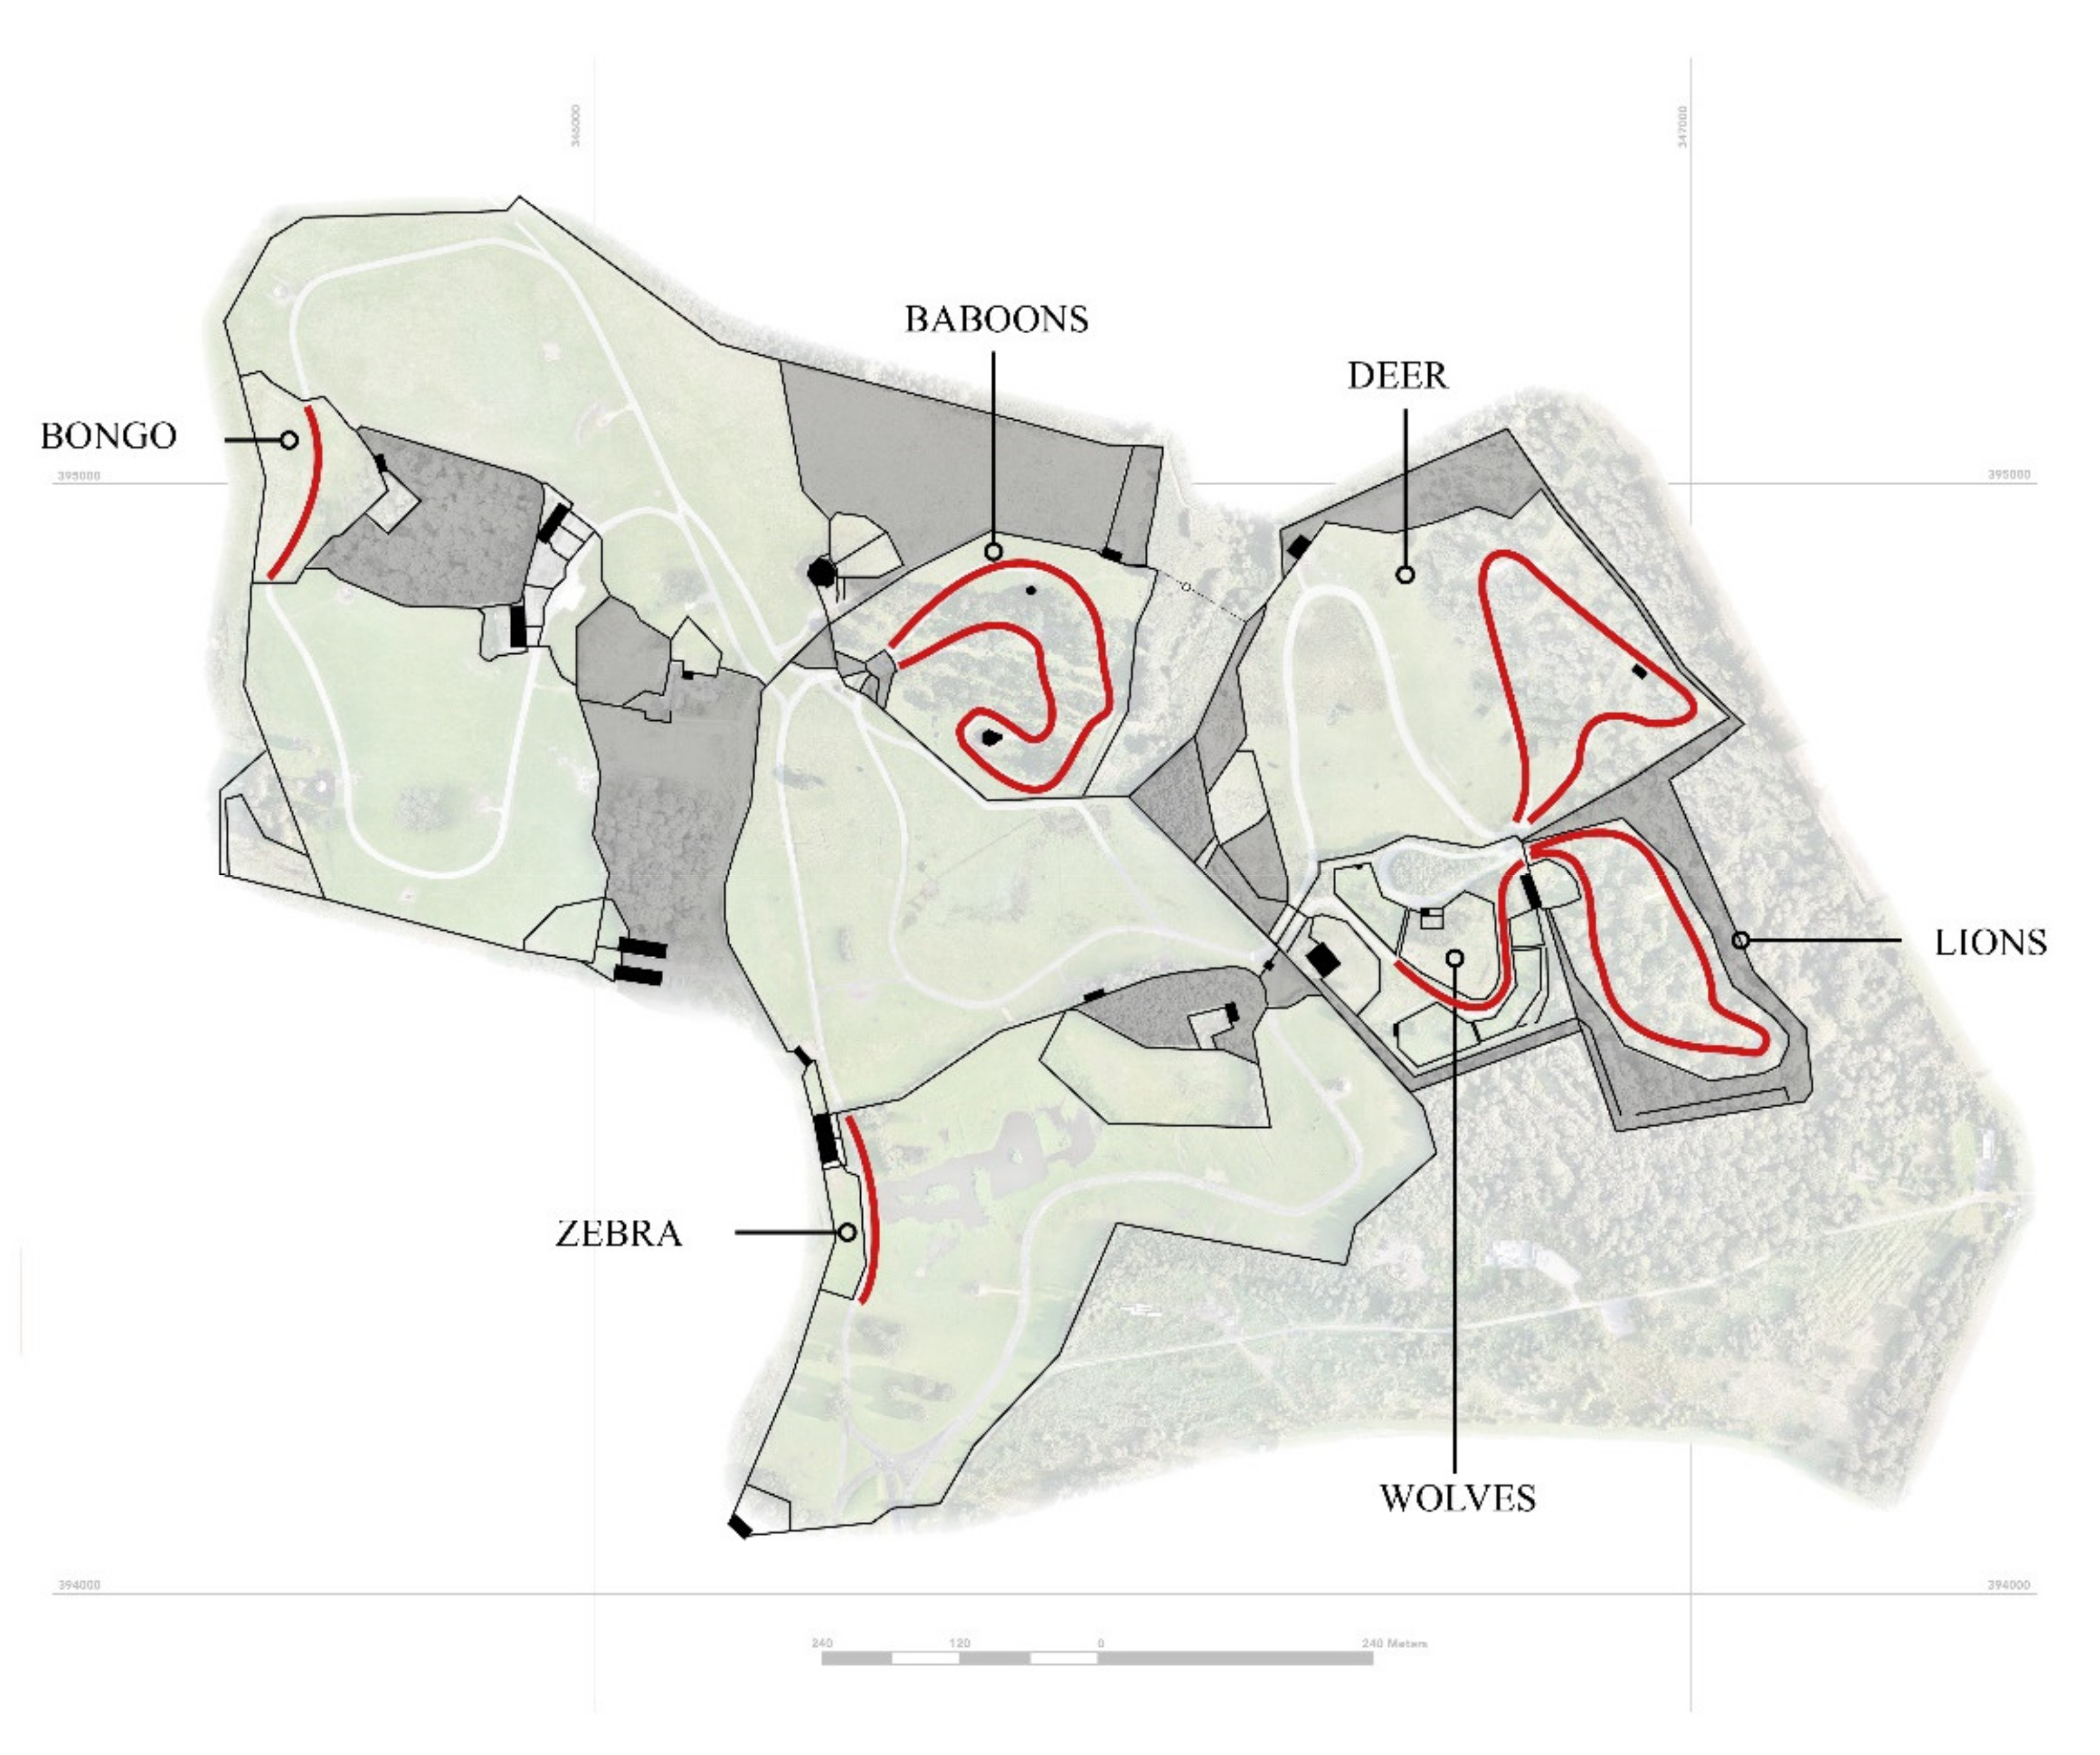
2.1. Study Site
2.2. Data Collection
Data Analysis
3. Results
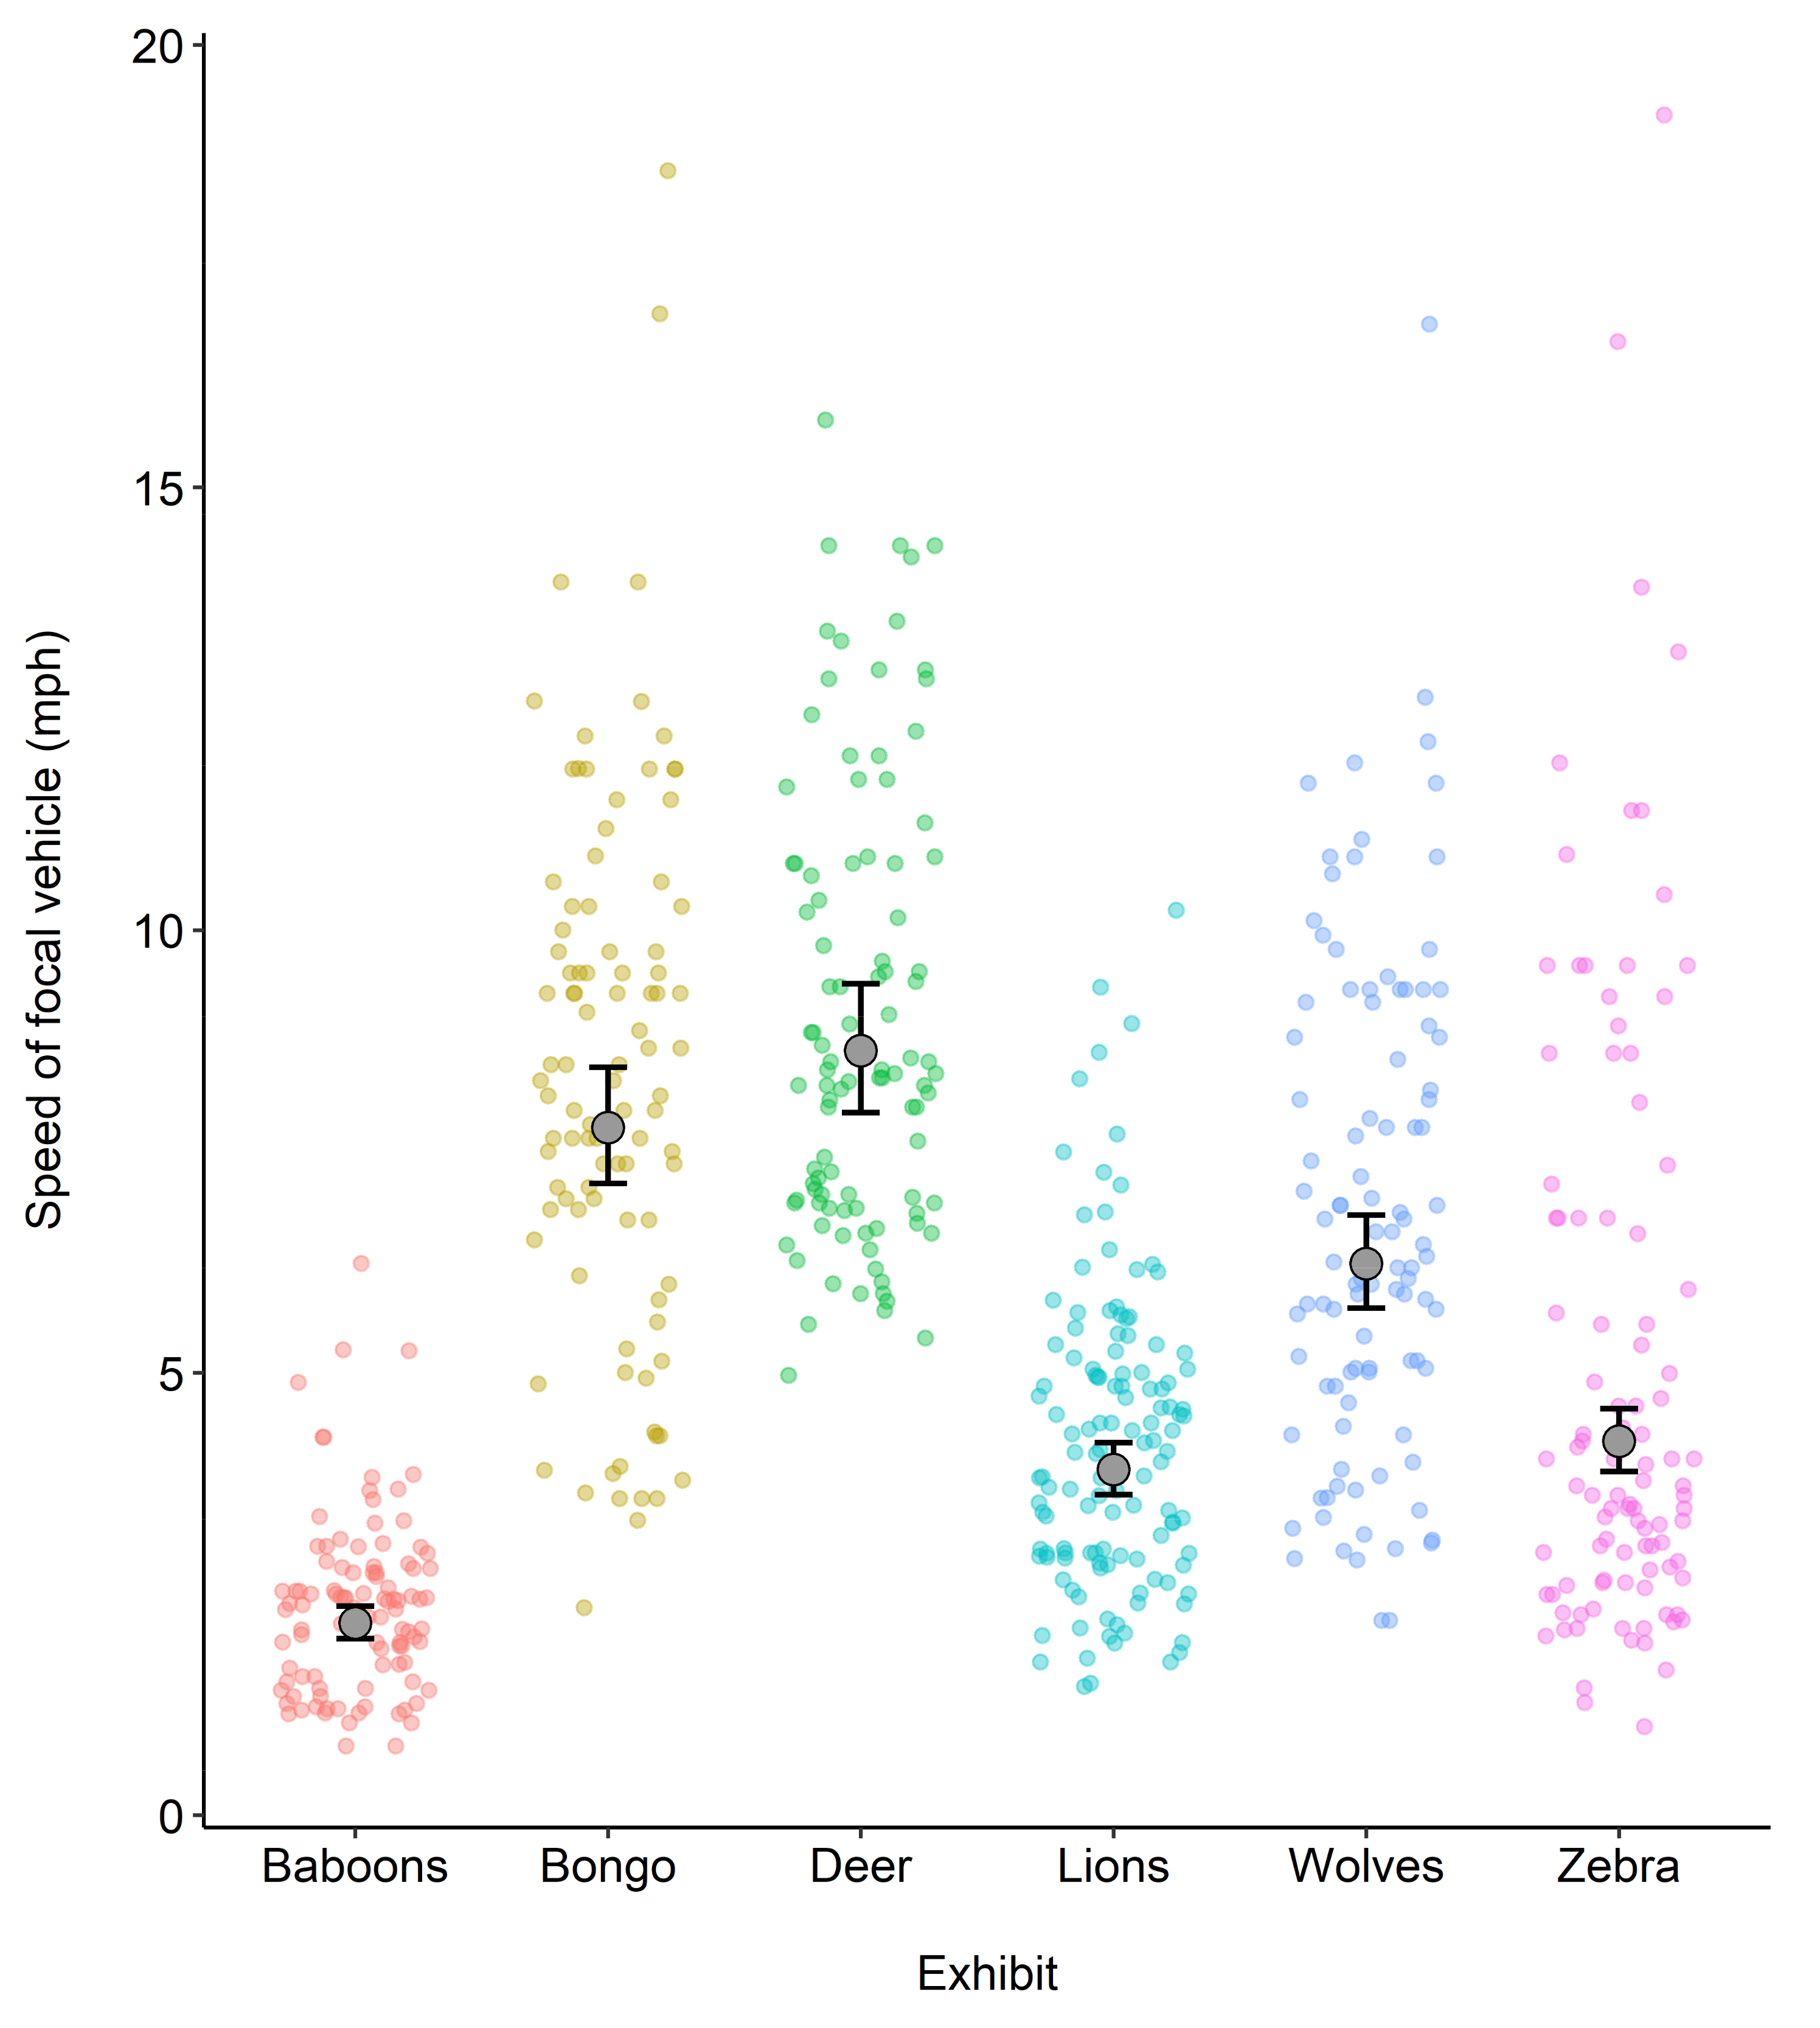
3.1. Exhibit
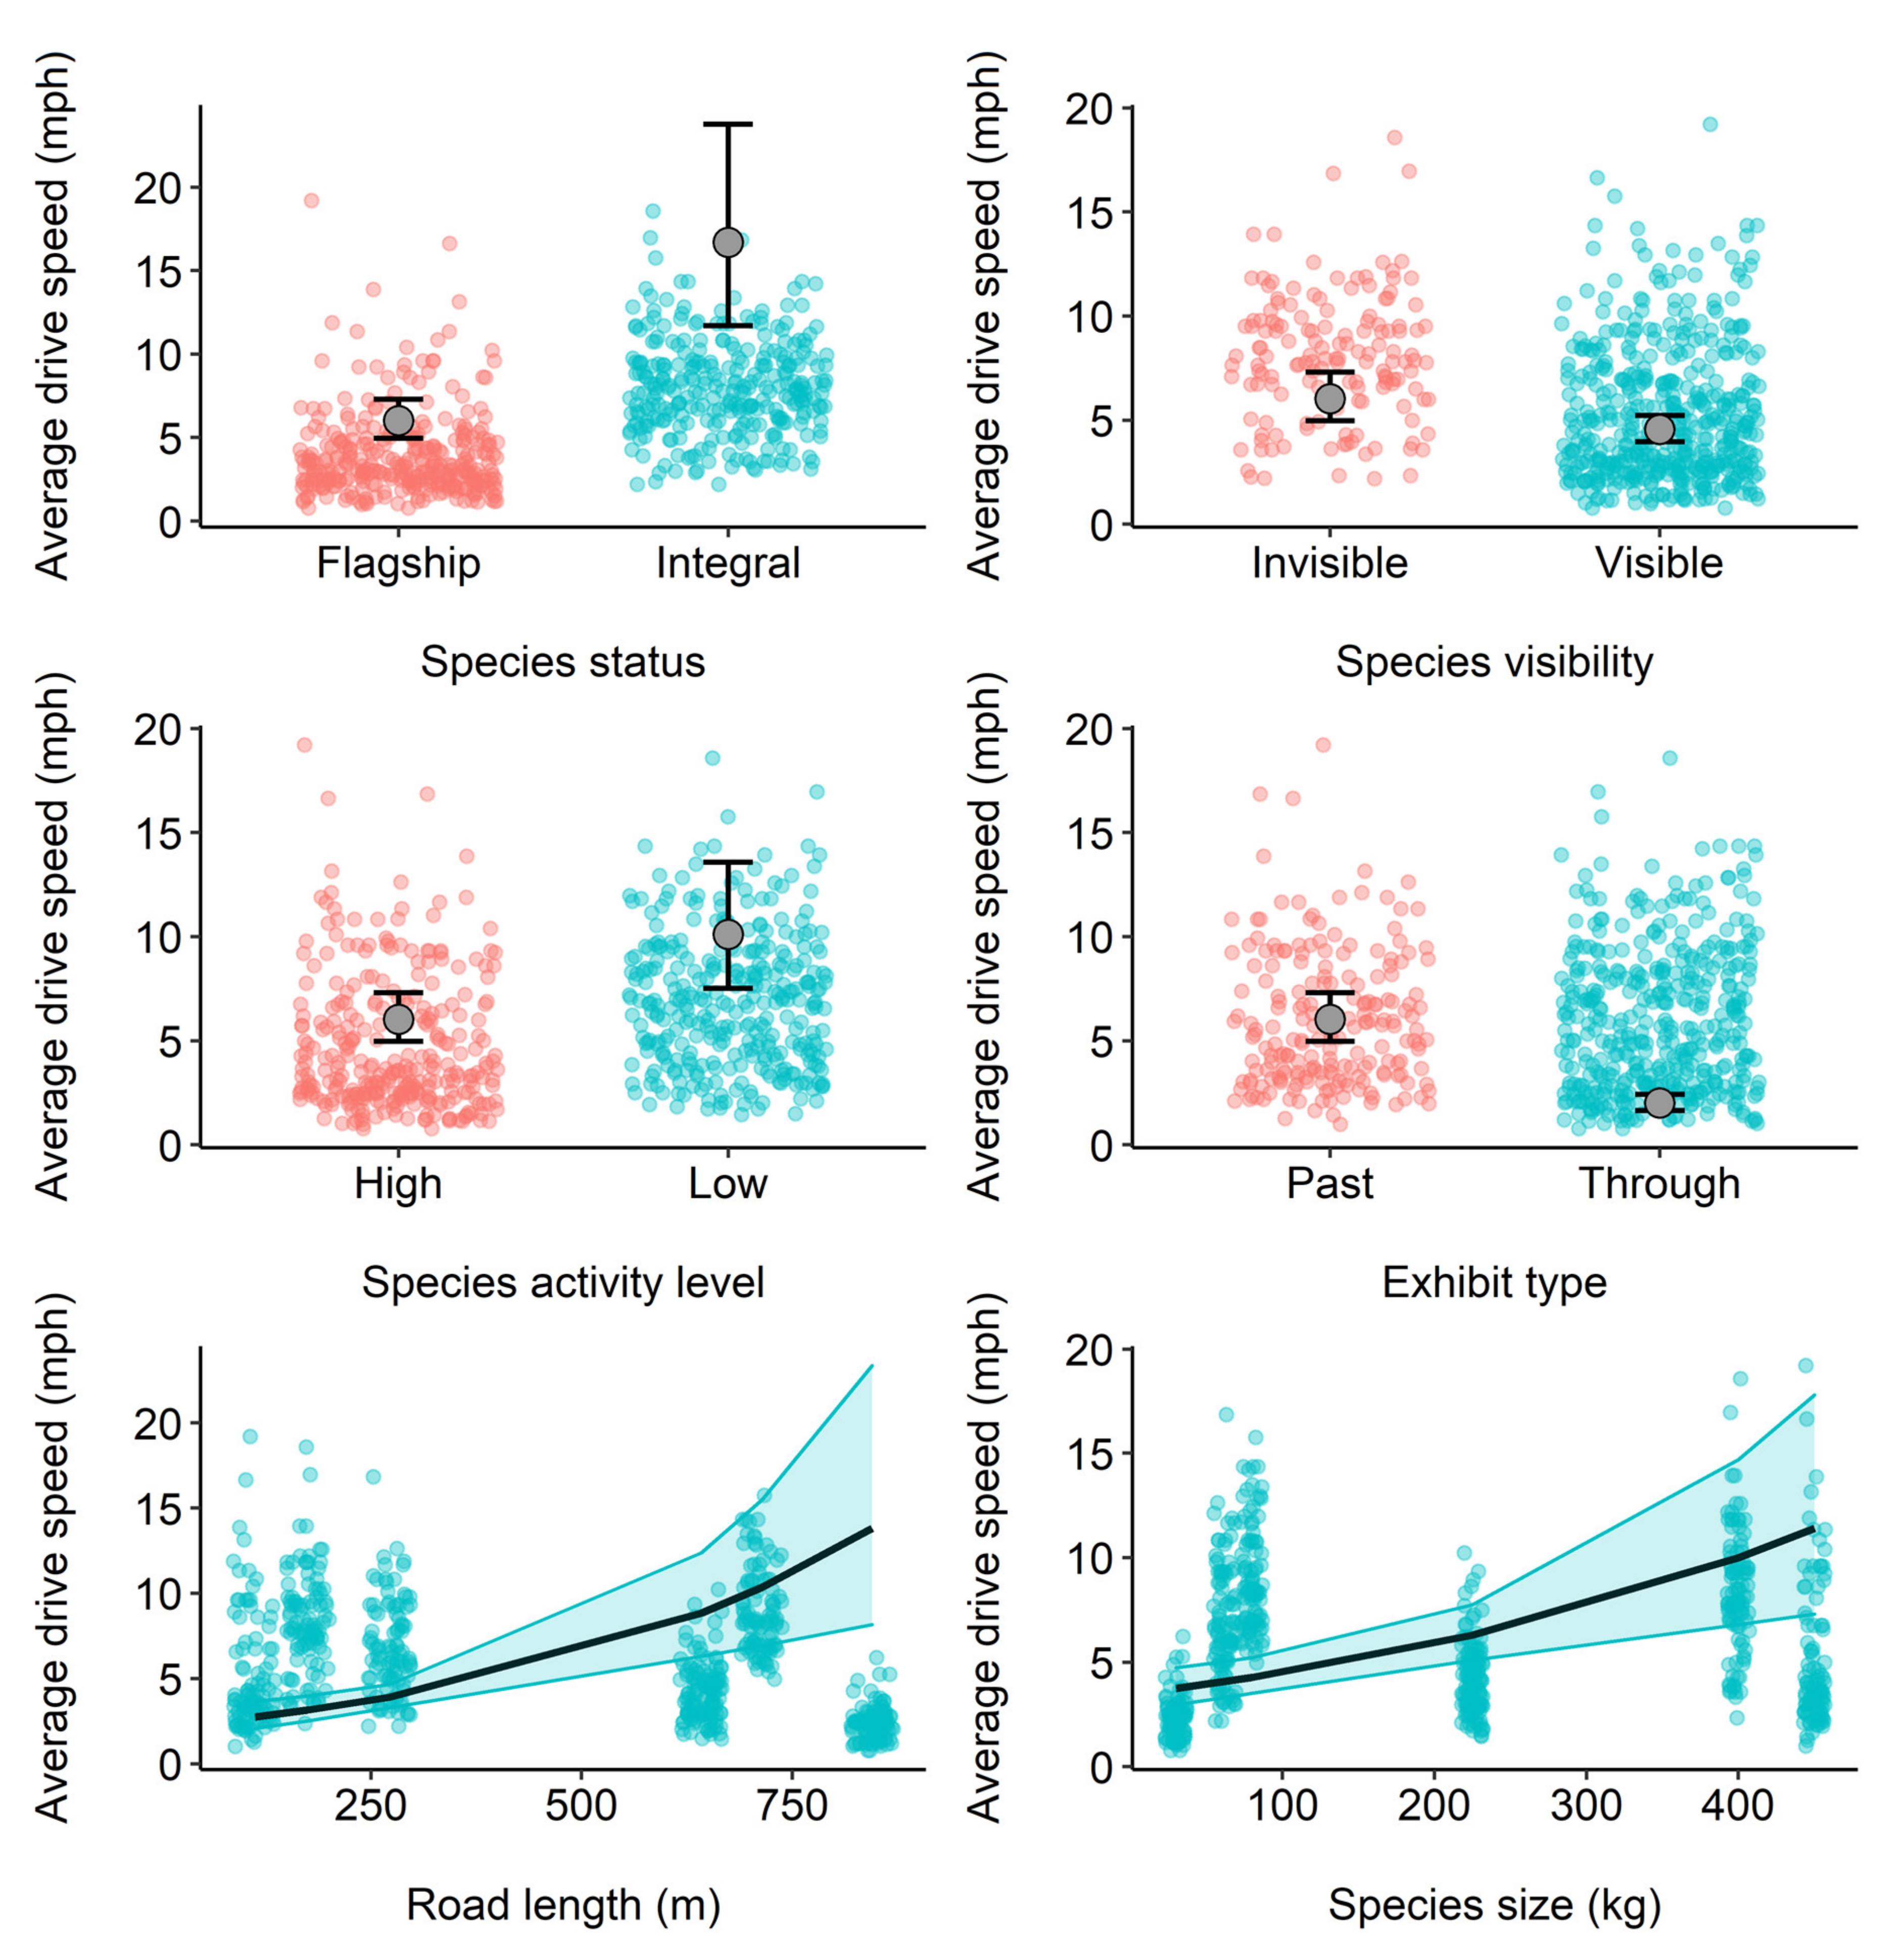
3.2. Species Traits and Exhibit Features
4. Discussion
Study Limitations and Future Work
Supplementary Materials
Author Contributions
Funding
Institutional Review Board Statement
Informed Consent Statement
Data Availability Statement
Acknowledgments
Conflicts of Interest
References
- Falk, J.H. Free-Choice Environmental Learning: Framing the Discussion. Environ. Educ. Res. 2005, 11, 265–280. [Google Scholar] [CrossRef]
- Moss, A.; Esson, M. Visitor interest in zoo animals and the implications for collection planning and zoo education programmes. Zoo Biol. 2010, 29, 715–731. [Google Scholar] [CrossRef]
- Roe, K.; McConney, A. Do zoo visitors come to learn? An internationally comparative, mixed-methods study. Environ. Educ. Res. 2014, 21, 1–20. [Google Scholar] [CrossRef]
- Carr, N.; Cohen, S. The Public Face of Zoos: Images of Entertainment, Education and Conservation. Anthrozoös 2011, 24, 175–189. [Google Scholar] [CrossRef] [Green Version]
- EAZA Specialist Programmes. Available online: https://www.eaza.net/conservation/programmes/ (accessed on 10 January 2021).
- Godinez, A.M.; Fernandez, E.J. What Is the Zoo Experience? How Zoos Impact a Visitor’s Behaviors, Perceptions, and Conservation Efforts. Front. Psychol. 2019, 10, 1746. [Google Scholar] [CrossRef] [PubMed] [Green Version]
- Hosey, G.; Melfi, V.; Ward, S.J. Problematic Animals in the Zoo: The Issue of Charismatic Megafauna. In Problematic Wildlife II, 1st ed.; Angelici, F., Rossi, L., Eds.; Springer International Publishing: Cham, Switzerland, 2020; pp. 485–508. [Google Scholar]
- Mooney, A. The Value of Ex Situ Collections for Global Biodiversity Conservation in the Wild. Ph.D. Thesis, The University of Dublin, Dublin, Ireland, 2021. [Google Scholar]
- Learmonth, M.J.; Chiew, S.J.; Godinez, A.; Fernandez, E.J. Animal-Visitor Interactions and the Visitor Experience: Visitor Behaviors, Attitudes, Perceptions, and Learning in the Modern Zoo. Anim. Behav. Cogn. 2021, 8, 632–649. [Google Scholar] [CrossRef]
- Bitgood, S.; Patterson, D.; Benefield, A. Exhibit Design and Visitor Behaviour: Empirical Relationships. Environ. Behav. 1988, 20, 474–491. [Google Scholar] [CrossRef]
- Whitworth, A. An Investigation into the Determining Factors of Zoo Visitor Attendances in UK Zoos. PLoS ONE 2012, 7, e29839. [Google Scholar] [CrossRef] [Green Version]
- Ward, P.I.; Mosberger, N.; Kistler, C.; Fischer, O. The Relationship between Popularity and Body Size in Zoo Animals. Conserv. Biol. 1998, 12, 1408–1411. [Google Scholar] [CrossRef]
- Hacker, C.E.; Miller, L.J. Zoo visitor perceptions, attitudes, and conservation intent after viewing African elephants at the San Diego Zoo Safari Park. Zoo Biol. 2016, 35, 355–361. [Google Scholar] [CrossRef]
- Luebke, J.F.; Watters, J.V.; Packer, J.; Miller, L.J.; Powell, D.M. Zoo Visitors’ Affective Responses to Observing Animal Behaviors. Visit. Stud. 2016, 19, 60–76. [Google Scholar] [CrossRef]
- Skibins, J.C.; Powell, R.B. Conservation caring: Measuring the influence of zoo visitors’ connection to wildlife on pro-conservation behaviors. Zoo Biol. 2013, 32, 528–540. [Google Scholar] [CrossRef] [PubMed]
- Fukano, Y.; Soga, M.; Fukuda, M.; Takahashi, Y.; Koyama, M.; Arakawa, Y.; Miyano, N.; Akiba, Y.; Horiguchi, M. Debut of an endangered bird in zoos raises public interest, awareness and conservation knowledge of the species. Anim. Conserv. 2021, 24, 914–924. [Google Scholar] [CrossRef]
- Moss, A.; Jensen, E.; Gusset, M. Evaluating the contribution of zoos and aquariums to Aichi Biodiversity Target 1. Conserv. Biol. 2015, 29, 537–544. [Google Scholar] [CrossRef] [PubMed]
- Spooner, S.L.; Jensen, E.A.; Tracey, L.; Marshall, A.R. Evaluating the effectiveness of live animal shows at delivering information to zoo audiences. Int. J. Sci. Educ. Part B 2021, 11, 1–16. [Google Scholar] [CrossRef]
- Chiapero, F.; Ferrari, R.H.; Guglielmetti, A.; Capocasa, M.C.G.; Busso, J.M. Visitors’ perceptions of zoo-housed lesser anteater (Tamandua tetradactyla) welfare: Observation plays a larger role than a brief informative talk. Zoo Biol. 2021, 40, 33–43. [Google Scholar] [CrossRef] [PubMed]
- Cambridge Dictionary. Available online: https://dictionary.cambridge.org/dictionary/english/safari-park/ (accessed on 10 January 2021).
- Wilson, D.; Mittermeier, R.; Ruff, S.; Martínez, A.; Hoyo Calduch, J.; Cavallini, P. Handbook of the Mammals of the World: Volume 1—Carnivores, 1st ed.; Lynx Edicions: Barcelona, Spain, 2009. [Google Scholar]
- Wilson, D.; Mittermeier, R.; Ruff, S.; Martínez, A.; Hoyo Calduch, J.; Cavallini, P. Handbook of the Mammals of the World: Volume 2—Hoofed Mammals, 1st ed.; Lynx Edicions: Barcelona, Spain, 2011. [Google Scholar]
- Wilson, D.; Mittermeier, R.; Ruff, S.; Martínez, A.; Hoyo Calduch, J.; Cavallini, P. Handbook of the Mammals of the World: Volume 3—Primates, 1st ed.; Lynx Edicions: Barcelona, Spain, 2013. [Google Scholar]
- RC Team. A Language and Environment for Statistical Computing; R Foundation for Statistical Computing: Vienna, Austria, 2009; Available online: http://www.R-project.org (accessed on 1 November 2021).
- Hartig, F. DHARMa: Residual Diagnostics for Hierarchical (Multi-Level/Mixed) Regression Models. R Package Version 0.2 2019. Available online: https://CRAN.R-project.org/package=DHARMa (accessed on 1 November 2021).
- Lenth, R.; Singmann, H.; Love, J.; Buerkner, P.; Herve, M. R Package emmeans. CRAN 2019, 1, 3. [Google Scholar]
- Nakagawa, S.; Schielzeth, H. A general and simple method for obtainingR2from generalized linear mixed-effects models. Methods Ecol. Evol. 2012, 4, 133–142. [Google Scholar] [CrossRef]
- Lüdecke, D. Sjstats: Statistical Functions for Regression Models (Version 0.17.9). 2020. Available online: https://zenodo.org/record/1489175#.YYuSDWDMKUk (accessed on 1 November 2021). [CrossRef]
- Bates, D.; Mächler, M.; Bolker, B.; Walker, S. Fitting Linear Mixed-Effects Models Using lme4. J. Stat. Softw. 2015, 67, 1–48. [Google Scholar] [CrossRef]
- Iio, K.; Guo, X.; Lord, D. Examining driver distraction in the context of driving speed: An observational study using disruptive technology and naturalistic data. Accid. Anal. Prev. 2021, 153, 105983. [Google Scholar] [CrossRef]
- Carr, N. An analysis of zoo visitors’ favourite and least favourite animals. Tour. Manag. Perspect. 2016, 20, 70–76. [Google Scholar] [CrossRef]
- Myers, O.E.; Saunders, C.D.; Birjulin, A.A. Emotional Dimensions of Watching Zoo Animals: An Experience Sampling Study Building on Insights from Psychology. Curator Mus. J. 2004, 47, 299–321. [Google Scholar] [CrossRef]
- Plous, S. Psychological Mechanisms in the Human Use of Animals. J. Soc. Issues 1993, 49, 11–52. [Google Scholar] [CrossRef]
- Smart, T.; Counsell, G.; Quinnell, R. The impact of immersive exhibit design on visitor behaviour and learning at Chester Zoo, UK. J. Zoo Aquar. Res. 2021, 9, 139–149. [Google Scholar]
- Albert, C.; Luque, G.M.; Courchamp, F. The twenty most charismatic species. PLoS ONE 2018, 13, e0199149. [Google Scholar] [CrossRef] [PubMed] [Green Version]
- Colléony, A.; Clayton, S.; Couvet, D.; Jalme, M.S.; Prévot, A.-C. Human preferences for species conservation: Animal charisma trumps endangered status. Biol. Conserv. 2017, 206, 263–269. [Google Scholar] [CrossRef] [Green Version]
- Patterson, D.; Bitgood, S. Some evolving principles of visitor behavior. Visit. Stud. 1988, 1, 40–50. [Google Scholar] [CrossRef]
- Yoshimura, Y.; Sobolevsky, S.; Ratti, C.; Girardin, F.; Carrascal, J.P.; Blat, J.; Sinatra, R. An Analysis of Visitors’ Behavior in the Louvre Museum: A Study Using Bluetooth Data. Environ. Plan. B Plan. Des. 2014, 41, 1113–1131. [Google Scholar] [CrossRef] [Green Version]
- Hardy, A.; Hyslop, S.; Booth, K.; Robards, B.; Aryal, J.; Gretzel, U.; Eccleston, R. Tracking tourists’ travel with smartphone-based GPS technology: A methodological discussion. Inf. Technol. Tour. 2017, 17, 255–274. [Google Scholar] [CrossRef]


| Species Trait/ Exhibit Feature | Category | Definition |
|---|---|---|
| Visibility of species | Visible | Any one individual of species held in exhibit was visible to car at time of car passing. |
| Invisible | No individuals of species held in exhibit were visible to car at time of car passing. | |
| Exhibit type | Past | Animals are enclosed behind a fence along a road. |
| Through | Animals are free to roam along a road. | |
| Road length (m) | Continuous | Length of road in m as measured using Google Maps. |
| Species status | Flagship | The focal species of a particular safari zone/exhibit. |
| Integral | A supportive species housed within or near a focal species zone/exhibit [2]. | |
| Species size (kg) | Continuous | Upper limit of male weight range [21,22,23]. |
| Species activity level | Low | When visible, the species is inactive and/or displays a variety of inactive behaviours (e.g., sleep, sitting). |
| High | When visible, the species is active and/or displays a variety of active behaviours (e.g., play, locomotion). |
| Exhibit | Exhibit Type | Road Length (m) | Exhibit Species | Species Status | Species Size (kg) | Species Activity Level |
|---|---|---|---|---|---|---|
| Zebra | Past | 112 | Grévy’s zebra (Equus grevyi) (2.0.0) | Flagship | 450 | High |
| Bongo | Through | 175 | Eastern bongo (Tragelaphus eurycerus) (2.0.0) | Integral | 400 | Low |
| Baboons | Through | 845 | Olive baboon (Papio anubis) (0.0.230) | Flagship | 30 | High |
| Deer | Through | 714 | Fallow deer (Dama dama) (0.0.56) | Integral | 80 | Low |
| Lions | Through | 642 | African lion (Panthera leo) (2.4) | Flagship | 225 | Low |
| Wolves | Past | 272 | Iberian wolf (Canis lupus signatus) (4.2.0) | Integral | 62 | High |
Publisher’s Note: MDPI stays neutral with regard to jurisdictional claims in published maps and institutional affiliations. |
© 2021 by the authors. Licensee MDPI, Basel, Switzerland. This article is an open access article distributed under the terms and conditions of the Creative Commons Attribution (CC BY) license (https://creativecommons.org/licenses/by/4.0/).
Share and Cite
Lloyd, M.; Walsh, N.D.; Johnson, B. Investigating Visitor Activity on a Safari Drive. J. Zool. Bot. Gard. 2021, 2, 576-585. https://doi.org/10.3390/jzbg2040041
Lloyd M, Walsh ND, Johnson B. Investigating Visitor Activity on a Safari Drive. Journal of Zoological and Botanical Gardens. 2021; 2(4):576-585. https://doi.org/10.3390/jzbg2040041
Chicago/Turabian StyleLloyd, Matthew, Naomi Davies Walsh, and Bridget Johnson. 2021. "Investigating Visitor Activity on a Safari Drive" Journal of Zoological and Botanical Gardens 2, no. 4: 576-585. https://doi.org/10.3390/jzbg2040041
APA StyleLloyd, M., Walsh, N. D., & Johnson, B. (2021). Investigating Visitor Activity on a Safari Drive. Journal of Zoological and Botanical Gardens, 2(4), 576-585. https://doi.org/10.3390/jzbg2040041