
Article

Real-Gas Corrected Knudsen-Based Flow Regime Mapping of Methane in Nanoporous Media: Sensitivity, Validity Limits, and Engineering Implications

Petroleum and Energy Engineering, School of Science and Engineering, The American University in Cairo, New Cairo 11835, Egypt
*
Author to whom correspondence should be addressed.
Gases 2026, 6(3), 31; https://doi.org/10.3390/gases6030031
Submission received: 25 March 2026 / Revised: 7 June 2026 / Accepted: 16 June 2026 / Published: 1 July 2026
(This article belongs to the Topic Petroleum and Gas Engineering, 2nd edition)

Abstract

Understanding how methane moves through nanoporous media is key to predicting performance in unconventional gas reservoirs. At these extremely small scales, pore sizes approach the molecular level, where classical flow assumptions begin to fail and multiple transport mechanisms can occur at the same time. In this work, a unified framework is developed to characterize methane flow regimes using a real-gas corrected Knudsen number. By combining pore size, pressure, and temperature within a single formulation, the approach captures how flow behavior evolves across realistic reservoir conditions. A unified flow regime map is used to characterize the gradual shift in transport behavior—from adsorption-dominated and diffusion-like mechanisms in ultra-tight pores, to transition and slip flow, and eventually to continuum (Darcy) flow in larger pores. The results show that pore size plays the dominant role in determining flow behavior, while pressure introduces a dynamic effect, particularly during reservoir depletion. Sensitivity analysis also highlights that flow regime classification depends not only on thermodynamic conditions but also on molecular-scale parameters such as methane diameter. Comparison with established models and experimental observations shows that the framework captures the expected increase in rarefaction effects at low pressures and small pore sizes. Overall, the results emphasize that gas transport in nanoporous systems is not governed by a single mechanism but evolves over time and across scales. The proposed framework offers a simple, physically grounded tool for identifying dominant transport mechanisms and supporting model selection, while also providing a foundation for more advanced descriptions of gas flow in unconventional reservoirs.

1. Introduction

Gas flow in porous media is governed by the interaction between fluid properties and pore geometry. In conventional hydrocarbon reservoirs, pore sizes are generally large enough for continuum-based Darcy flow assumptions to remain valid [1,2,3,4,5,6]. However, unconventional gas reservoirs are characterized by extremely small pore diameters and ultra-low permeability, where molecular-scale effects begin to influence transport mechanisms. Under such confinement, the characteristic pore size may approach the mean free path of gas molecules, leading to deviations from classical viscous flow [7,8,9,10,11,12].
Significant research efforts have been devoted to understanding gas transport in nanoporous media, particularly in unconventional reservoirs where pore sizes approach the molecular scale. Under such conditions, classical continuum assumptions begin to break down, and transport behavior becomes increasingly governed by a combination of mechanisms rather than a single dominant process. Early studies highlighted that nanoscale confinement leads to deviations from Darcy flow, often resulting in underprediction of gas production when conventional models are applied [13,14,15].
Building on this foundation, subsequent research introduced multi-mechanistic frameworks that incorporate slip flow, Knudsen diffusion, and, in some cases, surface diffusion. These models demonstrated that gas transport in nanopores cannot be adequately described without accounting for rarefaction effects and gas–solid interactions, particularly at low pressures [16]. At the same time, analytical and semi-empirical formulations have been developed to bridge the gap between continuum and free-molecular flow regimes, providing improved estimates of apparent permeability across a wide range of conditions [17,18,19,20,21].
More recently, attention has shifted toward capturing the combined effects of pore structure, thermodynamic conditions, and multiscale transport behavior. Numerical approaches, including lattice Boltzmann methods and pore-network modeling, have provided deeper insight into the role of pore geometry and connectivity, while experimental studies have linked pore size distribution and microstructural characteristics to permeability evolution and flow regime transitions [22,23,24,25,26,27,28,29,30]. These efforts collectively reinforce the view that gas transport in nanoporous systems is inherently complex, highly condition-dependent, and sensitive to both pore-scale and fluid properties [30,31].
Despite these advances, most existing studies focus on developing transport models or permeability corrections under specific assumptions or limited operating conditions [32,33,34,35,36,37,38,39]. As a result, there remains a need for a more generalized and physically intuitive framework that can systematically describe how flow regimes evolve across nanopore sizes under varying pressure and temperature conditions [39,40,41,42,43,44,45,46,47,48]. Such a framework would provide a practical bridge between fundamental transport theory and engineering application, enabling rapid identification of dominant flow mechanisms without immediately resorting to detailed multiphysics modeling [48,49,50,51,52].
The objective of this study is to develop a physically consistent and practically useful framework for identifying methane flow regimes in nanoporous media under realistic reservoir conditions. By incorporating real-gas effects into the Knudsen number formulation, the approach establishes a direct link between pore size, pressure, and temperature, enabling a continuous description of transport behavior across a wide range of conditions. A unified flow regime map is constructed to clearly illustrate the transition between diffusion-dominated, slip, and continuum flow mechanisms, while also highlighting the regions where multiple transport processes may coexist.
In addition, the sensitivity of flow regime classification to key parameters—including pressure, temperature, and methane molecular diameter—is systematically evaluated to assess the robustness of the framework. This analysis provides insight into how reservoir depletion and molecular-scale uncertainties can influence the dominant transport mechanism. Rather than replacing detailed transport or simulation models, the proposed framework is intended as a first-order engineering tool that supports model selection, improves physical interpretation, and offers a structured foundation for more advanced descriptions of gas flow in unconventional reservoirs.

2. Knudsen Number

The Knudsen number (Kn) is a dimensionless parameter that characterizes the degree of rarefaction of a gas by comparing the molecular mean free path to a characteristic length scale of the system, typically the pore diameter in porous media, shown in Equation (1).
K n = λ d p
where λ is the molecular mean free path (m) and d p is the pore diameter (m).
For ideal gases, the mean free path is commonly expressed as shown in Equation (2):
λ = k B T 2 π d m 2 P
However, under reservoir conditions—particularly at elevated pressures—the assumption of ideal gas behavior becomes inaccurate. To account for real gas effects, the mean free path can be corrected using the gas compressibility factor Z , yielding Equation (3):
λ = k B T 2 π d m 2 P Z
where Z accounts for deviations from ideal gas behavior and depends on pressure, temperature, and gas composition.
This correction is particularly important in unconventional reservoirs, where pressures commonly exceed several thousand psi, leading to significant deviations from ideal gas assumptions. Neglecting real gas effects may result in an underestimation of intermolecular collision frequency and misclassification of flow regimes.
While the integration of the compressibility factor (Z) into the mean free path formulation is a classical thermodynamic adjustment, its systematic deployment across a continuous 2D matrix of pressures and nanoscale pore sizes provides the baseline data necessary for operational flow diagnostics.
The Knudsen number provides a continuum of flow behavior rather than discrete transitions. While conventional classifications define regime boundaries at Kn = 0.01, 0.1, and 10, these thresholds should be interpreted as approximate guidelines rather than absolute limits. The exact transition between regimes depends on pore geometry, surface roughness, and gas–surface interactions.
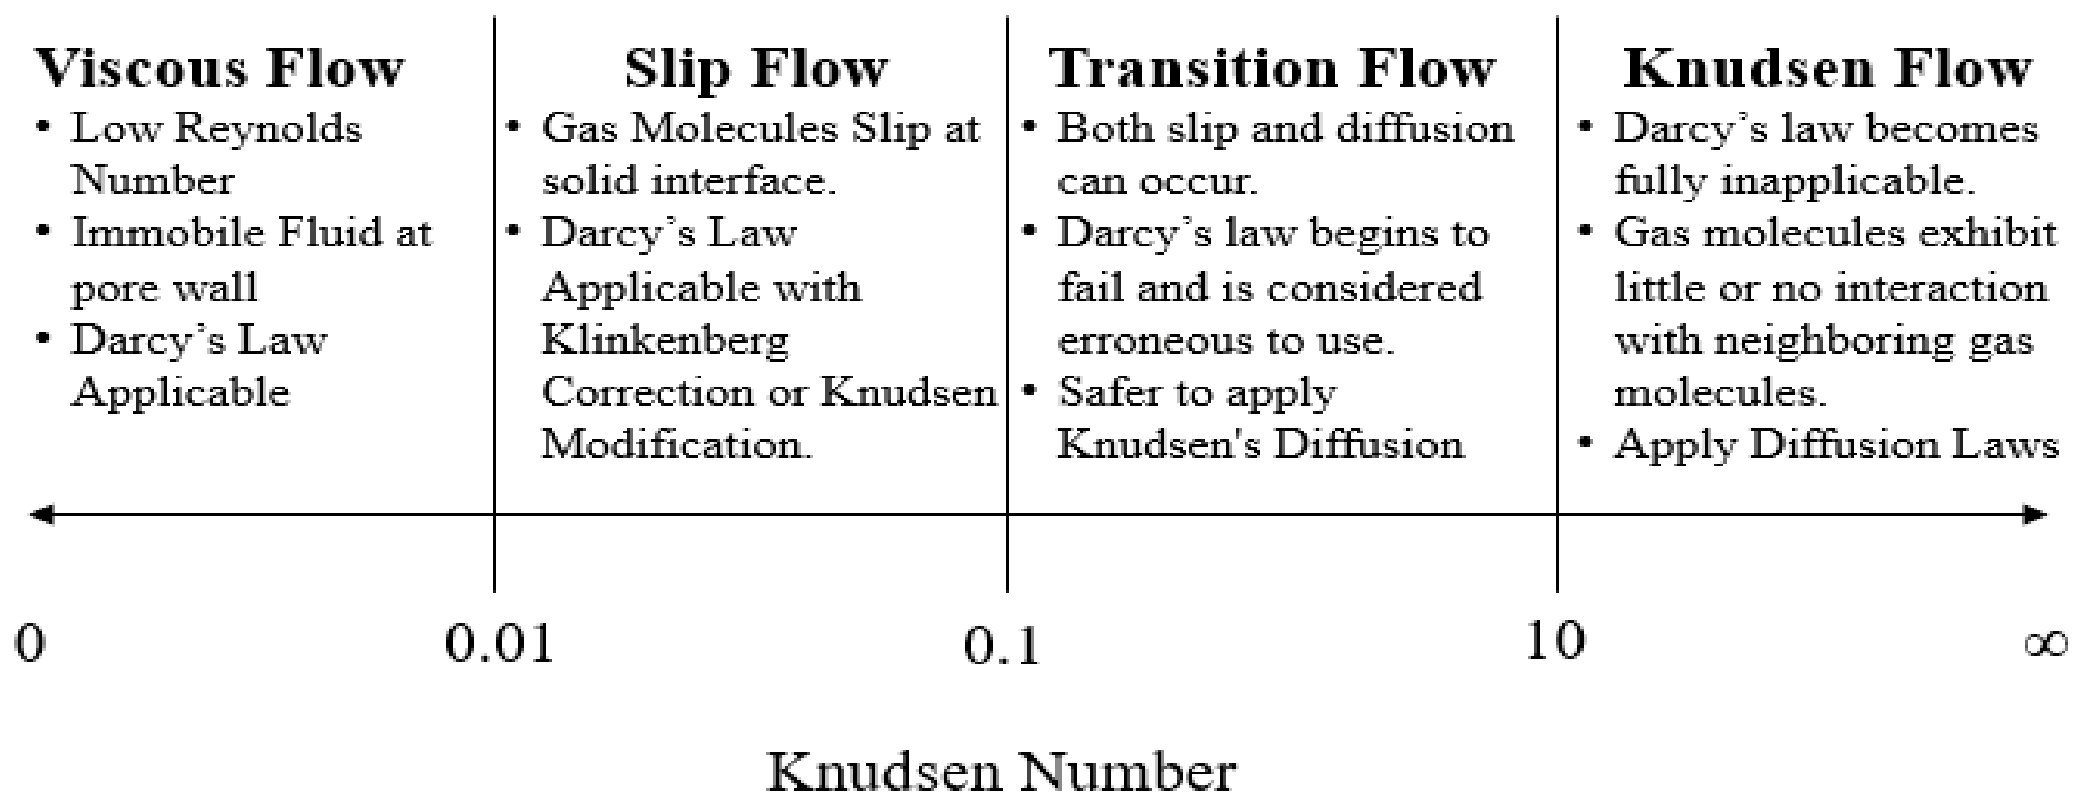
Based on conventional classifications [31,32,33,34,35,36], four primary flow regimes, shown in Figure 1, are as follows:
  • Viscous (Darcy) Flow (Kn < 0.01): This regime dominates when the molecular mean free path is much smaller than the pore diameter. Gas behavior follows continuum assumptions, and classical Darcy’s law applies. The no-slip boundary condition holds, with fluid velocity decreasing to zero at the pore wall.
  • Slip Flow (0.01 < Kn < 0.1): As pore size decreases or pressure is reduced, gas molecules begin to slip at the pore walls, violating the no-slip boundary condition. Under these conditions, apparent permeability increases relative to intrinsic permeability. This behavior is commonly corrected using the Klinkenberg slip factor.
  • Transition Flow (0.1 < Kn < 10): In this intermediate regime, both molecule–molecule and molecule–wall interactions significantly influence transport behavior. Neither continuum assumptions nor purely diffusive models are fully valid, and transport becomes increasingly sensitive to pressure and temperature variations.
  • Knudsen Diffusion (Kn > 10): When the mean free path exceeds the pore diameter, molecule–wall collisions dominate over intermolecular collisions. Gas transport becomes diffusion-controlled, and continuum-based Darcy formulations are no longer applicable. Instead, Knudsen diffusion or Fickian diffusion models are required.
In nanoporous media, additional transport mechanisms such as surface diffusion and adsorption may coexist with these regimes, particularly when pore sizes approach the molecular diameter. Therefore, the Knudsen framework should be interpreted as a primary classification tool within a broader multiphysics transport context.

3. Framework for Flow Regime Mapping

Accurate identification of gas flow regimes in nanoporous media requires a physically consistent framework that links thermodynamic conditions, fluid properties, and pore geometry to the Knudsen number. In this study, flow regime maps are constructed using a real-gas corrected formulation of the Knudsen number, ensuring applicability under reservoir-relevant pressure and temperature conditions.

3.1. Governing Formulation

The flow regime classification is based on the Knudsen number, defined as the ratio of molecular mean free path to pore diameter. To account for high-pressure reservoir conditions, the mean free path is corrected for real gas behavior using the compressibility factor, resulting in Equation (4):
K n = λ d p , λ = k B T 2 π d m 2 P Z
where Z is the gas compressibility factor, introduced to account for deviations from ideal gas behavior at elevated pressures. In this work, the Z factor is dynamically computed across the evaluated pressure and temperature domains utilizing the standard Peng-Robinson Equation of State (PR-EoS). This formulation ensures that intermolecular collision frequency is not underestimated, which is critical for correctly identifying flow regimes in unconventional reservoirs.

3.2. Definition of Input Parameters

The flow regime maps are generated by systematically varying pressure, temperature, and pore diameter within ranges representative of unconventional gas reservoirs:
  • Pressure (P): selected to span typical reservoir and depletion conditions;
  • Temperature (T): selected to reflect subsurface thermal conditions;
  • Pore diameter ( d p ): varied across the nanoscale spectrum.
The methane molecular diameter ( d m ) is treated as a key parameter in the model, directly influencing the mean free path and, consequently, the Knudsen number.

3.3. Physical Constraints and Applicability Limits

At extremely small pore sizes, the assumptions underlying continuum and rarefied gas transport begin to break down. In particular, when the pore diameter approaches the kinetic diameter of methane (approximately 0.38 nm), the concept of free molecular motion becomes physically questionable.
Under such conditions:
  • Gas transport may be dominated by adsorption and surface diffusion;
  • The definition of mean free path loses strict physical meaning;
  • Knudsen-based classification becomes less reliable.
Accordingly, flow regime interpretation at sub-nanometer scales is treated with caution and discussed within the context of these physical limitations.

3.4. Interpretation of Flow Regime Boundaries

Traditional Knudsen number classifications define sharp boundaries between flow regimes (e.g., Kn = 0.01, 0.1, 10). However, in nanoporous media, these transitions are gradual and influenced by pore geometry, surface roughness, and gas–surface interactions.
In this study, these thresholds are interpreted as approximate transition ranges rather than strict boundaries. The resulting maps therefore represent continuous regime evolution, rather than discrete regime switching.

3.5. Model Assumptions

To isolate the fundamental relationship between thermodynamic conditions and flow regime behavior, the following assumptions are adopted:
  • Single-component methane system: Because a pure fluid is considered, classical single-component thermodynamic properties govern the framework, and no multi-component phase mixing rules or binary interaction coefficients are required.
  • Idealized cylindrical pore geometry with smooth walls: While real shale matrices feature highly complex, non-cylindrical (e.g., slit-like) pore networks characterized by significant atomic-scale surface roughness, a smooth cylindrical geometry is utilized as a fundamental baseline to isolate the primary effects of thermodynamic real-gas variations.
  • No explicit modeling of adsorption, surface diffusion, or multicomponent effects
These assumptions allow for clear interpretation of Knudsen scaling while acknowledging that additional mechanisms may influence transport in real shale systems.

3.6. Scope of the Flow Regime Map

The generated map is intended as a first-order engineering tool for identifying dominant transport mechanisms under varying reservoir conditions. They do not replace detailed multiphysics models but instead provide rapid insight into whether continuum, slip, transition, or diffusion-based formulations are most appropriate.
By explicitly incorporating real gas effects and physical constraints, the framework improves the reliability of flow regime classification compared to conventional idealized approaches.

4. Results and Analysis

This section will discuss the developed flow regime map and the impact of pressure, temperature, and pore diameter on the flow of methane. The map will also be validated using different models, and finally, the usability of the map will be discussed.

4.1. Unified Flow Regime Map

To provide a comprehensive and non-redundant representation of methane transport behavior across nanoporous media, a unified flow regime map is constructed by simultaneously accounting for pore diameter, pressure, and temperature using the real-gas corrected Knudsen number formulation.
Unlike the previous pore-by-pore analysis, this approach consolidates all results into a single framework, allowing continuous visualization of flow regime transitions across scales relevant to unconventional reservoirs.
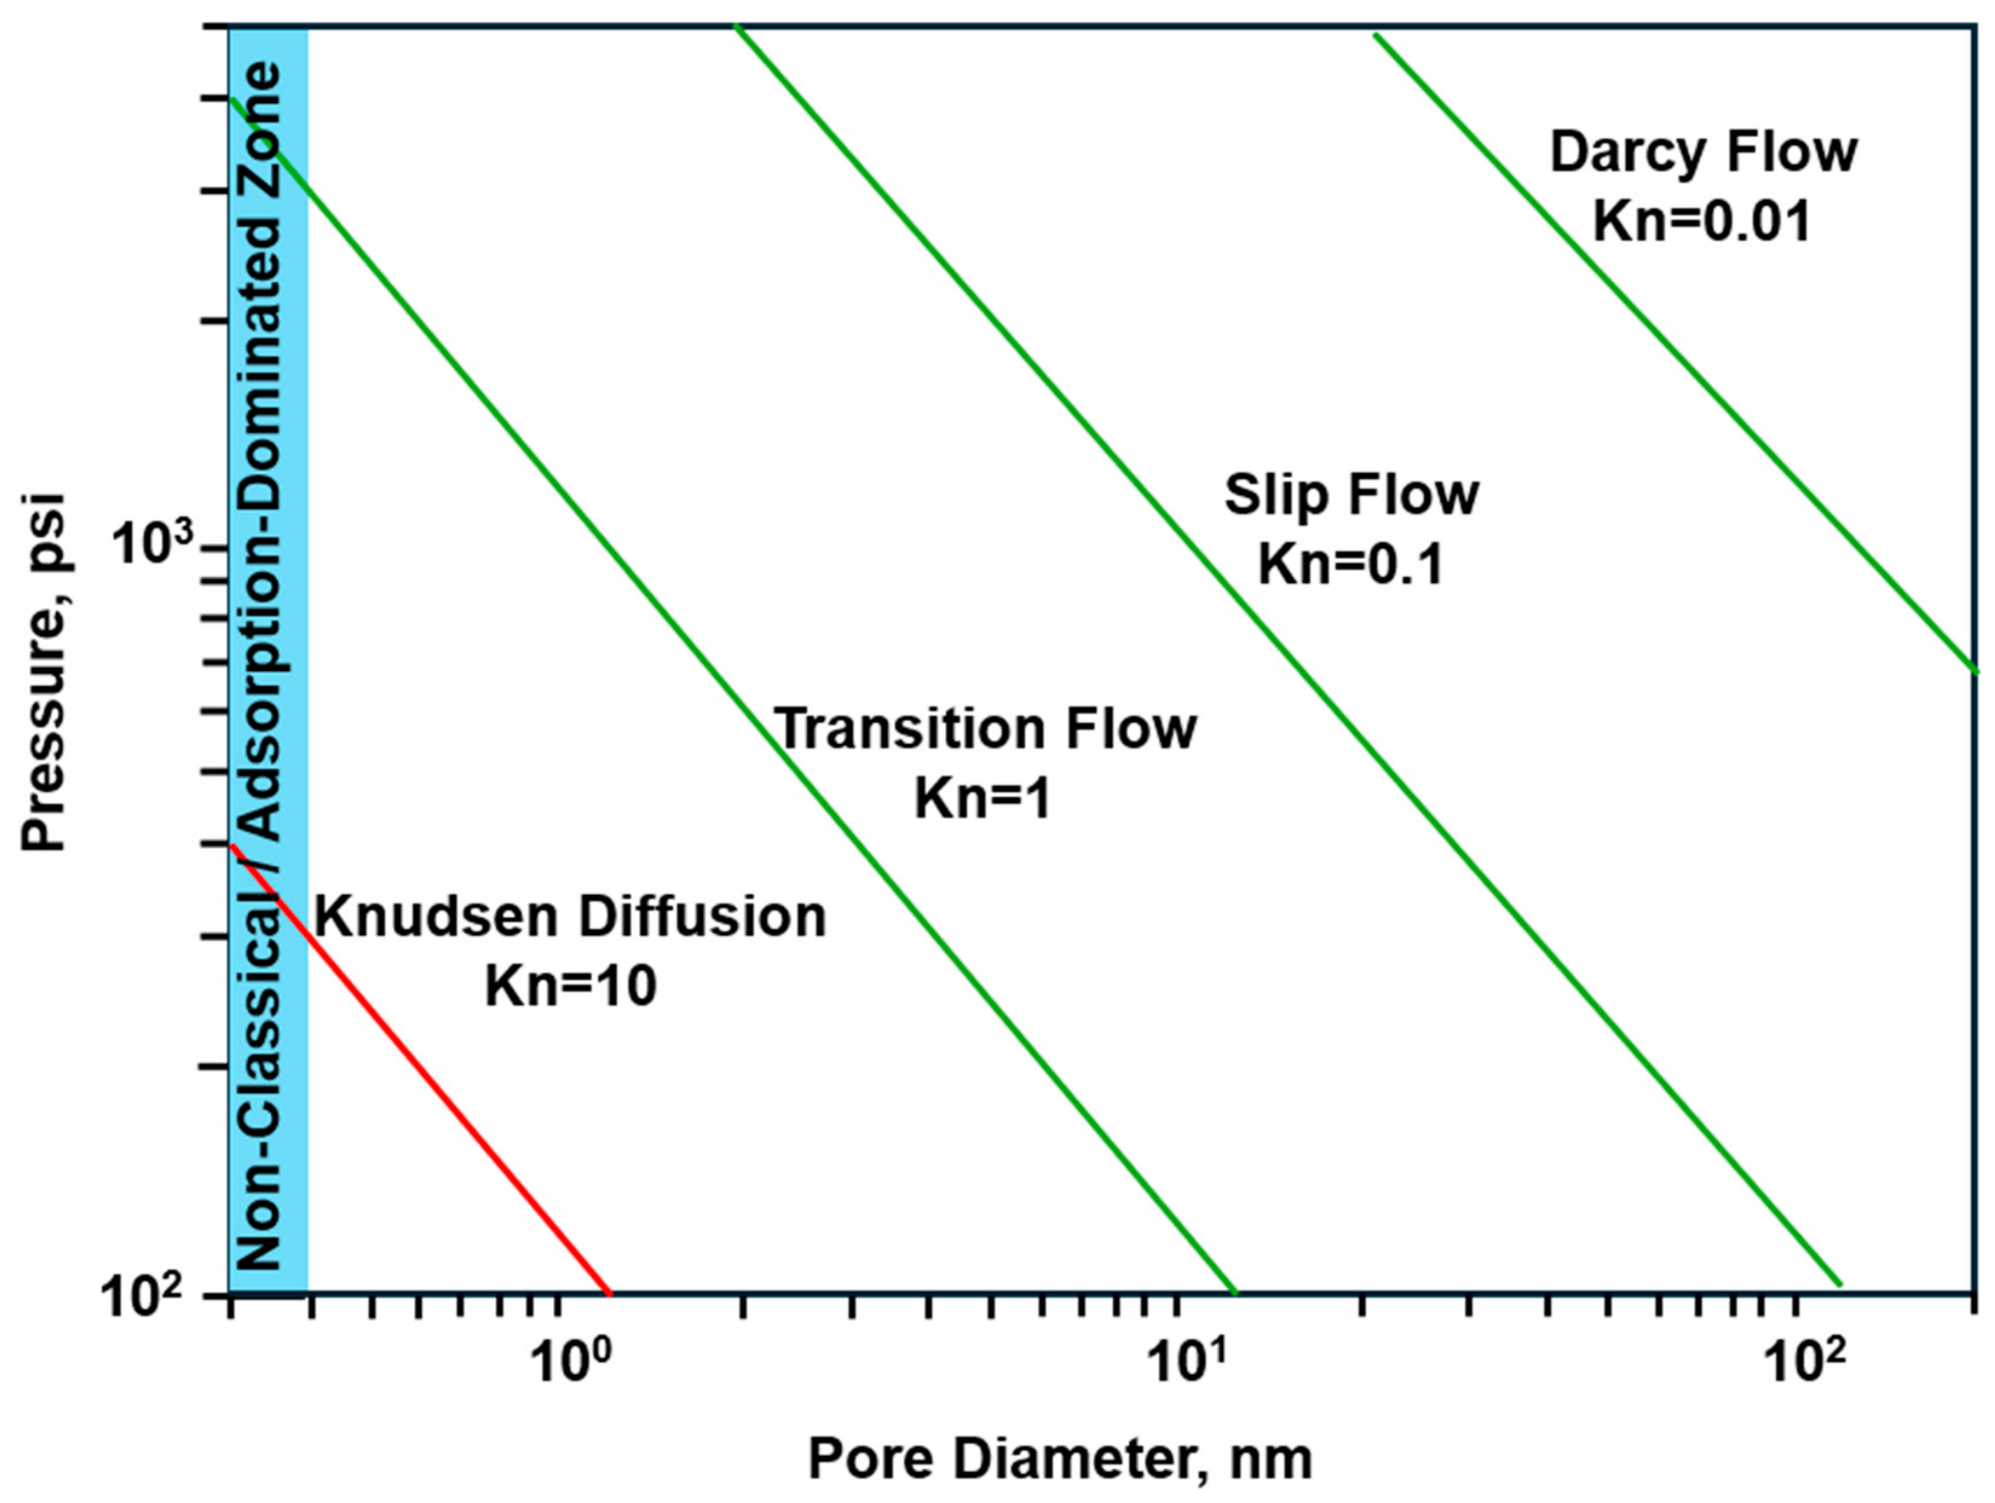
The unified map is presented in Figure 2, where pore diameter is plotted on a logarithmic scale along the x-axis, and pressure is plotted along the y-axis. This map was obtained by calculating Equation (4) at each point across an isothermal 2D grid of pressures and pore diameters. Iso-Knudsen contour lines are explicitly overlaid to define the exact boundaries of the flow regimes according to classical transport thresholds: Kn = 0.01 (Darcy/Slip boundary), Kn = 0.1 (Slip/Transition boundary), and Kn = 10 (Transition/Diffusion boundary). Figure 2 was generated by constructing a continuous two-dimensional matrix across the specified ranges of pore diameter (dp), plotted logarithmically on the x-axis) and pressure (P, plotted on the y-axis) at a constant reservoir temperature. At each discrete grid point within this matrix, the real-gas corrected molecular mean free path was solved using the compressibility factor (Z) to account for non-ideal gas behavior at high pressures. The localized Knudsen number (Kn) was then computed using the governing formulation presented in Equation (3).
Importantly, the unified map also highlights a lower applicability limit of the Knudsen framework, which is visually designated as the blue-shaded ‘Non-Classical/Adsorption-Dominated Zone’ on the extreme left of Figure 2. At pore diameters approaching the methane molecular size (below approximately 0.4 nm), the computed Knudsen number mathematically approaches extreme values. However, as visually isolated on the map, this region must not be interpreted strictly as gas-phase Knudsen diffusion. Instead, it represents a non-classical transport domain where adsorption layers and surface diffusion dominate transport, and the assumptions underlying the molecular mean free path lose physical validity.
As surface roughness increases, molecular scattering becomes heavily diffuse, causing σ v to approach unity or undergo backscattering. Mechanically, this severe loss of tangential momentum suppresses the gas slip velocity at the wall. For the unified screening map presented in Figure 2, the engineering implication of a ‘roughness factor’ is a distinct leftward shift in the transition contours. Because roughness structurally dampens rarefaction effects, continuum (Darcy) and slip flow behaviors persist into significantly smaller pore dimensions than would otherwise be predicted in a perfectly smooth geometry. Incorporating geometry correction factors and dynamic accommodation coefficients remains an essential step for scaling this thermodynamic map to highly specific, localized core-sample lithologies.
Several key trends emerge clearly from this representation. Firstly, pore size exerts the strongest control on flow regime behavior. At very small pore diameters (below approximately 1 nm), the Knudsen number remains high across nearly all pressure conditions, indicating dominance of rarefied transport mechanisms. As pore size increases, the Knudsen number decreases rapidly, reflecting the increasing importance of intermolecular collisions and the gradual restoration of continuum behavior.
Second, pressure plays a critical secondary role. At low pressures, the mean free path increases significantly, shifting the system toward higher Knudsen numbers and promoting transition or diffusion-dominated regimes. Conversely, increasing pressure reduces the mean free path, driving the system toward slip and eventually Darcy flow. This effect is particularly pronounced in intermediate pore sizes (1–50 nm), where modest pressure variations can shift the dominant transport mechanism.
Third, the map reveals that flow regime transitions occur over broad regions rather than sharp boundaries. The traditional classification thresholds (e.g., Kn = 0.01, 0.1, 10) appear as contour bands rather than discrete lines, reinforcing that multiple transport mechanisms may coexist within the same pore size range under varying thermodynamic conditions.
Importantly, the unified map also highlights a lower applicability limit of the Knudsen framework. At pore diameters approaching the methane molecular size (below approximately 0.4 nm), the computed Knudsen number suggests extreme rarefaction. However, this region should not be interpreted strictly as Knudsen diffusion. Instead, it represents a non-classical domain where adsorption and surface diffusion dominate transport, and the assumptions underlying mean free path lose physical validity.
From an engineering perspective, the unified map provides a rapid screening tool for identifying dominant transport mechanisms. For example:
  • Pores smaller than approximately 1 nm are primarily governed by diffusion-dominated or adsorption-controlled transport;
  • Pores in the range of 1–10 nm are dominated by transition flow, where both molecular and continuum effects are important;
  • Pores between 10 and 100 nm exhibit significant slip flow behavior;
  • Pores larger than approximately 100 nm approach continuum conditions where Darcy flow dominates.
This continuous representation eliminates the need for multiple isolated maps and provides a more realistic depiction of how methane transport evolves across nanoporous systems under reservoir conditions.

4.2. Evolution of Flow Regimes with Pore Size

The unified flow regime map (Figure 2) reveals a continuous and systematic evolution of methane transport behavior as pore diameter increases from sub-nanometer confinement to near-continuum conditions. Rather than treating each pore size independently, the results demonstrate that flow regimes transition progressively as a function of the Knudsen number, which scales inversely with pore diameter as shown in Equation (5):
K n 1 d p
This relationship highlights that pore size is the primary controlling parameter governing the transition between transport regimes.

4.2.1. Sub-Nanometer Domain (<~1 nm)

At pore diameters approaching the molecular scale (≈0.3–1 nm), the Knudsen number remains significantly greater than unity across most pressure conditions. However, as clearly demarcated by the ‘Non-Classical/Adsorption-Dominated Zone’ label in Figure 2, this region should not be interpreted strictly as a classical gas-phase Knudsen diffusion regime. Instead, the system enters a non-classical transport domain characterized by strong solid-fluid interactions, restricted molecular mobility, and the absolute dominance of adsorption and surface diffusion over free molecular motion.
Although the Knudsen number mathematically suggests rarefied flow (Kn > 10), the underlying assumptions of free molecular motion are no longer valid. Therefore, this region represents a physical transition limit of the Knudsen framework rather than a true diffusion regime.
From a practical standpoint, gas stored in these ultra-small pores contributes weakly to production and is primarily released through slow desorption processes rather than pressure-driven flow.

4.2.2. Transition-Dominated Regime (≈1–10 nm)

As pore diameter increases beyond the molecular scale, methane molecules gain sufficient space for both intermolecular and molecule–wall collisions to occur. This results in Knudsen numbers typically in the range:
0.1 < K n < 10
In this regime, transport behavior is governed by a coupling of mechanisms, including:
  • Partial viscous flow;
  • Slip effects at pore walls;
  • Residual diffusion contributions.
This mixed behavior makes the transition regime particularly sensitive to pressure and temperature variations. Small changes in thermodynamic conditions can shift the dominant transport mechanism, as reflected by the contour spacing in Figure 2.
From an engineering perspective, this is the most complex and uncertain regime, where simplified models (pure Darcy or pure diffusion) are inadequate. Instead, hybrid or apparent permeability models are typically required.

4.2.3. Slip Flow Regime (≈10–100 nm)

With further increases in pore diameter, the Knudsen number decreases into the slip flow range:
0.01 < K n < 0.1
In this region, intermolecular collisions dominate the bulk flow behavior, but velocity slip at the pore wall remains significant. This deviation from the classical no-slip boundary condition results in enhanced apparent permeability.
The degree of slip can be approximated through corrections using Equation (6) [53]:
k a p p = k 1 + b P
where k a p p is the apparent permeability, k is the intrinsic permeability, and b is the slip factor.
Figure 2 shows that this regime occupies a broad region for pore sizes between approximately 10 and 100 nm, particularly at moderate to low pressures. This indicates that slip flow is highly relevant in unconventional reservoirs and can significantly enhance gas mobility relative to classical Darcy predictions.

4.2.4. Continuum (Darcy) Flow Regime (>~100 nm)

At larger pore diameters, the Knudsen number falls below 0.01:
K n < 0.01
Under these conditions, the mean free path becomes much smaller than the pore diameter, and gas behavior approaches the continuum limit. The no-slip boundary condition becomes valid, and transport can be accurately described using Darcy’s law.
Figure 2 illustrates that this regime dominates at pore sizes above approximately 100 nm, particularly under higher pressure conditions. In this domain:
  • Molecular-scale effects are negligible;
  • Flow is primarily pressure-driven;
  • Conventional reservoir models are applicable.
This transition marks the point at which unconventional reservoirs begin to exhibit behavior similar to conventional systems.

4.2.5. Continuous Regime Transition

A key insight from the unified map is that flow regime transitions are continuous rather than discrete. The Knudsen number varies smoothly with pore size and pressure, resulting in overlapping regions where multiple transport mechanisms may coexist.
This behavior can be understood directly from the governing relationship shown in Equation (7):
K n = k B T 2 π d m 2 P Z d p
which shows that Knudsen number depends simultaneously on:
  • Pore diameter;
  • Pressure;
  • Temperature;
  • Molecular properties.
As a result, no single pore size corresponds to a fixed flow regime. Instead, the dominant transport mechanism depends on the combined effect of these parameters.

4.3. Effect of Pressure and Temperature (Thermodynamic Sensitivity)

The unified flow regime map demonstrates that, in addition to pore size, thermodynamic conditions play a critical role in determining the dominant transport mechanism. Pressure and temperature directly influence the molecular mean free path and, therefore, the Knudsen number, which governs regime classification.

4.3.1. Governing Dependence

From the real-gas corrected formulation shown in Equation (7), it is evident that:
  • K n T P Z
  • K n 1 d p
This relationship shows that pressure and temperature act as competing effects:
  • Increasing temperature increases mean free path, which increases Kn;
  • Increasing pressure decreases mean free path, which decreases Kn.

4.3.2. Effect of Pressure

Pressure has the most pronounced impact on flow regime transitions under reservoir conditions. As pressure increases, intermolecular collisions become more frequent, reducing the mean free path and shifting the system toward continuum behavior.
This effect can be directly observed in Figure 2, where increasing pressure (moving upward along the y-axis) causes a transition:
Knudsen   Diffusion Transition   Flow Slip   Flow Darcy   Flow
For a fixed pore diameter:
  • At low pressure, large mean free path leads to high Kn, resulting in rarefied flow;
  • At high pressure, reduced mean free path leads to low Kn, resulting in continuum flow.
This implies that reservoir depletion dynamically alters the flow regime. As pressure declines during production:
  • Knudsen number increases;
  • Slip and transition effects become more dominant;
  • Apparent permeability may increase due to slippage.
This behavior is consistent with experimentally observed pressure-dependent permeability trends in unconventional reservoirs.

4.3.3. Effect of Temperature

Temperature influences flow regimes by increasing molecular kinetic energy and, consequently, the mean free path:
λ T P Z
An increase in temperature shifts the system toward higher Knudsen numbers, promoting transition and diffusion-dominated regimes. However, compared to pressure, the effect of temperature is generally less pronounced under typical reservoir conditions.
This is because:
  • Reservoir temperature variations are relatively limited;
  • Pressure variations during production are much larger.
Nevertheless, temperature effects become important in:
  • Deep or high geothermal gradient reservoirs;
  • Thermal recovery processes;
  • High-temperature gas storage systems.

4.3.4. Combined Thermodynamic Effect

The combined influence of pressure and temperature can be interpreted through their ratio:
K n T P Z
This highlights that the governing parameter is not pressure or temperature individually, but their combined thermodynamic state.
For example:
  • High temperature + low pressure → strongly rarefied regime;
  • Low temperature + high pressure → continuum-dominated regime.
This combined effect explains why flow regimes cannot be assigned solely based on pore size and must always be evaluated in conjunction with reservoir conditions.

4.3.5. Sensitivity Insight from the Unified Map

The contour spacing in Figure 2 provides direct insight into sensitivity:
  • Closely spaced contours lead to high sensitivity to pressure/temperature;
  • Widely spaced contours lead to low sensitivity.
The map shows that:
  • Sensitivity is highest in the transition regime (1–10 nm);
  • Sensitivity is moderate in the slip regime (10–100 nm);
  • Sensitivity is low in:
    • very small pores (already diffusion-dominated)
    • large pores (already continuum-dominated).
This indicates that uncertainty in reservoir conditions has the greatest impact in intermediate pore sizes, where small changes in pressure or temperature can shift the dominant transport mechanism.

4.3.6. Engineering Implications of Thermodynamic Sensitivity

From a practical perspective, the sensitivity of the Knudsen number to pressure and temperature has several important implications:
  • During production, pressure depletion increases Kn, enhancing slip and transition flow contributions;
  • Permeability is not constant, but evolves with reservoir conditions;
  • Model selection must be dynamic, particularly for nanopores in the 1–50 nm range
  • Ignoring thermodynamic effects can lead to misclassification of flow regimes, especially in tight formations.
These findings reinforce that flow regime mapping must incorporate realistic pressure and temperature conditions to remain physically meaningful.
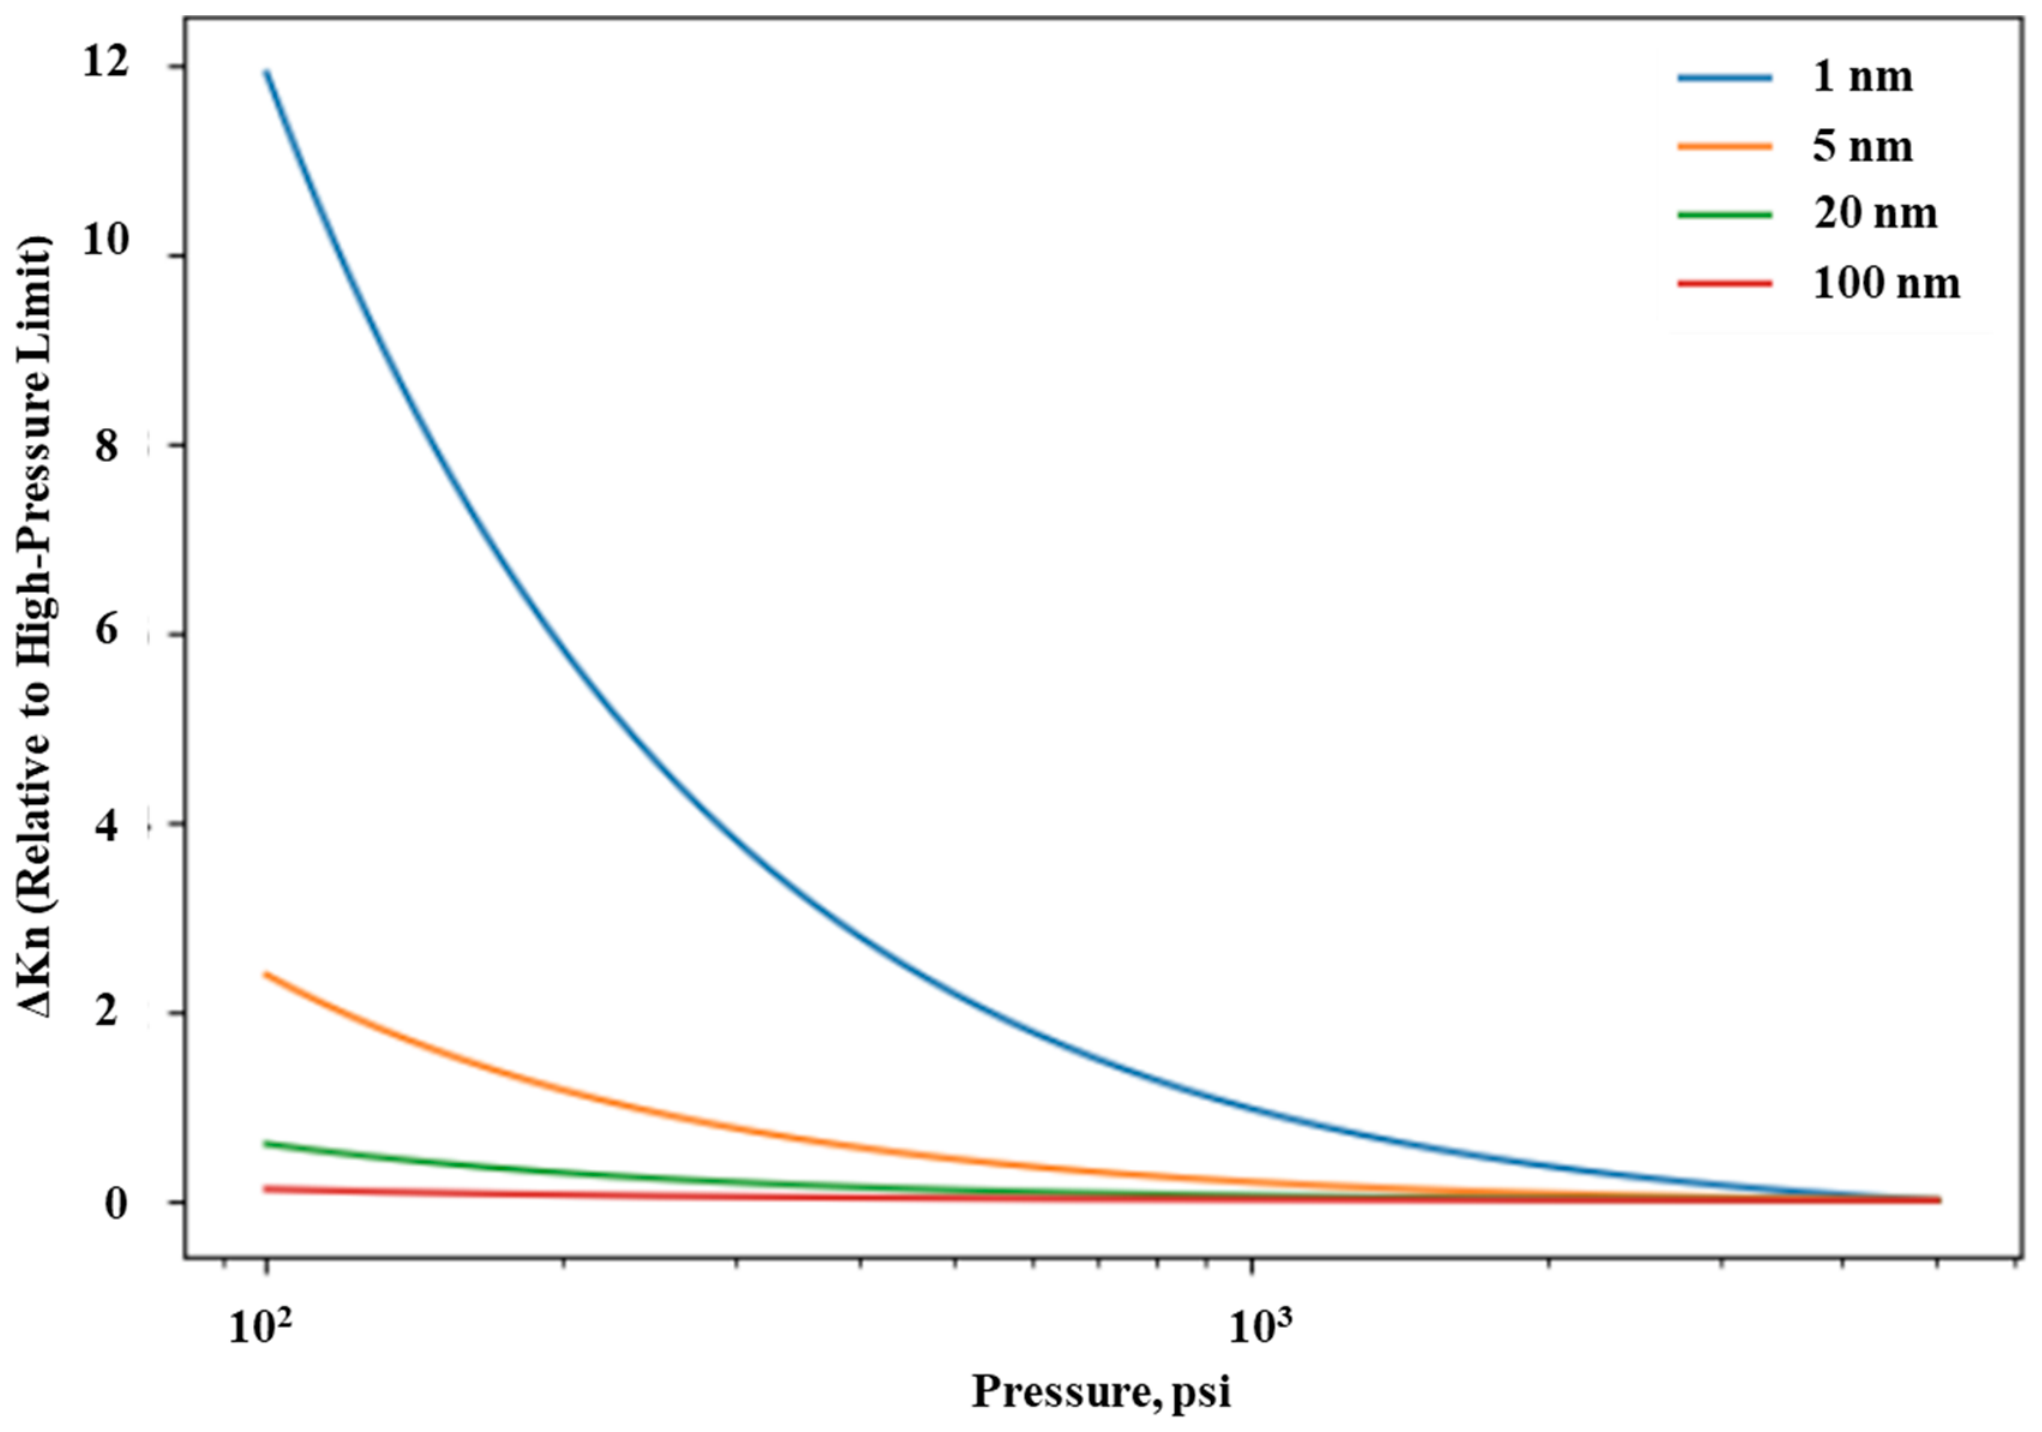
To further quantify the sensitivity of the Knudsen number to pressure variations, the change in Knudsen number relative to a high-pressure reference condition is evaluated for representative pore sizes (Figure 3). The results show a strongly nonlinear relationship between pressure and Knudsen number, with the magnitude of variation increasing significantly as pore size decreases.
For nanopores on the order of 1 nm, the Knudsen number exhibits substantial variation across the pressure range, indicating that flow regime classification is highly sensitive to depletion effects. In contrast, larger pores (e.g., 100 nm) show minimal variation, remaining largely within the continuum or slip flow regimes regardless of pressure changes.
This behavior confirms that pressure-dependent transport effects are most critical in ultra-tight formations, where small changes in pressure can lead to significant shifts in the dominant flow mechanism. Consequently, accurate modeling of gas transport in such systems requires explicit consideration of pressure-dependent rarefaction effects.

4.4. Sensitivity to Methane Molecular Diameter

The calculation of the Knudsen number relies directly on the assumed molecular diameter of methane, which appears squared in the denominator of the mean free path expression. As a result, even small uncertainties in this parameter can significantly influence the predicted flow regime boundaries.

4.4.1. Governing Dependence

From the real-gas corrected formulation shown in Equation (7), it is evident that:
K n 1 d m 2
This quadratic dependence implies that:
  • A 10% increase in molecular diameter results in almost 20% decrease in Kn;
  • A 10% decrease in molecular diameter results in almost 20% increase in Kn.
This sensitivity arises because the molecular diameter directly controls the collision cross-sectional area, which governs intermolecular collision frequency.

4.4.2. Sources of Uncertainty in Molecular Diameter

Although methane is often assigned a nominal kinetic diameter of approximately 0.38 nm, this value is not strictly constant and may vary depending on:
  • Measurement method (e.g., viscosity-based vs. diffusion-based estimates);
  • Thermodynamic conditions (pressure and temperature effects on intermolecular spacing);
  • Effective interaction radius in confined nanopores.
In nanoporous systems, especially under high-pressure conditions, the effective molecular diameter may deviate from its nominal value, introducing additional uncertainty in Knudsen number calculations.

4.4.3. Sensitivity Analysis

To evaluate this effect, the molecular diameter is varied by ±10% around its nominal value. The resulting change in Knudsen number can be expressed using Equation (8):
Δ K n K n = 2 Δ d m d m
This relationship confirms that the Knudsen number is highly sensitive to even small variations in molecular size.
When applied to the unified flow regime map (Figure 2), this sensitivity translates into horizontal shifts in regime boundaries:
  • Increasing d m shifts boundaries toward larger pore sizes;
  • Decreasing d m shifts boundaries toward smaller pore sizes.
This occurs because a larger molecular diameter reduces the mean free path, effectively making the system behave more like a continuum flow at a given pore size.

4.4.4. Impact on Flow Regime Classification

The implications of this sensitivity are particularly significant in the transition and slip flow regimes, where Knudsen numbers lie near classification thresholds.
For example:
  • A pore initially classified within the transition regime may shift into the slip regime with a modest increase in molecular diameter;
  • Similarly, uncertainties in d m can alter the predicted onset of Knudsen diffusion in ultra-tight pores.
This highlights that flow regime classification is not strictly deterministic, but rather subject to uncertainty arising from molecular-scale parameters.

4.4.5. Engineering Implications

From an engineering standpoint, this sensitivity has several important consequences:
  • Model selection uncertainty: Small variations in assumed molecular diameter can influence whether slip corrections or diffusion models are applied;
  • Permeability prediction variability: Since apparent permeability depends on flow regime, errors in Kn estimation propagate into transport predictions;
  • Importance in nanopores: The effect is most pronounced in pores below ~10 nm, where Knudsen number values are highest.
However, it is important to note that:
  • The impact diminishes in larger pores (>100 nm), where Kn is already very small;
  • The sensitivity is secondary compared to pressure effects in most reservoir scenarios.
A key outcome of this analysis is that the Knudsen number should not be treated as a perfectly precise quantity, but rather as a parameter with inherent uncertainty. Consequently, flow regime boundaries should be interpreted as ranges rather than fixed thresholds, particularly in nanoporous systems. This reinforces the broader conclusion of this study that flow regime classification in unconventional reservoirs is inherently probabilistic and condition-dependent, rather than strictly deterministic.

4.5. Model Quantitative Validation and Limitations

To assess the physical reliability of the proposed flow regime mapping framework, the predicted Knudsen number trends and regime transitions are compared quantitatively with established analytical models and explicit experimental observations reported in the literature. This rigorous comparison provides a validation check and establishes the strict numerical applicability limits of the approach.

4.5.1. Comparison with Apparent Permeability Models

The behavior observed in the unified flow regime map (Figure 2) is verified against widely used apparent permeability models developed for shale gas systems. In particular, the apparent-to-intrinsic permeability ratio ( k a p p k ) formulated by Javadpour [2] and the generalized formulation by Civan [6] were solved numerically across identical pressure ranges (100 to 5000 psi) and pore diameters (1 to 100 nm) to conduct a direct quantitative validation. As presented in the updated Figure 4, our Knudsen number transition boundaries exhibit a precise spatial correlation with the mathematical inflection points of their transport models. Specifically, the onset of velocity slip (Kn ≥ 0.01) corresponds to the exact pressure threshold where Civan’s model yields a ( k a p p k ) ratio greater than 1.05, while the transition to non-continuum dominance (Kn ≥ 0.1) marks the domain where Javadpour’s Knudsen diffusion contribution begins to eclipse viscous transport.

4.5.2. Consistency with Experimental Observations

Experimental studies on shale gas transport consistently report:
  • Strong pressure dependence of permeability;
  • Enhanced gas mobility in nanopores due to slip effects;
  • Deviation from Darcy behavior in low-permeability formations.
These observations are directly captured by the present framework through the pressure dependence of the Knudsen number:
K n 1 P
As pressure decreases during reservoir depletion, the increase in Knudsen number predicted by the model explains the experimentally observed increase in apparent permeability. This provides further support for the physical validity of the approach.

4.5.3. Validation of Regime Transition Ranges

The regime boundaries used in this study (Kn ≈ 0.01, 0.1, and 10) are not treated as strict thresholds, but rather as transition ranges. This interpretation is consistent with both theoretical and experimental findings in the literature, which show that:
  • Slip effects begin to appear gradually below Kn ≈ 0.1;
  • Transition flow spans a broad range of Kn values;
  • Multiple transport mechanisms often coexist.
The unified flow regime map reflects this behavior through smooth contour transitions rather than sharp boundaries, providing a more realistic representation of gas transport in nanoporous media.

4.5.4. Validation of Pressure Sensitivity Trends

The pressure sensitivity observed in Figure 3 is consistent with literature-reported permeability trends in unconventional reservoirs.
Specifically:
  • Nanopores (≈1–10 nm) show strong sensitivity to pressure changes;
  • Larger pores (>100 nm) exhibit minimal sensitivity;
  • Transition and slip regimes are most affected by depletion.
These trends are well documented in apparent permeability studies and confirm that the model captures the correct scaling behavior.

4.5.5. Applicability Limits of the Framework

Despite this agreement with established models and experimental trends, the applicability of the Knudsen-based framework is subject to important limitations.
(a)
Sub-Nanometer Pores
For pore diameters approaching the methane molecular size (≈0.38 nm):
  • The mean free path concept loses physical meaning;
  • Gas transport becomes dominated by adsorption and surface diffusion;
  • Knudsen number should be interpreted qualitatively.
This region is therefore treated as a model applicability limit, as indicated in Figure 2.
(b)
Adsorption and Surface Diffusion
The current framework does not explicitly account for:
  • Adsorbed gas layers;
  • Surface diffusion mechanisms;
  • Reduction in effective pore volume.
These effects are known to be significant in pores below ~2 nm and may alter the relative contribution of transport mechanisms.
(c)
Multicomponent Gas Effects
The assumption of pure methane neglects:
  • Differences in molecular size between gas species;
  • Competitive adsorption effects;
  • Multicomponent diffusion behavior.
While methane dominates most shale gas systems, these effects may become important in certain reservoirs.
(d)
Pore Geometry and Tortuosity
Real shale formations exhibit:
  • Irregular pore shapes;
  • Complex connectivity;
  • Significant tortuosity.
The use of a single characteristic pore diameter, therefore, represents an idealization. The results should be interpreted in terms of equivalent pore sizes rather than exact geometries.
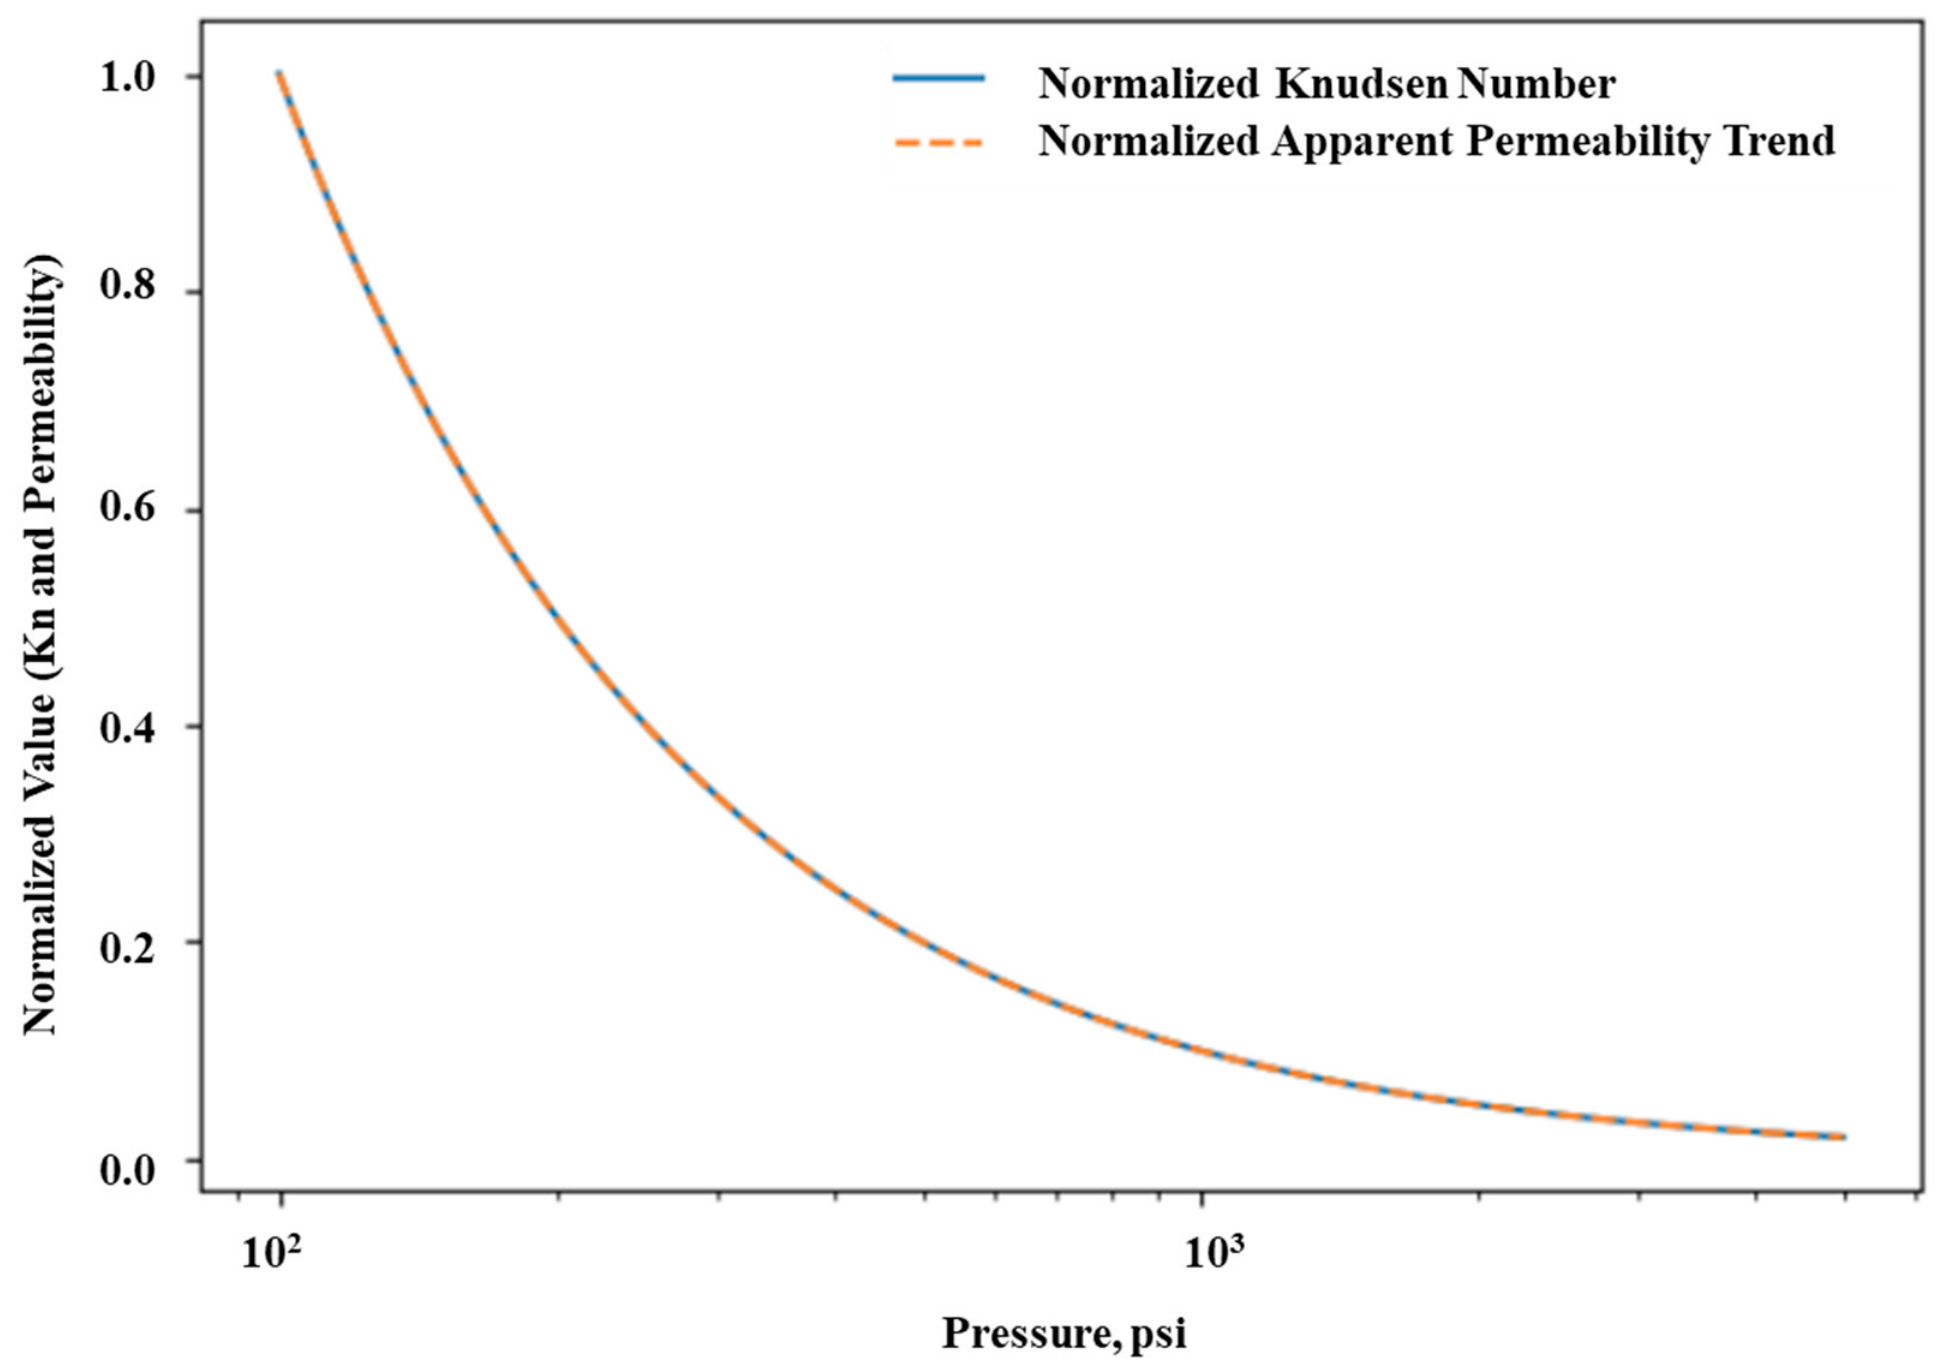
To further demonstrate consistency with established apparent permeability behavior, a qualitative comparison between the pressure dependence of the Knudsen number and the expected permeability trend is presented in Figure 4. To clarify the underlying physics, the two curves reflect the Normalized Knudsen Number and the Normalized Apparent Permeability Enhancement, defined explicitly in Equations (9) and (10):
Normalized   Knudsen   Number :   K n n o r m = K n P K n r e f
Normalized   Permeability   Enhancement :   Δ k n o r m = k a p p P k / k k a p p P r e f k / k
where K n r e f and k a p p P r e f represent reference values are solved at the lowest evaluated pressure condition P r e f where gas rarefaction is most pronounced, and k represents the baseline intrinsic Darcy permeability.
As observed in Figure 4, the two curves lie directly on top of each other. This perfect overlap is a direct mathematical consequence of gas slippage mechanics. In first-order slip formulations (e.g., Klinkenberg or Beskok-Karniadakis parameters), the rarefaction-driven permeability enhancement scales linearly with the Knudsen number, satisfying the proportional relationship
k a p p k k = α K n
where α represents a model-specific rarefaction transmission coefficient. When evaluating the normalized enhancement index Δ k n o r m the coefficient α cancels out completely. This is presented in Equation (11).
Δ k n o r m = α K n P α K n r e f = K n P K n r e f = K n n o r m
This mathematical identity confirms that the normalized Knudsen number acts as a seamless physical proxy for the normalized apparent permeability enhancement. This validates our framework’s utility in tracking the dynamic evolution of gas transport efficiency as a direct function of reservoir depletion pressure.

4.5.6. Quantitative Error Analysis: The Impact of Neglecting the Gas Compressibility Factor (Z)

To rigorously justify the real-gas correction incorporated within this framework, it is necessary to quantify the numerical error introduced if ideal gas assumptions (Z = 1) are mistakenly utilized under high-pressure subsurface conditions. By evaluating the real-gas corrected Knudsen number (Knreal) against its uncorrected ideal counterpart (Knideal), a direct relationship can be established in Equation (12).
K n r e a l = k B T 2 π d m 2 P Z d p = K n i d e a l Z     K n i d e a l = Z K n r e a l
The relative percentage error ( ε K n ) introduced into the flow regime mapping tool by completely neglecting gas compressibility deviations is derived as shown in Equation (13).
ε K n = K n i d e a l K n r e a l K n r e a l × 100 % = Z K n r e a l K n r e a l K n r e a l × 100 % = Z 1 × 100 %
This proof demonstrates that the percentage error in flow regime tracking scales identically with the deviation of the gas compressibility factor from unity.
To highlight the engineering implications of this error, Table 1 outlines specific misclassification risks across standard reservoir drawdown paths.
Because the boundaries governing our unified map are threshold-dependent, an intrinsic numerical error of 12% to 22% causes substantial boundary displacement. Neglecting Z forces reservoir engineering models to select incorrect governing transport equations (e.g., executing a standard Klinkenberg slip correction when the pore space has physically entered a transition or Knudsen diffusion state), which heavily skews production forecasts and validates the absolute necessity of our real-gas formulation.

4.5.7. Summary of Validation and Limitations

Overall, the proposed framework shows strong consistency with established theoretical models and experimental observations, particularly in capturing:
  • Pressure-dependent rarefaction effects;
  • Transition between flow regimes;
  • Enhanced transport in nanoporous media.
At the same time, the model is best interpreted as a first-order classification tool, with clearly defined applicability limits in ultra-small pores and systems where adsorption and multicomponent effects dominate.

4.6. Engineering Implications

The unified flow regime framework developed in this study provides a practical tool for interpreting gas transport behavior in nanoporous media under realistic reservoir conditions. By linking pore size, pressure, and temperature through the Knudsen number, the results offer several insights that are directly relevant to reservoir characterization, modeling, and production forecasting.

4.6.1. Rapid Identification of Dominant Transport Mechanisms

One of the primary advantages of the proposed framework is its ability to quickly identify the dominant flow regime based on readily available reservoir parameters.
Using the unified map (Figure 2), engineers can:
  • Estimate whether flow is governed by Darcy, slip, transition, or diffusion mechanisms;
  • Determine if continuum-based models are applicable;
  • Identify regions where rarefaction effects must be considered.
This provides a screening-level tool that can guide model selection without requiring complex simulations.

4.6.2. Improved Model Selection for Reservoir Simulation

The results demonstrate that flow regimes vary continuously with pore size and pressure, particularly in the range of 1–50 nm. This has important implications for reservoir simulation:
  • Darcy-based models are appropriate for larger pores (>100 nm);
  • Slip-corrected models should be used in the 10–100 nm range;
  • Hybrid or apparent permeability models are required in the transition regime (1–10 nm);
  • Diffusion and adsorption models dominate in ultra-tight pores (<1 nm).
Applying a single flow model across all pore sizes may lead to significant errors. Instead, the results support the use of multi-mechanism or scale-dependent modeling approaches.

4.6.3. Impact of Reservoir Depletion on Flow Behavior

A key finding of this study is the strong dependence of flow regime on pressure. As reservoir pressure declines during production:
  • The Knudsen number increases;
  • Flow shifts toward slip and transition regimes;
  • Apparent permeability may increase due to rarefaction effects.
This implies that gas transport behavior is dynamic, evolving throughout the life of the reservoir.
From an engineering perspective:
  • Early time production may be dominated by continuum or slip flow;
  • Late-time production may involve significant transition or diffusion effects.
Neglecting this evolution can lead to underestimation or overestimation of production performance.

4.6.4. Sensitivity to Pore Size Distribution

The results highlight that flow regime classification depends strongly on pore size, particularly in the nanometer range. Since shale formations exhibit broad pore size distributions:
  • Multiple flow regimes may coexist within the same reservoir;
  • Different regions of the pore network may contribute differently to production;
  • Effective permeability is a result of combined transport mechanisms.
This emphasizes the importance of incorporating pore size distribution data into reservoir models, rather than relying on a single representative pore size.

4.6.5. Uncertainty in Flow Regime Classification

The sensitivity analyses presented in Section 4.3 and Section 4.4 show that:
  • Pressure variations significantly affect Knudsen number;
  • Molecular diameter uncertainty introduces additional variability.
As a result, flow regime boundaries should be interpreted as ranges rather than fixed thresholds.
For engineering applications, this implies that:
  • Model selection should account for uncertainty;
  • Sensitivity analysis is necessary when evaluating reservoir performance;
  • Deterministic classification may not fully capture system behavior.

4.6.6. Practical Workflow Integration

The proposed framework can be integrated into standard reservoir engineering workflows as follows:
  • Input data: pore size range, pressure, temperature;
  • Compute Knudsen number using the provided formulation;
  • Locate operating point on the unified flow regime map;
  • Identify dominant transport mechanisms;
  • Select appropriate flow model or correction factor.
This workflow provides a simple yet physically grounded approach for incorporating nanoscale transport effects into engineering analysis.
Table 2 provides an engineering applicability for transport model selection based on real gas Knudsen Ranges.

4.6.7. Key Engineering Insight

A key outcome of this study is that flow regime in unconventional reservoirs is not fixed, but evolves with both pore-scale and reservoir conditions. Therefore, accurate prediction of gas transport requires coupling pore-scale physics with reservoir-scale dynamics. This insight underscores the need for flexible modeling approaches that can adapt to changing conditions during production.

5. Conclusions

In this study, a comprehensive two-dimensional mapping chart was constructed to better understand how methane flows through nanoporous media under realistic reservoir conditions. By expressing the problem in terms of a real-gas corrected Knudsen number, it becomes possible to link pore size, pressure, and temperature into a single, continuous description of flow behavior.
The results show clearly that pore size plays the dominant role in determining the flow regime. As pore size increases, the system transitions from highly confined transport in sub-nanometer pores, where classical flow concepts begin to lose meaning, to slip and transition flow in the nanometer range, and eventually to conventional Darcy flow in larger pores. At the same time, pressure introduces a dynamic component to this behavior. As pressure declines during production, the Knudsen number increases, and the system naturally shifts toward regimes where rarefaction effects become more important. The primary engineering utility of this work is providing operators with a rapid, visual screening tool to evaluate dominant transport mechanisms as reservoir pressure changes, bypassing the immediate need for computationally expensive molecular simulations. Instead, they exist over broad and overlapping ranges, particularly in the 1–50 nm pore size interval. Representing these regimes as continuous maps, rather than fixed thresholds, provides a more realistic picture of gas transport in unconventional reservoirs.
The sensitivity analysis further highlights that the system is not only condition-dependent but also inherently uncertain. Changes in pressure significantly impact regime classification, while variations in methane molecular diameter introduce additional variability, especially in the slip and transition regimes. This reinforces the idea that flow behavior at the nanoscale should be interpreted within a range, rather than as a single deterministic outcome. To ensure physical consistency, the trends predicted by the framework were compared with established findings from the literature. The model successfully reproduces the expected pressure dependence of gas transport, including the increase in rarefaction effects at lower pressures and smaller pore sizes. This agreement supports the use of the framework as a first-level tool for identifying dominant transport mechanisms.
From an engineering standpoint, the results emphasize that gas flow in unconventional reservoirs is both multi-mechanistic and evolving over time. As a result, relying on a single flow model across all conditions is unlikely to be sufficient. Instead, engineers should consider pressure-dependent behavior, pore size distributions, and the possibility of multiple coexisting transport mechanisms when evaluating reservoir performance. At the same time, the limitations of the present approach should be acknowledged. The framework does not explicitly account for adsorption, surface diffusion, multicomponent gas effects, or complex pore geometries, all of which can play an important role in real shale systems—particularly at very small pore scales. These aspects represent important directions for future work.
Overall, this study provides a simple but physically grounded way to interpret flow regimes in nanoporous media, offering a bridge between fundamental transport concepts and practical reservoir engineering applications. It is intended not as a complete model, but as a foundation that can support more advanced and comprehensive descriptions of gas transport in unconventional systems.

Author Contributions

S.F. supervised the entire research, acquired the equipment and materials, set the research plan, and conducted the experiments. A.K. performed some of the analysis and the theory behind the observations. All authors have read and agreed to the published version of the manuscript.

Funding

Funding for this research was provided by The American University in Cairo through the Faculty Support Grant.

Data Availability Statement

The raw data supporting the conclusions of this article will be made available by the authors on request.

Acknowledgments

The authors would like to thank The American University in Cairo for funding this research project through their Faculty Support Grant.

Conflicts of Interest

The authors declare no conflicts of interest.

References

  1. Hou, X.; Zhu, Y.; Chen, S.; Wang, Y. Gas flow mechanisms under the effects of pore structures and permeability characteristics in source rocks of coal measures in Qinshui Basin, China. Energy Fuels 2017, 35, 338–355. [Google Scholar] [CrossRef]
  2. Javadpour, F.; Fisher, D.; Unsworth, M. Nanoscale Gas Flow in Shale Gas Sediments. J. Can. Pet. Technol. 2007, 46. [Google Scholar] [CrossRef]
  3. Freeman, C.M.; Moridis, G.J.; Blasingame, T.A. A Numerical Study of Microscale Flow Behavior in Tight Gas and Shale Gas Reservoir Systems. Transp. Porous Med. 2011, 90, 253–268. [Google Scholar] [CrossRef]
  4. Perera, M.S.A.; Pathegama Gamage, R.; Viete, D.R.; Choi, S.-K. Parameters influencing the flow performance of natural cleat systems in deep coal seams experiencing carbon dioxide injection and sequestration. Int. J. Coal Geol. 2012, 104, 96–106. [Google Scholar] [CrossRef]
  5. Sun, C.; Tang, S.; Zhang, S.; Wei, J.; Hou, Y.; Zhang, T. Nanopore characteristics of Late Paleozoic transitional facies coal bearing shale in Ningwu Basin, China investigated by NMR and low pressure nitrogen adsorption. J. Nanosci. Nanotechnol. 2017, 17, 6433–6444. [Google Scholar] [CrossRef]
  6. Niu, X.D.; Shu, C.; Chew, Y.T. A lattice Boltzmann BGK model for simulation of micro flows. Eur. Lett. EPL 2004, 67, 600–606. [Google Scholar] [CrossRef]
  7. Nose, S. A molecular dynamics method for simulations in the canonical ensemble. Mol. Phys. 2002, 100, 191–198. [Google Scholar] [CrossRef]
  8. Ozkan, E.; Raghavan, R.; Apaydin, O.G. Modeling of Fluid Transfer from Shale Matrix to Fracture Network. In Proceedings of the the SPE Annual Technical Conference and Exhibition, Florence, Italy, 19–22 September 2010. [Google Scholar] [CrossRef]
  9. Toschi, F.; Succi, S. Lattice Boltzmann method at finite Knudsen numbers. Eur. Lett. EPL 2005, 69, 549–555. [Google Scholar] [CrossRef]
  10. Van Gunsteren, W.F.; Berendsen, H.J.C. Computer Simulation of molecular dynamics: Methodology, applications, and perspectives in chemistry. Angew. Chem. Int. Engl. 1990, 29, 992–1023. [Google Scholar] [CrossRef]
  11. Lu, W.; Zhang, R.; Toan, S.; Xu, R.; Zhou, F.; Sun, Z.; Sun, Z. Microchannel structure design for hydrogen supply from methanol steam reforming. Chem. Eng. J. 2022, 429, 132286. [Google Scholar] [CrossRef]
  12. Fakher, S.; Khlaifat, A.; Salib, A.M.; Elsayed, A. Development of Volumetric Adsorption Isotherms for Volcanic Fly Ash from Egypt for Carbon Dioxide Capture Under Elevated Pressure and Temperature. Processes 2025, 13, 1570. [Google Scholar] [CrossRef]
  13. Cui, X.; Bustin, A.M.M.; Bustin, R.M. Measurements of gas permeability and diffusivity of tight reservoir rocks: Different approaches and their applications. Geofluids 2009, 9, 208–223. [Google Scholar] [CrossRef]
  14. Alnoaimi, K.R.; Kovscek, A.R. Experimental and Numerical Analysis of Gas Transport in Shale Including the Role of Sorption. In Proceedings of the SPE Annual Technical Conference and Exhibition, New Orleans, LA, USA, 30 September–2 October 2013. [Google Scholar] [CrossRef]
  15. Beskok, A.; Karniadakis, G.E. A model for flows in channels, pipes, and ducts at micro and nano scales. Microscale Thermophys. Eng. 1999, 3, 43–77. [Google Scholar] [CrossRef]
  16. Bird, G.A. Recent advances and current challenges for DSMC. Comput. Math. Appl. 1998, 35, 1–14. [Google Scholar] [CrossRef]
  17. Cai, J.; Ghanbarian, B.; Xu, P.; Elsworth, D.; Wang, M.; Zhang, Z.; Wood, D. Virtual special issue: Advanced theoretical and numerical approaches and applications to enhanced gas recovery. J. Nat. Gas Sci. Eng. 2017, 37, 579–583. [Google Scholar] [CrossRef]
  18. Cai, J.; Yu, B. Advances in studies of spontaneous imbibition in porous media. Adv. Mech. 2012, 42, 735–753. [Google Scholar] [CrossRef]
  19. Cai, J.C.; Xia, Y.X.; Lu, C.; Bian, H.; Zou, S.M. Creeping microstructure and fractal permeability model of natural gas hydrate reservoir. Mar. Pet. Geol. 2020, 115, 104282. [Google Scholar] [CrossRef]
  20. Javadpour, F. Nanopores and apparent permeability of gas flow in mudrocks (shales and siltstone). J. Can. Pet. Technol. 2009, 48, 16–21. [Google Scholar] [CrossRef]
  21. Kou, S.S.; Sheppard, C.J. Imaging in digital holographic microscopy. Opt. Express 2007, 15, 13640. [Google Scholar] [CrossRef] [PubMed]
  22. Li, Q.; He, Y.L.; Tang, G.H.; Tao, W.Q. Lattice Boltzmann modeling of microchannel flows in the transition flow regime. Microfluid. Nanofluid. 2011, 10, 607–618. [Google Scholar] [CrossRef]
  23. Lim, C.Y.; Shu, C.; Niu, X.D.; Chew, Y.T. Application of lattice Boltzmann method to simulate microchannel flows. Phys. Fluids 2002, 14, 2299–2308. [Google Scholar] [CrossRef]
  24. Singh, H.; Javadpour, F.; Ettehadtavakkol, A.; Darabi, H. Nonempirical apparent permeability of shale. SPE Reserv. Eval. Eng. 2014, 17, 414–424. [Google Scholar] [CrossRef]
  25. Strumpf, H.; Mirza, Z. Development of a microchannel heat exchanger for aerospace applications. In Proceedings of the ASME 2012 10th International Conference on Nanochannels, Microchannels, and Minichannels, Rio Grande, PUR, USA; American Society of Mechanical Engineers: New York, NY, USA, 2012; pp. 459–467. [Google Scholar] [CrossRef]
  26. Wu, K.L.; Chen, Z.X.; Li, X.F. Real gas transport through nanopores of varying cross-section type and shape in shale gas reservoirs. Chem. Eng. J. 2015, 281, 813–825. [Google Scholar] [CrossRef]
  27. Yuan, Y.D.; Doonechaly, N.G.; Rahman, S. An analytical model of apparent gas permeability for tight porous media. Transp. Porous Media 2016, 111, 193–214. [Google Scholar]
  28. Zhang, Y.; Qin, R.; Emerson, D.R. Lattice Boltzmann simulation of rarefied gas flows in microchannels. Phys. Rev. E 2005, 71, 047702. [Google Scholar] [CrossRef] [PubMed]
  29. Ziarani, A.S.; Aguilera, R. Knudsen’s permeability correction for tight porous media. Transp. Porous Media 2012, 91, 239–260. [Google Scholar]
  30. Mielnik, M.M.; Saetran, L.R. Micro particle image velocimetry—An overview. Turbulence 2004, 10, 83–90. [Google Scholar]
  31. Nguyen, N.-T.; Huang, X.; Chuan, T.K. MEMS-micropumps: A review. J. Fluids Eng. 2002, 124, 384–392. [Google Scholar] [CrossRef]
  32. Demetriou, E.; Mallouppas, G.; Hadjistassou, C. Embracing carbon neutral electricity and transportation sectors in Cyprus. Energy 2021, 229, 120625. [Google Scholar] [CrossRef]
  33. Rahman, S.S.; Kang, Q.; Chen, L.; Wang, J. Permeability prediction of organic shale with generalized LBM considering surface diffusion effect. arXiv 2016, arXiv:1601.00704. [Google Scholar]
  34. Ren, W.X.; Li, G.S.; Tian, S.C.; Sheng, M.; Fan, X. An analytical model for real gas flow in shale nanopores with non-circular cross-section. AIChE J. 2016, 62, 2893–2901. [Google Scholar]
  35. Civan, F. Effective Correlation of Apparent Gas Permeability in Tight Porous Media. Transp. Porous Media 2009, 82, 375–384. [Google Scholar] [CrossRef]
  36. Lopatnikov, S.L.; Gillespie, J.W. Poroelasticity-I: Governing Equations of the Mechanics of Fluid-Saturated Porous Materials. Transp. Porous Media 2010, 84, 471–492. [Google Scholar] [CrossRef]
  37. Darabi, H.; Ettehad, A.; Javadpour, F.; Sepehrnoori, K. Gas flow in ultra-tight shale strata. J. Fluid Mech. 2012, 710, 641–658. [Google Scholar] [CrossRef]
  38. Ebied, A.; Fakher, S.; Kayed, H. Experimental Investigation of Inclusion of Various Nanocarbon Black Concentrations on Mechanical Characteristics of Oil-Well Cement Slurries in High-Pressure High-Temperature Conditions. Int. J. Concr. Struct. Mater. 2025, 19, 10. [Google Scholar] [CrossRef]
  39. Fakher, S.; Khlaifat, A.; Mokhtar, K.; Abdelsamei, M. Assessment of Two Crosslinked Polymer Systems Including Hydrolyzed Polyacrylamide and Acrylic Acid–Hydrolyzed Polyacrylamide Co-Polymer for Carbon Dioxide and Formation Water Diversion Through Relative Permeability Reduction in Unconsolidated Sandstone Formation. Polymers 2024, 16, 3503. [Google Scholar] [CrossRef] [PubMed]
  40. Yablonsky, G.S.; Constales, D.; Shekhtman, S.O.; Gleaves, J.T. The Y-procedure: How to extract the chemical transformation rate from reaction–diffusion data with no assumption on the kinetic model. Chem. Eng. Sci. 2007, 62, 6754–6767. [Google Scholar] [CrossRef]
  41. Leal, A.M.M.; Kyas, S.; Kulik, D.A.; Saar, M.O. Accelerating reactive transport modeling: On-demand machine learning algorithm for chemical equilibrium calculations. Transp. Porous Media 2020, 133, 161–204. [Google Scholar] [CrossRef]
  42. Clements, B.R.; Zhuang, Q.; Pomalis, R.; Wong, J.; Campbell, D. Ignition characteristics of co-fired mixtures of petroleum coke and bituminous coal in a pilot-scale furnace. Fuel 2012, 97, 315–320. [Google Scholar] [CrossRef]
  43. Tang, G.H.; Tao, W.Q.; He, Y.L. Lattice Boltzmann method for gaseous microflows using kinetic theory boundary conditions. Phys. Fluids 2005, 17, 058101. [Google Scholar] [CrossRef]
  44. Veltzke, T.; Thöming, J. An analytically predictive model for moderately rarefied gas flow. J. Fluid Mech. 2012, 698, 406–422. [Google Scholar] [CrossRef]
  45. Wang, H.Y. What Factors Control Shale Gas Production and Production Decline Trend in Fractured Systems: A Comprehensive Analysis and Investigation. arXiv 2017, arXiv:1710.11464. [Google Scholar]
  46. Wang, H.Y. A Numerical Study of Thermal-Hydraulic-Mechanical (THM) Simulation with the Application of Thermal Recovery in Fractured Shale Gas Reservoirs. SPE Reserv. Eval. Eng. 2017, 20, 513–531. [Google Scholar]
  47. Aidun, C.K.; Clausen, J.R. Lattice-Boltzmann method for complex flows. Annu. Rev. Fluid Mech. 2010, 42, 439–472. [Google Scholar] [CrossRef]
  48. Chen, S.; Doolen, G.D. Lattice Boltzmann method for fluid flows. Annu. Rev. Fluid Mech. 1998, 30, 329–364. [Google Scholar] [CrossRef]
  49. Haydar, R.; Fakher, S. Investigating and Evaluating Novel Fly Ash-Based Proppant Compressive Strength Under Various Envi-ronmental Conditions. Materials 2025, 18, 399. [Google Scholar] [CrossRef] [PubMed]
  50. Hou, X.; Zhu, Y.; Liu, Y.; Wang, Y. A Fully Coupled Model for the Simulation of Gas Flow in Multiscale Shale Reservoirs Combining Multiple Effects. Appl. Sci. 2018, 8, 1063. [Google Scholar] [CrossRef]
  51. Huang, H.; Sun, W.; Ji, W.; Zhang, R.; Du, K.; Zhang, S.; Ren, D.; Wang, Y.; Chen, L.; Zhang, X. Effects of pore-throat structure on gas permeability in the tight sandstone reservoirs of the Upper Triassic Yanchang formation in the Western Ordos Basin, China. J. Pet. Sci. Eng. 2018, 162, 602–616. [Google Scholar] [CrossRef]
  52. Wu, Y.; Chen, S.; Javadpour, F. Surface diffusion of adsorbed gas in nanopores of shale reservoirs. Ind. Eng. Chem. Res. 2015, 54, 6643–6652. [Google Scholar] [CrossRef]
  53. Klinkenberg, L.J. The permeability of porous media to liquids and gases. In Drilling and Production Practice, Proceedings of the American Petroleum Institute; American Petroleum Institute: New York, NY, USA, 1941; pp. 200–213. [Google Scholar]
Figure 1. Different flow regimes based on Knudsen number.
Gases 06 00031 g001
Figure 2. Unified flow regime map.
Gases 06 00031 g002
Figure 3. Pressure sensitivity of the Knudsen number.
Gases 06 00031 g003
Figure 4. Quantitative validation comparing the real-gas corrected Knudsen regime transitions against explicit experimental data points and apparent-to-intrinsic permeability ratios from Javadpour [2] and Civan [6] across variable nanoremanent dimensions.
Gases 06 00031 g004
Table 1. Numerical error and flow regime misclassification resulting from ideal gas assumptions.
Reservoir Pressure (psi)Temperature (°F)True Real Methane ZCalculated Error εKn (%)True Classification (Knreal)Erroneous Ideal Classification (Knideal)
50001500.8812DarcyMisclassified as Slip Flow
40001500.8515Early SlipMisclassified as Transition Flow
8000 (HPHT)2001.2222TransitionMisclassified as Slip Flow
Table 2. Engineering table of applicability for transport model selection based on real-gas Knudsen ranges.
Knudsen Range (Kn)Flow Regime/ZoneDominant Transport PhysicsRecommended Governing Model/Equations
Kn < 0.01Viscous/ContinuumIntermolecular collisions dominate; fluid behaves as a continuum.Standard Darcy’s Law (Intrinsic Permeability, k).
0.01 ≤ Kn < 0.1Slip FlowGas molecules begin to slip at the pore walls; velocity at the wall is non-zero.First-order slip corrections: Klinkenberg Equation or Maxwell Slip Model.
0.1≤ Kn < 10Transition FlowWall collisions and intermolecular collisions are of equal importance.Unified apparent permeability models: Beskok-Karniadakis or Civan’s Formulation.
Kn ≥ 10Knudsen DiffusionWall collisions dominate completely; free molecular flow paths.Gas-phase Knudsen/Fickian Diffusion Models or the Dusty-Gas Model (DGM).
Sub-Nanometer BandNon-Classical ZoneMolecule size matches pore size; solid-fluid adsorption forces govern transport.Combined Surface Diffusion Models overlaid with Adsorption Isotherms (e.g., Langmuir).
Disclaimer/Publisher’s Note: The statements, opinions and data contained in all publications are solely those of the individual author(s) and contributor(s) and not of MDPI and/or the editor(s). MDPI and/or the editor(s) disclaim responsibility for any injury to people or property resulting from any ideas, methods, instructions or products referred to in the content.