Review

Methane Pyrolysis for Low-Carbon Syngas and Methanol: Economic Viability and Market Constraints

1
Chemical Engineering Program, Texas A&M University at Qatar, Doha 23874, Qatar
2
College of Science and Engineering, Hamad bin Khalifa University, Doha 23874, Qatar
*
Author to whom correspondence should be addressed.
Gases 2026, 6(2), 18; https://doi.org/10.3390/gases6020018
Submission received: 3 February 2026 / Revised: 7 March 2026 / Accepted: 25 March 2026 / Published: 2 April 2026

Abstract

As the global imperative for climate neutrality intensifies, hydrogen (H2) from fossil fuels remains central to decarbonizing hard-to-abate sectors. Conventional production via steam methane reforming (SMR), however, is carbon-intensive and, even with carbon capture and storage (CCS), incurs energy penalties and long-term storage constraints. This review develops a harmonized well-to-gate, market-oriented framework to evaluate methane pyrolysis (MP) relative to SMR and autothermal reforming (ATR), with or without CCS, moving beyond reactor-focused assessments toward system-level commercialization analysis. MP decomposes methane into hydrogen and solid carbon, avoiding direct CO2 formation and the need for CCS infrastructure. Integrating with the reverse water–gas shift (RWGS) reaction enables flexible syngas production with adjustable H2:CO ratios for methanol and chemical synthesis. A central finding is the dominant role of the “carbon lever”: MP generates approximately 3 kg of solid carbon per kg of H2, making the carbon market’s absorptive capacity the primary scalability constraint. While carbon monetization can reduce levelized hydrogen costs, large-scale deployment would rapidly saturate existing carbon black and specialty carbon markets. Techno-economic evidence indicates that carbon prices above $500/ton are required to achieve parity with gray hydrogen, whereas $150–200/ton enables competitiveness with blue hydrogen. Lifecycle assessments further show that climate superiority over SMR or ATR with CCS requires upstream methane leakage below 0.5% and very low-carbon electricity. Commercial readiness varies, with plasma MP at TRL 8–9 and thermal, catalytic, and molten-media pathways remaining at the pilot or demonstration stage. Parametric decision-space analysis under harmonized boundary assumptions shows that MP is not a universal substitute for reforming but a conditional pathway competitive only under aligned conditions of low-leakage gas supply, low-carbon electricity, credible carbon monetization, and supportive policy incentives. The review concludes with a roadmap that highlights standardized carbon certification, end-of-life accounting, and long-duration operational data as priorities for commercialization.

1. Introduction

The global imperative to mitigate greenhouse gas (GHG) emissions and achieve climate neutrality by mid-century has intensified efforts to deploy low-carbon energy carriers and chemical feedstocks at scale [1,2,3]. Hydrogen (H2) is widely recognized as a cornerstone of this transition, owing to its versatility as both an energy vector and a chemical intermediate, particularly in hard-to-abate sectors such as heavy industry, refining, and long-haul transport [2,4]. However, despite its strategic importance, current hydrogen production remains dominated by energy- and carbon-intensive processes, which continue to contribute substantially to global CO2 emissions [5]. These decarbonization pressures extend beyond hydrogen itself to downstream products such as syngas and methanol, creating an urgent need for commercially viable low-carbon production pathways.
Hydrogen already plays a foundational role across petrochemicals, oil refining, ammonia production, and broader chemical manufacturing [6,7,8,9]. Global hydrogen demand reached approximately 120 million tons in 2022 and is projected to double by 2030 as its application base expands into new energy and fuel systems [1,10]. Closely linked to hydrogen is synthesis gas (syngas), a mixture of hydrogen and carbon monoxide that serves as a critical intermediate for producing methanol and other C1 chemicals via established routes such as the BASF and Sachsse processes [11]. Conventional syngas and methanol production rely heavily on steam methane reforming (SMR), autothermal reforming (ATR), and partial oxidation (POx), all of which are inherently carbon-intensive due to the direct oxidation of methane [1,7,12]. Consequently, the rising global demand for syngas and methanol intensifies the urgency to develop alternative, lower-carbon production routes.
Among emerging alternatives, methane pyrolysis (MP) has gained increasing attention as a fundamentally different approach to hydrogen and syngas production. MP decomposes methane into hydrogen and solid carbon without directly forming CO2, offering an intrinsic decarbonization advantage over reforming-based pathways [6,13]. This process is endothermic, requiring approximately 37.4 kJ/mol of H2, which is substantially lower than the electrical energy required for water electrolysis for green hydrogen production [2,6]. Importantly, MP generates solid carbon rather than gaseous CO2, thereby avoiding the need for energy-intensive capture, compression, transport, and geological sequestration infrastructure associated with carbon capture and storage (CCS) [2,6,14]. This intrinsic feature classifies MP-derived hydrogen as so-called “turquoise hydrogen” and positions MP as a potentially scalable low-carbon option independent of regional access to CO2 storage geology [8,15,16]. Throughout this review, hydrogen production pathways are described using widely adopted color-based nomenclature: gray hydrogen refers to hydrogen produced via unabated SMR or ATR without carbon capture; blue hydrogen denotes SMR or ATR coupled with CCS; turquoise hydrogen refers to hydrogen produced via MP with solid carbon as the primary carbon-containing product; and green hydrogen denotes hydrogen produced by water electrolysis powered by renewable electricity [17].
In contrast, the dominant mitigation strategy for conventional hydrogen production (integrating CCS with SMR or ATR) faces persistent economic and environmental limitations. Although capture rates approaching 90% are technically achievable, the addition of CCS significantly increases hydrogen production costs, with reported increases of approximately $2.6–6.1/kg H2 at high capture levels [18]. CCS also imposes an energy penalty that reduces overall process efficiency by approximately 8–10% relative to unabated SMR [2,19]. Moreover, residual life-cycle emissions remain substantial, with reported values ranging from 1.54 to 5.9 kg CO2eq/kg H2 even under CCS deployment, exceeding long-term net-zero targets [2,16,20]. These challenges, combined with geological constraints, infrastructure complexity, and long-term liability concerns, suggest that SMR/ATR with CCS may represent a transitional rather than definitive decarbonization solution [2,18].
While MP offers a pathway to carbon-free hydrogen production, its commercial relevance is significantly enhanced when integrated with the reverse water–gas shift (RWGS) reaction. RWGS converts CO2 and hydrogen into carbon monoxide and water, enabling the transformation of captured or recycled CO2 into syngas suitable for methanol and other downstream syntheses [11,13]. The combined MP + RWGS system leverages the intrinsic CO2 avoidance of methane decomposition while simultaneously enabling CO2 utilization, aligning the process with circular-economy principles and carbon-management strategies. A significant advantage of this configuration is the decoupling of hydrogen generation from carbon conversion, enabling unprecedented flexibility to tune the H2:CO ratio of the resulting syngas. Unlike SMR or ATR, in which syngas composition is constrained by reaction stoichiometry and equilibrium, MP produces a highly pure hydrogen stream that can be independently combined with controlled CO2 input in the RWGS reactor [8,11,16]. This flexibility enables precise matching of syngas composition to the requirements of methanol synthesis, Fischer–Tropsch processes, and other C1 chemistry routes, potentially improving yield and reducing downstream processing complexity.
Despite growing technical interest in MP and MP + RWGS systems, the primary barrier to large-scale deployment is increasingly economic and market-driven rather than purely technological. The viability of MP depends strongly on natural gas and electricity prices, carbon credit frameworks, methane leakage rates, and the ability of global markets to absorb large quantities of solid carbon by-products. At an industrial scale, MP plants can generate tens of thousands of tons of solid carbon annually. In contrast, markets for high-value products such as carbon nanotubes remain orders of magnitude smaller. Lower-value outlets, such as carbon black or construction-grade carbon, impose stringent quality, certification, and safety requirements that many MP-derived carbons may struggle to meet consistently. As a result, optimistic assumptions regarding carbon-product revenues may not be commercially realistic.
Although a substantial body of literature addresses MP reactor concepts, catalyst development, plasma systems, and reaction mechanisms, no comprehensive review currently synthesizes the economic, market, and emissions conditions governing the commercialization of MP and MP + RWGS systems. Existing reviews tend to emphasize materials science or process engineering while leaving critical questions unanswered: under what economic conditions can MP compete with SMR or ATR; what carbon-product prices are realistically achievable given current market sizes; how electricity and natural-gas prices shape feasibility; and under what emissions thresholds MP + RWGS can outperform reforming routes with CCS for methanol-grade syngas production.
Recent review articles on MP have primarily emphasized reactor concepts, catalyst development, and reaction mechanisms across thermal, catalytic, molten-media, and plasma-based pathways [14,16,21]. Plasma- and electrification-oriented reviews further focus on energy delivery, plasma physics, and reactor performance [5,22], while carbon-focused reviews examine morphology control and applications of pyrolysis-derived carbons [23,24]. In contrast, this review centers on the feasibility of commercialization, synthesizing the economic thresholds, carbon-market absorptive capacity, and emissions-sensitive system-level competitiveness that govern whether MP, particularly when integrated with RWGS, can realistically compete with SMR/ATR (with or without CCS) at scale.
This review is based primarily on publicly available techno-economic and life-cycle assessment studies; proprietary industrial data and confidential project-specific analyses may shift reported cost ranges and performance metrics.
Accordingly, the present work provides a market- and economics-focused synthesis of the economic drivers, market constraints, and emissions considerations that determine the scalability of MP and its integration with RWGS. Beyond compiling reported cost and carbon intensity (CI) ranges, this review develops a harmonized well-to-gate (W2G) analytical framework and a transparent parametric decision-space model to enable consistent reinterpretation of published techno-economic and lifecycle results under aligned boundary conditions. Emphasis is placed on cost structures, carbon-product markets, price thresholds, and identifying threshold conditions under which MP and MP + RWGS can achieve cost parity and CI superiority relative to SMR/ATR with or without CCS.
By shifting the analytical focus from isolated reactor performance to system-level competitiveness and market absorptive capacity, this review reframes the viability of methane pyrolysis as a boundary-sensitive outcome governed by supply-chain integrity, electricity CI, and carbon-market absorption, rather than as an intrinsic property of reaction chemistry. The paper concludes with a forward-looking assessment of commercial readiness and a roadmap for future market- and economics-oriented research.

2. Review Scope, Harmonized Analytical Framework, and Parametric Model

2.1. Review Scope and Methodology

This study adopts a structured narrative review complemented by quantitative harmonization [25] with the explicit objective of transforming heterogeneous literature into a consistent analytical basis for threshold identification and comparative mapping of decision spaces. The objective is to systematically synthesize and reinterpret techno-economic and lifecycle emission results reported for MP relative to ATR with or without CCS under consistent boundary conditions.
The literature survey was conducted using Scopus, Web of Science, and Google Scholar, supplemented by institutional reports from organizations such as the International Energy Agency GHG Programme (IEAGHG) [26] and the U.S. National Energy Technology Laboratory (NETL) [27], which provide standardized lifecycle and techno-economic reference cases for hydrogen systems. Searches were performed between August 2025 and February 2026 and focused primarily on publications from 2015 onward, reflecting the rapid growth of MP research and commercialization efforts during the past decade. To ensure comprehensive coverage, AI-assisted search discovery tools were used to supplement traditional database queries and support the initial thematic categorization of the literature. The search strategy combined core technical terms (‘methane pyrolysis,’ ‘turquoise hydrogen’) with specific performance indicators (‘LCOH,’ ‘carbon intensity,’ ‘lifecycle emissions’) and comparative benchmarks (‘SMR,’ ‘ATR with CCS’). Forward and backward citation tracking was used to identify influential studies and ensure coverage of both academic and institutional assessments.
Studies were included if they reported quantitative data on methane consumption (feedstock and fuel), electricity demand, carbon yield, lifecycle emissions, or techno-economic indicators such as Capital Expenditure (CAPEX), operating expenditures (OPEX), or levelized cost of hydrogen (LCOH). Peer-reviewed journal articles and transparent technical reports were considered if system boundaries and key assumptions were explicitly stated. Studies limited to catalyst kinetics or laboratory-scale materials development without system-level performance metrics were excluded.
Because prior studies differ substantially in system boundaries, methane leakage assumptions, electricity CI, allocation methods, and treatment of carbon coproduct permanence, direct comparison of reported carbon intensities can be misleading [28]. To address this heterogeneity, the present work introduces a harmonized W2G analytical framework and a parametric decision-space analysis, enabling consistent reinterpretation of published results under common assumptions. This approach allows the identification of threshold conditions for CI superiority and cost parity while preserving transparency regarding the underlying methodological choices.

2.2. Harmonized Analytical Framework and Parametric Model

To ensure consistent interpretation of techno-economic and emissions thresholds reported across the MP and ATR + CCS literature, a harmonized W2G analytical framework and a transparent parametric model are introduced.
The W2G boundary spans natural gas extraction, processing, and transport; on-site conversion to hydrogen (and syngas where applicable); and plant-level utilities and CO2 handling up to the hydrogen production gate, consistent with established LCA boundary definitions for hydrogen systems [26,27,29]. Downstream hydrogen distribution, end-use combustion, and infrastructure-embodied emissions are excluded to preserve comparability across pathways. All emissions are reported per functional unit of 1 kg H2 at the plant gate.
Lifecycle GHG emissions are quantified using GWP100 (IPCC AR6) [30]. As the primary basis, the framework is structured to allow examination of alternative GWP horizons parametrically; however, in the decision-space maps presented in Section 7, GWP100 (IPCC AR6) is consistently adopted to ensure methodological comparability. A major source of heterogeneity across prior studies lies in assumptions about methane supply-chain leakage and electricity CI. Accordingly, methane leakage is explicitly parameterized as a fraction of the total methane throughput (feedstock + fuel) [26,27,31] within the defined boundary, rather than inferred solely from reaction stoichiometry. Electricity-related emissions are parameterized using grid CI (gCO2e/kWh) and pathway-specific electricity demand [26,32].
For MP, the solid-carbon coproduct is treated under two bounding cases: (i) durable storage within the assessment horizon, and (ii) partial or complete end-of-life re-oxidation represented by an oxidation-fraction parameter. In the decision-space maps, the durable-storage case is used as the primary benchmark, and the implications of re-oxidation are examined analytically. This allows durability assumptions to be examined explicitly rather than implicitly embedded in reported CI values.
The harmonized framework serves two complementary purposes. First, it provides a structured classification of published CI values according to boundary definitions and methodological assumptions, thereby avoiding misleading “like-for-like” comparisons across heterogeneous studies. Second, it enables systematic variation of methane leakage, electricity CI, and key economic parameters to identify threshold conditions for CI superiority and cost parity relative to ATR + CCS. These thresholds are synthesized through break-even and parity mapping in the later analytical section.
Beyond methodological alignment, the framework functions as the structural backbone of the review, ensuring that the economic, emissions, and market discussions that follow are interpreted within a single transparent boundary definition.

3. Technology Snapshot: What Matters for Economics

MP has attracted growing attention as a pathway to produce hydrogen with potentially low direct CO2 emissions while co-producing solid carbon, a feature that fundamentally shapes its economics [6,8,33,34]. In contrast to reforming-based hydrogen, MP decomposes methane into hydrogen and solid carbon, and its economic viability is largely determined by (i) the cost of supplying high-temperature energy, (ii) carbon co-product quality and monetization, and (iii) technology maturity and operational robustness [16,35,36,37]. Although MP is thermodynamically favorable relative to water splitting, high conversion and throughput require efficient delivery of heat, often at 900–1200 °C or higher, depending on the configuration—reaching well above 2000 K in early plasma-based systems, making the utility source (electricity, gas-fired heat, or solar) a dominant driver of OPEX and overall emissions performance [6,8,16,38].
A defining commercialization feature is the carbon mass balance: MP produces solid carbon at an approximate 3:1 mass ratio relative to hydrogen, so the carbon stream rapidly becomes a primary determinant of plant economics and feasibility [8,16,35,37]. Early system-level assessments already recognized that the absence of sufficiently large and stable markets for solid carbon represents a fundamental barrier to large-scale deployment of MP, despite its intrinsic advantage of avoiding direct CO2 formation [39]. Consequently, the credibility of any MP business case depends on whether the produced carbon can be sold at a meaningful scale and price and whether product quality can be maintained without contamination from catalysts, reactor materials, or downstream handling [16,21,40]. From a cost-competitiveness viewpoint, reported turquoise hydrogen costs span broad ranges (e.g., 0.50–3.90 US$/kg H2) and can overlap with conventional SMR (0.7–2.1 US$/kg H2), but achieving parity, particularly against SMR/ATR with CCS, frequently assumes carbon co-product monetization, with minimum required carbon prices reported in the approximate range of 0.2–2 US$/kg, depending on process route and assumptions [13,16].
Because MP routes differ sharply in energy sources, carbon characteristics, and operational constraints, a brief technology snapshot is essential for interpreting techno-economic comparisons. The following subsections summarize MP pathways and RWGS integration from an explicit economic and commercialization perspective.

3.1. Methane Pyrolysis Pathways (Economic Lens)

3.1.1. Thermal MP

Thermal MP relies on very high temperatures, often exceeding 1200 °C in non-catalytic operation, to overcome methane’s strong C–H bonds and achieve industrially relevant reaction rates [1,8,10,11,15,41]. This high temperature requirement drives OPEX through heat supply costs and introduces stringent constraints on reactor materials, heat transfer, quenching, and heat recovery design [11,14,42]. A persistent technical–economic challenge is carbon deposition leading to fouling and clogging, which can restrict reactor configuration choices and impose downtime, cleaning, or replacement costs [6,15,42,43].
From the perspective of commercial deployment, thermal MP is most attractive when (i) low-cost, low-carbon heat can be supplied (e.g., electrification under favorable power prices or concentrated solar thermal options) and (ii) the produced carbon can be sold consistently [6,15,16]. Thermal cracking commonly yields amorphous carbon and/or carbon black-type products, which may be advantageous in terms of market size but generally command lower prices than specialty carbons [8,40,44]. Historically, high-temperature cracking has also been used in processes targeting acetylene with extremely short residence times and rapid quenching; such historical practice highlights the feasibility of industrial high-temperature operation and the importance of heat management and quench design [11].

3.1.2. Catalytic MP

Catalytic MP reduces the temperature required for methane decomposition, often into the 500–1000 °C range, by employing solid catalysts (e.g., Ni, Fe, Co, carbon-based materials) or liquid/molten media (e.g., molten metals, alloys, salts) [6,8,14,15,19,21]. This reduction can improve energy efficiency and ease heat-supply constraints, but introduces new cost drivers associated with catalyst performance, lifetime, contamination control, and regeneration strategy [8,19,21].
A distinctive economic lever lies in controlling carbon morphology. Metal catalysts may promote filamentous or structured carbons, potentially enabling higher product value, whereas some catalyst systems yield graphitic carbon, while carbonaceous catalysts often lead to amorphous or turbostratic carbon forms [2,16,21]. However, high-value carbon markets are much smaller than commodity carbon markets, so economic projections that depend on CNT pricing must be evaluated against realistic market absorptive capacity and quality requirements [35,37,45].
Catalyst deactivation due to carbon buildup (coking/encapsulation) remains a central commercialization barrier for solid catalysts, often requiring regeneration using oxidants such as O2, H2O, or CO2, steps that can increase OPEX and may produce COx, partially undermining “zero-emission” positioning depending on system boundaries [8,16,19,21]. In contrast, molten media systems can mitigate clogging and deactivation by enabling continuous separation of buoyant carbon from the reactive phase, thereby improving operability and potentially lowering maintenance costs.

3.1.3. Plasma MP

Plasma MP supplies the reaction energy via electrical power, generating high-temperature plasma conditions that rapidly decompose methane [5,21,46]. Depending on design (thermal vs. non-thermal plasma), effective operating temperatures may span roughly 1000–3000 or higher °C, enabling fast switching and potential compatibility with intermittent renewable electricity [8,15]. Plasma routes are frequently described as among the most technologically mature emerging MP options, with reported Technology Readiness Level (TRL) levels approaching 8–9 in some assessments, but their economics are strongly electricity-dependent [8,15]. High electricity input can dominate OPEX, and specialized equipment may increase CAPEX, though cost reductions are often anticipated with scale-up and learning effects [2,16,46].
Plasma MP commonly produces carbon black-like materials and fine carbon; while these markets are larger than specialty nanocarbon markets, prices may be insufficient to support aggressive hydrogen cost targets unless carbon quality is consistent and produced at scale [8,15,37,47]. Environmental performance is also directly tied to the CI of the electricity supply, making location and power procurement central to any credible commercialization case [8,48].

3.2. RWGS and Its Economic Role

The RWGS reaction plays a pivotal role in carbon utilization pathways by converting CO2 to CO, enabling methanol-grade syngas production when coupled with a hydrogen source [49]. From an economic standpoint, RWGS competitiveness is strongly conditioned by the cost of clean hydrogen, the cost and source of CO2, and the heat/utility strategy used to supply reaction energy [49]. Methanol synthesis typically targets a syngas stoichiometry reflected by the ratio (H2 − CO2)/(CO + CO2), with many designs aiming toward a composition compatible with downstream methanol units, while some integrated pathways (e.g., water electrolysis combined with CO2 hydrogenation) operate under different preferred ratios [49].
Across comparative assessments, RWGS-based routes can be less economically competitive than SMR or dry methane reforming (DMR) unless hydrogen is very low-cost and policy incentives materially reward carbon abatement. Key cost drivers include catalyst cost and lifetime, reactor heating, and the CO2 supply chain (capture, purification, compression, and delivery) [49]. CO2 feedstock costs are highly variable, ranging from relatively low-cost capture from concentrated sources to high-cost direct air capture (DAC), which can significantly alter overall syngas economics. Accordingly, RWGS is most economically attractive when paired with low-cost hydrogen and affordable CO2 under favorable policy and infrastructure conditions.

3.3. Integration Rationale: Why MP + RWGS Can Compete with ATR + CCS

The MP + RWGS pathway is often positioned as a competitor to blue hydrogen and blue syngas systems because MP avoids direct CO2 formation in the hydrogen-generation step and may leverage a favorable thermodynamic/energy profile [8,50]. Reported comparisons indicate that methane decomposition can require lower reaction enthalpy per mole of hydrogen than reforming pathways, while CCS-equipped systems must additionally incur energy and cost penalties for CO2 capture, compression, transport, and storage [2,20,50].
From a commercialization viewpoint, integration creates two primary cost-saving opportunities. First, because MP is highly endothermic and operates at elevated temperature, heat integration and recovery (including quenching and sensible heat recovery from product gases) can materially influence net energy consumption and OPEX [11]. Second, RWGS enables CO2 recycling/utilization, allowing the hydrogen-rich MP product to be converted into a controllable syngas composition suitable for methanol synthesis, reducing reliance on reforming-based syngas and potentially improving carbon utilization metrics when CO2 is available at an acceptable cost [11,49]. Historical industrial designs for methane pyrolysis (e.g., thermal cracking schemes using partial oxidation for heat supply) illustrate that co-production of syngas or CO-containing streams can create economically useful integration points with downstream methanol synthesis [11], providing an early conceptual basis for the integration logic explored in modern MP + RWGS configurations. Table 1 summarizes the major MP pathways from a commercialization perspective, emphasizing their principal advantages, dominant limitations, and best-fit deployment niches.

4. Cost Structure of MP

The cost structure of MP is governed by the reactor pathway (thermal, catalytic, molten-media, or plasma), the energy-supply strategy, and, more distinctly than reforming routes, the valuation and marketability of the solid carbon co-product [8,42]. While MP is technically feasible across multiple configurations, its commercial deployment ultimately depends on whether competitive levelized hydrogen and syngas costs can be achieved under realistic assumptions for natural gas pricing, electricity pricing, plant utilization, and carbon-product revenue [2,12,13]. A defining feature is that MP co-produces approximately 3 kg of solid carbon per kg of hydrogen, making solids handling and carbon monetization central determinants of both capital and operating costs [5,8,29]
Table 2 summarizes the dominant CAPEX and OPEX drivers across MP pathways, while Table 3 compiles reported levelized cost ranges and the key techno-economic assumptions underpinning published estimates.

4.1. CAPEX: Pathway-Dependent Cost Drivers

Across techno-economic studies, MP capital intensity is shaped by three recurring factors: (i) high-temperature materials and heat-delivery systems, (ii) the complexity of continuously handling a solid co-product, and (iii) pathway-specific equipment requirements such as catalyst circulation systems or plasma power electronics [2,13,51].
As summarized in Table 2, thermal MP is capital-intensive because it requires materials capable of sustained operation at temperatures typically exceeding 1200 °C, often necessitating specialized alloys, ceramics, and refractory linings. These material requirements increase both reactor costs and balance-of-plant investment through insulation, heat recovery, and quenching systems. Catalytic MP, while operating at lower temperatures, introduces capital costs associated with catalyst inventory, circulation or replacement systems, and dedicated regeneration infrastructure to mitigate deactivation by carbon deposition. Molten-media MP shifts CAPEX toward the initial inventory of molten metals or salts, corrosion-resistant containment, and recirculation and gas-dispersion hardware. In contrast, plasma MP is dominated by electrical equipment costs, including high-voltage power supplies, plasma torches, or electron-beam accelerators, which can constitute a large fraction of total installed cost in reported designs.
A cross-cutting capital requirement unique to MP relative to SMR/ATR is solids handling infrastructure. Continuous separation, conveyance, conditioning, and storage of carbon are mandatory subsystems across all MP pathways, reflecting the large carbon mass flow relative to hydrogen production. This requirement adds mechanical complexity and increases fixed capital investment, particularly for high-throughput or continuous-operation designs [16,36].

4.2. OPEX: Dominant Operating Cost Drivers

Operating expenditures typically dominate the LCOH from MP and are highly sensitive to commodity prices, conversion efficiency, and carbon-handling requirements [8,19]. Across studies, natural gas feedstock is consistently the largest single OPEX component. MP is stoichiometrically disadvantaged relative to SMR, producing 2 mol of H2 per mol of CH4 rather than up to 4 mol of H2, making it more sensitive to natural-gas-price fluctuations. Reported TEAs commonly attribute on the order of 60–70% of total production cost to feedstock under typical assumptions, with even higher shares possible depending on design and market conditions [8,16,61]. This finding is reinforced by recent industrial-scale techno-economic modeling of membrane-integrated MP systems (approximately 36 ton H2/day), which consistently identify natural gas feedstock as the dominant operating cost component and show total OPEX comparable to SMR despite lower utility requirements, reflecting the inherent stoichiometric disadvantage of MP relative to reforming pathways [60].
This sensitivity to primary energy pricing is consistent with broader hydrogen-economics literature, where electricity similarly dominates the cost structure of electrolytic pathways, underscoring that feedstock or power price assumptions typically outweigh process-specific design differences [62].
Independent techno-economic syntheses reach similar conclusions. A recent institutional briefing for a 50 ton H2/day thermal MP facility reports levelized hydrogen costs in the range of approximately $2.3–4.3/kg, with natural-gas price and heat-supply strategy identified as the primary cost drivers and clear trade-offs between cost and emissions intensity depending on the CI of thermal or electrical energy inputs [63].
Electricity and thermal utilities are pathway-dependent but often decisive, particularly for plasma MP and electrified heating configurations. Although MP generally requires less electricity than water electrolysis, power consumption remains material and varies widely across designs, making electricity price and electricity CI critical determinants of both cost and emissions performance [5,12,48]. Some molten-media studies indicate that supplying heat via partial combustion of produced hydrogen may be economically favorable under certain conditions, underscoring the importance of utility-strategy selection in techno-economic modeling.
Additional OPEX contributors include catalyst makeup and regeneration (for catalytic MP), molten-media losses and purification (for molten systems), and labor, maintenance, and downtime associated with high-temperature operation, carbon fouling, and component wear. Carbon removal and conditioning impose recurring costs across all pathways, reflecting abrasion, blockage risk, and the need to preserve carbon quality for potential sale. Finally, gas purification and recycling are required to manage unreacted methane and minor hydrocarbons, adding compression and separation costs that scale with conversion efficiency and recycle ratio.

4.3. Cost Benchmarks from the Literature and the “Carbon Lever”

Published techno-economic analyses report substantial variability in the LCOH from MP, with outcomes strongly dependent on assumptions regarding energy prices, plant scale, utilization, and carbon co-product revenue [8,16,41]. Table 3 synthesizes the reported LCOH from representative studies and explicitly documents the corresponding assumptions regarding natural gas and electricity prices, carbon treatment, and plant scale.
Across the literature, molten-media and thermal MP pathways often project lower hydrogen costs than plasma routes under comparable market assumptions, reflecting plasma’s higher electricity intensity. Solid-catalyst systems tend to incur higher costs due to the burdens of catalyst replacement and regeneration. Under baseline assumptions without carbon crediting, MP costs frequently overlap with blue hydrogen and exceed gray SMR, positioning MP between conventional reforming and electrolysis in terms of combined cost–emissions performance.
A distinguishing feature relative to SMR is the “carbon lever.” Because MP produces approximately 3 kg of solid carbon per kg H2, carbon co-product sales can materially reduce effective hydrogen cost, whereas SMR produces CO2, which typically represents a cost or liability. Multiple studies show that even conservative carbon pricing assumptions can reduce reported LCOH by several tenths of a dollar per kilogram, while optimistic assumptions can drive modeled costs toward very low levels. Conversely, scenarios that assume no carbon revenue generally find MP to be more expensive than gray SMR, underscoring the centrality of realistic carbon-market assumptions to any commercialization assessment [16,21,64].
This structural dependence on carbon valuation differentiates MP from reforming pathways and shifts competitiveness from purely thermodynamic efficiency toward market absorptive capacity and pricing realism.

4.4. Integration Economics of MP + RWGS

The integration of MP with the RWGS reaction offers a structurally distinct pathway for producing methanol-grade syngas with substantially reduced CI. By replacing conventional reforming sections with MP and RWGS units, the integrated configuration enables syngas production at a near-stoichiometric H2:CO ratio (2:1) while diverting a significant fraction of carbon into a solid co-product rather than emitting it as CO2 [65]. Although this configuration achieves deeper decarbonization than conventional reforming routes, its economic performance is governed by a different set of capital, energy, and integration-driven cost drivers.

4.4.1. Capital Cost Implications of MP + RWGS Integration

At the plant level, MP + RWGS integration replaces the POx and water–gas shift (WGS) sections with high-temperature MP and RWGS reactors. For a large-scale methanol facility (≈5000 tons MeOH/day), total installed capital expenditure has been reported at approximately $1.23 billion (2024 USD), with the removal of mature POx and WGS units partially offsetting the cost of the new MP and RWGS equipment [65]. As a result, the overall CAPEX is comparable to that of advanced reforming-based plants, but the capital allocation shifts toward less mature, higher-temperature units.
The RWGS reactor contributes non-negligibly to CAPEX due to its operating conditions (≈850 °C and ≈6 bar), which necessitate high-temperature alloys and conservative mechanical design. The need for robust gas further increases integration complexity–solid separation upstream of RWGS to prevent carbon entrainment, typically requiring high-temperature cyclones or equivalent separation systems not present in conventional ATR- or POx-based flowsheets [48,66]. Consequently, while MP + RWGS does not necessarily impose a step change in total installed cost, it introduces greater uncertainty in equipment cost and scale-up risk.

4.4.2. Heat Integration and Energy-Management Economics

Both MP and RWGS are strongly endothermic reactions, making heat integration a dominant economic lever in integrated designs. MP typically requires temperatures exceeding 1000 °C, supplied via electrified resistive heating, plasma systems, or indirectly through fuel combustion [53,65]. Reported designs rely heavily on internal heat recovery, using high-temperature reactor effluents to preheat incoming natural gas and recycle streams, thereby reducing external energy demand [66].
The production of solid carbon introduces an additional opportunity for heat recovery. Cooling carbon from reactor temperatures (e.g., 1050 °C) to ambient conditions can release substantial sensible heat, which can be integrated into the plant heat network [66]. Some studies further incorporate Rankine-cycle-based recovery of waste heat from process and exhaust gases to generate electricity, partially offsetting the high power demand of the integrated system [55]. Despite these measures, MP + RWGS remains significantly more energy-intensive than autothermal reforming, underscoring the sensitivity of operating costs to electricity price and availability.

4.4.3. Efficiency Penalty Versus Carbon-Intensity Benefit

When benchmarked against ATR, MP + RWGS exhibits a clear efficiency penalty. ATR is a mature, autothermal technology that supplies reforming heat internally via partial oxidation and can achieve high overall thermal efficiency with relatively low external energy input [66]. In contrast, MP + RWGS relies on externally supplied energy to drive both methane decomposition and CO2 conversion, leading to substantially higher indirect energy use. Reported assessments indicate that indirect emissions associated with utilities can increase by approximately 160% relative to POx-based baselines, primarily due to electrified heating and compression requirements [65].
However, this efficiency penalty must be interpreted alongside emissions performance. While ATR remains a net emitter of CO2 (approximately 0.39 kg CO2eq/kg syngas), MP + RWGS can achieve net-negative CI at the methanol level, reported at approximately −0.57 kg CO2eq/kg MeOH under specific assumptions [65]. Economically, MP + RWGS substitutes for energy consumption, effectively shifting decarbonization from process chemistry to the energy supply.

4.4.4. Syngas and Methanol Cost Implications

The integration economics of MP + RWGS are highly sensitive to the cost of intermediate syngas. Comparative techno-economic analyses indicate that syngas produced via MP-based routes remains more expensive than syngas from conventional SMR or ATR under comparable feedstock and energy price assumptions [65,66]. For example, reported minimum selling prices for syngas are approximately $179/ton for SMR and $194/ton for ATR, while pyrolysis-based syngas configurations exhibit higher costs due to increased energy input and integration complexity [66].
This premium is reflected directly in the levelized cost of methanol. For MP + RWGS configurations, the levelized cost of fuel has been reported at approximately $600/ton MeOH, compared with about $377/ton MeOH for POx-based baselines, an increase of roughly 78% in the absence of policy support or carbon valuation [65]. Accordingly, MP + RWGS is unlikely to compete with ATR on a purely cost-minimization basis. Its economic case instead depends on monetizing carbon-intensity reductions through carbon pricing, low-carbon fuel standards, or similar policy mechanisms, as well as on access to low-cost, low-carbon electricity.

5. Carbon-Product Markets: The Central Bottleneck

The commercial viability and scalability of MP are ultimately constrained not by hydrogen production but by the ability of global markets to absorb the solid carbon co-product. Although MP enables the production of low emission “turquoise” hydrogen, the intrinsic stoichiometry of the process yields approximately three kilograms of solid carbon per kilogram of hydrogen. At an industrial scale, this translates into carbon volumes that far exceed current demand in established carbon markets, making carbon utilization, pricing, and market absorption the decisive economic bottleneck for MP deployment [8,24].

5.1. Carbon Products from MP

MP can generate a range of carbon allotropes, with properties governed primarily by temperature, residence time, and catalytic environment. High-temperature non-catalytic and plasma-based systems predominantly yield carbon black (CB), while catalytic routes, particularly those employing transition metals such as Fe, Ni, or Co, can produce filamentous CNTs and carbon nanofibers (CNFs). Experimental plasma-based MP studies further show that as-produced carbon black is often amorphous and electrically poor, requiring post-treatment, such as high-temperature annealing, to achieve conductivity and surface area comparable to those of commercial conductive carbon blacks, underscoring the importance of downstream processing for carbon valorization [67]. Molten metal and molten salt reactors have also been shown to produce graphitic flakes or graphite-like materials that can be continuously separated from the liquid phase [16,21,24].
From a market perspective, however, the relevance of these products is defined less by their synthesis pathways than by their volume potential, quality consistency, and addressable demand. While specialty carbons command high unit prices, their markets are orders of magnitude smaller than those required to support large-scale hydrogen production via MP.

5.2. Market Size, Absorptive Capacity, and Price Realism

The current global demand for carbon products is significantly smaller than the potential supply from a scaled hydrogen economy [24,68]. The carbon black market, currently the largest outlet at approximately 13.7–14.5 million tons per year, could be completely saturated if only 5% of the world’s current hydrogen demand were produced through MP [24]. If 100 million tons of hydrogen were produced via MP, it would yield 300 million tons of carbon, far exceeding the 15–20 million tons of current annual consumption for all solid carbon products combined [69,70,71]. This comparison is based on current global hydrogen demand (≈100–120 Mton/year); although hydrogen demand may expand in future energy-transition scenarios, projected growth in carbon-black and specialty-carbon markets remains modest relative to the linear scaling of carbon co-production inherent to MP.
High-value products such as CNTs and synthetic graphite offer significantly higher prices, but their global markets are extremely limited in volume, making them unsuitable as primary outlets for large-scale MP carbon streams. Early market assessments have long concluded that while specialty carbons can command high unit prices, their limited global demand precludes their use as primary sinks for large-scale MP carbon production, necessitating reliance on lower-value, bulk applications for system-level deployment [39,72]. As a result, developers increasingly target low-value, high-volume applications (such as construction materials, asphalt fillers, or mineral substitutes) where the absorptive capacity is large enough to accommodate bulk carbon flows, albeit at substantially lower prices [24].
This mismatch between carbon supply potential and realistic market demand introduces a fundamental risk of oversupply, which would depress prices and undermine the economic assumptions underlying techno-economic assessments of MP, particularly in the absence of harmonized carbon pricing and leakage-protection mechanisms across jurisdictions [60,73,74]. Plant-scale techno-economic modeling further demonstrates that MP hydrogen costs are highly sensitive to both achievable carbon recovery rates and realistic carbon black pricing; even under optimistic assumptions, breakeven conditions often require sustained carbon recovery of approximately 60–70% at prevailing market prices, underscoring the fragility of carbon-revenue-dependent business cases [60].
Table 4 summarizes the scale and price structure of major carbon markets relative to the quantities of solid carbon generated by MP, highlighting the fundamental mismatch between potential supply and realistic market absorption.
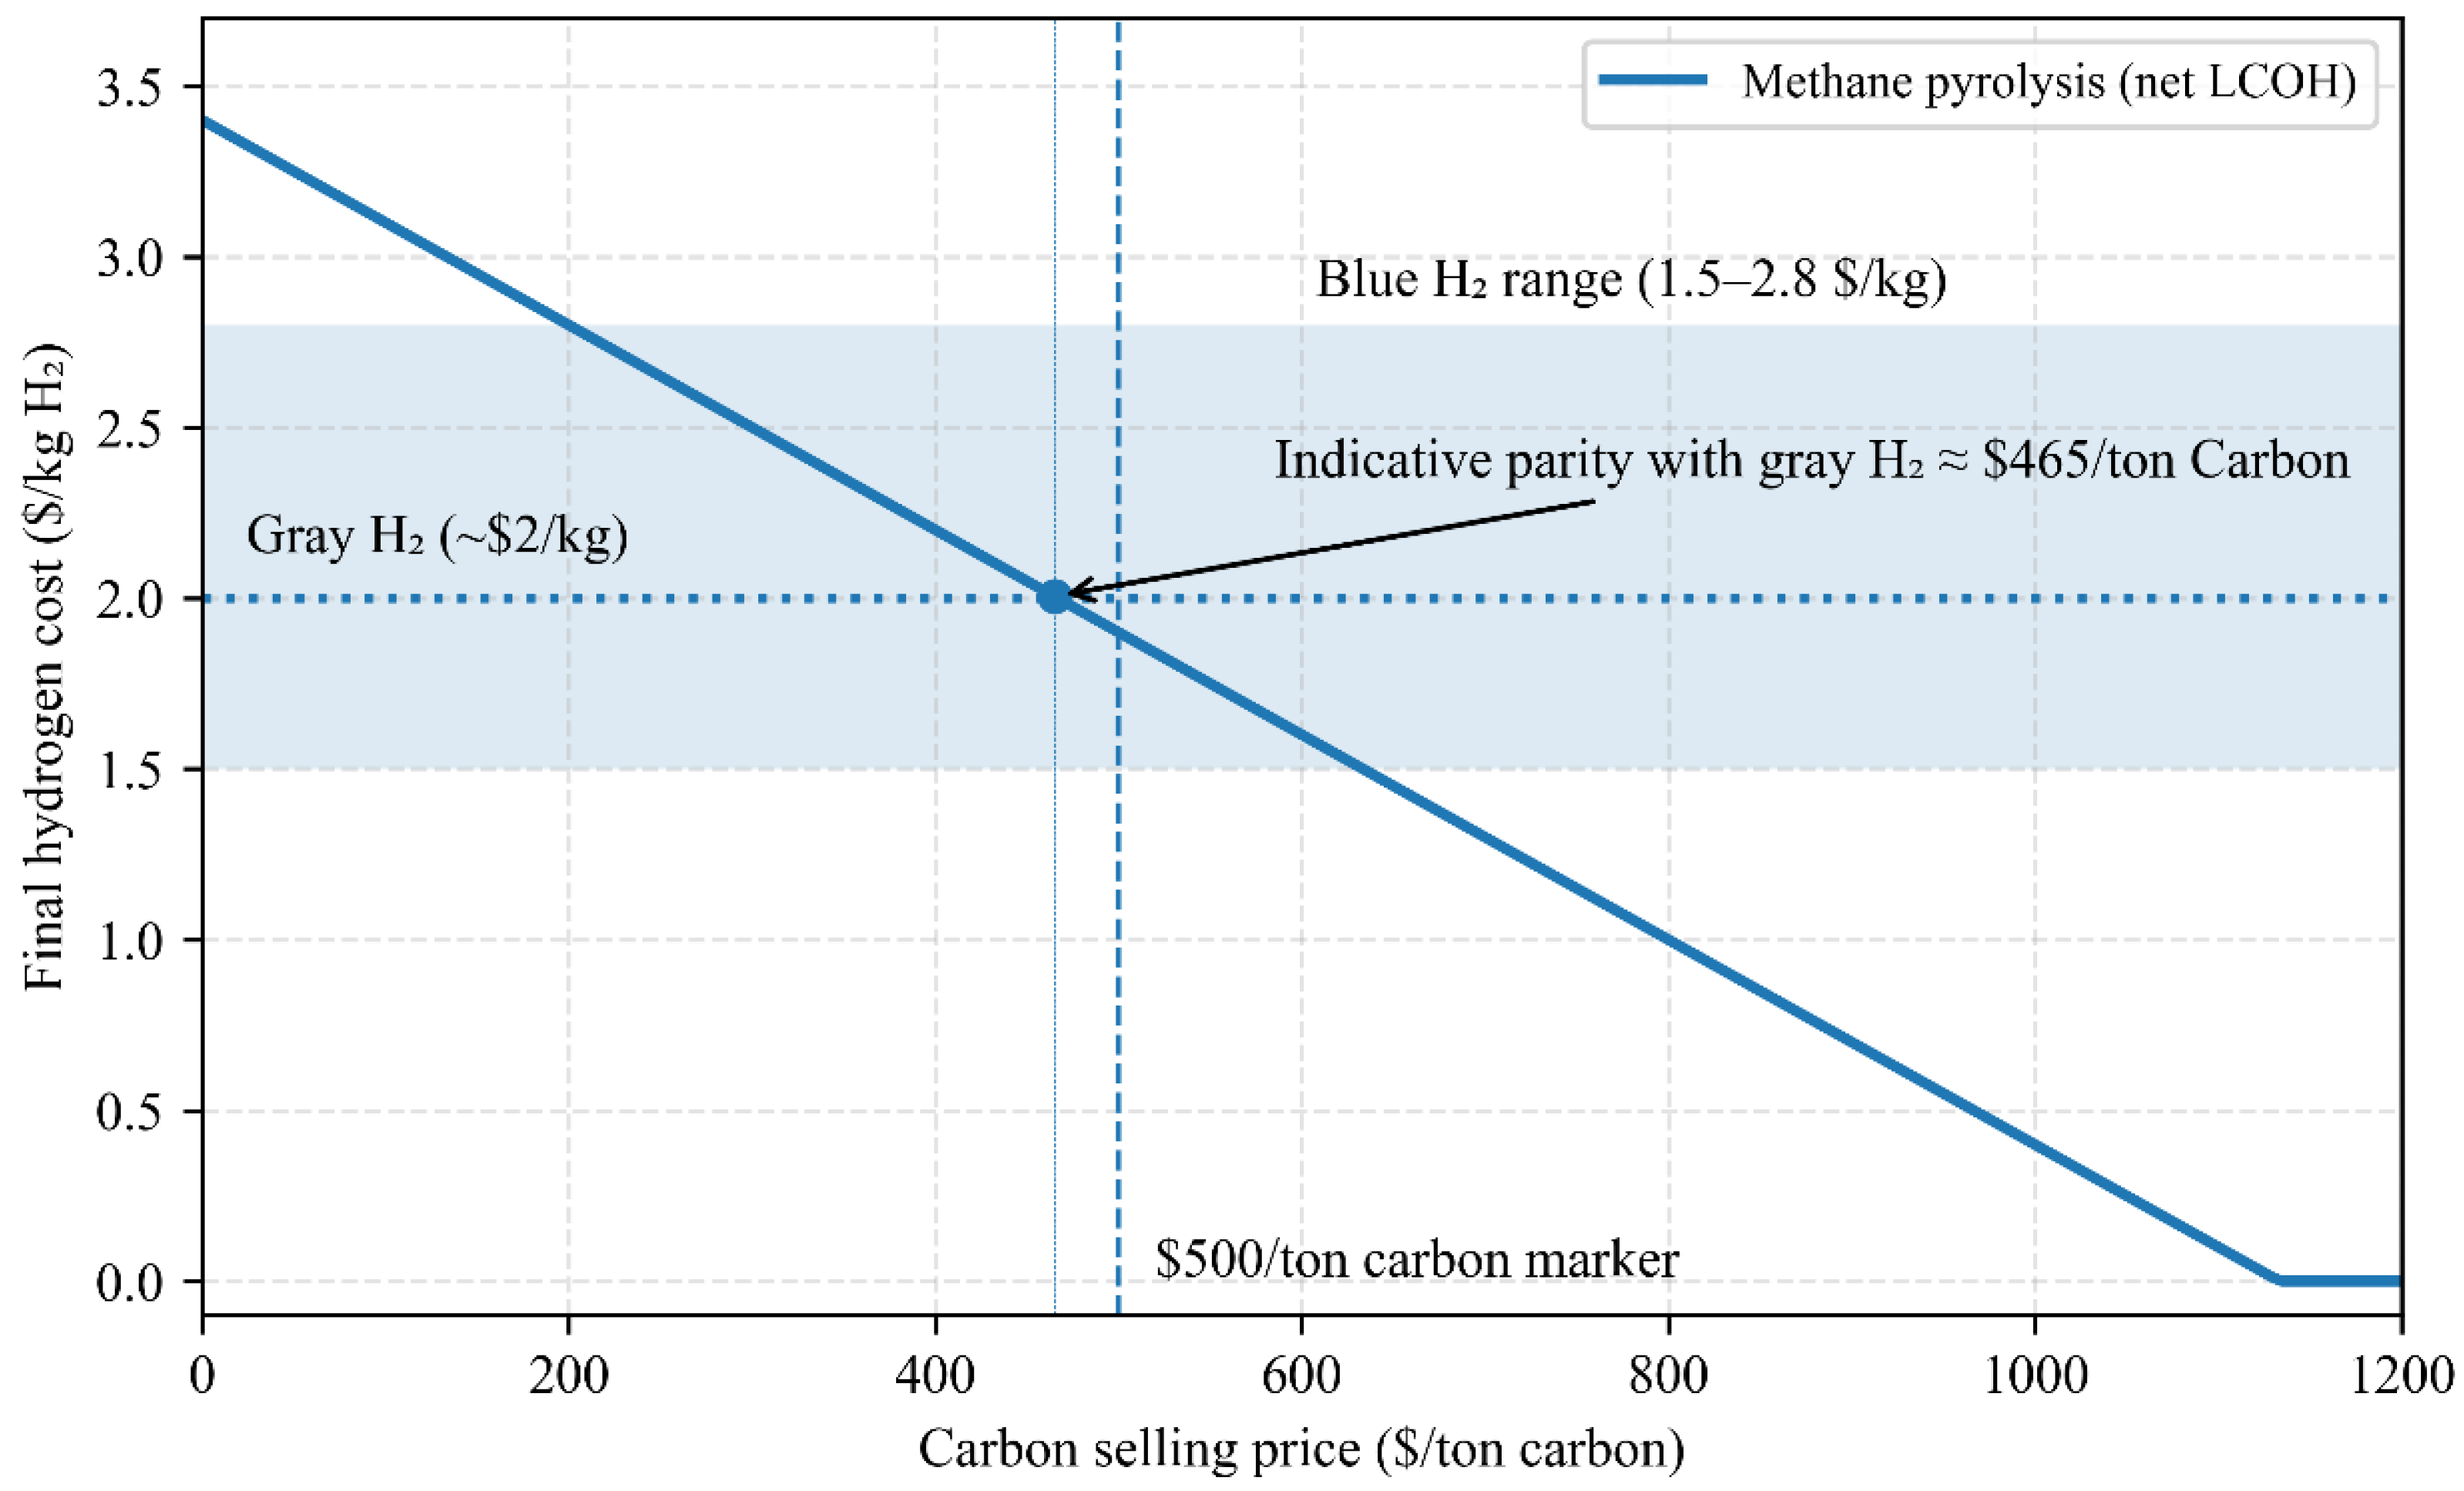
Figure 1 illustrates the sensitivity of MP hydrogen costs to solid-carbon monetization, highlighting the “carbon lever” effect. Quantitatively, the model reveals a sensitivity coefficient of $0.30/kg H2 for every $100/ton change in the carbon selling price. This linear dependency underscores that achieving parity with gray hydrogen (~$2.00/kg) requires a sustained carbon credit of at least $465/ton, a price point that may be difficult to maintain if the market faces the oversupply risks discussed above.

5.3. Product Quality, Certification, and Regulatory Constraints

Beyond volume constraints, the marketability of MP-derived carbon is limited by stringent quality and certification requirements. Industrial buyers, particularly in tire manufacturing, batteries, and advanced materials, require tight control over particle size distribution, morphology, purity, and ash content. Trace contamination from catalysts or molten media can significantly devalue the product or render it unusable in regulated applications [8,21]. For example, Su et al. [76] demonstrated that introducing a NaCl molten salt layer above a Cu–Bi molten metal phase reduced metal contamination in solid carbon from >50 wt% to below 4 wt%, with post-treatment achieving <1.5 wt%, while enabling continuous carbon separation, highlighting both the promise of molten-media concepts and the continuing need for downstream purification [76]. Similar sensitivities to carbon purity and assumed selling price are reported in process-level assessments of CARGEN-based reforming systems targeting multi-walled carbon nanotube (MWCNT) co-production, where overall project economics depend strongly on achievable nanotube quality, recovery, and market price [77,78,79].
Post-processing steps, such as thermal purification or acid washing, can improve product quality but also introduce additional capital and operating costs, reducing net carbon revenue. Regulatory uncertainty further compounds this challenge: in some jurisdictions, MP-derived carbon may be classified as industrial waste rather than a product, triggering additional handling, transport, and disposal requirements that erode economic value [70].

5.4. Can Carbon Revenues Realistically Support MP?

Techno-economic studies consistently show that carbon revenues are essential for MP to achieve cost competitiveness with conventional reforming routes. Without carbon monetization, the reported LCOH from MP typically exceeds that of unabated SMR. Carbon prices above approximately $500/ton are often required for MP to compete directly with gray hydrogen in the absence of other favorable conditions, while more modest prices in the range of $150–200/ton may be sufficient to compete with blue hydrogen pathways that incur additional CO2 capture and storage costs [8,48,52].
Insights from carbon-valorizing reforming systems further reinforce this conclusion. Techno-economic analyses of GTL, ammonia, and methanol plants retrofitted with CARGEN-derived reactors show that profitability becomes highly sensitive to assumed MWCNT selling price and purity, with optimistic carbon-value scenarios required to materially offset hydrogen or chemical production costs [65,77,78,79]. This behavior mirrors MP economics and highlights the general fragility of business cases that rely on sustained access to premium nanocarbon markets.
Optimistic scenarios, often based on sustained production of high-purity CNTs or graphite, can theoretically drive hydrogen costs toward zero or negative values. However, these cases rely on niche markets with limited capacity, stable premium pricing, and consistent quality control, conditions that are unlikely to be met at the scales implied by global hydrogen deployment. In practice, the absence of robust demand-side policies (e.g., minimum carbon content requirements or green material procurement mandates) limits the ability of carbon revenues to reliably underwrite large-scale MP investments [8].
In essence, reliance on carbon markets can support MP only if carbon demand scales in parallel with hydrogen production; otherwise, MP risks producing economically stranded carbon, regardless of its technical or environmental merits.
However, these market-absorption constraints should not be interpreted as rendering MP strategically irrelevant. Rather, they indicate that MP is unlikely to function as a universal hydrogen production pathway at the global scale under current carbon-market structures. Even partial deployment, at a few percent of global hydrogen demand, would correspond to tens of millions of tons per year of low-emission hydrogen, which remains material in the context of early-stage hydrogen market expansion. MP may therefore occupy a geographically and sectorally bounded niche within a diversified hydrogen portfolio, particularly in regions with verified low-leakage gas supply, access to low-carbon electricity, and either established carbon-black markets or credible bulk carbon applications. In this framing, the central challenge is not whether MP can replace reforming globally, but under what conditions it can contribute meaningfully without generating economically stranded carbon.

6. Economic–Emissions Trade-Space: MP and MP + RWGS Versus SMR/ATR

The economic competitiveness of MP and MP-based integration routes must be evaluated relative to established reforming technologies under realistic assumptions for energy prices, carbon valuation, and process scale. Unlike SMR and ATR, MP economics are uniquely shaped by the monetization of a solid carbon co-product and by electricity price and CI.

6.1. Literature-Based Cost Benchmarks

Unabated SMR (“gray hydrogen”) remains the lowest-cost hydrogen pathway in most regions, with reported levelized costs typically below $2/kg H2, depending primarily on natural gas prices [59]. The integration of CCS increases costs, with blue hydrogen from SMR or ATR commonly reported at approximately $1.5–2.8/kg H2, reflecting additional capital and operating costs for CO2 capture, compression, transport, and storage [54,80].
ATR with CCS is frequently identified as the most cost-effective low-carbon reforming option at scale, with hydrogen costs projected at $1.5–2.2/kg H2 and syngas costs at $190–200/ton under current assumptions [24,66]. These values provide the primary benchmark against which MP and MP + RWGS pathways must compete.
Reported MP costs span a wider range, reflecting technology pathway, energy sourcing, and carbon revenue assumptions. Thermal and molten-media MP generally fall at the lower end of reported cost ranges, while plasma MP remains more electricity-intensive and capital-intensive. As shown in Section 4 and summarized in Table 3, MP costs frequently exceed gray SMR unless carbon revenues or policy incentives are included.

Comparability Notes on Economic Benchmarks

Direct comparison of reported cost ranges across MP, MP + RWGS, SMR, and ATR pathways requires careful interpretation, as underlying assumptions vary across studies. Unless otherwise stated, the cost benchmarks summarized in Section 6 reflect W2G or plant-gate system boundaries and should be interpreted as indicative ranges rather than point estimates.
Key comparability assumptions include:
  • System boundary: Most techno-economic assessments report hydrogen or syngas costs on a well-to-gate basis, excluding downstream distribution, storage, and end-use conversion. For methanol pathways, reported levelized costs typically include syngas generation and synthesis but exclude downstream logistics.
  • Methane leakage: Leakage assumptions vary widely across studies, typically ranging from 0.2% to 1.7%. Where not explicitly stated, global average leakage rates are often implicitly assumed. Because MP requires higher methane input per unit of hydrogen than reforming routes, cost and emissions results are particularly sensitive to this parameter.
  • CCS performance: For SMR and ATR with CCS, capture rates of 90–95% are commonly assumed at the reformer or shift outlet. Reported costs generally exclude long-term liability or monitoring costs associated with geological CO2 storage unless explicitly stated.
  • Electricity assumptions for MP: Electrified MP pathways assume electricity prices spanning approximately $0.03–0.07/kWh, with grid carbon intensities ranging from renewable-dominated (<50 gCO2eq/kWh) to fossil-dominated (>500 gCO2eq/kWh) systems. Both the electricity price and CI strongly influence MP competitiveness and reported levelized costs.
  • Carbon co-product valuation: MP cost estimates frequently credit revenue from solid carbon sales, with assumed prices spanning more than an order of magnitude depending on grade, purity, and market access. These assumptions are a primary driver of cost variability and bankability risk.
Accordingly, the cost ranges presented in this section are best interpreted as conditional envelopes that illustrate relative competitiveness under defined technical, market, and policy conditions rather than as directly comparable single-point projections.

6.2. Relative Competitiveness Across Energy and Market Conditions

The relative position of MP shifts markedly with changes in natural gas and electricity prices. Compared to ATR, MP-based syngas production via combined pyrolysis and dry reforming is currently more expensive, with reported syngas costs around $220/ton compared to approximately $194/ton for commercial ATR [66]. However, ATR is more sensitive to natural gas price escalation because higher methane consumption per unit of output narrows the cost gap under high gas-price scenarios.
Electricity pricing exerts a stronger influence on MP competitiveness. In regions with low-cost electricity, thermal MP can approach or match the cost of SMR with CCS, particularly when paired with modest carbon byproduct revenues [54]. Plasma-based MP remains economically viable only under favorable electricity pricing or when supported by substantial carbon revenue or policy incentives.
For methanol synthesis, integrating MP with RWGS delivers the lowest CI, but at a clear economic premium. Reported levelized methanol costs for MP + RWGS configurations are approximately $600/t, compared with roughly $340–380/ton for POx- or ATR-based baselines [65,66]. This cost penalty can be partially offset by carbon sales and carbon pricing, but MP + RWGS remains economically disadvantaged relative to ATR-based routes unless strong decarbonization incentives are applied.

6.3. Threshold Conditions for Economic Viability

Across the literature, MP competitiveness is highly sensitive to a limited set of economic and system-level parameters. Building on the cost-structure analysis presented in Section 5.3, the following threshold conditions consistently emerge:
  • Natural gas price sensitivity: MP is stoichiometrically disadvantaged, producing only two moles of H2 per mole of CH4 compared to up to four for SMR. As a result, MP hydrogen costs exhibit high elasticity to gas prices; a 50% increase in natural gas price can increase MP LCOH by nearly 40% in some assessments [8].
  • Electricity CI: For MP and MP + RWGS to achieve net-negative or ultra-low emissions, electricity CI must remain below approximately 150–170 gCO2eq/kWh. Above this threshold, indirect emissions dominate and erode climate benefits [66].
  • Carbon pricing and policy support: Carbon credits or taxes materially alter competitiveness. For example, U.S. §45V hydrogen tax credits (up to $3/kg H2) can shift MP economics decisively when lifecycle emissions fall below required thresholds [8].
  • Solid carbon selling price: To outcompete gray SMR without capture, carbon byproducts typically must be sold at prices exceeding $500/ton. At more conservative prices ($150–200/ton), MP is generally competitive only with blue hydrogen pathways rather than gray SMR [24,48].
  • Electricity price for plasma MP: Plasma-based MP reaches reported hydrogen costs around $2.5/kg at electricity prices near $0.06/kWh; achieving sub-$1.5/kg costs would require electricity prices below $0.03/kWh or substantial reductions in capital costs for plasma equipment [2].
Taken together, these values define a narrow operating envelope within which MP and MP + RWGS approach cost parity with reforming technologies. Outside this envelope, ATR with CCS retains a structural economic advantage.

7. Emissions Insights: When MP + RWGS Beats SMR/ATR

7.1. Emission Components Governing Climate Performance

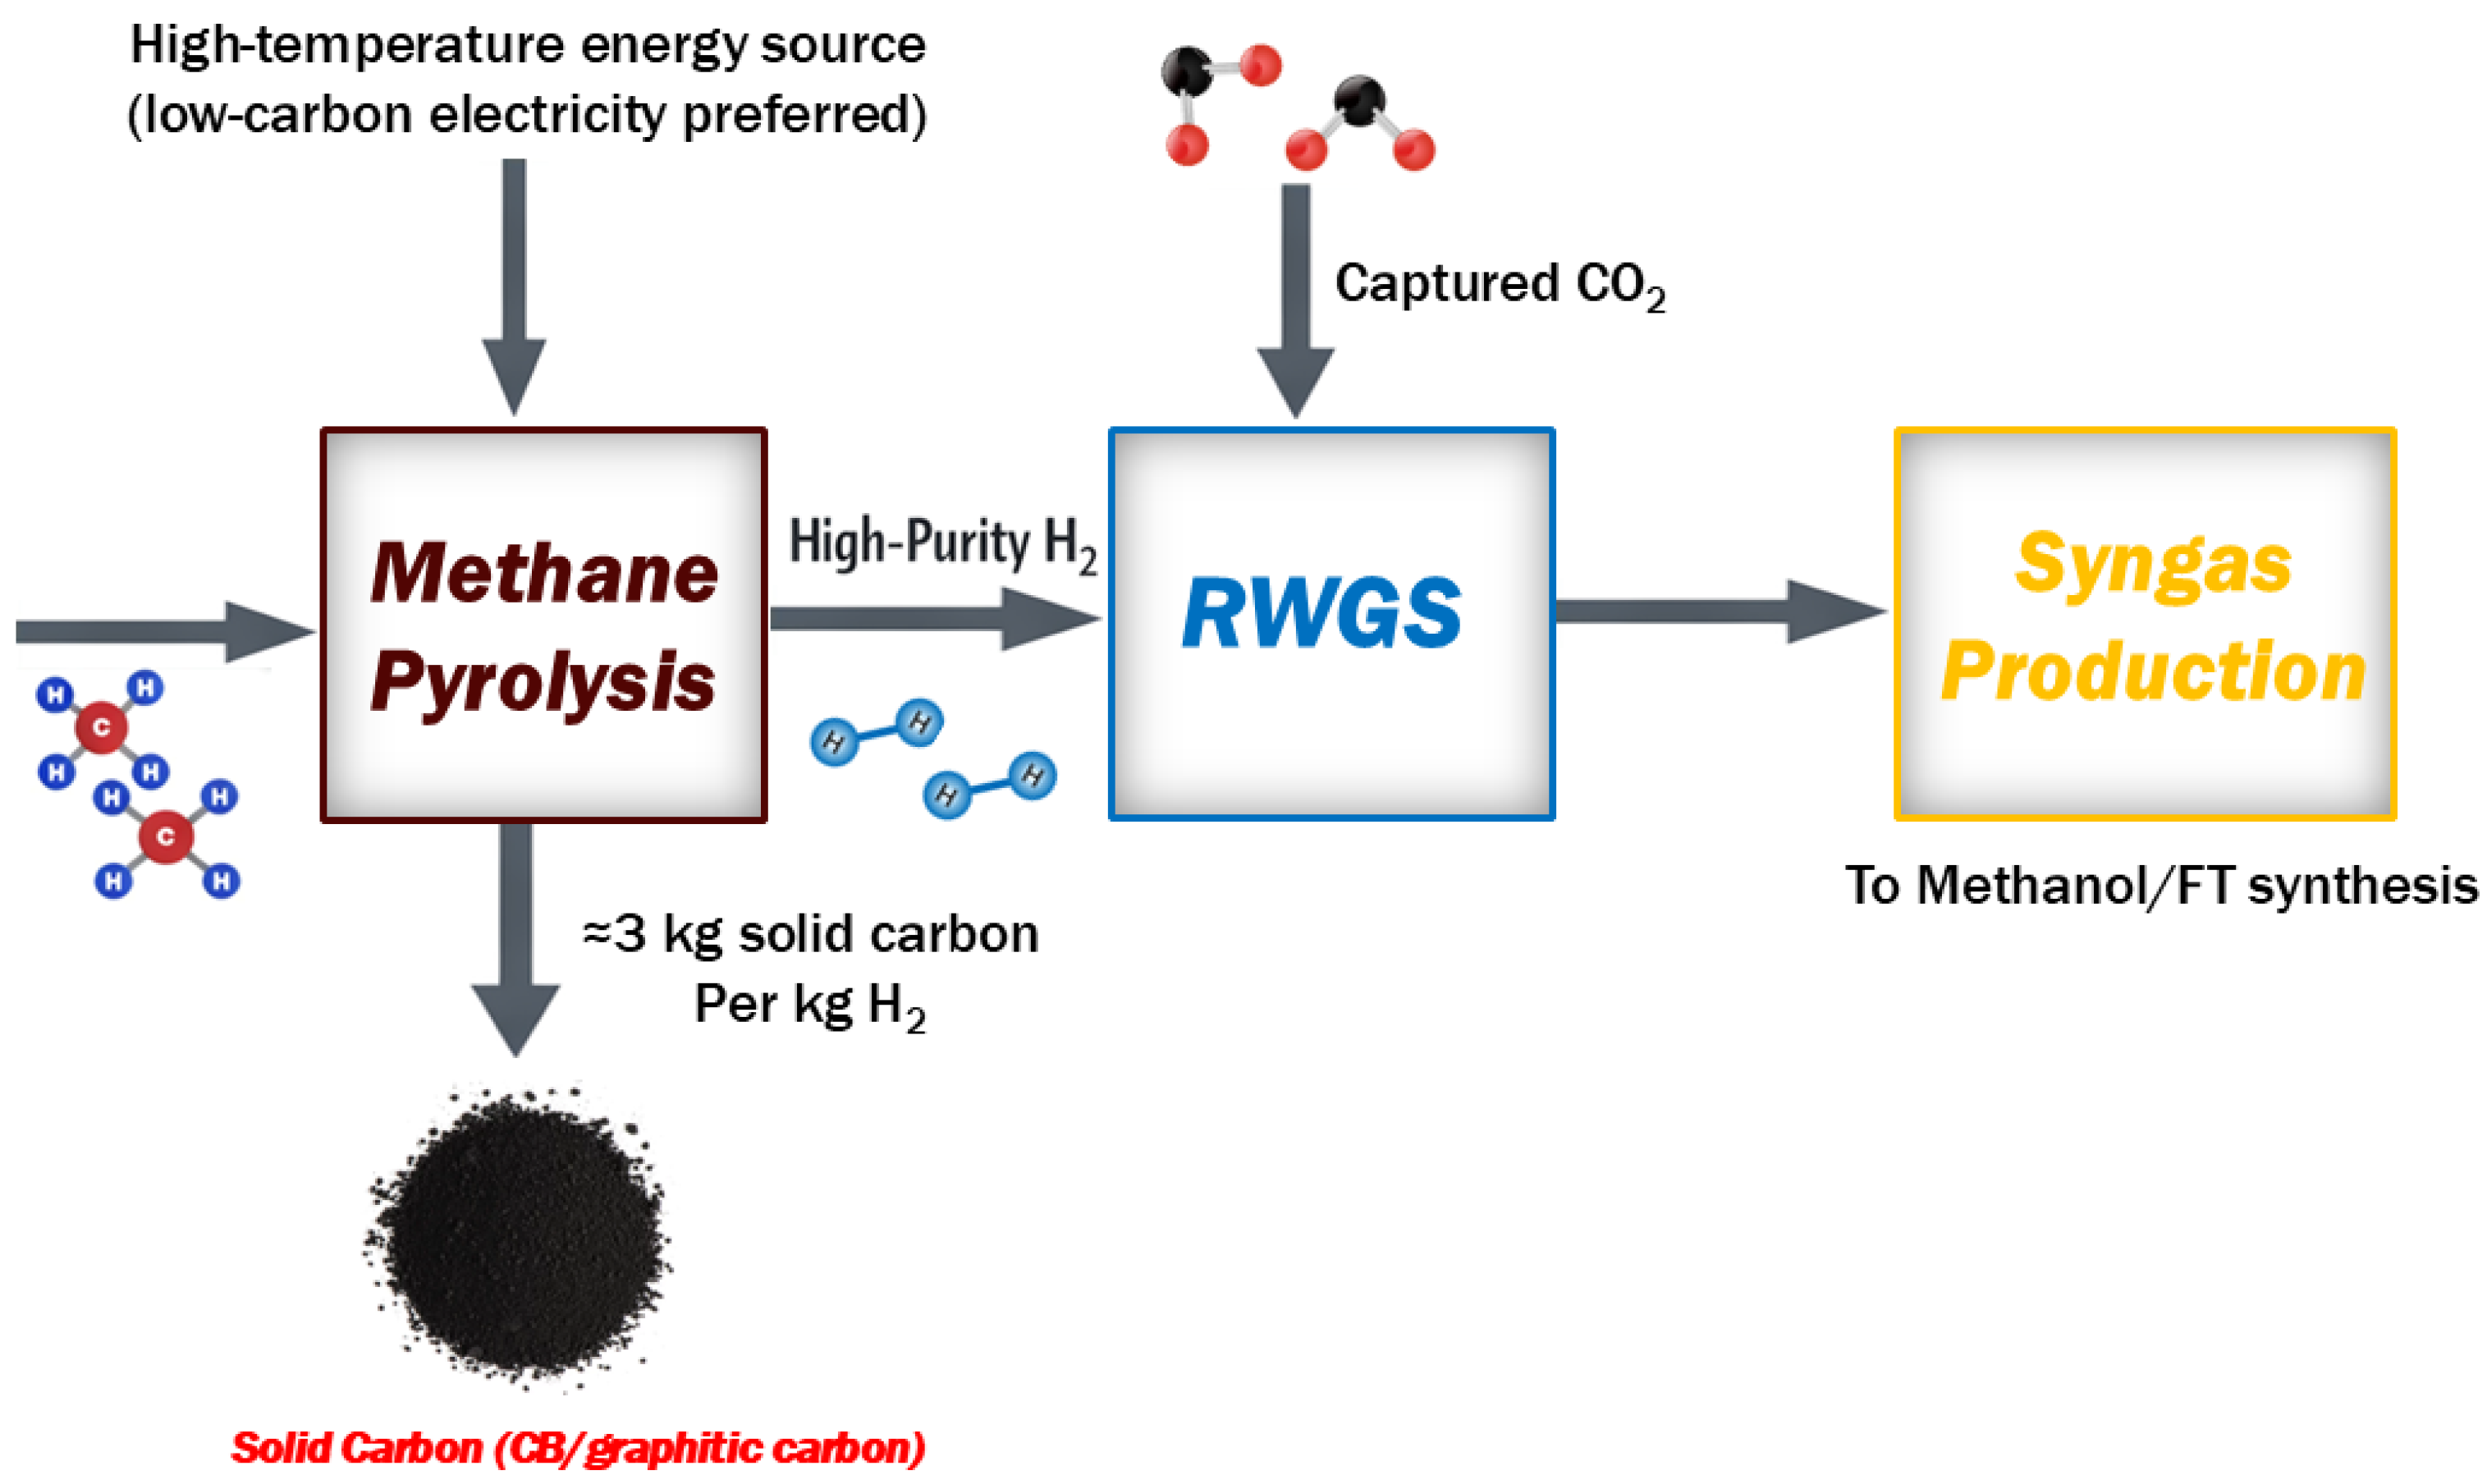
The climate performance of MP, particularly when integrated with RWGS, is governed by a small set of dominant emission components that determine whether the pathway can outperform conventional reforming routes such as SMR and ATR with CCS. Unlike reforming, which produces gaseous CO2 that must be captured and permanently stored, MP converts the carbon content of methane directly into a solid phase, thereby avoiding direct CO2 formation as well as the infrastructure requirements, energy penalties, and long-term leakage risks associated with CCS [5,50,64]. The conceptual integration of MP with RWGS and the associated emissions-relevant flows is illustrated in Figure 2.
All emission comparisons in this section follow the harmonized W2G framework and assumptions defined in Section 2.2. The discussion below, therefore, interprets reported literature values within that consistent boundary to avoid implicit comparability across heterogeneous methodological assumptions.
However, these intrinsic advantages do not automatically translate into lower lifecycle emissions. Instead, lifecycle performance is governed by a limited set of interacting emission drivers discussed below.

7.1.1. Fugitive Methane Emissions

Fugitive methane is consistently identified as the dominant contributor to lifecycle GHG emissions in MP-based systems.
While methane pyrolysis produces two moles of H2 per mole of CH4 on a stoichiometric basis, SMR can theoretically produce up to four moles of H2 per mole of CH4, a lifecycle comparison cannot rely on reaction stoichiometry alone. Industrial SMR and ATR plants consume additional methane as process fuel to supply reforming heat, increasing total methane throughput beyond feedstock requirements. Therefore, upstream fugitive emissions must be calculated per unit of total methane consumed (feed + fuel) within the defined system boundary, rather than inferred directly from reaction stoichiometry. In the harmonized framework adopted here, methane leakage is parameterized as a fraction of total methane throughput for each pathway [8,16,64].
At global-average leakage rates (1.5–1.7%), fugitive emissions can account for more than half of total lifecycle emissions, eroding or even negating the climate benefits of MP. Multiple studies indicate that for MP or MP + RWGS to outperform SMR or ATR on a carbon-intensity basis, methane leakage rates must typically remain below 0.5%, highlighting the critical importance of low-leakage gas supply chains [13,64].
The sensitivity of this threshold to the GWP horizon is substantial. Under GWP20, methane’s higher short-term warming potential amplifies the penalty of leakage, narrowing the operating space in which MP is climate-superior [81]. Therefore, reported leakage thresholds should be interpreted relative to the chosen GWP basis.

7.1.2. Electricity CI

For electrified MP configurations, including plasma, resistive, or microwave heating, the CI of the electricity supply is a second decisive factor. When powered by low-carbon or renewable electricity, MP can achieve very low lifecycle emissions; reported values for renewable-powered plasma MP are as low as 1.9 kg CO2eq/kg H2, substantially below those of conventional SMR (10–11 kg CO2eq/kg H2) [2]. In contrast, when supplied with carbon-intensive grid electricity, the high electrical demand of MP, particularly for plasma-based systems, can result in total emissions exceeding those of SMR or even SMR with CCS [48,64]. Consequently, electricity decarbonization is a prerequisite for maintaining the emissions advantage observed under low-CI scenarios.
Harmonized lifecycle assessments using consistent well-to-gate system boundaries confirm that MP achieves substantially lower CI than unabated SMR under low-CI electricity supply but rapidly loses this advantage as grid CI increases or methane leakage rises. This indicates that upstream electricity and gas supply characteristics exert a stronger influence on climate performance than nominal reaction chemistry or reactor configuration [82].

7.1.3. Carbon-Product Permanence

A distinctive advantage of MP relative to reforming routes lies in the permanence of carbon storage. Solid carbon products such as carbon black, graphite, or amorphous carbon are thermodynamically stable and do not readily oxidize back to CO2 when landfilled or embedded in long-lived materials (e.g., construction applications).
However, thermodynamic stability does not automatically guarantee lifecycle permanence, as durability depends on product lifetime, end-of-life management, and regulatory accounting frameworks [83]. End-of-life scenarios, product recycling pathways, regulatory classification, and potential future oxidation must therefore be considered explicitly in lifecycle assessment [70,83]. From a lifecycle perspective, two bounding cases can be defined: (i) durable storage in long-lived applications with negligible oxidation within the assessment horizon, and (ii) partial or complete re-oxidation at end-of-life. The latter case effectively converts solid carbon back to CO2, thereby eliminating the emissions advantage relative to CCS-based pathways [83].
Accordingly, the harmonized framework introduced in this study evaluates carbon permanence parametrically, allowing the oxidation fraction to range from 0 (fully durable) to 1 (fully re-oxidized), thereby quantifying how durability assumptions influence comparative CI.
At the system scale, durability assumptions must also be evaluated in the context of market absorption and end-use pathways. As discussed in Section 5, the large-scale deployment of MP would generate carbon volumes far exceeding those of current specialty markets. If market saturation shifts carbon toward lower-value or shorter-lived applications, the effective storage duration may decrease, increasing the likelihood of partial re-oxidation over time. Consequently, durability cannot be treated as an intrinsic material property alone but must be assessed jointly with realistic product lifetimes and end-of-life management scenarios [8,64].
In addition, regulatory recognition of solid carbon as a form of permanent sequestration continues to evolve. While geological CO2 storage is increasingly embedded in carbon-accounting frameworks, product-based carbon storage pathways do not yet have uniformly codified permanence criteria. Changes in accounting rules or eligibility under carbon-credit and low-carbon fuel mechanisms could materially influence the monetization of carbon durability and alter comparative lifecycle assessments relative to ATR + CCS systems [70].

7.1.4. RWGS Integration Efficiency

When MP is coupled with RWGS to produce syngas for methanol or other chemicals, overall emissions depend on the combined system’s efficiency and energy integration. MP benefits from a lower intrinsic reaction enthalpy for hydrogen production (37.8 kJ/mol H2) compared with SMR (63.4 kJ/mol H2), partially offsetting the additional energy demand associated with RWGS [2,50]. Integrated configurations that rely on renewable electricity, effective heat recovery, or fuel switching using internally produced hydrogen can maintain a favorable emissions performance, whereas poorly integrated systems may incur substantial indirect emissions from compression and high-temperature heating [5,49].
Importantly, these drivers are not independent; they define a constrained multi-parameter decision space. Outside this operating space, upstream and indirect emissions can offset the intrinsic advantage of solid-carbon formation, emphasizing the importance of location-specific and supply-chain-aware deployment rather than generalized claims of technological superiority.

7.2. Carbon Intensity Ranges Reported in the Literature

Reported lifecycle CI values for MP span a wide range in the literature, reflecting sensitivity to electricity source, upstream methane leakage, and reactor configuration [2,13,64].
Because published studies adopt heterogeneous methodological assumptions, direct aggregation of reported CI ranges may imply comparability that has not been ensured. To avoid this, reported CI values are interpreted here as context-dependent outcomes rather than universally comparable benchmarks.

7.2.1. MP Hydrogen with Low-Carbon Electricity

When supplied with renewable or very low-carbon electricity (e.g., wind, solar, hydro), MP consistently exhibits its lowest reported lifecycle emissions. Across multiple studies, CI values typically range from 0 to 1.1 kg CO2e/kgH2, placing MP among the lowest-emission hydrogen pathways reported to date [16,48]. Plasma and molten-media configurations powered by renewable electricity frequently cluster around 1.5–2.0 kg CO2e/kg H2, comparable to or lower than ATR with high capture rates [2,13].
Several studies further report net-negative CI when MP is fed with biomethane and powered by renewable electricity. In these scenarios, biogenic carbon is converted into solid carbon and permanently sequestered, yielding net atmospheric CO2 removal [84]. Such outcomes remain contingent on biomethane availability and conservative lifecycle accounting assumptions.

7.2.2. MP Hydrogen with Fossil or Grid Electricity

When MP relies on fossil-dominated grid electricity, reported CI values increase sharply. Regional comparisons demonstrate that hydro-dominated grids enable low-CI outcomes, whereas coal-intensive grids can push MP emissions beyond those of SMR [48]. Plasma-based MP represents an extreme case: when powered by carbon-intensive electricity, reported CI values can exceed 30 kg CO2e/kg H2, surpassing even unabated grey hydrogen [36]. This system-level sensitivity to grid CI reinforces the central role of electricity sourcing in determining lifecycle outcomes [85].

7.2.3. Comparison with SMR and ATR with CCS

Blue hydrogen pathways based on SMR or ATR with CCS typically exhibit CI values in the range of 0.4–6.5 kg CO2e/kg H2, depending on capture efficiency, methane leakage, and storage assumptions [13]. ATR with high capture rates often achieves the lowest CI within this class but remains dependent on permanent geological CO2 storage.
Relative to these benchmarks, MP achieves comparable or lower CI only under favorable deployment conditions, particularly low-carbon electricity and low-leakage gas supply chains [64,86].

7.2.4. Synthesis of Reported CI Ranges

Table 5 and Table 6 provide a structured classification of representative lifecycle CI values reported in the literature for hydrogen, methanol, and ammonia pathways involving MP, reforming routes, and integrated configurations. For hydrogen (Table 5), results are grouped by system boundary and annotated according to key methodological assumptions, including methane leakage, electricity CI, and carbon-product treatment. For downstream products (Table 6), CI values are reported on the product-specific functional units adopted in the original studies.
This classification highlights that reported CI outcomes are strongly conditioned by boundary definition and modeling assumptions. Variability across studies arises not only from technological differences but also from differences in upstream methane leakage assumptions, grid CI, coproduct accounting, and scope definitions. Consequently, the numerical ranges presented in Table 5 and Table 6 should be interpreted as context-dependent outcomes rather than directly comparable benchmarks. A consistent parametric evaluation under unified W2G assumptions is presented in Section 8 to assess competitiveness thresholds on a like-for-like basis.

7.3. Conditions Under Which MP + RWGS Is Climate-Superior

Building on the emission drivers identified in Section 7.1, the literature converges on a set of quantitative parameter ranges within which MP and MP + RWGS can outperform ATR + CCS on a lifecycle CI basis. These conditions should be interpreted not as universal thresholds, but as parameter ranges within a harmonized decision space. Their validity depends on consistent system boundaries, GWP assumptions, and coproduct accounting conventions.
Methane leakage threshold: supply-chain methane leakage must typically remain below 0.5% (under GWP100 assumptions) to preserve an emissions advantage over ATR + CCS [8,13,64].
Electricity CI threshold: MP configurations require low-carbon electricity to maintain climate superiority. Most studies indicate that electricity CI must remain below 50–100 g CO2e/kWh, with values closer to 20–30 g CO2e/kWh required for robust advantage over ATR + CCS [2,13,48].
Carbon permanence and end use: The climate advantage of MP depends on durable sequestration of the solid carbon coproduct. If a significant fraction of carbon is re-oxidized at end-of-life, the effective CI increases proportionally, narrowing or eliminating the emissions advantage relative to CCS-based pathways [2,8]. Durability assumptions therefore represent a critical modeling parameter rather than a guaranteed outcome.
Integrated heat and process efficiency: Efficient thermal integration and fuel-switching strategies are required to minimize indirect emissions associated with compression, high-temperature heating, and auxiliary energy demand. Configurations employing internal hydrogen recycling, high-grade heat recovery, or electrified heating under low-carbon power supply achieve the lowest reported carbon intensities and mitigation costs [49]. Poorly integrated systems can substantially diminish the advantage of MP + RWGS through elevated indirect energy consumption.

7.4. Implications for Methanol and Syngas Production

Integrating MP with RWGS fundamentally alters the emissions profile of methanol synthesis by decoupling hydrogen production from CO2 generation and instead using CO2 as a feedstock to tune syngas stoichiometry.
Syngas carbon intensity
Methanol synthesis requires a syngas ratio of approximately 2:1 (H2:CO), which can be achieved via MP coupled with RWGS or DMR. Modeling studies indicate that when electricity CI remains below 200–230 g CO2eq/kWh, integrated MP-based syngas routes can achieve net-zero or net-negative emissions, despite increased methane throughput relative to reforming-based routes [49].
Role of CO2 source
The origin of CO2 used in RWGS strongly influences both environmental performance and cost. Industrial point sources provide lower-cost CO2 with moderate mitigation potential, whereas DAC offers maximum climate benefit at substantially higher cost. Biogenic CO2 or biogas-derived feedstocks enable the lowest reported levelized cost of CO2 mitigation and allow MP + RWGS systems to function as net carbon sinks [49,84].
Methanol carbon intensity outcomes
Conventional natural-gas-based methanol production typically has a carbon intensity of 100–110 g CO2eq/MJ. In contrast, MP + RWGS configurations supplied with low-carbon electricity and suitable CO2 sources have been reported to achieve net-negative methanol CI (approximately −0.5 to −0.6 kg CO2eq/kg MeOH), driven by simultaneous CO2 utilization and solid-carbon sequestration [65]. These outcomes remain sensitive to indirect emissions associated with CO2 compression and handling.
Strategic significance
By using CO2 as a reactant rather than a waste stream and immobilizing feedstock carbon in solid form, MP + RWGS provides a distinct pathway for deep decarbonization of methanol and other syngas-derived chemicals, particularly in regions where electricity sourcing, methane management, and CO2 availability align with the deployment conditions outlined above.

8. Parametric Decision-Space Analysis Under Harmonized Assumptions

This section applies the harmonized W2G framework defined in Section 2.2 to generate transparent decision-space representations for MP relative to ATR + CCS. All results are reported on a per-functional-unit basis of 1 kg H2 at the plant gate. Rather than replacing detailed lifecycle or techno-economic assessments, the objective is to systematically re-evaluate commonly cited CI and cost thresholds under consistent boundary conditions and benchmark parameterization derived from representative literature cases [26,48].

8.1. Carbon Intensity Break-Even Map

Under the harmonized W2G boundary, lifecycle CI can be written in the generalized form commonly used in hydrogen lifecycle accounting [87,88]:
C I = L m C H 4   G W P C H 4 + e   I e l e c + C I r e s
where L = methane leakage fraction of total methane throughput (feed + fuel), m C H 4   = total methane consumption (kg CH4/kg H2), G W P C H 4 = 29.8 (GW100, IPCC AR6), e = electricity demand (kWh/kg H2), I e l e c = electricity CI (kg CO2e/kWh), C I r e s = residual direct CO2 emissions.
The break-even boundary obtained by solving:
C I M P =   C I A T R + C C S
Rearranging for methane leakage yields:
L =   ( e A T R e M P ) I e l e c + ( C I r e s , A T R C I r e s , M P ) m M P m A T R G W   P C H 4
This expression directly defines the break-even leakage rate as a function of electricity CI.
To parameterize this relationship, the MP benchmark is taken from the gas-fired molten metal case of Shokrollahi et al. [48], with total m M P = 4.95 kg CH4/kg H2, and e M P = 0.28 kWh/kg H2. Although Shokrollahi et al. [48] report results under a cradle-to-gate boundary, the process parameters used here (methane consumption and electricity demand) are reinterpreted within the harmonized W2G framework defined in Section 2.2, ensuring boundary consistency across the compared pathways. Under the W2G framing adopted here, the solid carbon coproduct is treated under the durable-storage bounding case, and therefore C I r e s , M P = 0 .
The ATR + CCS benchmark is based on the midpoint IEAGHG case [26], with m A T R = 3.7 kg CH4/kg H2, e A T R = 2.50 kWh/kg H2, and C I r e s , A T R = 0.75 kg CO2/kg H2.
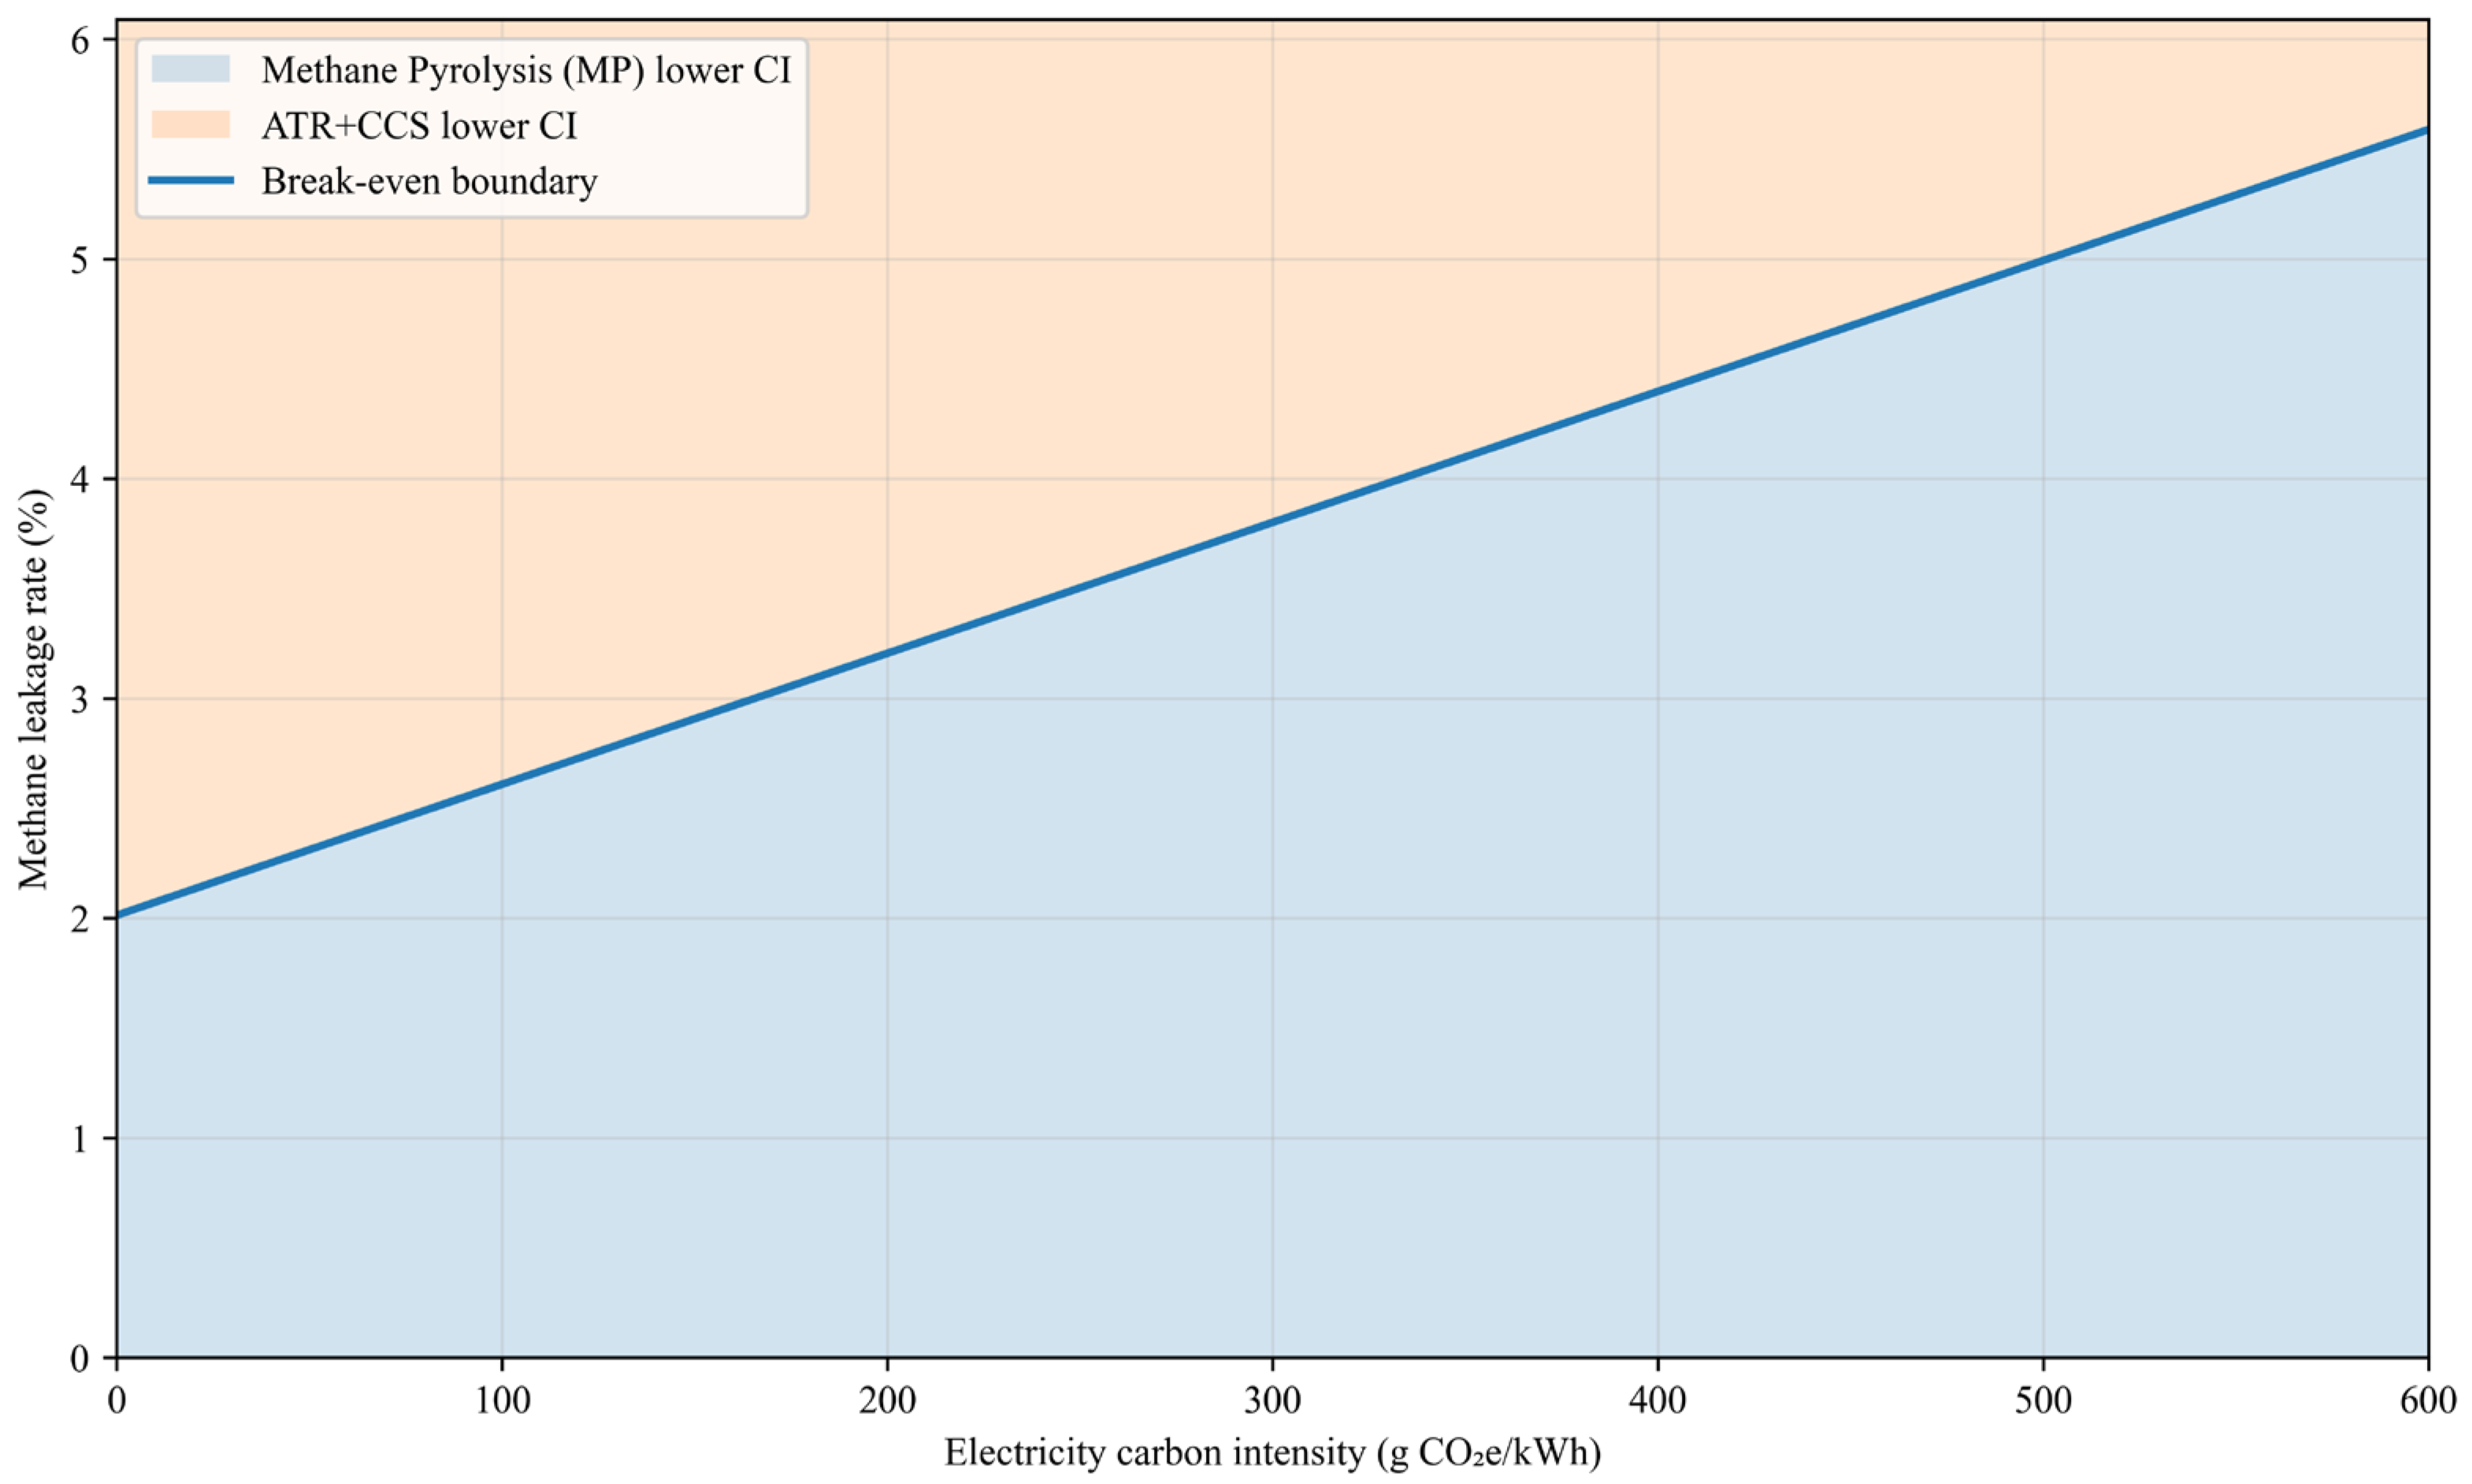
Substituting these benchmark parameters yields the break-even contour shown in Figure 3. Regions below the boundary correspond to conditions under which MP exhibits lower W2G CI than ATR + CCS, whereas regions above the boundary favor ATR + CCS.
Figure 3 shows that at near-zero electricity CI, MP remains climate-superior only if methane leakage remains below approximately 2%. As electricity CI increases, the allowable leakage threshold increases approximately linearly, reaching ~4% at 350 g CO2e/kWh and ~5.6% at 600 g CO2e/kWh. This structure reflects opposing sensitivities embedded in the benchmark parameterization: MP exhibits higher methane throughput per unit hydrogen and is therefore more sensitive to upstream leakage, whereas ATR + CCS exhibits higher electricity demand and becomes increasingly penalized as grid CI rises.
The resulting map demonstrates that leakage thresholds frequently cited in the literature are not universal constants. Instead, they depend systematically on electricity and CI, and on pathway-specific methane throughput. By explicitly expressing this dependence, the break-even contour reconciles heterogeneous thresholds reported across prior studies within a unified W2G accounting framework, directly addressing methodological comparability concerns.
The decision space shown in Figure 3 is computed under the durable-storage bounding case for the solid-carbon coproduct. If a non-trivial fraction of carbon is later oxidized during end-of-life handling or secondary use, an additional emissions term proportional to the carbon yield and the assumed oxidation fraction would shift the break-even boundary downward, reducing or eliminating the region where MP is climate-superior. Carbon durability should therefore be treated as a necessary condition for MP’s climate advantage at scale rather than an automatic consequence of thermodynamic stability.
Figure 3 is intended as a harmonized screening-level representation. Although benchmark intensities are case-specific, the qualitative structure of the decision space is robust: increasing electricity CI penalizes electricity-intensive pathways, while increasing methane leakage penalizes methane-throughput-intensive pathways. The analytical value of the map lies in systematizing how commonly cited thresholds shift under consistent W2G accounting.

8.2. Cost Competitiveness Map

To complement the CI decision space, an economic parity boundary is constructed under the same harmonized W2G framework introduced in Section 2.2. A transparent screening-LCOH formulation is adopted consistent with standard hydrogen TEA methodology [26], in which each pathway is expressed as the sum of: (i) annualized CAPEX and fixed OPEX terms derived from the selected benchmark studies, (ii) variable energy costs determined by total methane throughput and electricity demand, and (iii) pathway-specific credits or penalties.
For MP, the solid-carbon coproduct is treated explicitly as a revenue stream, proportional to the carbon yield and the market selling price. For ATR + CCS, residual direct emissions and CO2 transport-and-storage costs are incorporated consistent with IEAGHG midpoint assumptions [26]. The same representative benchmark cases used in the CI break-even analysis are retained here [26,48], ensuring methodological consistency between environmental and economic screening results.
Under these assumptions, cost parity is defined by:
L C O H M P = L C O H A T R + C C S
which can be rearranged to express the required carbon coproduct price for parity P C * as a function of natural gas price:
P C * = L C O H M P ,   n o c L C O H A T R + C C S y C
where P C * denotes the break-even carbon selling price required for MP to achieve cost parity with ATR + CCS under the specified benchmark assumptions, L C O H M P ,   n o c is the hydrogen cost from MP excluding carbon revenue, and y C is the carbon yield (ton carbon per kg H2). This expression generalizes the previously discussed carbon-lever sensitivity into a two-dimensional economic parity boundary.
Figure 4 presents the resulting parity curves across a natural gas price range of 3–12 $/MMBtu for three representative ATR + CCS cost levels (2.0, 2.3, and 2.9 $/kg H). Several structural features emerge:
  • Monotonic gas-price sensitivity
Because MP exhibits a higher total methane throughput per unit hydrogen than ATR + CCS, the required carbon price increases approximately linearly with natural gas price. This reflects MP’s greater exposure to feedstock cost volatility.
2.
Dependence on ATR + CCS reference cost
For low ATR + CCS cost cases (e.g., $2.0/kg), MP requires a substantially higher carbon value to achieve parity, exceeding $500–$650/ton C at high gas prices.
For higher ATR + CCS costs (e.g., $2.9/kg), parity can be achieved at considerably lower carbon values, and under low-gas-price conditions, MP may approach parity even without carbon monetization.
3.
Market realism constraint
Regions requiring carbon prices substantially above prevailing bulk carbon black market prices highlight the fragility of business cases reliant on sustained premium nanocarbon pricing. Conversely, regions with moderate carbon values indicate that competitiveness may be driven primarily by energy-market conditions rather than by coproduct speculation.
Negative parity values (mathematically implying MP is already cheaper than the selected ATR + CCS case at zero carbon revenue) are truncated at zero in Figure 4 to avoid implying a negative carbon price requirement.
Importantly, Figure 4 does not claim precise project-level cost prediction. Rather, it systematizes how methane price, ATR + CCS reference cost, and realizable carbon value jointly define the economic operating space of MP under harmonized assumptions. Together with the CI break-even map (Figure 3), the economic parity contour demonstrates that both the environmental and economic superiority of MP are conditional and bounded, addressing prior concerns about the absence of quantitative representation of competitiveness.
Figure 4. Carbon price required for cost parity between MP and ATR + CCS as a function of natural gas price under harmonized W2G assumptions.
Gases 06 00018 g004

9. Commercial Readiness and Investment Risk

9.1. Technology Readiness and Demonstration Status

MP is progressing unevenly across pathways, with commercial readiness concentrated in a small number of plasma-based deployments, while most thermal, catalytic, and molten-media concepts remain at pilot/demonstration scale. Accordingly, TRL should be treated as pathway- and developer-specific, rather than a single value for MP as a whole [8,12,19].
Plasma MP (highest maturity): Plasma routes are frequently cited as the most advanced MP option because they decouple conversion kinetics from catalyst stability and have accumulated the largest operating experience at scale [12,16]. Commercial and near-commercial examples are often highlighted, including Monolith Materials’ carbon-black-focused deployment and other plasma developers targeting hydrogen and solid carbon co-production [5,12,16].
Thermal MP (pilot-to-demo, materials-limited): Non-catalytic thermal concepts face the most stringent temperature and materials constraints, making long-duration operation and reactor durability central scale-up risks [13,19]. Demonstration efforts (e.g., electrically heated moving-bed or related concepts) are typically positioned as intermediate milestones toward larger pilots, but the pathway remains less proven than plasma for continuous, reliable operation [8,12,19].
Catalytic MP (pilot-to-demo, deactivation-limited): Catalytic systems aim to reduce operating temperature but trade this advantage for catalyst deactivation and more complex solids/catalyst handling [13,89]. Several developers report pilot/demonstration activities using fluidized-bed or circulating configurations and low-cost catalysts (e.g., iron-based systems), but long-term stability, controllable carbon morphology, and continuous separation remain the key barriers to bankable scale-up [8,12,86].
Molten metal/salt MP (pilot stage, separations/corrosion-limited): Molten-media reactors offer an elegant mechanism for continuous carbon removal (buoyancy/flotation), yet practical deployment is constrained by corrosion, media management, and carbon purification requirements, especially where product value depends on low ash/metal content [5,21,90,91]. Table 7 summarizes the technology readiness pathway for MP.
From a scale perspective, most reported MP facilities remain in the range of 1–20 ton H2/day, whereas industrial ATR units routinely operate at 100–200 t/day hydrogen capacity under well-to-gate conditions [26]. This gap in the operating scale demonstrated is a central determinant of perceived investment risk. Capital intensity estimates also exhibit greater dispersion for MP. For example, molten-metal systems at ~20 ton/day scale have been reported in the tens of millions USD range [48], whereas large-scale ATR + CCS facilities report more standardized capital intensities on the order of 1100–1400 $/kW (or ~0.50–0.70 $/kg H2 annualized) under mature engineering frameworks [26].

9.2. Deployment Challenges That Drive Scale-Up Risk

Across pathways, the solid carbon co-product is the defining engineering constraint. Unlike SMR/ATR, MP must continuously remove, condition, and store/ship 3 kg of solid carbon per kg H2, making solids management a first-order reliability and cost driver [36,86].
(i)
Continuous carbon removal and fouling control
Carbon accumulation can plug reactors, foul heat-transfer surfaces, and deactivate catalysts. Gas-phase and catalytic systems often require cycling, regeneration, or circulating solids designs to sustain conversion, which increases mechanical complexity and downtime exposure [13,90]. Molten-media concepts mitigate plugging via flotation but still require robust skimming/separation plus downstream capture to prevent entrainment and maintain product quality [5,21].
(ii)
Reactor durability at severe conditions
Many MP reactors operate in regimes where high temperature, hydrogen, and reactive impurities impose corrosion/embrittlement risks and accelerate refractory or component failure. This is especially acute for thermal concepts and molten-media containment and for plasma systems with electrode/torch wear [5,21,36]. These durability uncertainties translate directly into maintenance cost, spare strategy, and availability assumptions used in TEA.
(iii)
Product upgrading, purification, and recycling
Because single-pass conversion is typically <100%, most designs require methane recycle, hydrogen purification, compression, and thermal management. For integration into downstream synthesis (e.g., methanol), additional units are required to adjust syngas composition (RWGS/DMR), increasing utility demand and integration complexity [41,65,66].
(iv)
Carbon quality control and logistics
Marketability depends on consistent morphology and impurity control; contamination from catalysts or molten media can downgrade carbon from a revenue stream to a disposal liability unless additional purification is added [8,21,41]. At this scale, carbon storage, dust management, and transport infrastructure become nontrivial costs and permitting factors.
In contrast, ATR + CCS deployment risk is concentrated less in reactor fundamentals and more in CO2 transport and storage integration, permitting, and long-term liability management. While CCS introduces its own infrastructure dependencies, the core reforming technology benefits from decades of industrial deployment and well-characterized reliability metrics. This asymmetry in operational maturity underpins the differential perceptions of financing risk between MP and ATR + CCS.

9.3. Investor Perspective: What Determines Bankability

From an investment standpoint, MP presents a compelling emissions narrative but concentrates financial risk in a small number of non-traditional variables, most notably carbon co-product monetization. Techno-economic studies consistently show that MP economics are dominated by assumptions about carbon prices, grades, and market access, with small changes in co-product valuation producing large swings in project NPV and levelized costs [41]. As a result, investors and lenders heavily discount business cases that rely on premium CNT or graphite pricing without demonstrated qualification pathways and long-term offtake agreements [21].
Capital expenditure uncertainty remains a second-order constraint, particularly for non-plasma pathways that lack long-term industrial operating data. Elevated contingencies, conservative availability assumptions, and first-of-a-kind penalties are routinely applied in TEA studies, materially increasing financing costs even where modeled LCOH or LCOF values appear competitive [2,8,90].
Energy and feedstock risks further influence bankability. Electrified MP routes require long-term access to low-cost, low-carbon electricity to preserve both emissions credentials and cost competitiveness, while MP’s higher methane intensity in reforming heightens exposure to gas supply quality and certification. These risks are financeable only where they can be contractually mitigated through power purchase agreements and verified low-leakage gas sourcing [5,86].
Finally, policy frameworks play a critical role not as subsidies but as risk-absorbing mechanisms. Production tax credits, carbon pricing, and regulatory recognition of solid carbon permanence can reduce revenue volatility and accelerate investment readiness. In their absence, MP projects remain exposed to market and technology risks that delay final investment decisions despite favorable lifecycle emissions performance [5,13].

10. Roadmap for Commercialization

The transition of MP from pilot-scale demonstrations to a scalable contributor within the global hydrogen and chemicals landscape requires coordinated progress across technology development, market formation, and policy support. Unlike mature reforming routes, MP commercialization is less constrained by reaction chemistry than by uncertainties related to scale-up reliability, solid-carbon utilization, and the coupling between electricity costs, CI, and upstream methane management [86]. Addressing these uncertainties defines a practical roadmap for MP deployment over the next decade.

10.1. Priority Research Needs

A central technical barrier to MP deployment is the lack of standardized, decision-grade data at industrially relevant scales. Progress toward bankable projects requires targeted research that directly reduces scale-up and market risk.

10.1.1. Carbon-Product Quality and Certification

The economic viability of MP depends critically on the ability to produce solid carbon that meets end-user specifications rather than generic classifications such as “carbon black” or “graphitic carbon.” Downstream industries, including tires, batteries, construction materials, and metallurgical applications, require strict control of purity, ash content, particle size distribution, and morphology. Contamination from catalysts or molten media can rapidly downgrade carbon from a revenue stream to a disposal liability. The absence of harmonized QA/QC protocols, application-specific standards, and third-party certification frameworks remains a major obstacle to stable pricing and long-term offtake agreements [13,24,36,41]. Recent reviews further emphasize that systematic links between purification, qualification, and end-use performance remain scarce, reinforcing the need for application-driven certification pathways [92]. Moreover, experimental evidence shows that carbon morphology and textural properties can vary significantly with local temperature even within a single reactor, making uniform product manufacture contingent on rigorous thermal control [93].

10.1.2. Reactor-Scale Reliability and Lifetime Data

Across thermal, catalytic, molten-media, and plasma pathways, long-duration operational data remain limited. Key scale-up uncertainties involve heat and mass transfer, high-throughput solids handling, impurity tolerance in real natural gas streams, and sustained carbon removal without fouling. Catalyst deactivation rates, carbon accumulation dynamics, and materials degradation under continuous high-temperature operation are insufficiently quantified to support conservative availability assumptions used in financing models. Extended pilot campaigns and distributed, industry-relevant unit sizes (e.g., 1–10 ton H2/day) are widely identified as critical intermediate milestones toward commercial deployment [5,19,94].

10.1.3. Catalyst and Materials Development

Catalytic MP pathways require breakthroughs in catalyst stability to mitigate coking and sintering. Carbon filament growth and eventual encapsulating carbon deposition have been shown to govern both catalyst lifetime and regeneration requirements [95], while the complex gas-phase kinetics and soot deposition profiles, modeled with increasing fidelity using CFD and detailed kinetic simulation, remain a barrier to scale-up [9,14]. Furthermore, molten-metal and plasma systems demand corrosion- and embrittlement-resistant materials capable of sustained operation above 1000 °C. Practical industrial operation will also necessitate the development of continuous mechanical or chemical carbon removal systems to prevent reactor fouling [42]. Emerging research on multi-component molten alloys, sintering-resistant supports (including novel biochar-based substrates [96], and data-driven catalyst discovery shows promise but remains largely confined to laboratory or short-duration testing [21,69,89,97].

10.1.4. Stable Production of High-Value Carbon Allotropes

For MP economics to benefit from premium carbon markets, long-term control over carbon morphology, such as carbon black, carbon nanofibers, or nanotubes, is essential. However, recent reviews highlight that most reported CNT and graphitic carbons from MP remain laboratory-scale, batch-produced, or poorly characterized with respect to industrial performance metrics [92,98,99].
While modern structural and morphological analysis is beginning to bridge this gap by providing standardized benchmarking for pyrolytic carbons [90,93], the lack of “off-take” certainty for non-standardized carbon co-products limits immediate revenue certainty. Future research must prioritize the “tunability” of carbon morphology under fluctuating reactor conditions to ensure product consistency for battery, tire, and construction applications.

10.2. Policy Levers and Accounting Frameworks

Techno-economic assessments indicate that early MP competitiveness is highly sensitive to policy design, not as a permanent subsidy, but as a mechanism for risk reduction and market formation.

10.2.1. Carbon Pricing and Permanence Accounting

Carbon pricing mechanisms, including carbon taxes, cap-and-trade systems, and border adjustment measures, internalize the emissions advantage of solid-carbon pathways. Multiple studies indicate that MP can reach cost parity with SMR or ATR equipped with CCS at moderate CO2 abatement values, provided that the permanence of solid carbon is explicitly recognized within regulatory accounting frameworks [53,66]. A critical policy gap is the lack of standardized measurement, reporting, and verification (MRV) protocols for solid carbon sequestration, which currently limits eligibility for carbon credits compared to geological CO2 storage.

10.2.2. Hydrogen Production Incentives

In the United States, the §45V hydrogen production tax credit (up to $3.00/kgH2) materially improves MP project economics when lifecycle CI thresholds are met. However, current LCA methodologies do not explicitly account for MP pathways, thereby creating regulatory uncertainty. Formal inclusion of MP in regulatory frameworks is essential to ensure comparability with blue and green hydrogen routes [24,75].

10.2.3. Access to Low-Carbon Electricity and Methane Control

Electrified MP configurations are economically and environmentally viable only with sustained access to low-cost, low-carbon electricity. Long-term power purchase agreements, renewable energy guarantees, and grid-priority mechanisms are therefore essential complements to hydrogen policy. In parallel, policies supporting methane leak detection and repair are critical to preserving MP’s lifecycle emissions advantage, given its heightened sensitivity to upstream leakage [48,65,100].

10.3. Industry Pathways to Deployment

Commercial adoption of MP is most likely to proceed through integration strategies that minimize infrastructure disruption and concentrate risk within manageable system boundaries.

10.3.1. Hydrogen Plus Bulk Carbon Pathways

Co-location with natural gas processing facilities and pipeline infrastructure enables distributed hydrogen production while avoiding the costs and complexities of transporting and storing hydrogen on a large scale. In this archetype, economic viability relies primarily on bulk carbon outlets, such as carbon black and construction-related applications, rather than premium nanomaterial markets, reducing exposure to market saturation and qualification risk [8,16]. Bulk carbon revenues, even at modest prices, can materially offset hydrogen production costs [53,61]. Accordingly, early projects may prioritize high-capacity outlets over niche, high-purity markets to limit commercialization risk and ensure absorptive capacity for large volumes of carbon flows.

10.3.2. MP Integrated with RWGS or DMR for Syngas and Methanol

Coupling MP with RWGS or DMR enables direct syngas production with tailored H2:CO ratios, positioning MP as a decarbonization option for methanol and other syngas-derived chemicals. Under favorable electricity and CO2 sourcing conditions, such configurations have been reported to achieve net-negative carbon intensities by combining CO2 utilization with solid-carbon sequestration, albeit with higher capital and integration complexity than standalone hydrogen applications [65,66].
Complementary evidence from DMR studies indicates that thermal and plasma-assisted catalytic systems can stably produce syngas streams suitable for downstream methanol synthesis; in some cases, plasma treatment improves coke resistance and operational robustness, supporting the feasibility of integrated methane-to-syngas deployment strategies alongside MP-based routes [101].
Process-level assessments demonstrate that methane decomposition can be integrated with downstream CO and methanol synthesis, achieving high overall efficiency and competitive costs [102]. System-level analyses also emphasize that such integrated methane-conversion architectures improve deployment robustness by distributing economic value across hydrogen and chemical products, rather than relying solely on single-product hydrogen economics [96].

10.3.3. Regional Opportunity Clustering

Early MP deployment is most plausible in regions where feedstock, power, and policy conditions align with the commercialization requirements outlined above. The United States, GCC countries, and selected Asian markets, particularly those seeking to decarbonize existing chemical capacity, are consistently identified as leading candidates for first-wave commercial projects [52,80,86].

11. Conclusions

Methane pyrolysis and its integration with the reverse water–gas shift reaction represent promising intermediate pathways for producing turquoise hydrogen and low-carbon syngas. By converting methane directly into hydrogen and solid carbon, MP avoids the formation of CO2 and reduces dependence on geological carbon storage. However, this intrinsic chemical advantage does not guarantee economic or climate superiority; rather, MP’s industrial viability is conditional upon tightly defined economic, environmental, and infrastructural requirements.
A defining characteristic of MP is its mass balance, producing approximately 3 kg of solid carbon per kg of hydrogen. This “carbon lever” exerts a dominant influence on project economics while simultaneously constituting the principal commercialization bottleneck. In the absence of carbon monetization, MP is generally more expensive than gray hydrogen. Parity with unabated SMR typically requires carbon selling prices exceeding 500 $/ton, while prices of 150–200 $/ton enable competitiveness with blue hydrogen pathways. However, existing global markets for carbon black and specialty carbons (15–20 million tons per year) would be rapidly saturated even under modest MP penetration, indicating that large-scale deployment ultimately depends on the development of bulk, low-value outlets such as construction materials, asphalt fillers, and mineral substitutes. Accordingly, scalability is constrained less by reactor engineering than by the absorptive capacity and durability accounting of carbon markets.
The climate performance of MP is not intrinsic but contingent on system-level parameters across the gas supply chain, electricity sourcing, carbon handling, and process integration. When these parameters align within the constrained decision space identified in this review, MP and MP + RWGS can achieve carbon intensities comparable to or lower than reforming routes with CCS; outside this space, upstream methane leakage and indirect electricity emissions can offset the advantage of solid-carbon formation. This finding underscores that MP should be evaluated within a harmonized well-to-gate framework rather than through isolated process-level comparisons. More broadly, this review reframes MP viability from a reactor-design question to a system-level challenge defined by carbon-market absorption, supply-chain integrity, and boundary-consistent emissions accounting.
Technology readiness varies substantially across MP pathways. Plasma-based MP has reached the highest reported maturity (TRL 8–9), whereas thermal, catalytic, and molten-media concepts remain at pilot-to-demonstration stages (TRL 3–7). Integration with RWGS enables syngas production with tailored H2:CO ratios and offers one of the few routes capable of achieving net-negative methanol carbon intensity, albeit at a present cost premium relative to reforming-based routes.
Overall, MP is unlikely to serve as a universal replacement for reforming technologies but can play an important complementary role in selected niches. Its strategic relevance lies not in displacing reforming globally, but in enabling conditional decarbonization where low-leakage gas supply, low-carbon electricity, credible carbon monetization, and supportive policy frameworks converge. Its most credible contribution lies in targeted industrial clusters where feedstock characteristics, power-system context, infrastructure, and product markets jointly support its deployment. Under such conditions, MP can emerge as a meaningful contributor within a diversified portfolio of low-carbon hydrogen and chemical production pathways.
In practical terms, MP deployment should prioritize regions where supply-chain integrity, power-system decarbonization, and carbon-product utilization strategies are aligned institutionally and technically. Integration with RWGS is particularly well-suited to locations with concentrated CO2 sources and established syngas or methanol infrastructure, where tailored H2:CO ratios and CO2 utilization add value. Long-term competitiveness depends on the development of bulk, low-value carbon outlets rather than on reliance on limited specialty markets, as well as on policy frameworks that recognize the permanence of solid carbon, establish robust MRV protocols, and incorporate MP into hydrogen incentive and carbon-credit mechanisms. Future research should therefore prioritize long-duration operational data, standardized carbon durability certification, and integrated techno-economic emissions modeling to reduce commercialization uncertainty.


Author Contributions

Conceptualization, T.M. and N.E.; methodology, T.M. and R.K.; formal analysis, T.M. and R.K.; writing—original draft preparation, T.M. and R.K.; writing—review and editing, T.M., R.K., L.V. and N.E.; visualization, T.M. and R.K.; supervision, L.V. and N.E.; project administration, T.M. All authors have read and agreed to the published version of the manuscript.

Funding

This research was funded by Texas A&M University at Qatar, Chemical Engineering Program Research Impact Initiative.

Data Availability Statement

All data generated or analyzed during this study are included in this published article. Further inquiries can be directed to the corresponding author.

Acknowledgments

During manuscript preparation, generative AI and large language models were utilized to supplement literature discovery and assist in the thematic categorization of source material. Additionally, AI-based language enhancement software was used to refine the language. All content selection, technical interpretation, and critical conclusions were performed exclusively by the authors. The authors have reviewed and edited all AI-assisted outputs and assume full responsibility for the accuracy, integrity, and originality of the work.

Conflicts of Interest

The authors declare no conflicts of interest.

References

  1. Ferris, A.M.; Biswas, P.; Choudhary, R.; Hanson, R.K. Experimental and Numerical Investigation of Shock Wave-Based Methane Pyrolysis for Clean H2 Production. Shock Waves 2024, 34, 93–107. [Google Scholar] [CrossRef]
  2. Kerscher, F.; Stary, A.; Gleis, S.; Ulrich, A.; Klein, H.; Spliethoff, H. Low-carbon hydrogen production via electron beam plasma methane pyrolysis: Techno-economic analysis and carbon footprint assessment. Int. J. Hydrogen Energy 2021, 46, 19897–19912. [Google Scholar] [CrossRef]
  3. Keuchel, F.; Raveendran, T.; Agar, D.W. Simulation of Chlorine-Mediated Autothermal Methane Pyrolysis for Hydrogen Production. Int. J. Hydrogen Energy 2023, 48, 2949–2958. [Google Scholar] [CrossRef]
  4. IEA Global Hydrogen Review 2025. Available online: https://www.iea.org/reports/global-hydrogen-review-2025 (accessed on 12 August 2025).
  5. Rohani, H.; Sudiiarova, G.; Lyth, S.M.; Badakhsh, A. Recent Advances in Electrified Methane Pyrolysis Technologies for Turquoise Hydrogen Production. Energies 2025, 18, 2393. [Google Scholar] [CrossRef]
  6. Fromm, C. Hydrogen Production via Methane Pyrolysis: An Overview of “Turquoise” H 2 “, Chem Eng (ChemEngOnline). 2023. Available online: https://www.chemengonline.com/fullscreen/hydrogen-production-via-methane-pyrolysis-an-overview-of-turquoise-h2/ (accessed on 17 August 2025).
  7. Lee, D.H. Hydrogen Production via the Kværner Process and Plasma Reforming. In Compendium of Hydrogen Energy: Hydrogen Production and Purification; Elsevier: Amsterdam, The Netherlands, 2015; Volume 1, pp. 349–391. [Google Scholar] [CrossRef]
  8. Moghaddam, A.L.; Hejazi, S.; Fattahi, M.; Kibria, M.G.; Thomson, M.J.; AlEisa, R.; Khan, M.A. Methane pyrolysis for hydrogen production: Navigating the path to a net zero future. Energy Environ. Sci. R. Soc. Chem. 2025, 18, 2747–2790. [Google Scholar] [CrossRef]
  9. Mokashi, M.; Bhimrao Shirsath, A.; Lott, P.; Müller, H.; Tischer, S.; Maier, L.; Deutschmann, O. Understanding of gas-phase methane pyrolysis towards hydrogen and solid carbon with detailed kinetic simulations and experiments. Chem. Eng. J. 2024, 479, 147556. [Google Scholar] [CrossRef]
  10. Dadsetan, M.; Khan, M.F.; Salakhi, M.; Bobicki, E.R.; Thomson, M.J. CO2-free hydrogen production via microwave-driven methane pyrolysis. Int. J. Hydrogen Energy 2023, 48, 14565–14576. [Google Scholar] [CrossRef]
  11. Holmerp, A.; Olsvikb, O.; Rokstad, O.A. Pyrolysis of Natural Gas: Chemistry and Process Concepts. In Fuel Processing Technology; Elsevier: Amsterdam, The Netherlands, 1995. [Google Scholar]
  12. Jensen, R.; van der Eijk, C.; Wærnes, A.N. Production of sustainable hydrogen and carbon for the metallurgical industry. Mater. Proc. 2021, 5, 67. [Google Scholar] [CrossRef]
  13. De Cataldo, A.; Colbertaldo, P.; Beretta, A.; Groppi, G.; Pinilla, J.L.; Suelves, I.; Campanari, S.; Romano, M.C. Blueish hydrogen production via methane pyrolysis and remote CO2 capture and storage. Int. J. Hydrogen Energy 2025, 146, 149723. [Google Scholar] [CrossRef]
  14. Carretta, F.; Pelucchi, S.; Galli, F.; Mocellin, P. Methane pyrolysis for hydrogen production: Modeling of soot deposition by computational fluid dynamics and experimental validation. Chem. Eng. J. 2024, 485, 149844. [Google Scholar] [CrossRef]
  15. Chen, G.; Yu, X.; Ostrikov, K.K.; Liu, B.; Harding, J.; Homm, G.; Guo, H.; Schunk, S.A.; Zhou, Y.; Tu, X.; et al. Methane up-carbonizing: A way towards clean hydrogen energy? Chem. Eng. J. 2023, 476, 146335. [Google Scholar] [CrossRef]
  16. Pangestu, M.R.G.; Ahmed, U.; Park, S.; Zahid, U. Design Development of Integrated Methane Pyrolysis and Reforming Processes for Low-Carbon Urea Production. ACS Sustain. Chem. Eng. 2024, 12, 17488–17501. [Google Scholar] [CrossRef]
  17. International Energy Agency (IEA). The Future of Hydrogen; International Energy Agency: Paris, France, 2019. [Google Scholar]
  18. Abdollahi, M.R.; Nathan, G.J.; Jafarian, M. Process configurations to lower the temperature of methane pyrolysis in a molten metal bath for hydrogen production. Int. J. Hydrogen Energy 2023, 48, 39805–39822. [Google Scholar] [CrossRef]
  19. Schneider, S.; Bajohr, S.; Graf, F.; Kolb, T. State of the Art of Hydrogen Production via Pyrolysis of Natural Gas. ChemBioEng Rev. 2020, 7, 150–158. [Google Scholar] [CrossRef]
  20. Razmi, A.R.; Hanifi, A.R.; Shahbakhti, M. A comparative techno-economic assessment between solar-based hydrogen production by methane pyrolysis and water electrolysis methods. Renew. Energy 2025, 242, 122504. [Google Scholar] [CrossRef]
  21. Patlolla, S.R.; Katsu, K.; Sharafian, A.; Wei, K.; Herrera, O.E.; Mérida, W. A review of methane pyrolysis technologies for hydrogen production. Renew. Sustain. Energy Rev. 2023, 181, 113323. [Google Scholar] [CrossRef]
  22. Wnukowski, M. Methane Pyrolysis with the Use of Plasma: Review of Plasma Reactors and Process Products. Energies 2023, 16, 6441. [Google Scholar] [CrossRef]
  23. Zhang, K.; Huang, Z.; Yang, M.; Liu, M.; Zhou, Y.; Zhan, J.; Zhou, Y. Recent progress in melt pyrolysis: Fabrication and applications of high-value carbon materials from abundant sources. SusMat 2023, 3, 558–580. [Google Scholar] [CrossRef]
  24. Holler, J.; Vine, D. Methane Pyrolysis for Hydrogen Production. Center for Climate and Energy Solutions (C2ES). 2025. Available online: https://www.c2es.org/wp-content/uploads/2025/09/methane-pyrolysis-for-hydrogen-production.pdf (accessed on 7 October 2025).
  25. Grant, M.J.; Booth, A. A typology of reviews: An analysis of 14 review types and associated methodologies. Health Inf. Libr. J. 2009, 26, 91–108. [Google Scholar] [CrossRef] [PubMed]
  26. IEAGHG. Blue Hydrogen: Beyond the Plant Gate, 2022. Available online: https://publications.ieaghg.org/technicalreports/2022-06%20Blue%20Hydrogen%20Beyond%20the%20Plant%20Gate.pdf (accessed on 5 January 2026).
  27. Lewis, E. Comparison of Commercial, State-of-the-Art, Fossil-Based Hydrogen Production Technologies; University of Texas at Austin: Austin, TX, USA, 2022. [Google Scholar]
  28. Puig-Samper, G. Life-cycle assessment of hydrogen systems: A systematic review and meta-regression analysis. J. Clean. Prod. 2024, 470, 143330. [Google Scholar] [CrossRef]
  29. ISO 14040:2006; Environmental Management—Life Cycle Assessment—Principles and Framework. ISO: Geneva, Switzerland, 2006.
  30. Intergovernmental Panel on Climate Change (IPCC). Climate Change 2021: The Physical Science Basis. Contribution of Working Group I to the Sixth Assessment Report of the Intergovernmental Panel on Climate Change; Cambridge University Press: Cambridge, UK; New York, NY, USA, 2021. [Google Scholar]
  31. Howarth, R.W.; Santoro, R.; Ingraffea, A. Methane and the greenhouse-gas footprint of natural gas from shale formations. Clim. Change 2011, 106, 679–690. [Google Scholar] [CrossRef]
  32. Argonne National Laborator. GREET Model (Greenhouse Gases, Regulated Emissions, and Energy Use in Technologies), Version 2022; Argonne National Laborator: Argonne, IL, USA, 2022. Available online: https://greet.anl.gov (accessed on 4 March 2026).
  33. McConnachie, M.; Konarova, M.; Smart, S. Literature review of the catalytic pyrolysis of methane for hydrogen and carbon production. Int. J. Hydrogen Energy 2023, 48, 25660–25682. [Google Scholar] [CrossRef]
  34. Msheik, M.; Rodat, S.; Abanades, S. Methane cracking for hydrogen production: A review of catalytic and molten media pyrolysis. Energies 2021, 14, 3107. [Google Scholar] [CrossRef]
  35. Ji, Y.; Palmer, C.; Foley, E.E.; Giovine, R.; Yoshida, E.; Sebti, E.; Patterson, A.R.; McFarland, E.; Clément, R.J. Valorizing the carbon byproduct of methane pyrolysis in batteries. Carbon 2023, 204, 26–35. [Google Scholar] [CrossRef]
  36. Ingale, G.U.; Park, D.H.; Yang, C.W.; Kwon, H.M.; Wi, T.G.; Park, Y.J.; Kim, S.; Kang, Y.B.; Lim, Y.I.; Kim, S.W.; et al. Low-carbon hydrogen production by molten metal–catalyzed methane pyrolysis: Catalysts, reactor design, and process development. Renew. Sustain. Energy Rev. 2025, 35, 114999. [Google Scholar] [CrossRef]
  37. Lang, Z.; Yanshaozuo, Z.; Shuang, X.; Ganming, C.; Huamei, D. A Mini-Review on Hydrogen and Carbon Production from Methane Pyrolysis by Molten Media. Energy Fuels Am. Chem. Soc. 2024, 38, 23175–23191. [Google Scholar] [CrossRef]
  38. Fincke, J.R.; Anderson, R.P.; Hyde, T.A.; Detering, B.A. Plasma pyrolysis of methane to hydrogen and carbon black. Ind. Eng. Chem. Res. 2002, 41, 1425–1435. [Google Scholar] [CrossRef]
  39. Sánchez-Bastardo, N.; Schlögl, R.; Ruland, H. Methane Pyrolysis for Zero-Emission Hydrogen Production: A Potential Bridge Technology from Fossil Fuels to a Renewable and Sustainable Hydrogen Economy. Ind. Eng. Chem. Res. 2021, 60, 11855–11881. [Google Scholar] [CrossRef]
  40. Alghfeli, A.; Xu, H.; Heronimus, B.T.; Jeevaretanam, B.; Spearrin, R.M.; Fisher, T.S. Methane pyrolysis by Joule heating for graphitic carbon and hydrogen production. iScience 2025, 28, 113546. [Google Scholar] [CrossRef]
  41. Nikolis, D.; Patzschke, C.F.; Nabizade, F.; Tan, T.; Raman, S.; Hellgardt, K. Methane pyrolysis for H2 production in molten salts: Simulation of the reaction, transport phenomena and the industrial scale process. Chem. Eng. J. 2025, 524, 168104. [Google Scholar] [CrossRef]
  42. Becker, T.; Richter, M.; Agar, D.W. Methane pyrolysis: Kinetic studies and mechanical removal of carbon deposits in reactors of different materials. Int. J. Hydrogen Energy 2023, 48, 2112–2129. [Google Scholar] [CrossRef]
  43. Neuschitzer, D.; Scheiblehner, D.; Antrekowitsch, H.; Wibner, S.; Sprung, A. Methane Pyrolysis in a Liquid Metal Bubble Column Reactor for CO2-Free Production of Hydrogen. Energies 2023, 16, 7058. [Google Scholar] [CrossRef]
  44. Abuseada, M.; Spearrin, R.M.; Fisher, T.S. Influence of process parameters on direct solar-thermal hydrogen and graphite production via methane pyrolysis. Int. J. Hydrogen Energy 2023, 48, 30323–30338. [Google Scholar] [CrossRef]
  45. Sun, E.; Zhai, S.; Kim, D.; Gigantino, M.; Haribal, V.; Dewey, O.S.; Williams, S.M.; Wan, G.; Nelson, A.; Marin-Quiros, S.; et al. A semi-continuous process for co-production of CO2-free hydrogen and carbon nanotubes via methane pyrolysis. Cell Rep. Phys. Sci. 2023, 4, 101338. [Google Scholar] [CrossRef]
  46. Moreno-Couranjou, M.; Monthioux, M.; Gonzalez-Aguilar, J.; Fulcheri, L. A non-thermal plasma process for the gas phase synthesis of carbon nanoparticles. Carbon 2009, 47, 2310–2321. [Google Scholar] [CrossRef]
  47. Daghagheleh, O.; Schenk, J.; Zarl, M.A.; Lehner, M.; Farkas, M.; Zheng, H. Feasibility of a Plasma Furnace for Methane Pyrolysis: Hydrogen and Carbon Production. Energies 2024, 17, 167. [Google Scholar] [CrossRef]
  48. Shokrollahi, M.; Teymouri, N.; Ashrafi, O.; Navarri, P.; Khojasteh-Salkuyeh, Y. Methane pyrolysis as a potential game changer for hydrogen economy: Techno-economic assessment and GHG emissions. Int. J. Hydrogen Energy 2024, 66, 337–353. [Google Scholar] [CrossRef]
  49. Zong, Z.; Koers, N.; Cai, G.; Upham, D.C. CO2-to-methanol: Economic and environmental comparison of emerging and established technologies with dry reforming and methane pyrolysis. Chem. Eng. J. 2024, 487, 150274. [Google Scholar] [CrossRef]
  50. Gautier, M.; Rohani, V.; Fulcheri, L. Direct decarbonization of methane by thermal plasma for the production of hydrogen and high value-added carbon black. Int. J. Hydrogen Energy 2017, 42, 28140–28156. [Google Scholar] [CrossRef]
  51. Chan, Y.H.; Chan, Z.P.; Lock, S.S.M.; Yiin, C.L.; Foong, S.Y.; Wong, M.K.; Ishak, M.A.; Quek, V.C.; Ge, S.; Lam, S.S. Thermal pyrolysis conversion of methane to hydrogen (H2): A review on process parameters, reaction kinetics and techno-economic analysis. Chin. Chem. Lett. 2024, 35, 109329. [Google Scholar] [CrossRef]
  52. Çelik, A.; Ben Othman, I.; Neudeck, Y.; Deutschmann, O.; Lott, P. A techno-economic assessment of pyrolysis processes for carbon capture, hydrogen and syngas production from variable methane sources: Comparison with steam reforming, water electrolysis, and coal gasification. Energy Convers. Manag. 2025, 326, 119414. [Google Scholar] [CrossRef]
  53. Parkinson, B.; Matthews, J.W.; McConnaughy, T.B.; Upham, D.C.; McFarland, E.W. Techno-Economic Analysis of Methane Pyrolysis in Molten Metals: Decarbonizing Natural Gas. Chem. Eng. Technol. 2017, 40, 1022–1030. [Google Scholar] [CrossRef]
  54. Arias, C. Methane Pyrolysis Evaluation for Low-Carbon Hydrogen Production: A Comparative Techno-Economic Analysis. Master’s Thesis, KTH Royal Institute of Technology, Stockholm, Sweden, 2019. [Google Scholar]
  55. Tamarona, P.B.; Nijssen, T.M.J.; Vlugt, T.J.H.; Ramdin, M. Techno-economic analysis of catalytic methane pyrolysis in a fluidized bed reactor with reactor-scale catalyst deactivation modeling. Chem. Eng. J. 2025, 522, 167134. [Google Scholar] [CrossRef]
  56. Tabat, M.E.; Omoarukhe, F.O.; Güleç, F.; Adeniyi, D.E.; Mukherjee, A.; Okoye, P.U.; Ogbaga, C.C.; Epelle, E.I.; Akande, O.; Okolie, J.A. Process design, exergy, and economic assessment of a conceptual mobile autothermal methane pyrolysis unit for onsite hydrogen production. Energy Convers. Manag. 2023, 278, 116707. [Google Scholar] [CrossRef]
  57. Pruvost, F.; Cloete, S.; Hendrik Cloete, J.; Dhoke, C.; Zaabout, A. Techno-Economic assessment of natural gas pyrolysis in molten salts. Energy Convers. Manag. 2022, 253, 115187. [Google Scholar] [CrossRef]
  58. Razmi, A.R.; Hanifi, A.R.; Shahbakhti, M. Techno-economic analysis of a novel concept for the combination of methane pyrolysis in molten salt with heliostat solar field. Energy 2024, 301, 131644. [Google Scholar] [CrossRef]
  59. Cheon, S.; Byun, M.; Lim, D.; Lee, H.; Lim, H. Parametric study for thermal and catalytic methane pyrolysis for hydrogen production: Techno-economic and scenario analysis. Energies 2021, 14, 131644. [Google Scholar] [CrossRef]
  60. Raoo, S.; Bella; Chang, J.; Chen, L.; Halim, I.; Kawi, S. Techno-Economic Evaluation of Palladium-Membrane Reactors for Industrial-Scale Methane Pyrolysis. Ind. Eng. Chem. Res. 2025, 64, 19614–19623. [Google Scholar] [CrossRef]
  61. Riley, J.; Atallah, C.; Siriwardane, R.; Stevens, R. Technoeconomic analysis for hydrogen and carbon Co-Production via catalytic pyrolysis of methane. Int. J. Hydrogen Energy 2021, 46, 20338–20358. [Google Scholar] [CrossRef]
  62. Aminaho, E.N.; Aminaho, N.S.; Aminaho, F. Techno-economic assessments of electrolyzers for hydrogen production. Appl. Energy 2025, 399, 126515. [Google Scholar] [CrossRef]
  63. Serrato, C.; Rowe, A. Cost and Emissions Intensity of Hydrogen from Thermal Pyrolysis of Natural Gas in BC; Institute for Integrated Energy Systems, University of Victoria: Victoria, BC, Canada, 2025. [Google Scholar]
  64. Timmerberg, S.; Kaltschmitt, M.; Finkbeiner, M. Hydrogen and hydrogen-derived fuels through methane decomposition of natural gas—GHG emissions and costs. Energy Convers. Manag. X 2020, 7, 100043. [Google Scholar] [CrossRef]
  65. Khawaja, R.; Musa, T.; Challiwala, M.S.; El-Halwagi, M.M.; Elbashir, N.O. Decarbonizing methanol synthesis via low-carbon hydrogen: Process simulation and techno-economic insights. Front. Chem. Eng. 2025, 7, 1717905. [Google Scholar] [CrossRef]
  66. Zong, Z.; Cai, G.; Tabbara, M.; Chester Upham, D. CO2-negative fuel production using low-CO2 electricity: Syngas from a combination of methane pyrolysis and dry reforming with techno-economic analysis. Energy Convers. Manag. 2023, 277, 116624. [Google Scholar] [CrossRef]
  67. Kang, H.; Oh, J.H.; Lee, Y.H.; Yang, S.; Choi, S. Study on the Value-Added Carbon Products from Methane Pyrolysis with the Thermal Plasma Process. Appl. Sci. Converg. Technol. 2024, 33, 13–17. [Google Scholar] [CrossRef]
  68. Zhu, Y. Methane Pyrolysis or SMR with CCS? Master’s Thesis, Delft University of Technology, Delft, The Netherlands, 2023. [Google Scholar]
  69. Dagle, R.; Dagle, V.; Bearden, M.; Holladay, J.; Krause, T.; Ahmed, S. An Overview of Natural Gas Conversion Technologies for Co-Production of Hydrogen and Value-Added Solid Carbon Products. 2017. Available online: https://www.congress.gov/114/crpt/srpt236/CRPT-114srpt236.pdf (accessed on 5 December 2025).
  70. Meidl, R.A.; Medlock, K.B. The Advanced Carbon Economy: A Sustainable Hydrogen Pathway; Rice University Baker Institute for Public Policy: Houston, TX, USA, 2021. [Google Scholar]
  71. Peden, J.; Ryley, J.; Terrones, J.; Smail, F.; Elliott, J.A.; Windle, A.; Boies, A. Production of hydrogen and carbon nanotubes from methane using a multi-pass floating catalyst chemical vapour deposition reactor with process gas recycling. Nat. Energy 2025, 11, 121–134. [Google Scholar] [CrossRef]
  72. Dagle, R.A. Methane Pyrolysis for CO2-Free H2 and Carbon Nanomaterials. 2022. Available online: https://www.pnnl.gov/main/publications/external/technical_reports/PNNL-33677.pdf (accessed on 16 October 2025).
  73. Perreault, P.; Boruntea, C.R.; Dhawan Yadav, H.; Portela Soliño, I.; Kummamuru, N.B. Combined Methane Pyrolysis and Solid Carbon Gasification for Electrified CO2-Free Hydrogen and Syngas Production. Energies 2023, 16, 7316. [Google Scholar] [CrossRef]
  74. Acworth, W.; Kardish, C.; Kellner, K. Carbon Leakage and Deep Decarbonization: Future-Proofing Carbon Leakage Protection; International Emissions Trading Association (IETA): Geneva, Switzerland, 2020. [Google Scholar]
  75. Demordaunt, A.; Sharma, S.; Stypula, M.; Charlton, C.; Lin, S.S. Market Analysis: Upcycling Natural Gas into Solid Carbon Products; Lux Research: Boston, MA, USA, 2021. [Google Scholar]
  76. Su, X.; Liao, J.; Luo, X.; Ouyang, X.; Wei, J.; Gou, F. The Investigation of Methane Pyrolysis and Its Carbon Products Utilizing Molten Metal/Molten Salt Composite Reactors. Processes 2025, 13, 3549. [Google Scholar] [CrossRef]
  77. Ataya, Z.; Challiwala, M.; Ibrahim, G.; Choudhury, H.A.; El-Halwagi, M.M.; Elbashir, N.O. Decarbonizing the Gas-to-Liquid (GTL) Process Using an Advanced Reforming of Methane Process. ACS Eng. Au 2024, 4, 99–111. [Google Scholar] [CrossRef]
  78. Abdelkarim, Y.; Musa, T.; Challiwala, M.S.; Katbeh, T.; Choudhury, H.; El-Halwagi, M.; Elbashir, N.O. Retrofitting Low Carbon Aviation Fuels Processes from Natural Gas to Renewables Energy-Based Systems. Greenh. Gases Sci. Technol. 2025, 15, 601–614. [Google Scholar] [CrossRef]
  79. Musa, T.; Mahmoud, N.; Challiwala, M.S.; Mohamed, E.; Choudhury, H.; Elbashir, N.O. Decarbonizing ammonia synthesis plants through retrofitting novel reformer technology. Sci. Rep. 2026, 16, 661. [Google Scholar] [CrossRef] [PubMed]
  80. Angikath, F.; Abdulrahman, F.; Yousry, A.; Das, R.; Saxena, S.; Behar, O.; Alhamed, H.; Altmann, T.; Dally, B.; Sarathy, S.M. Technoeconomic assessment of hydrogen production from natural gas pyrolysis in molten bubble column reactors. Int. J. Hydrogen Energy 2024, 49, 246–262. [Google Scholar] [CrossRef]
  81. Goita, E.G.; Beagle, E.A.; Nasta, A.N.; Wissmiller, D.L.; Ravikumar, A.; Webber, M.E. Effect of hydrogen leakage on the life cycle climate impacts of hydrogen supply chains. Commun. Earth Environ. 2025, 6, 160. [Google Scholar] [CrossRef]
  82. Elgowainy, A.; Vyawahare, P.; Ng, C.; Frank, E.D.; Bafana, A.; Burnham, A.; Sun, P.; Cai, H.; Lee, U.; Reddi, K.; et al. Environmental life-cycle analysis of hydrogen technology pathways in the United States. Front. Energy Res. 2024, 12, 1473383. [Google Scholar] [CrossRef]
  83. Olsson, O.; Abdalla, N.; Bürck, S.; Fehrenbach, H. Carbon Accounting Across Bio-CCUS Supply Chains: Identifying Key Issues for Science and Policy; Öko-Institut e.V.: Freiburg, Germany, 2022. [Google Scholar]
  84. Lott, P.; Mokashi, M.B.; Müller, H.; Heitlinger, D.J.; Lichtenberg, S.; Shirsath, A.B.; Janzer, C.; Tischer, S.; Maier, L.; Deutschmann, O. Hydrogen Production and Carbon Capture by Gas-Phase Methane Pyrolysis: A Feasibility Study. ChemSusChem 2023, 16, e202201720. [Google Scholar] [CrossRef] [PubMed]
  85. Hannouf, M.B.; Gates, T.; Assefa, G.; Gates, I. Advancing hydrogen sustainability in Alberta: Life cycle sustainability assessment of hydrogen production pathways. J. Clean. Prod. 2025, 530, 146850. [Google Scholar] [CrossRef]
  86. Pangestu, M.R.G.; Malaibari, Z.; Muhammad, A.; Al-Rowaili, F.N.; Zahid, U. Comprehensive Review on Methane Pyrolysis for Sustainable Hydrogen Production. Energy Fuels 2024, 38, 13514–13538. [Google Scholar] [CrossRef]
  87. Vallejo, V.; Nguyen, Q.; Ravikumar, A.P. Geospatial variation in carbon accounting of hydrogen production and implications for the US Inflation Reduction Act. Nat. Energy 2024, 9, 1571–1582. [Google Scholar] [CrossRef]
  88. Greenhouse Gas Protocol. IPCC Global Warming Potential Values. 2024. Available online: https://www.ipcc.ch/site/assets/uploads/2018/05/ar4-wg1-errata.pdf (accessed on 12 January 2026).
  89. Pachatouridou, E.; Zeza, E.; Lappas, A.; Iliopoulou, E. Study of Co/γ-Al2O3 and Fe/γ-Al2O3 materials for catalytic methane pyrolysis to CO2-free hydrogen. Int. J. Hydrogen Energy 2025, 101, 785–796. [Google Scholar] [CrossRef]
  90. Nikolis, D.; Suthanaruk, T.; Amnauypanit, K.; Raman, S.; Burns, A.B.; Hellgardt, K. Comprehensive characterization of pyrolytic carbons from diverse methane pyrolysis processes: A comparative study. Carbon Trends 2025, 21, 100583. [Google Scholar] [CrossRef]
  91. Kudinov, I.V.; Velikanova, Y.V.; Nenashev, M.V.; Amirov, T.F.; Pimenov, A.A. Methane Pyrolysis in Molten Media for Hydrogen Production: A Review of Current Advances. Pet. Chem. 2023, 63, 1017–1026. [Google Scholar] [CrossRef]
  92. Prabowo, J.; Lai, L.; Chivers, B.; Burke, D.; Dinh, A.H.; Ye, L.; Wang, Y.; Wang, Y.; Wei, L.; Chen, Y. Solid Carbon Co-Products from Hydrogen Production by Methane Pyrolysis: Current Understandings and Recent Progress. Carbon N. Y. 2024, 216, 118507. [Google Scholar] [CrossRef]
  93. Wojtasik, M.; Krasodomski, W.; Żak, G.; Wojtasik, K.; Pakieła, W. Morphological and Structural Analysis of Pyrolytic Carbon from Simple Thermal Methane Pyrolysis. Appl. Sci. 2025, 15, 10742. [Google Scholar] [CrossRef]
  94. Moghaddam, A.L.; Hejazi, S.; Fattahi, M.; Kibria, M.G.; Khan, M.A. Molten metal methane pyrolysis for distributed hydrogen production: Reactor design, hydrodynamics, and technoeconomic insights. Chem. Eng. J. 2025, 524, 169812. [Google Scholar] [CrossRef]
  95. Abdel-Fatah, M.A.; Amin, A. Catalyst deactivation and regeneration during methane catalytic cracking over supported nickel catalysts. Int. J. Hydrogen Energy 2025, 137, 236–246. [Google Scholar] [CrossRef]
  96. Mandal, S.; Kumar, S.; Kumar, N.; Wakudkar, H.; Meena, B.S.; Gangil, S.; Kumar, R. Structure and morphology of carbon nano-tubes formed on Ni and Fe−impregnated sawdust biochar during methane pyrolysis. Int. J. Hydrogen Energy 2026, 201, 152956. [Google Scholar] [CrossRef]
  97. Chen, Y.; Huang, X.; He, Y.; Liu, Q.; Du, J.; Yang, W.; Wang, W.; Zhang, D.; Jia, X.; Wang, H.; et al. Data-Driven Strategies for Designing Multicomponent Molten Catalysts to Accelerate the Industrialization of Methane Pyrolysis. ACS Catal. 2025, 15, 11003–11012. [Google Scholar] [CrossRef]
  98. Shen, J.; Olfert, J.; Abbasi-Atibeh, E.; Semagina, N. The effect of catalyst particle size and temperature on CNT growth on supported Fe catalysts during methane pyrolysis. Catal. Today 2025, 453, 115275. [Google Scholar] [CrossRef]
  99. d’Entremont, S.; Miederhoff, N.; Buraimoh, M.; Bi, X.; Upham, D.C. Dynamic Molten Cu–In Droplets Catalyze Selective Synthesis of Multi-Walled Carbon Nanotubes During Methane Pyrolysis. ChemCatChem 2025, 17, e01125. [Google Scholar] [CrossRef]
  100. Boretti, A. Advances in sustainable turquoise hydrogen production via methane pyrolysis in molten metals. Clean. Chem. Eng. 2025, 11, 100139. [Google Scholar] [CrossRef]
  101. Delikonstantis, E.; Scapinello, M.; Stefanidis, G.D. Investigating the plasma-assisted and thermal catalytic dry methane reforming for syngas production: Process design, simulation and evaluation. Energies 2017, 10, 1429. [Google Scholar] [CrossRef]
  102. Pandey, A.; Ayubkhan, F.P.; Mylipilli, N.; Thotakura, A.; Khallaghi, N. Methanol and carbon monoxide co-production via methane decomposition: Techno-economic and environmental analysis. Sustain. Energy Fuels 2025, 9, 4923–4932. [Google Scholar] [CrossRef]
Figure 1. Carbon lever effects on the levelized cost of hydrogen from methane pyrolysis (indicative ranges compiled from multiple studies).
Gases 06 00018 g001
Figure 2. Conceptual emissions-relevant integration of MP and RWGS for low-carbon syngas production.
Gases 06 00018 g002
Figure 3. Break-even methane leakage as a function of electricity CI under harmonized well-to-gate assumptions (MP vs. ATR + CCS).
Gases 06 00018 g003
Table 1. Commercialization-oriented comparison of methane pyrolysis pathways.
PathwayMain AdvantageMain LimitationBest-Fit Niche
Thermal MPSimple chemistry; no catalyst cost; potential for large-scale continuous operationVery high temperature requirement; materials durability; foulingRegions with low-cost, high-temperature heat and bulk carbon outlets
Catalytic MPLower temperature than thermal MP; potential carbon morphology controlCatalyst deactivation; regeneration cost; solids handlingSmall-to-medium scale H2 with specialty carbon co-products
Molten-media MPContinuous carbon separation; mitigates cloggingCorrosion; molten media management; carbon purificationDemonstration plants prioritizing operability
Plasma MPModular; fast start-up; compatible with renewable electricityHigh electricity demand; power price dominates economicsRegions with abundant low-cost, low-CI electricity
MP + RWGSTunable syngas; enables methanol-grade H2/CO; CO2 utilizationHigh energy intensity; added CAPEXLow-carbon methanol and e-fuels under carbon pricing
Table 2. Economic drivers of MP by technology pathway.
MP PathwayPrimary CAPEX DriversPrimary OPEX DriversKey Sources
Thermal MPHigh-temperature materials (high-alloy steel, SiC, quartz); refractory linings (e.g., MgO–C, ≤1600 °C); large reactor volumesNatural gas feedstock (≈60–66% of costs); fuel/electricity for extreme heat; refractory and high-temperature maintenance[8,51,52,53,54]
Catalytic MPCatalyst feeding/extraction systems; fluidized- or transport-bed reactors; regeneration units for coking controlCatalyst makeup/replacement (24–25% of OPEX); solids handling and catalyst–carbon separation; feedstock costs[8,54,55,56]
Molten MP (Metal/Salt)Molten media inventory (Sn, Bi, KCl); corrosion-resistant vessels (e.g., Ni alloys); recirculation pumps and bubble columnsMedia loss/makeup from carbon contamination; heat-maintenance energy; salt removal/washing and quenching[8,21,57]
Plasma MPPlasma torches or electron-beam accelerators; power electronics; gas compression for H2 recycleHigh electricity demand; electrode wear/replacement; inert or recycled plasma gas supply[2,8,48]
Table 3. Reported LCOH ranges and key techno-economic assumptions for MP.
TechnologyLCOH Range ($/kg H2)NG Price ($/MMBtu)Electricity Price ($/MWh)Carbon ValueScale/CapacitySource
Thermal (Tubular PFR)2.50–3.273.764.51188 $/t50 t H2/day[54]
Molten metal and thermal plasma2.92–4.89 (base)6.360200 $/t20–200 t H2/day[48]
Catalytic (fluidized bed)3.89–4.7910.51001000 $/t100 t H2/day[55]
Molten salt + solar heliostat1.25–1.936.330 (off-peak)300 $/t9 t H2/day[58]
Electron-beam plasma2.55–5.002.960100 $/t216 t H2/day[2]
Molten salt (KCl/MnCl2)2.38–2.626.860 165 $/t60 t H2/day[57] *
Thermal and catalytic2.14–3.825.256500 $/t2.6 t H2/day[59]
Pd-membrane reactor3.384.0Grid prices36 t H2/day[60] **
Mobile microwave plasma1.30–1.47Local marketAutothermal2.65 t H2/day[56] ***
* Values initially reported in euros. converted using 1 € = 1.10 $, ** No carbon recovery, *** Carbon is combusted for heat.
Table 4. Global carbon product markets and implications for MP scalability.
Product ClassApprox. Global Market VolumeTypical Price Range ($/t)Implications for MP Deployment
Carbon black14–16 Mt/yr400–2000Only realistic bulk outlet; requires specific quality; market saturates at ~5% H2 penetration.
Synthetic graphite<2 Mt/yr>10,000High value (battery-grade) but tightly specified; volume-limited; negligible impact on the global H2 scale.
Carbon fiber0.2–0.3 Mt/yr5000–20,000High-value niche; negligible absorptive capacity relative to MP carbon byproduct streams.
CNTs/nanocarbons<0.02 Mt/yr50,000–100,000 Specialty/R&D only; economically attractive per unit but irrelevant for system-level decarbonization.
Bulk Outlets (construction/asphalt)>1–10 Gt/yr 0–100Sufficient scale for total H2 economy; low unit value shifts economic burden heavily onto H2 sales.
Notes: Market volumes and price ranges are from [24,68,70,75]. Product usability depends on meeting purity and contamination specifications. Key implication: Only carbon black and low-value bulk outlets offer large-scale absorptive capacity; other carbon products are high-value but volume-limited.
Table 5. Published CI results for hydrogen (GWP100 basis as reported), classified by system boundary and methodological assumptions.
PathwayMethane Leakage (%)Electricity CI (gCO2e/kWh)Carbon TreatmentCI (kg CO2e/kg H2)Source
Well-to-gate (W2G)
Thermal (PY/DMR)1.512.9CO2 sink credit−0.2 to −0.4[66]
Thermal plasma0.360Durable solid0.42[24]
Thermal plasma2.30Durable solid2.68[24]
Cradle-to-gate (C2G)
Molten metal 0.3661.3Durable solid≈1.5[48]
Electron-beam plasmaNot reported60Durable solid1.9–6.4[2]
Thermal MPNot reported364Durable solid6.72[52]
Thermal MPNot reported0Durable solid2.07[52]
Thermal (natural gas heated)Not reportedLowLandfill disposal4.14[54]
Thermal + CCS unitNot reportedLowGeological CO2 storage0.03[54]
Thermal (electric arc)Not reportedLowLandfill disposal0.12[54]
Gate-to-gate (G2G)
Catalytic (FBR)N/A 286Durable solid 1.83–2.78[55]
Table 6. Published CI results for methanol and ammonia on product-specific functional units.
PathwayBoundaryProductFunctional UnitCISource
MP + RWGSGate-to-gateMethanolkg CO2e/kg MeOH−0.57[65]
Integrated SMR + MP (90%)Scope 1/G2GAmmoniat CO2e/t NH30.23[86]
SMR base caseScope 1/G2GAmmoniat CO2e/t NH31.30[86]
Note: Values reflect original study assumptions and are not directly comparable across boundary groups.
Table 7. Technology readiness of MP pathways.
MP PathwayTypical Demonstrated ScaleTRL Range *Evidence BasisDominant Scale-Up Constraint
Plasma MPCommercial carbon black + H2 (single operator)8–9Industrial operation; peer-reviewed assessmentsElectricity cost; electrode wear
Thermal MPPilot/early demonstration5–6Pilot plants; test facilitiesHigh-temperature materials durability
Catalytic MPPilot/demonstration5–7Demo plants; fluidized bedsCatalyst deactivation; solids handling
Molten metal/salt MPLaboratory → pilot3–5Experimental studies; early pilotsCorrosion; carbon purification
* TRL values represent reported or literature-inferred ranges and vary by developer.
Disclaimer/Publisher’s Note: The statements, opinions and data contained in all publications are solely those of the individual author(s) and contributor(s) and not of MDPI and/or the editor(s). MDPI and/or the editor(s) disclaim responsibility for any injury to people or property resulting from any ideas, methods, instructions or products referred to in the content.