Article

Soot Particle Emissions: Formation and Suppression Mechanisms in Gas Turbines

by
Matthieu Vierling
1,*,
Maher Aboujaib
1,
Richard Denolle
2,
Jean-François Brilhac
3 and
Michel Molière
4,*
1
GE Vernova, 20 Avenue du Maréchal Juin, BP 379, 90007 Belfort Cedex, France
2
Katalis, 16 Montée de la Chapelle, 13260 Cassis, France
3
LGRE UR 2334 UHA, Université de Haute-Alsace, 3bis Rue A. Werner, 68093 Mulhouse, France
4
Institut Carnot de Bourgogne-Université de Technologie de Belfort Montbéliard (ICB-UTBM), 90000 Belfort, France
*
Authors to whom correspondence should be addressed.
Gases 2024, 4(4), 446-467; https://doi.org/10.3390/gases4040023
Submission received: 10 October 2024 / Revised: 8 November 2024 / Accepted: 18 November 2024 / Published: 26 November 2024

Abstract

:
This article reports on field tests devoted to the emissions of particles from gas turbines (GT) and more particularly to the formation of soot and its suppression by fuel additives. These field tests involved four heavy-duty gas turbines used as power generators and equipped with air atomization systems. These machines were running on natural gas, No. 2 distillate oil, heavy crude oil and heavy fuel oil, respectively. The GT running on natural gas produced no soot or ash and its upstream air filtration system in fact allowed lower concentrations of exhaust particles than those found in ambient air. Soot emitted when burning the three liquid fuels (No. 2 distillate; heavy crude oil; and heavy oil) was effectively reduced using fuel additives based on iron(III), cerium(III) and cerium(IV). Cerium was found to be very effective as a soot suppressant and gave rise to two surprising effects: cerium(III) performed better than cerium(IV) and a “memory effect” was observed in the presence of heat recovery boilers due to the deposition of active cerium species. All of the reported results, both regarding natural gas emissions and soot reduction, are original. A review of the soot formation mechanisms and a detailed interpretation of the test results are provided.

1. Introduction

Hydrocarbon flames generate gaseous emissions and variable quantities of solid particles in the form of soot and possibly ash. These particles then evolve into “particulate matter” (PM) during their subsequent transport and their stay in the atmosphere. As PM is harmful to health and deleterious to the environment, it is subject to increasingly stringent regulations. In the EU, for example, large combustion plants must comply with the recommendations of the BREF (“Best Available Techniques Reference Document”), which currently stipulates a particulate emission limit of 5 mg/Nm3 at 15% O2 for gas turbines burning liquid fuels [1].
This article reports on four PM measurement campaigns carried out by GE Vernova on stationary gas turbines burning four categories of fuels: (i) a commercial natural gas; (ii) a No. 2 standard distillate oil; (iii) a heavy crude oil; and (iv) a heavy fuel oil. During the tests on liquid fuels, the performances of three anti-soot additives based on organometallic iron (III), cerium (III) and cerium (IV) were evaluated.
In addition to the particle measurement results, this article tentatively covers the mechanisms of soot formation as well as its suppression by the three additives.
The remarkable behavior of cerium and its great anti-soot efficiency led us to closely analyze the reactions developed by cerium oxide (CeO2) and to propose a soot reduction mechanism.
The following section contains necessary reminders regarding terminology and essential aspects of particulate emissions, including (i) basic aspects of gas turbine technology; (ii) definitions and metrology of particulate matter (PM) and filterable particles (FPs); and (iii) particle abatement techniques.

2. Technical Reminders

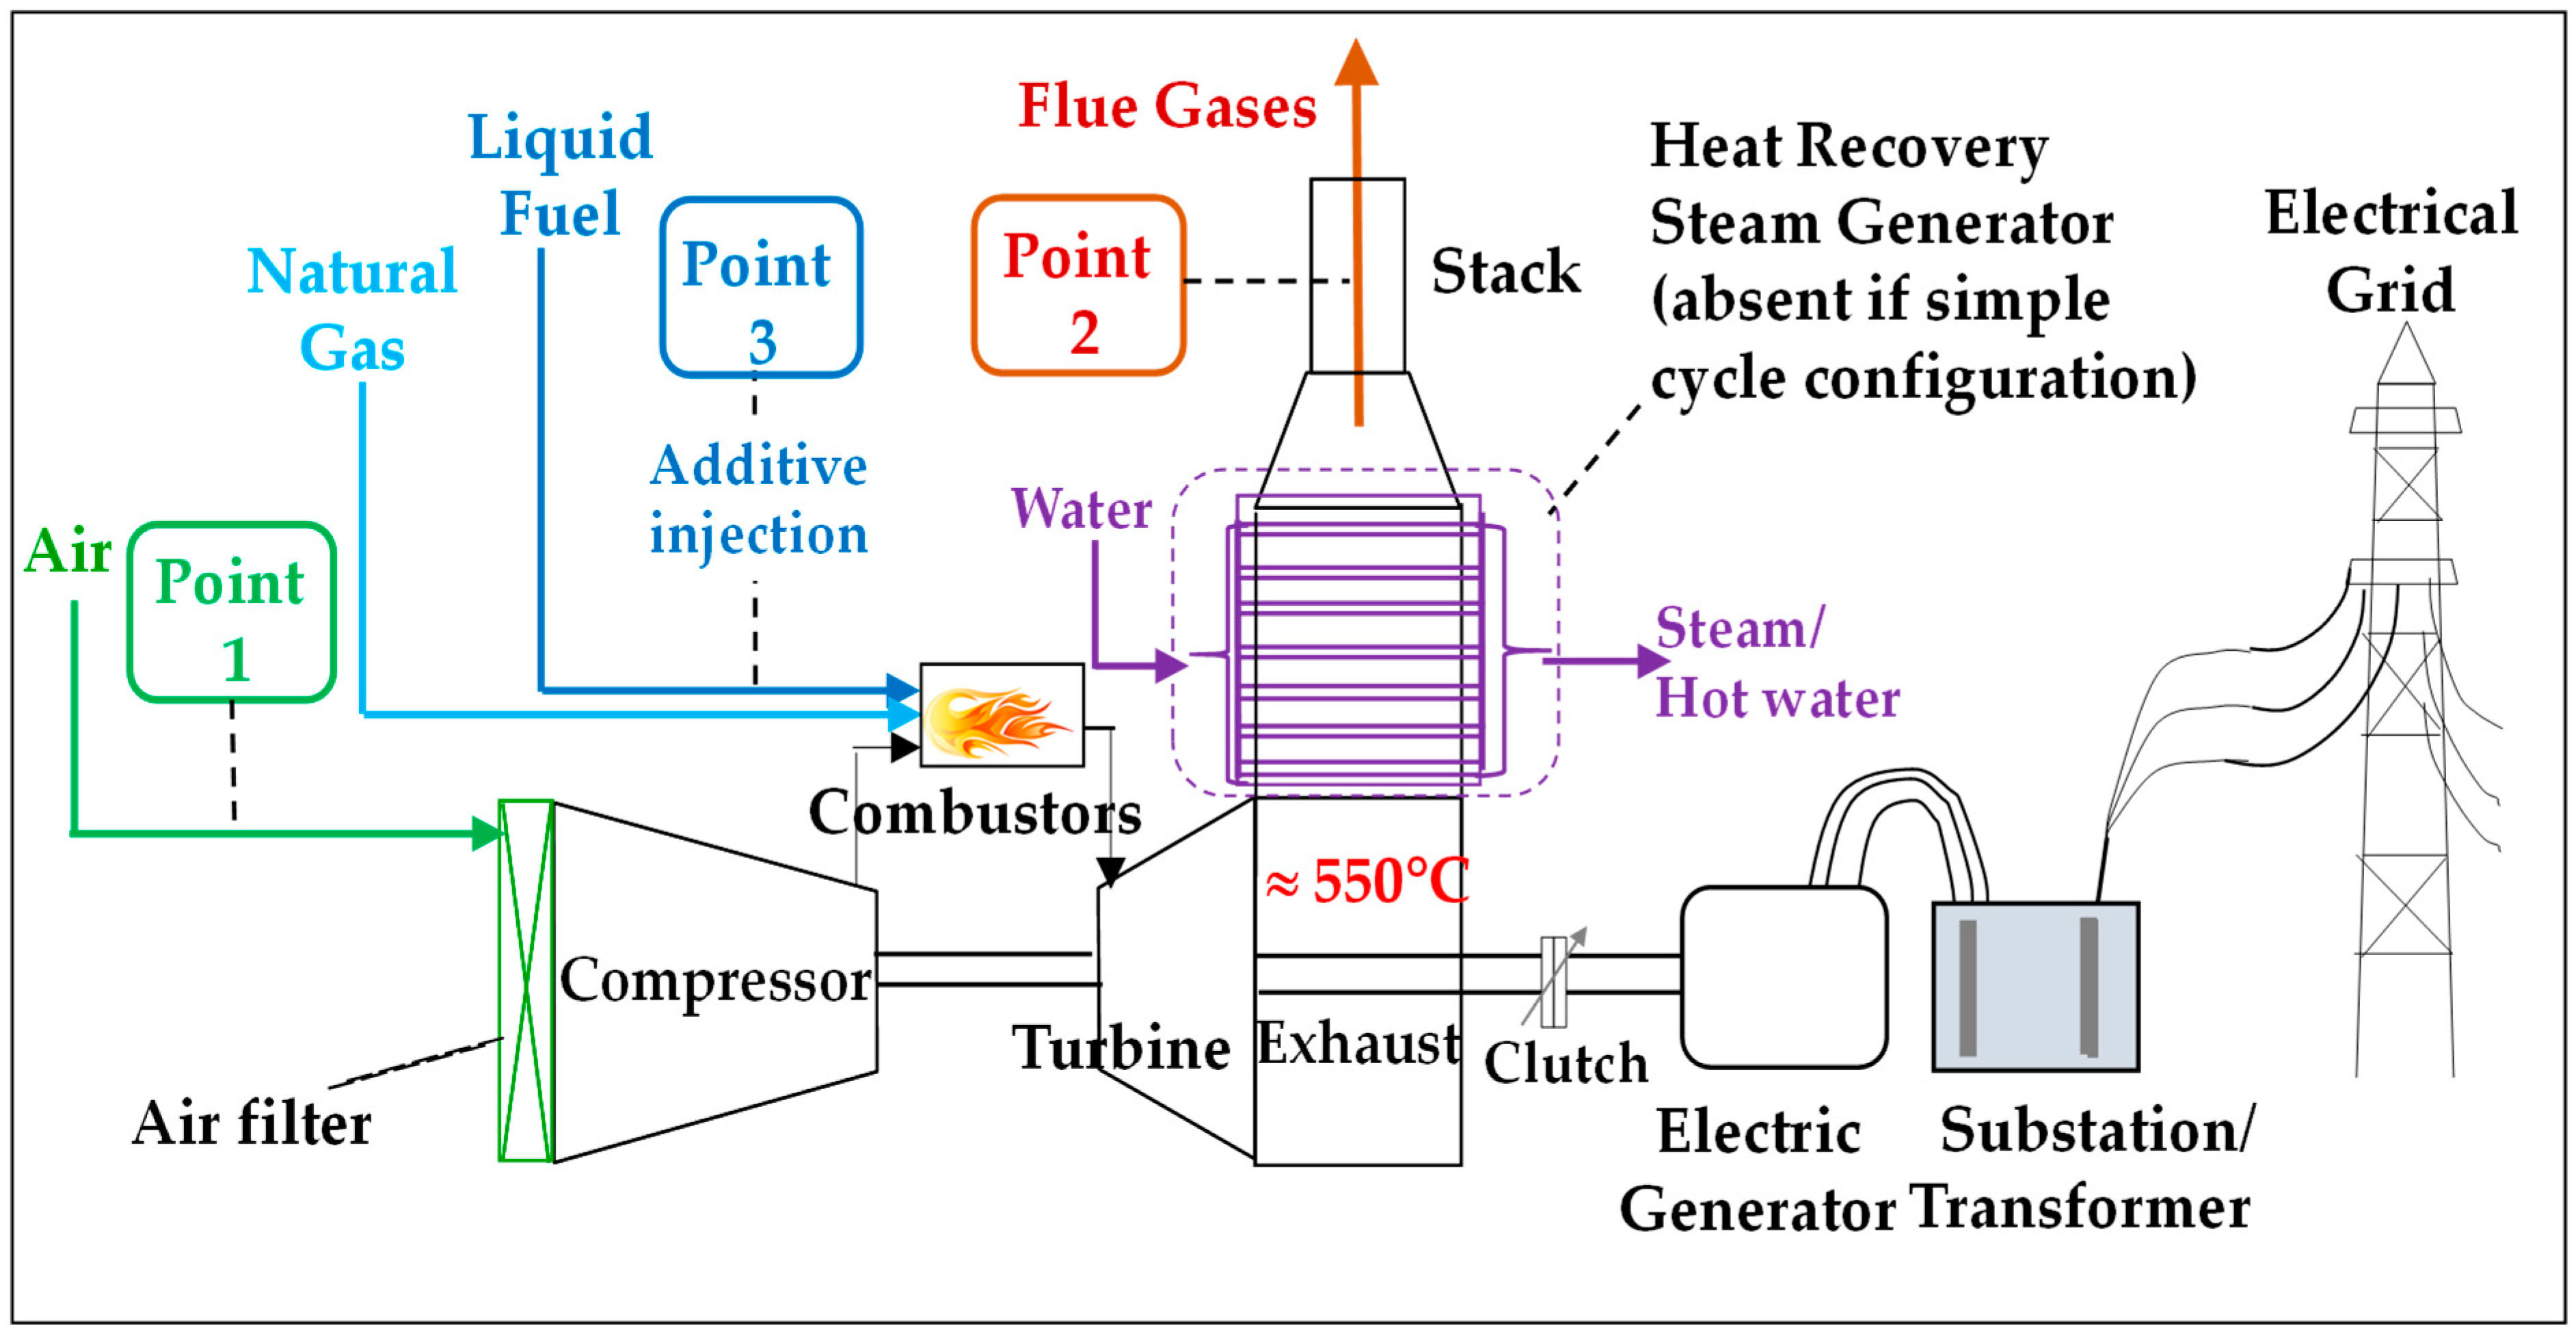
2.1. Gas Turbine (GT) Technology Aspects [2]

Figure 1 shows a stationary gas turbine unit that operates in combined cycle or cogeneration and is therefore equipped with a heat recovery steam generator (HRSG) [3]. An HRSG converts the waste heat contained in flue gases into usable thermal energy, producing steam at different temperatures and pressures, as well as hot water. In a simple cycle configuration, combustion gases are released directly into the air through the exhaust stack.
GTs operate with high excess air (13–15% O2 at exhaust) and have very hot and highly turbulent flames [4]. They can thus cleanly burn a wide spectrum of fuels, including many combustible gases (natural gas; industrial fuels; gasification products, etc.), including hydrogen [5] and practically all types of liquids (naphtha; distillate oils; aromatic cuts from refineries; heavy oils; etc.) [6].
Figure 2 shows a typical GT combustor with diffusion flame; it is fed with compressed combustion air and a gaseous or liquid fuel and discharges its combustion gases into the expansion turbine [7].
During the field tests, two GT configurations were involved: a simple and a combined cycle.

2.2. Particulate Matter (PM) and Filterable Particles (FPs)

Any combustion equipment fueled with hydrocarbons generates not only gaseous emissions (SOx; NOx, CO; UHC; PAH), but also variable quantities of soot particles and possibly ash [8]. Appropriate terminology is necessary to distinguish the different types of solid particles released from combustion plants and to describe their evolution during their transfer from the emission source to the environment, where they can trap other species, settle or remain in suspension [8,9].
The “primary particles” that are emitted from the exhaust of the equipment and can be captured by filters are called “filterable particles” (“FPs”); they are measured using standardized filtration methods. There is also a fraction of the emission which exits in a gaseous form at the exhaust stack but condenses in the ambient air to a liquid or solid state. Such condensable fractions contain, for example, H2SO4 or SOx mist and are likely to adsorb secondary species when diffusing in ambient air. The resulting emission is called particulate matter (PM), and its composition depends both on the fuel type and the local quality of the air, i.e., the latter of which is dependent on the typology of the site (rural, urban or industrial area) [10].
Figure 3 shows a sketch of a possible PM aggregate in which a soot cluster (the primary particle) has adsorbed various secondary species (H2O; CH4; sulfate ions; NaCl; PAH) [11].
PM is, by nature, composed of heterogeneous and evolving particles that are suspended in the air. These particles are key indicators of ambient air quality [12].
However, quantifying the impact of a given combustion installation requires measuring the “filterable particles” at the source [13]. We will also refer to them simply as “particles”, for ease of expression, as this article will only discuss primary emissions and will not cover PMs in the environment.
The specialized terminology used to designate additives active in reducing soot emissions by oxidation is very diverse and includes the following terms: soot suppressant; anti-soot agent; soot oxidation catalyst; or simply combustion catalyst, oxidation catalyst, combustion improver, etc. The expressions “soot suppression”, “soot reduction” or “soot abatement” will be used interchangeably in this paper.

2.3. Metrological Aspects of Particle Emission Measurements

2.3.1. Particle Emissions on Natural Gas

Investigating particles emitted by GTs running on natural gas is interesting for two main reasons: their metrology is very specific and measurement results closely reflect the quality of the local ambient air.
Although their levels are very low, they were the subject of some controversy in the EU during the 2000s as a result of the implementation of the 2010/75/EU Directive. Indeed, such very low levels of particles (a few tens of µg/m3) are beyond the scope of usual measurement standards (such as EN13284-1 or EPA n°5) which are devised for emission sources exceeding a few mg/Nm3. Therefore, in the absence of reliable field data bases, certain doubts remained as to the real significance of these emissions and the possible impact on health and the environment caused by gas turbine combined cycles (GTCC) which are often installed in urban or peri-urban areas and burn natural gas.
To clarify this point, a joint field test campaign was carried out as part of a collaboration between a unit of GE Energy (now known as GE Vernova, Gas Power division, Belfort, France) and CESI RICERCA (now known as Ricerca Sistema Energetico, Milan, Italy) and involving a group of expert laboratories (INERIS, Verneuil-en-Halatte, France and LECES, now known as GINGER LECES, Saint-Julien-Lès-Metz, France).
To respond to this metrological challenge, a very sensitive measurement protocol based on method EN 13284-1 was carefully developed by the CESI researchers, implementing significant improvements in terms of sampling methodology. These improvements involved computer-assisted isokinetic sampling; high-precision weighing and long collection times [14]. Measurement repeatability was established through rigorous monitoring rounds which lasted more than 3 months. Subsequently, reproducibility was also demonstrated thanks to cross-measurements carried out collaboratively by CESI, INERIS and LECES [15,16]. Typical uncertainties regarding measured particulate matter concentrations are in the range of 20–30% of the measurement result. However, if the particulate matter concentration result is in the range of a few mg/Nm3, the measurement uncertainty can increase beyond 30%.

2.3.2. Particle Emissions on Liquid Fuels

Liquid fuels produce more particles than natural gas, generally in excess of 1 mg/m3 (compared to a few tens of µg/m3). Here, the usual gravimetric measurement standards (EPA No. 5 and EN 13284-1) can be used [17,18]. In addition, while clean liquids, such as gasoline or diesel oil, are virtually ash-free, those containing traces of metals, such as crude oils (COs) or heavy oils (HFOs), also generate ash, so that FPs are the sum of the soot and ash [19]. Depending on fuel quality, ash can make up a substantial fraction of primary particles.
In addition to FP measurements, the “smoke spot number” test, according to ASTM D2156, can be used. It consists of aspirating a defined volume of flue gas through a dedicated filter and comparing the resulting “smoke spot” with a set of increasingly dark spots printed on a standard scale and numbered from 0 to 9. Smoke spots numbers 0 and 3 correspond, respectively, to invisible and slightly visible plumes, while number 6 corresponds to an incipiently dark plume. One can visually discriminate two spot number values that differ by 0.5 unit. This semi quantitative test reflects the optical absorbance of soot deposits with variable thicknesses; it is, of course, less sensitive than the gravimetric methods, but remains a valuable indicator as it is reasonably reproducible and both easy and quick to perform.
The results of FP measurements carried out on gaseous and liquid fuels will be reported in Section 3.

2.3.3. Overview of Particle Abatement Technologies

Two general approaches are feasible for reducing the amount of particles emitted by combustion equipment:
  • Installing gas filtration systems; for example, bag filters, cyclones or electrostatic precipitators (ESPs) [20,21].
  • Oxidizing soot particles through a catalytic process, either in the flame [22] or downstream [23].
If installed at the exhaust of a GT, bag filters or cyclones would cause significant pressure drops, resulting in large efficiency penalties. Additionally, the ESP technology, which is mainly designed for solid fuels, has significant disadvantages: on the one hand, achieving post-capture concentrations lower than 10 mg/Nm3 requires specific and expensive designs; on another hand, ESPs are not effective for capturing submicron particles, whereas soot particles are known to be nano or micro in size.
Concerning the alternative route resorting to oxidation catalysts, two options can be considered:
  • Installing honeycomb catalytic structures in the GT post-combustion train [23,24].
  • Injecting a combustion catalyst additive via the fuel circuit (cf. point 2 of Figure 1) [22,25].
These approaches are, respectively, similar to the “catalyzed diesel particulate filter” (CDPF) [26] and “fuel-borne catalyst” (FBC) [27] technologies that have been developed for automotive applications. Here, again, several considerations led us to discard the CDPF option for GTs, as it would require installing bulky catalyst-coated monoliths, resulting in high CAPEX and, again, adverse back pressures.
On the contrary, the use of benign metallic additives injected at low doses through the fuel circuit is economically feasible and allows significant soot reduction rates to be achieved while only slightly increasing the mass of emitted ash, as illustrated in Figure 4a.
When the fuel is ash-free, the increase in ash as a result of the additive is nil, and, in the case of an ash-forming fuel, Figure 4b shows that the increase in filterable particles is minute.

3. Summary of the Four Field Tests

3.1. Field Test Program

The field tests were carried out on four types of fuels: a commercial natural gas and three types of liquid fuels. They involved two types of GT configurations: a simple and a combined cycle. All tests were performed on machines operated at base load.
To secure the representativeness of the results, the testing activity was carried out on GTs in real operation, with some practical constraints. It should be emphasized that such engineering tests cannot give rise to all the physicochemical studies and explorations of experimental parameters that would be possible in laboratory tests.

3.2. Gas Turbine Burning Natural Gas

This field test involved a 40 MWe class GT running in a GTCC configuration, equipped with Dry Low NOx combustion chambers (DLN) and installed in an urban/industrial district. The filter media used in these measurements consisted of 0.3 µm quartz microfibers, which were capable of capturing extremely fine particles.
The results, summarized in Table 1, showed that the emissions, measured at point 2 (Figure 1) were as low as a few tens of µg/m3. Amazingly, they proved more than two times lower than the concentrations which were simultaneously measured in the ambient air (at the point 1 close to GT air intake). This is due to both the perfect combustion of natural gas ensured by GTs and the purifying role played by the air filters installed at the inlet of the GT compressor (Figure 1).
Figure 5 shows two scanning electron micrographs (SEMs) of the deposits collected at point 1 and point 2. Interestingly, the measurements collected at point 2 (GT exhaust) showed no soot aggregates and were significantly cleaner than those at point 1, with the latter revealing a substantial level of air pollution by particles. This qualitatively confirms our measurement results.
It was tempting to conclude that gas-fired GTs act as “particle scrubbers” in environments polluted by PM.
The outcomes of this emission campaign on gas-fired GTs will serve as a comparison for the results that will be obtained with gas turbines burning liquid fuels.

3.3. Gas Turbines Burning Liquid Fuels

The three tested fuels were as follows:
-
A No. 2 distillate oil or “No. 2 DO (i.e., a light, ashless fuel).
-
A heavy crude oil or “HCO” (a viscous but low-ash fuel).
-
A heavy fuel oil or “HFO” (a viscous, ash-forming fuel).
Three fuel additives based, respectively, on cerium(III), cerium(IV) and iron(III) were selected. The iron(III) and cerium(IV) additives were sulfonates; the cerium(III) was a carboxylate (octoate–ethyl-hexanoate). They were injected into the low-pressure section of the fuel circuit (point 3 of Figure 1) using a dosing pump. Different dosages were applied, starting from zero (the reference point for all tests).
In addition to the measurements of filterable particles and smoke spot number, as detailed in Section 2.3.2, the concentrations of NOx, SOx and CO at GT exhaust were also monitored.

3.3.1. Gas Turbine Running on No. 2 Distillate Oil (“No. 2 DO”)

The tested GT was a peaking unit running in simple cycle (i.e., without an HRSG).
Figure 6 shows the reduction in soot particles achieved when injecting (i) 13 ppm of the Ce(III) additive; (ii) 13 ppm of Ce(IV); and 62 to 77 ppm iron(III) compared to the case without any injection.
The dosages are expressed in ppm by weight (ppm-wt) of metal in the fuel. Each point in Figure 6a–c corresponds to one test.
Although the tests with cerium comprised only two points (a sole dosing rate per additive), we chose to draw the correlation plots using an exponential law, which corresponds to the typical profile of soot abatement processes, as will be shown below.
Curiously, cerium(III), which is not an oxidizing agent but rather a reducing species, performed similarly to (and even slightly better than) cerium(IV), with the soot suppression rate reaching 75% on a weight basis, corresponding to residual soot levels around 1 mg/Nm3.
Figure 6c shows that iron (III) is also effective, with a residual soot level of about 1.5 mg/Nm3. However, the reduction rate is only 65% and much higher dosages are necessary.
In all injection runs, the smoke spot number decreased from 2 to about 0.5 (totally invisible plumes).
The important conclusion from these field tests carried out with No. 2 distillate is that cerium is very active at high temperatures, since there is no “medium-temperature window” in the hot gas path of the gas turbine, with the temperature reducing, in a few seconds, from approximately 2100 °C (in the flames) to 1100 °C (at the combustors outlet) then to 550 °C (at GT exhaust) (Figure 1).

3.3.2. Gas Turbine Running on Heavy Crude Oil

This time, the GT burned a heavy crude oil (“HCO”) and was also operated in a simple cycle.
This crude was a heavy, low-sulfur, paraffinic crude oil. It contained a negligible amount of ash but contained hydrocarbon molecules as large as C60, as its 80% distillation point was higher than 600 °C. Figure 7 summarizes the effects of the three additives.
The smoke spot number went from six (no additive) to three (with cerium additives) and five (with iron).
Figure 8 shows some images of a soot deposit taken from one of the measurement filters, as well as its EDAX analysis (Energy-Dispersive X-ray Analysis). As expected, carbon is dominant and oxygen is virtually absent. Cerium is present in very low concentrations but is relatively uniformly distributed; it is accompanied by sulfur and oxygen, suggesting the formation of a cerium sulfate salt.
In summary, of the field tests carried out on No. 2 DO and HCO, we can confirm that the three additives and, in particular, cerium, proved to be very effective anti-soot additives and are active at high temperatures, particularly in the highly oxidizing flames of the gas turbines, since these machines did not have a low-temperature path but released their combustion gases at around 550 °C.

3.3.3. Gas Turbine Running on Heavy Fuel Oil

The fuel was an HFO containing about 30 ppm vanadium. This time, the GT was operated in a combined cycle and was therefore associated with an HRSG (Figure 1). A CEM (Continuous Emission Monitoring) system including SO2, NO and opacity measurements, was installed in the flue gas stack as part of the overall installation. This CEM device was therefore located downstream of the HRSG. Its opacimeter, based on a light absorption detector, gave an additional, useful indication of the level of FPs. Cerium(III), cerium(IV) and Fe(III) additives were used.

A—Particular Observations: “Memory Effect”

The record log of the opacimeter allowed us to discover an unexpected “memory” effect (Figure 9).
Indeed, unexpected events were observed during the first injection:
  • Event A—When starting the additive injection (Run 1), the opacity signal initially showed a rapid drop followed by a long decrease (shown by the dotted purple square in Figure 9) and then stabilized after about half an hour elapsed.
  • Event B—Once the injection was stopped, opacity did not immediately return to its initial value but instead did so gradually (dotted blue square); this is not consistent with the fact that the residence time of the combustion gas inside the complete GT-HRSG path was only approximately 1 min.
  • Event C—During the second injection run, “Event A” was no longer observed, which meant that it was not due to the slow response time of the opacimeter. However, “Event B” happened again.
These unusual effects will be interpreted in the Discussion, which will be developed in Section 4.
Incidentally, Figure 9 also shows a concomitant effect on the CO emission (slight reduction).
As a general remark concerning all soot abatement tests, it was observed that the injection of water for NOx reduction, when available on the test site, did not interfere with the effects of the combustion catalysts, which in turn did not affect NOx and SOx but tended to slightly reduce CO thanks to their oxidizing role.

B—Measurement Results

Because, in this field test, the fuel is an ash-forming one (containing 30 ppm vanadium), the measured FPs are the sum of soot and ash, as explained in Figure 4. In fact, because vanadium forms a fusible and highly corrosive oxide (V2O5) in the turbine, it is necessary to inject another fuel additive containing magnesium as a corrosion inhibitor, which acts by forming a non-corrosive magnesium vanadate. A high Mg/V ratio is used to ensure correct inhibition, which leads to the following reaction balance:
V2O5 + x MgO + (x − 3) SO3 → Mg3V2O8 + (x − 3) MgSO4 (x ≈ 12.6)
Each ppm of vanadium in the fuel generates 10.4 mg of vanadium/magnesium ash; calculations show that the 30 ppm contained in that HFO induced a concentration of about 8.0 mg/Nm3 of inorganic ash in the flue gases. This amount must then be subtracted from the measured FP values. This led to the results shown in Figure 10.
Here, again, cerium(III) proved more effective than cerium(IV): for a 20 ppm dosage, the reduction rate was 52%, compared to 33% for cerium(IV). With the two additives, the smoke spot number went from six without injection (incipiently dark plume) to three for a 20 ppm dosage, corresponding to a barely visible plume.
Iron(III) proved much less efficient, with an abatement of only 26% despite the dose being twice as high.

4. Discussion

This section will first investigate and summarize the physical and chemical processes underlying the formation and suppression of soot particles and then propose an interpretation of the field test results.

4.1. Bibliographic Data

The processes of formation and oxidation of soot particles in flames have been the subjects of a very important corpus of research literature since the 1970s [28,29,30,31,32]. The most recent progress can be found in references [33,34,35,36].
Reference [37] provides an interesting review of the effects of oil-soluble combustion catalysts in various combustion systems, including ferrocene. Their use in diesel engines has been the subject of numerous papers [22,25,27,38].
In contrast, the literature devoted to stationary gas turbines is practically non-existent, and only a few papers deal with jet engines. Notably, an important research program was conducted in the 1980s on jet engines used by the US Navy. A decrease in smoke opacity was observed when dosing up to 1000 ppm of cerium into aviation fuels [39,40]. These dosage levels are very high compared to those used in the present work: this difference will be tentatively explained hereafter.

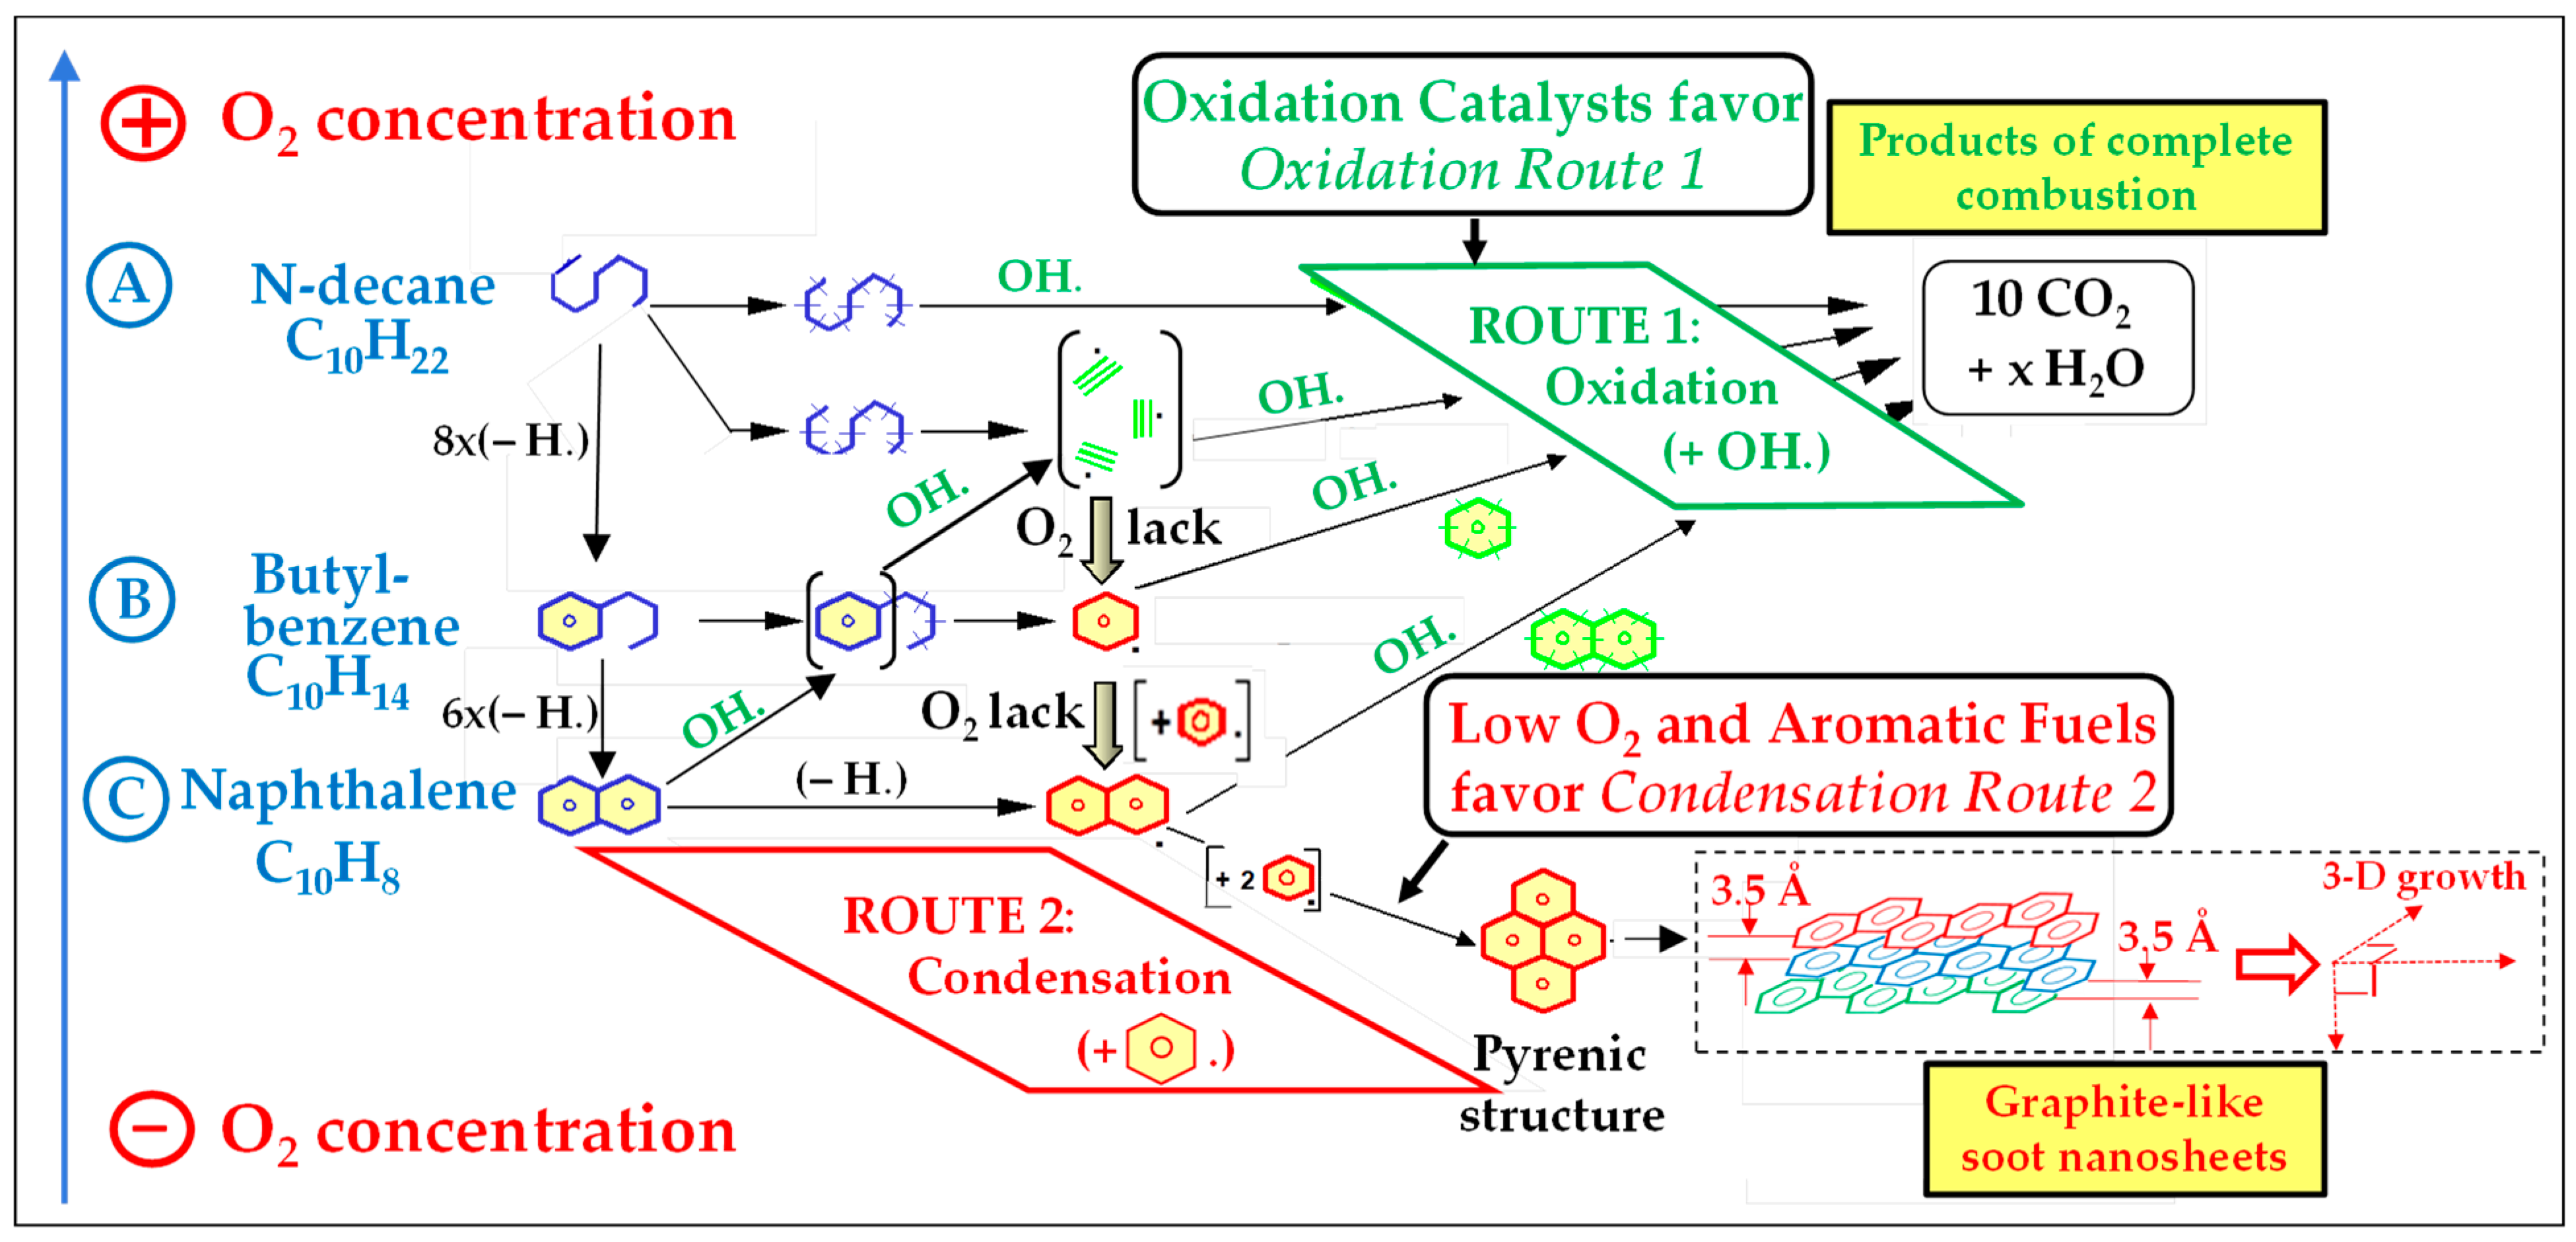
4.2. Processes Underlying Soot Formation

The formation of soot in flames of liquid hydrocarbons (HCs) follows complex mechanisms which are multi-scale in nature, involving molecular, nano and microscopic species and processes. The classic steps are nucleation, growth of individual particles, interparticle condensation and potential deposition on surfaces when they encounter obstacles.
Figure 11 provides a schematic description which begins at a macroscopic level, the first step being the spraying (or “atomization”) of the fuel into small drops, which can be achieved either by pressurizing the fuel (“pressure atomization”) or by spraying it with compressed air (“air atomization”).
In Figure 11, case (a) corresponds to a light and ashless liquid fuel (for example, a No. 2 distillate oil): it can be easily finely sprayed and fully vaporized. On rich spots of the flame (in the primary combustion zone), it can initially form PAH molecules, then nano-nuclei of soot (that can be later destroyed by oxidation). This happens according to the mechanism in Figure 12, which will be set out below.
Case (b) describes the fate of a viscous but low-ash fuel (for example, a crude oil: HCO). This time, vaporization may be incomplete, causing the formation of (i) cenospheres, which are empty shells composed of coke and inorganic materials; and (ii) PAHs leading to soot clusters, as set out below.
Finally, case (c) corresponds to a viscous, ash-forming fuel (HFO) which generally contains metallic atoms (Na; Ca; Mg; Al; Si; V; Ni; Fe; etc.). Its combustion generates not only soot nuclei and cenospheres but also nano-crystals of ash formed of metal oxides which also nucleate and grow in the flames, and are thus mixed with the soot particles.
Figure 12 provides a simplified synopsis of the mechanisms at the molecular level.
For didactic purposes, this sketch involves three fuel molecules, each one possessing 10 carbon atoms but belonging to three distinct classes of hydrocarbons, with different C/H atomic ratios:
A—n-decane: a paraffin (C10H22; C/H = 2.2).
B—butyl-benzene: a mono-aromatic (C10H14; C/H = 1.4).
C—naphthalene: a di-aromatic (C10H8; C/H = 0.8).
When crossing the flame front, these molecules react differently and experience different fates:
A—N-decane has a linear, fully hydrogenated carbon skeleton. Therefore, its molecules easily break down into small molecular fragments. Most of them are oxidized to CO2 and H2O by OH radicals, provided enough O2 molecules are available, and become the “lean regions” of the flame (secondary or dilution zones). In some zones deprived of O2 (i.e., “rich regions”: the primary zone), n-decane can undergo H. atom abstractions, yielding unsaturated species, namely acethylenyl radicals (HC≡C), which themselves can trimerize to form benzenic nuclei.
B—Butyl-benzene undergoes similarly fast breakdown/oxidation sequences within its butyl group; on the contrary, its benzenic ring is more difficult to oxidize due to its chemical stability. When faced with a lack of oxygen (again in rich zones), its molecule will preferably condense on itself to form a di-aromatic substrate (a skeleton of naphthalene).
C—Naphthalene is a very stable, di-aromatic molecule that is very difficult to oxidize: its clean combustion requires highly oxidizing conditions (which is nevertheless the case in gas turbine flames). This molecule preferably condenses on itself to yield a tetra-aromatic substrate (pyrenic structure).
Di-aromatics and tetra-aromatics are nothing but two members of the polyaromatic hydrocarbon (PAH) series, which have planar structures.
In all cases, the PAHs formed can in turn undergo multiple subsequent reactions: they can dimerize, condense with other PAHs or unite with other benzene rings to generate increasingly large sheets of aromatic scaffolds. The higher the number of benzenic rings, the lower the hydrogen content: their raw formula (CHε) tends towards that of pure carbon graphite (C).
Subsequently, these planar sheets bind together via π-bonds to generate lamellar (or “foliated”) structures similar to the structure of graphite, with an interplanar distance of 3.5 Å. These soot nano-nuclei are themselves capable of growing in both thickness and planar extensions.
The growth process does not end at this point, since these nano-nuclei tend in turn to aggregate to form “turbostratic” clusters, i.e., directionally disordered aggregates which resemble chaotic piles of flat tiles, as illustrated by the image at the bottom right of Figure 11. During this growth, the aggregates progressively move from the nanoscale to the microscopic scale. Due to the high accumulation of closely intermingled carbon atoms, their oxidation by OH or O2 becomes increasingly difficult due to diffusion limitations. When they leave the flame and reach cooler regions, they stop growing, resulting in stable soot particles. Moreover, once released into the air, they can adsorb exogeneous organic/inorganic molecules to form PM, which can persist in the environment, as described in Section 2.

Individual PAH Molecules Are Also Emitted

This mechanistic summary is an extremely simplified representation of the hundreds of consecutive reactions which every initial fuel molecule can statistically undergo in the flame, depending on the temperature and the oxygen strength of the flame regions they cross, with the OH radical being the oxidizing species.
In summary, while saturated hydrocarbons (n-decane) tend to cleanly burn and ultimately form CO2 + H2O effluents, mono-aromatics (butyl-benzene) and especially di-aromatics (naphthalene) are prone to generating soot particles. For example, some low-grade derivatives of oil refineries, such as Light Cycle Oils (LCOs), contain substantial amounts of mono- and di-aromatic hydrocarbons and therefore tend to produce soot when burned in boilers, and even more so when burned in diesel engines. However, the highly oxidizing flames of gas turbines are able to burn them cleanly: this was demonstrated by another field test in which an LCO containing up to 57% di-aromatics was burned cleanly in a 40 MW GT [41].
This analysis of the formation of soot is consistent with the order of classification (HFO > HCO > No. 2 DO) which was observed in terms of PM emissions during our field tests.

4.3. Mechanisms of Soot Suppression Using Fuel Additives

4.3.1. Summary of the Three Field Tests

In Section 3, we used an exponential correlation law to represent the effect of the soot suppressants, as it fits well the typical profile of soot abatement processes. Appendix A proposes a simplified demonstration of this law.
Overall, the three field tests showed a negative exponential dependence of the soot concentration versus additive concentration for the three fuels and the three additives. This is expressed by the following relation:
P = FP0 × exp(k × [Metal]), where k < 0.
The nine pairs of FP0 and k data shown in Figure 6, Figure 7 and Figure 10 are grouped together in Table 2 below, which provides a very concise summary of all field test results:
  • The ranking of additives in terms of effectiveness is as follows: Ce(III) > Ce(IV) >> Fe(III).
  • The ranking of fuels in terms of “ease” of soot reduction is as follows: No. 2 distillate oil >> heavy crude oil (HCO) > heavy fuel oil (HFO).

4.3.2. Methodology Used to Interpret Results

In the interpretation proposed below, we will use a thermodynamic approach to analyze the reactions that occur in GT combustors. This approach is relevant owing to the high temperatures which prevail in the flames and induce extremely rapid redox kinetics between the soot and the catalytic species.
The soot will be assimilated to carbon (graphite). Incidentally, a more precise chemical formula for soot could be CHε, (where ε is lower than, e.g., 0.1) and its oxidation by O2 at high temperature could be written as CHε + (0.5 + ε/4) O2 → CO + ε/2 H2O, but this refinement would not change the analysis of the processes.
Besides soot, the primary oxidation products of fuel at high temperatures are CO and H2O.
When an organometallic additive enters the combustion chambers, its organic moiety is burned and it releases the metal in the form of oxide. For example, for the cerium(III) ethyl-hexanoate,
Ce[(C2H5)2(C5H10)CO2]3 + 20.5 O2 → 24 CO + 15 H2O + CeO2
If this oxide behaves as a catalyst, it will enter into a redox process with the soot nuclei and oxidize them. With CeO2, such a redox process is a sequence of oxidation steps whose ultimate result is
C (soot) + 2 CeO2 → Ce2O3 + CO
The proposed thermodynamic approach consists of plotting the free enthalpy (or Gibbs function) of the expected redox reactions as functions of temperature. In this study, the equilibrium calculations were performed using the thermodynamic data compiled by Binnewies and Milke [42].
Since thermodynamics says that for a reaction to occur, its free enthalpy must be negative, we can deduce in which sense the different redox reactions will proceed.

4.3.3. Soot Suppression by Iron

For iron, the species possibly formed in the flames are Fe3O4 (magnetite or iron(II,III) oxide) and Fe2O3 (hematite or iron(III) oxide. The corresponding redox reactions are listed in Table 3.
Figure 13a shows that Fe2O3 is reduced by carbon (i.e., by soot particles) at any temperature because the corresponding ΔG(T) function is always negative (knowing that the kinetics become, of course, infinitely slow at low temperatures). Figure 13b, in turn, shows that in the absence of a reductant, Fe2O3 is not stable above 1485 °C, as it spontaneously auto-reduces to Fe3O4, which is not an oxidant and has therefore no effect on soot.
Therefore, when the organic iron(III) additive enters the GT flames and crosses the soot-rich primary zone, which is very hot (T >> 1485 °C), its combustion does not release Fe2O3, but Fe3O4, which has no oxidation effect on soot. The oxidation of soot nuclei can actually begin only at a temperature below 1485 °C, which is downstream of the flame (the immediate “post-flame” region); there, Fe3O4 is oxidized into Fe2O3 (Figure 13b) that can therefore oxidize the soot particles (Figure 13a).
It must be stressed that the oxidizing role of Fe2O3 is a true catalytic process because it is dioxygen which is ultimately consumed, with Fe2O3 being cyclically regenerated through a chemical loop between Fe2O3 and Fe3O4. The corresponding chemical loop is shown in Figure 14.

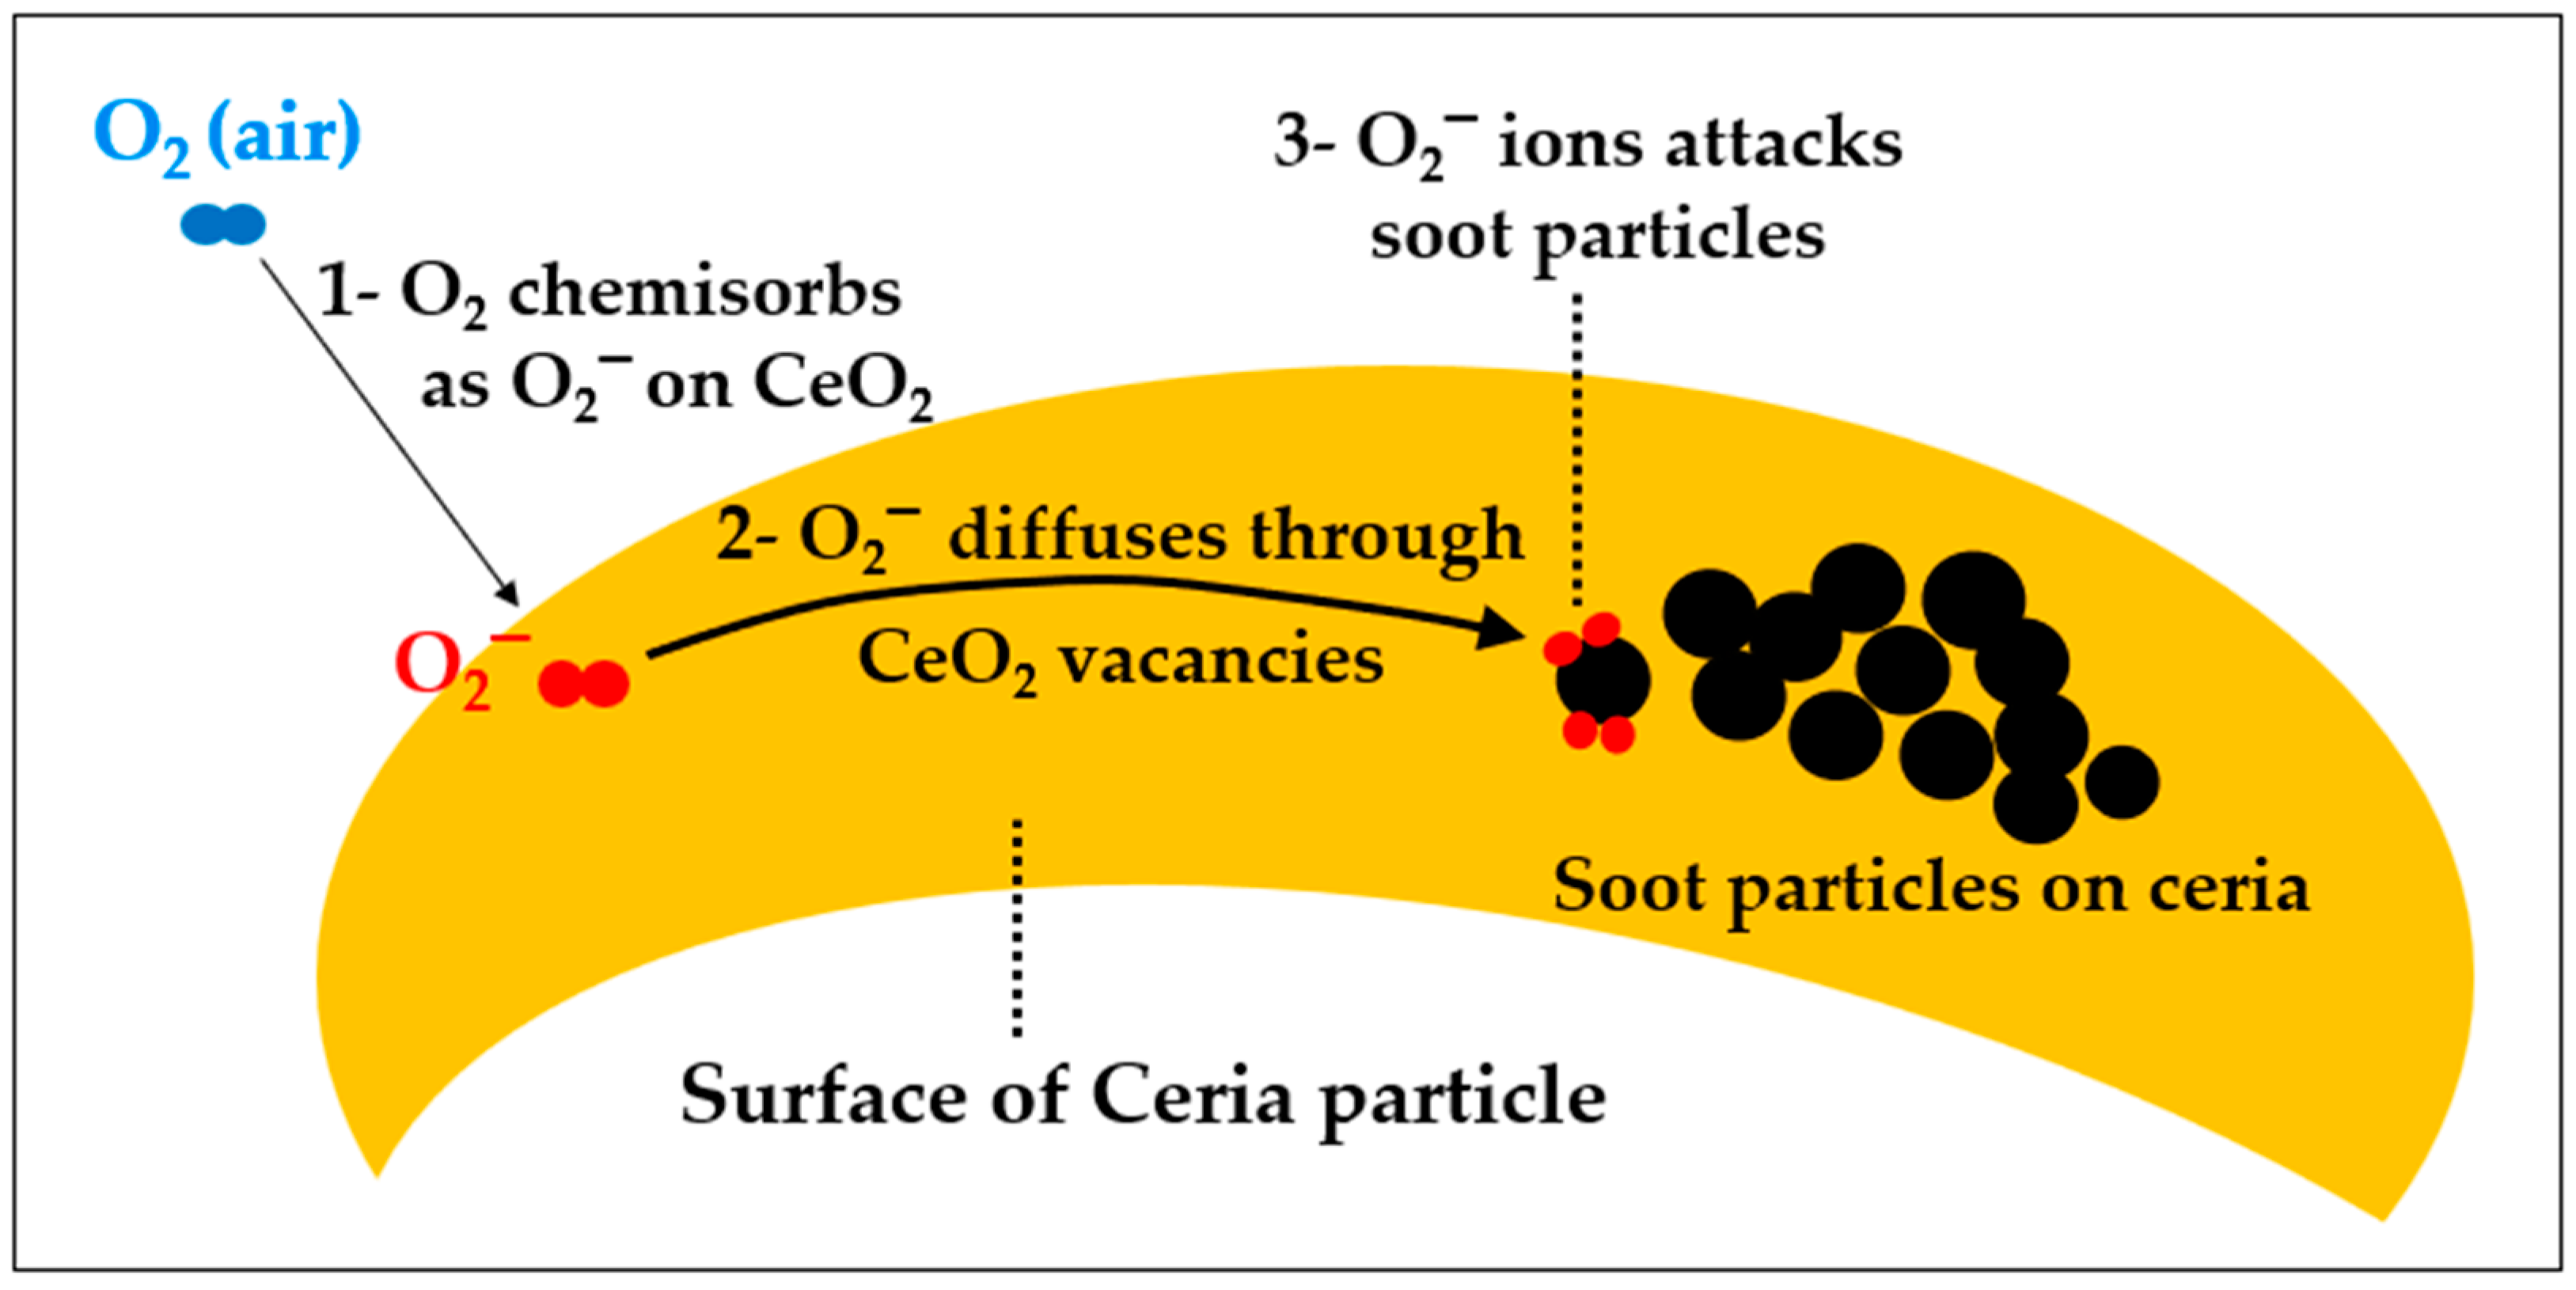
4.3.4. Soot Suppression by Cerium

For cerium, the species possibly formed in the flames are CeO2 (cerium(IV) oxide or ceria) and Ce2O3 (cerium(III) oxide or cerium sesquioxide).
However, as set out below, cerium has the particular property of being catalytically active both at high and medium temperatures. This leads us to consider two catalytic regimes.
The redox reactions occurring at high temperature are listed in Table 4.

A—Catalytic Effect of Cerium at High Temperature

Figure 15a shows that, contrary to iron, the decomposition of the cerium additives in the flame yields CeO2 (or “ceria”), which is thermally stable up to about 2700 °C in the absence of reductant, because the corresponding ΔG(T) is always negative. This exceptional thermal stability of cerium(IV) is well known [43,44] and will be explained in a note below.
Figure 15b, in turn, indicates that CeO2 can (and does) oxidize soot particles at temperatures above about 930 °C and is thus reduced to Ce2O3. This mode of soot suppression which is active at high temperatures will be called the “HT oxidation mode”.
Overall, CeO2 is stable at very high temperatures (in absence of reductant and, on another hand, is reduced by soot above 930 °C. This specific behavior has several important consequences.
A1—The Ce(IV) species produced in the primary zone (depleted of oxygen) are available to oxidize the soot particles, and this process is very fast due to the extreme temperatures (higher than 1500 °C). Therefore, nascent soot clusters which nucleate in the primary zone are immediately annihilated before they can grow. This explains why cerium-based additives are more effective than iron, which is only active below 1485 °C; this inference is consistent with the results of the field tests on No. 2 DO and HCO carried out without HRSG.
A2—In the region just downstream of the flame front, where the oxygen concentration becomes substantially positive, the Ce(IV) species continue their oxidation of soot particles, also within the “HT oxidation mode”, until the temperature drops to 930 °C, which corresponds to a line inside the first stage of the expansion turbine.
As for iron, there is also a chemical looping process between CeO2 and Ce2O3 (Figure 16).
Note about the thermal stability of CeO2: The high thermal stability of CeO2 can be attributed to the fact that cerium is the second element in the lanthanide (or rare earth) row. Indeed, cerium has a single electron in its 4f orbital, its electronic configuration being [Xe] 4f¹ 5d¹ 6s², with four electrons distributed in its most external orbitals. When it oxidizes to Ce4+, it loses all four of these electrons so that its electronic configuration becomes [Xe], which is the configuration of the noble gas xenon, which is very stable. Therefore, the stable form of cerium oxide is CeO2 and not Ce2O3, whereas for other rare earths (REs) it is RE2O3. Neither iron nor any other transition metal exhibits this electronic specificity.

B—Catalytic Effect of Cerium at Medium Temperature

Cerium has another chemical specificity. Indeed, while the “HT oxidation mode” can no longer occur below 930 °C, a second type of reaction comes into play at lower temperatures, which this time forms not Ce2O3 but oxygen-defective compounds derived from CeO2 and noted “CeO2−δ”. We will call this second action mode the “MT oxidation mode”. These CeO2−δ species are non-stoichiometric oxides which nevertheless conserve the lattice structure of CeO2 (fluorite, cubic).
This “MT oxidation mode” becomes active below 930 °C. In a gas turbine, this is between the first stage of the turbine and the end of the combustion gas path; this includes a portion of the volume of the HRSG which is installed downstream of the GT (in the case of a GTCC or cogeneration unit) and in which the temperature decreases from approximately 550 to 180 °C.
The effectiveness of cerium in this temperature range has been demonstrated by numerous experimental studies [31,45] and is well illustrated by Figure 17 in which a soot sample is deposited on an inactive or catalytic support and its weight is monitored against the temperature (in air). The “light-off” event is the moment when the soot begins to oxidize and T50 is the temperature at which the weight loss reaches 50%. The use of cerium makes it possible to reduce the T50 threshold by 100 °C or more. At this stage of the discussion, it is worth mentioning that when an oil-soluble fuel additive is used, the oxide nano crystallites which form in the flame (here, CeO2) find themselves ipso facto incorporated inside the soot particles; thus, they occupy a key position to attack the soot clusters, both in the flame and post-flame regions. This is a significant advantage of the “fuel-borne catalysts” (FBCs) strategy over the “catalyzed diesel particulate filter” (CDPF) strategy.
This “MT oxidation mode” explains the “memory effect” observed during the field test on HFO (Figure 9), in which there was an HRSG downstream of the GT (Figure 1). Indeed, when the first injection of cerium begins, some ceria (mixed with the ash material produced by the HFO) gradually deposits on the internal components of the HRSG, namely on the tubes of the gas/water heat exchanger. These multiple tube bundles have a high overall surface area, so that, once covered with a sufficient layer of ceria, the resulting coating acts in the same way as a “catalyzed diesel particulate filter” (CDPF) [24,26], providing an additional soot reduction effect.
As discussed in Section 3.3.2 and as shown in Figure 8, the active cerium species is likely a sulfate of cerium. Paradoxically, the appearance of sulfated cerium species in the CDPFs of cars is known to cause cerium to lose its activity, but this is due to reducing conditions which transform the cerium salt into a reduced and therefore inactive variety of sulfate (e.g., Ce2SO2 [46]). This cannot occur in the after-combustion train of gas turbines owing to the high oxygen content (13 to 15% O2) of the flue gases. Therefore, the sulfated species formed there involves cerium(IV); they could be Ce(SO4)2 or, more likely, the oxysulfate CeOSO4 that results from a partial thermal decomposition of the former [47,48]:
CeO2 + 2 SO3 → Ce(SO4)2
Ce(SO4)2 → CeOSO4 + SO3
This assertion, however, deserves to be verified experimentally.
This MT catalytic mechanism is probably similar to that involved in CDPFs: in the presence of dioxygen (13 to 15% O2 at GT exhaust), a chemical loop takes place between CeO2 and the CeO2−δ species (Figure 18).
This loop is accelerated by the so-called “spill-over” effect of oxygen [49] near the soot/oxide interfaces (Figure 19). As illustrated by Figure 19, this effect involves dioxygen molecules (depicted in green) that adsorb on superficial defects of the fluorite lattice, creating superoxide ions (O2, depicted in blue) which diffuse along the CeO2−δ surface (depicted in beige/yellow) towards the soot nuclei (depicted in gray/black) and contribute to their further oxidation [50,51].

4.3.5. Interpretation of the Difference in Effectiveness Between Cerium(III) and Cerium(IV)

An a priori unexpected result from the three field tests was the better effectiveness of the cerium(III)-based additive, which apparently contradicts the fact that Ce(III) is not an oxidizing species. This effect can be explained by the fact that the atomization of the fuel is of the air atomization type. In fact, air atomization ensures oxidizing conditions are achieved in the primary zone of the combustors by providing a flow of dioxygen molecules that are intimately mixed with the fuel molecules. Therefore, in this zone, the Ce(III) species produced when the additive burns, are likely to be transiently oxidized by this flow of oxygen, generating nascent Ce(IV) species that are even more active than those generated by the cerium(IV) additive, since they intervene more quickly.

4.3.6. Difference in Additive Dosages Between Jet Engines and Stationary Turbines

As noted in Section 4.1, the literature relating to jet engines [39,40] indicates that the abatement of soot requires much higher concentrations of fuel additive than we found in the case of stationary gas turbines. This difference can be explained by the fact that jet aviation engines have pressure atomization systems, unlike stationary GTs, which use air atomization. Indeed, pressure atomization does not bring dioxygen in the primary combustion zone.
This explanation is also consistent with the fact that older stationary GT models from the 1970s, which at that time were also equipped with pressure atomization devices, also emitted visible plumes of smoke, even when burning clean diesel oil, while contemporary models, equipped with atomizing air, no longer do this.
Finally, the low injection levels found in our field test are also consistent with the results of a field test which was performed in South Korea in the late 1990s on a stationary GT burning a low-sulfur waxy residual (LSWR) fuel: only a few ppm of iron additive was also needed [52].
It can thus be concluded that the combination of an air atomization system with an injection of a cerium additive (if necessary) represents a very efficient way to control the soot emissions from gas turbines, even in the case of very difficult fuels such as HFOs.

5. Conclusions

This article has provided a review of soot emissions generated by gas turbines (GTs) and their possible reduction with fuel additives, which is the most efficient and viable option, when soot abatement is necessary.
After defining some key terminology relating to primary particles and PM, we showed that gas-fueled GTs generate insignificant, or even “negative”, amounts of particles, which means that the amount of particles leaving the GTs is lower than the amount entering it.
Then, we reported on three field trials conducted on GTs fueled with liquid fuels: distillate oil, heavy crude oil, and heavy fuel oil. Next, we analyzed the soot suppression mechanisms developed by iron- and cerium-based fuel additives. We highlighted the special electronic and thermodynamic properties of cerium, which explain its exceptional effectiveness as an anti-soot additive, particularly at high temperatures. We also detected and tentatively interpreted a surprising but explainable memory effect inside a heat recovery steam generator.
Interestingly, these test campaigns on gas turbines made it possible to reveal a lesser-known facet of the redox role of cerium in the reduction of soot, which is its activity both at medium and high temperatures.

Author Contributions

Conceptualization, M.V., M.A. and M.M.; methodology, M.A. and M.V.; software: no specific software was used; validation, J.-F.B.; formal analysis, M.V., M.A., J.-F.B. and M.M. investigation, M.M., M.V. and M.A.; resources, M.M., M.V. and M.A.; data curation, J.-F.B. and R.D.; writing—original draft preparation, M.M., M.V. and M.A.; writing—review and editing, all authors; visualization, M.M. and M.V.; supervision, M.A. and M.V.; Project administration, M.V.; funding acquisition, no external funding. All authors have read and agreed to the published version of the manuscript.

Funding

The reported field tests were financed by GE Vernova with no external funding.

Data Availability Statement

The data are part of the Intellectual Property of GE Vernova. Requests for additional information shall be addressed to the first corresponding author and will be handled by his company.

Conflicts of Interest

Authors M.V. and M.A. are GE Vernova employees. The remaining authors declare that the research was conducted in the absence of any commercial or financial relationships that could be construed as a potential conflict of interest.

Disclaimer

The information contained in the present article is provided in good faith. However, the organizations to which the authors belong make no representation or warranty of any kind, expressed or implied, regarding the accuracy, adequacy, validity, reliability or completeness of that information.

Appendix A. Exponential Decrease in Soot Concentration Versus Cerium Dosage

This appendix proposes only a short, high-level demonstration.
Let [St] and [Ce], respectively, represent the concentrations of soot and catalyst in the flame and τ the residence time in it.
Assuming a second order kinetics, we have
d S t d t = k   [ C e ]   [ S t ]
The catalyst being permanently regenerated by oxygen, [Ce], is constant. Hence,
d S t [ S t ] = k   C e   d t = c s t
So
ln S t t ln S t t = 0 = k   C e   τ
At a constant gas turbine load, the value of the residence time (τ) in the flame is a constant.
So, because S t   ( t = 0 ) is zero,
S t = e x p   { k C e }

References

  1. Best Available Techniques (BAT). Applicable to Industrial Emissions. Available online: http://eur-lex.europa.eu/legal-content/EN/TXT/?qid=1503383091262&uri=CELEX:32017D1442 (accessed on 10 July 2024).
  2. Shiozaki, S.; Fujii, T.; Takenaga, K.; Ozawa, M.; Yamada, A. Advances, in Power Boilers. In JSME Series in Thermal and Nuclear Power Generation, 1st ed.; Chapter 6—Gas Turbine Combined Cycle; Koizumi, Y., Okawa, T., Mori, S., Eds.; Elsevier: New York, NY, USA, 2021; Volume 2, pp. 305–344. [Google Scholar]
  3. Sarkar, D.K. (Ed.) Chapter 7—Gas Turbine and Heat Recovery Steam Generator. In Thermal Power Plant, Design and Operation; Elsevier: New York, NY, USA, 2015; pp. 239–283. [Google Scholar]
  4. Boyce, M.P. Combustors, Chapter 10. In Gas Turbine Engineering Handbook, 4th ed.; Elsevier: New York, NY, USA, 2012; pp. 427–490. [Google Scholar]
  5. Goldmeer, D.J. Fuel Flexible Gas Turbines as Enablers for a Low or Reduced Carbon Energy Ecosystem, GEA33861, Electrify Europe Whitepaper, Electrify Europe 2018 Congress, Vienna, Austria. 2018. Available online: https://www.gevernova.com/content/dam/gepower/global/en_US/documents/fuel-flexibility/GEA33861%20-%20Fuel%20Flexible%20Gas%20Turbines%20as%20Enablers%20for%20a%20Low%20Carbon%20Energy%20Ecosystem.pdf (accessed on 10 July 2024).
  6. Molière, M. The Fuel Flexibility of Gas Turbines: A Review and Retrospective Outlook. Energies 2023, 16, 3962. [Google Scholar] [CrossRef]
  7. Gülen, S.C. Gas Turbines for Electric Power Generation; Cambridge University Press: Cambridge, UK, 2019. [Google Scholar]
  8. Particulate Matter (PM) Basics. USEPA Publication. Available online: https://www.epa.gov/pm-pollution/particulate-matter-pm-basics (accessed on 10 July 2024).
  9. What Is Particle Pollution? USEPA Publication. Available online: https://www.epa.gov/pmcourse/what-particle-pollution (accessed on 10 July 2024).
  10. Cernuschi, S.; Giugliano, M.; Consonni, S. Emissions of Fine and Ultrafine Particles from Stationary Combustion Plants, Final Summary; Published 26 October 2010. Available online: https://www.cewep.eu/wp-content/uploads/2017/10/905_emissioni_di_polveri_fini_e_ultrafini_english_2012-04-16.pdf (accessed on 10 July 2024).
  11. Bessagnet, B.; Allemand, N.; Putaud, J.-P.; Couvidat, F.; André, J.-M.; Simpson, D.; Pisoni, E.; Murphy, B.N.; Thunis, P. Emissions of Carbonaceous Particulate Matter and Ultrafine Particles from Vehicles—A Scientific Review in a Cross-Cutting Context of Air Pollution and Climate Change. Appl. Sci. 2022, 12, 3623. [Google Scholar] [CrossRef] [PubMed]
  12. EU Air Quality Standards. EU Publication. Available online: https://environment.ec.europa.eu/topics/air/air-quality/eu-air-quality-standards_en (accessed on 10 July 2024).
  13. Yang, H.H.; Lee, K.T.; Hsieh, Y.S.; Luo, S.W.; Li, M.S. Filterable and Condensable Fine Particulate Emissions from Stationary Sources. Aerosol Air Qual. Res. 2014, 14, 2010–2016. [Google Scholar] [CrossRef]
  14. Cipriano, M.; Couchot, M.; Poulleau, J.; Jund, L.; Moliere, M. Joint investigation of particle emission at the exhaust of a gas turbine. In Proceedings of the CEM Conference, Zurich, Switzerland, 5–7 October 2007. [Google Scholar]
  15. Cipriano, D.; Vierling, M.; Moliere, M.; Poulleau, J.; Le Louër, P.; Jund, L.; Fiani, E. Balance of micropollutants emitted by gas fired combustion turbines. In Proceedings of the CEM Conference, Stresa, Italy, 5–7 May 2009. [Google Scholar]
  16. Cipriano, D.; Vierling, M.; Moliere, M.; Poulleau, J.; Le Louër, P.; Jund, L.; Fiani, E. Emission of micropollutants from industrial combustion plants: Effect of fuel type, plant configuration and site typology. In Proceedings of the CEM Conference, Prague, Czech Republic, 5–7 October 2011. [Google Scholar]
  17. Method 5—Particulate Matter (PM). USEPA Publication. Available online: https://www.epa.gov/emc/method-5-particulate-matter-pm (accessed on 10 July 2024).
  18. EN 13284-1:2017; Stationary Source Emissions—Determination of Low Range Mass Concentration of Dust—Part 1: Manual Gravimetric Method. European Standardization Organization: Brussels, Belgium, 2017. Available online: https://standards.iteh.ai/catalog/standards/cen/39eb0f35-645e-460b-993c-6ff2a69af16c/en-13284-1-2017 (accessed on 10 July 2024).
  19. Veranth, J.M.; Fletcher, T.H.; Pershing, D.W.; Sarofim, A.F. Measurement of soot and char in pulverized coal fly ash. Fuel 2000, 79, 1067–1075. [Google Scholar] [CrossRef]
  20. Appleyard, D. Power Plant Filtration Technology to Achieve Environmental Performance. Available online: https://www.powerengineeringint.com/coal-fired/filtering-out-power-plant-emissions (accessed on 10 July 2024).
  21. Zhao, X.; Tan, H.; Yang, F.; Deng, S. Field Studies on the Removal Characteristics of Particulate Matter and SOx in Ultra-Low Emission Coal-Fired Power Plant. Energy Eng. 2022, 119, 49–62. [Google Scholar] [CrossRef]
  22. Miyamoto, N.; Hou, Z.; Harada, A.; Ogawa, H.; Murayama, T. Characteristics of Diesel Soot Suppression with Soluble Fuel Additives. SAE Trans. Reciprocation Engines Spark Ignition Diesel 1987, 96, 792–798. [Google Scholar]
  23. Banús, E.D.; Ulla, M.A.; Miró, E.E.; Milt, V.G. Chapter 5: Structured Catalysts for Soot Combustion for Diesel Engines. In Diesel Engine—Combustion, Emissions and Condition Monitoring; Bari, S., Ed.; Intechopen: London, UK, 2013; Available online: https://www.intechopen.com/books/2432 (accessed on 10 July 2024).
  24. Meloni, E.; Palma, V. Most Recent Advances in Diesel Engine Catalytic Soot Abatement: Structured Catalysts and Alternative Approaches. Catalysts 2020, 10, 745. [Google Scholar] [CrossRef]
  25. Song, J.; Wang, J.; Boehman, A.L. The role of fuel-borne catalyst in diesel particulate oxidation behavior. Combust. Flame 2006, 146, 73–84. [Google Scholar] [CrossRef]
  26. Zhang, Y.; Lou, D.; Tan, P.; Hu, Z.; Fang, L. Effect of catalyzed diesel particulate filter and its catalyst loading on emission characteristics of a non-road diesel engine. J. Environ. Sci. 2023, 126, 794–805. [Google Scholar] [CrossRef]
  27. Liu, J.; Wu, P.; Sun, P.; Ji, Q.; Zhang, Q.; Wang, P. Effects of iron-based fuel borne catalyst addition on combustion, in-cylinder soot distribution and exhaust emission characteristics in a common-rail diesel engine. Fuel 2021, 290, 120096. [Google Scholar] [CrossRef]
  28. Smooke, M.D.; Long, M.B.; Connelly, B.C.; Colket, M.B.; Hall, R.J. Soot formation in laminar diffusion flames. Combust. Flame 2005, 143, 613–628. [Google Scholar] [CrossRef]
  29. Saito, K.; Gordon, A.S.; Williams, F.A.; Stickle, W.F. A Study of the Early History of Soot Formation in Various Hydrocarbon Diffusion Flames. Combust. Sci. Technol. 1991, 80, 103–119. [Google Scholar] [CrossRef]
  30. Wagner, H.G. Soot Formation in Combustion. Int. Symp. Combust. 1979, 17, 3–19. [Google Scholar] [CrossRef]
  31. Stanmore, B.R.; Brilhac, J.F.; Gilot, P. The oxidation of soot: A review of experiments, mechanisms and models. Carbon 2001, 39, 2247–2268. [Google Scholar] [CrossRef]
  32. Xi, J.; Yang, G.; Cai, J.; Gu, Z. A Review of Recent Research Results on Soot: The Formation of a Kind of Carbon-Based Material in Flames. Front. Mater. 2021, 8, 695485. [Google Scholar] [CrossRef]
  33. Michelsen, H.A.; Colket, M.B.; Bengtsson, P.E.; D’Anna, A.; Desgroux, P.; Haynes, B.S.; Miller, J.H.; Nathan, G.J.; Pitsch, H.; Wang, H. A Review of Terminology Used to Describe Soot Formation and Evolution under Combustion and Pyrolytic Conditions. ACS Nano 2020, 14, 12470–12490. [Google Scholar] [CrossRef]
  34. Frenklach, M.; Mebel, A.M. On the mechanism of soot nucleation. Phys. Chem. Chem. Phys. 2020, 22, 5314–5331. [Google Scholar] [CrossRef]
  35. Park, S.H. Simulation of the Formation and Growth of Soot Aerosol Particles in a Premixed Combustion Process Using a Soot Aerosol Dynamics Model. Atmosphere 2022, 13, 847. [Google Scholar] [CrossRef]
  36. Curinao, J.; Cepeda, F.; Escudero, F.; Dworkin, S.B.; Demarco, R. Understanding soot formation: A comprehensive analysis using reactive models in Inverse Non-Premixed Flames. Combust. Flame 2024, 267, 113569. [Google Scholar] [CrossRef]
  37. Kim, D.C.; Song, K.C.; Kaushik, R.D. Fuel Additives for Particulate Matter/Dust Reduction. Asian J. Chem. 2008, 20, 5797–5817. [Google Scholar]
  38. Howard, J.B.; Kausch, W.J. Soot control by fuel additives. Prog. Energy Combust. Sci. 1980, 6, 263–276. [Google Scholar] [CrossRef]
  39. Bramer, R. An Investigation of the Effectiveness of Smoke Suppressant Fuel Additives for Turbojet Engines. Ph.D. Thesis, Naval Postgraduate School, Monterey, CA, USA, October 1982. [Google Scholar]
  40. Krugs, A.C. An Experimental Investigation of Soot Behavior in a Gas Turbine Combustor. Ph.D. Thesis, Naval postgraduate School of Monterey, Monterey, CA, USA, June 1983. [Google Scholar]
  41. Geiger, F.; Molière, M. Gas Turbines in Alternative Fuel Applications: The Utilization of Highly Aromatic Fuels in Power Generation. In Proceedings of the ASME Turbo Expo Conference, Paper GT2007-53272. Vienna, Austria, 14–17 June 2004. [Google Scholar]
  42. Binnewies, M.; Milke, E. Thermochemical Data of Elements and Compounds, 2nd ed.; Willey-VCH: Hannover, Germany, 2002. [Google Scholar]
  43. Sata, T.; Yoshimura, M.J. Some Material Properties of Cerium Sesquioxide. Ceram. Assoc. Jpn. 1968, 76, 116–122. [Google Scholar] [CrossRef]
  44. Perrichon, V.; Laachir, A.; Abouarnadasse, S.; Touret, O.; Blanchard, C. Thermal stability of a high surface area ceria under reducing atmosphere. Appl. Catal. A Gen. 1995, 129, 69–82. [Google Scholar] [CrossRef]
  45. Muroyama, H.; Asajima, H.; Hano, S.; Matsui, T.; Eguchi, K. Effect of an additive in a CeO2-based oxide on catalytic soot combustion. Appl. Catal. A Gen. 2015, 489, 235–240. [Google Scholar] [CrossRef]
  46. Retailleau, L.; Vonarb, R.; Perrichon, V.; Jean, E.; Bianchi, D. Catalytic Oxidation of a Diesel Soot Formed in the Presence of a Cerium Additive. I. Characterization of the Cerium Fraction Using Magnetic Susceptibility and Temperature-Programmed Desorption. Energy Fuels 2004, 18, 872–882. [Google Scholar] [CrossRef]
  47. Poston, J.A.; Siriwardane, B.V.; Fisher, E.P.; Miltz, A.L. Thermal decomposition of the rare earth sulfates of cerium(III), cerium(IV), lanthanum(III) and samarium(III). Appl. Surf. Sci. 2003, 214, 83–102. [Google Scholar] [CrossRef]
  48. Tagawa, H.H. Thermal decomposition temperatures of metal sulfates. Thermochim. Acta 1984, 80, 23–33. [Google Scholar] [CrossRef]
  49. Gross, M.S.; Ulla, M.A.; Querini, C.A. Diesel particulate matter combustion with CeO2 as catalyst. Part I: System characterization and reaction mechanism. J. Mol. Catal. A Chem. 2012, 352, 86–94. [Google Scholar] [CrossRef]
  50. Krishna, K.; Bueno-López, A.; Makkee, M.; Moulijn, J.A. Potential rare earth modified CeO2 catalysts for soot oxidation: I. Characterisation and catalytic activity with O2. J. Catal. 2005, 230, 237–248. [Google Scholar] [CrossRef]
  51. van Setten, B.A.; Makkee, M.; Moulijn, J.A. Science and Technology of Catalytic Diesel Particulate Filter. Catal. Rev. 2001, 43, 489–564. [Google Scholar] [CrossRef]
  52. Kim, H.D.; Wi, S.I.; Stalder, J.P. Daesan Combined Cycle Power Plant: Successful Operating Experience on Low Sulphur Waxy Residual Fuel Oil. In Proceedings of the ASME Turbo Expo Conference, Paper 2001-GT-0074. New Orleans, LA, USA, 4–7 June 2001. [Google Scholar]
Figure 1. Typical sketch of GT equipped with an HSRG (gas turbine combined cycle (GTCC) or cogeneration installation).
Gases 04 00023 g001
Figure 2. Typical GT combustor with diffusion flames and reverse air flow.
Gases 04 00023 g002
Figure 3. Sketch of individual PM. Notes: Soot particles are represented as spherical for convenience; relative sizes are not considered.
Gases 04 00023 g003
Figure 4. Schematic effects of injecting a combustion catalyst on soot and ash emissions. (a): General trend; (b): Effect when additive dosage is increased.
Gases 04 00023 g004
Figure 5. SEM picture of particles collected at points 1 and 2: filter fibers are 0.3 µm thick: larger particles are about 1 µm; smaller particles (left picture) are probably nano sized [15].
Gases 04 00023 g005
Figure 6. Plots of soot emissions fuel versus (a) Ce(III), (b) Ce(IV) and (c) Fe(III) dosages (No. 2 distillate oil).
Gases 04 00023 g006
Figure 7. Plots of soot emission versus Ce(III), Ce(IV) and Fe(III) dosages (heavy crude oil).
Gases 04 00023 g007
Figure 8. Images and microanalysis of soot: (a) hollow cenospheres—(b) EDAX analysis: (b1) electron micrograph and distributions of: (b2) cerium; (b3) sulfur; (b4) carbon; (b5) oxygen.
Gases 04 00023 g008
Figure 9. “Memory effect” of cerium (HSRG present downstream of GT)—HFO run.
Gases 04 00023 g009
Figure 10. Plots of soot emissions versus Ce(III), Ce(IV) and Fe(III) dosages (heavy fuel oil).
Gases 04 00023 g010
Figure 11. Simplified soot formation mechanism for (a) No. 2 distillate oil, (b) HCO and (c) HFO.
Gases 04 00023 g011
Figure 12. The two possible reaction routes followed by three different hydrocarbons in a flame.
Gases 04 00023 g012
Figure 13. Free enthalpy of iron reactions: (a) (Fe(III) auto-reduction); (b) (Fe(III) reduction by CO).
Gases 04 00023 g013
Figure 14. Chemical loop illustrating the catalytic effect of iron: this loop starts below 1485 °C.
Gases 04 00023 g014
Figure 15. Free enthalpy of cerium reactions: (a) Ce(IV) auto-reduction; (b) Ce(IV) reduction by CO.
Gases 04 00023 g015
Figure 16. Chemical loop illustrating the catalytic role of cerium at high temperature.
Gases 04 00023 g016
Figure 17. Illustration of soot oxidation process in absence and presence of oxidation catalyst (e.g., ceria).
Gases 04 00023 g017
Figure 18. Chemical looping involving CeO2−δ species during the MT oxidation mode, after [49]; with permission (nCeOx and nCeOx are variants of CeO2−δ).
Gases 04 00023 g018
Figure 19. Involvement of superoxide ions (O2) within a spill-over effect. Note: respective sizes of species are not respected.
Gases 04 00023 g019
Table 1. Comparison of the FP concentrations measured (i) in ambient air and (ii) at GT exhaust [15].
Site Typology:
Urban, Industrialized Area
Filterable Particles (FPs)
Averages of Several Measurements
Point 1: Ambient airWeekly average
Daily average
107 µg/Nm3
150 µg/Nm3
Point 2: GT exhaust12 h per measurement23 to 48 µg/Nm3
Table 2. Values of the different parameters governing the abatement effect: FP = FP0 × ek × [Metal].
Fuel Type/AdditiveFor Cerium(III)For Cerium(IV)For Iron(III)
No. 2 distillate oilFP0 = 4; k = −0.171FP0 = 4; k = −0.102FP0 = 4; k = −0.014
Heavy crude oilFP0 = 147; k = −0.037FP0 = 147; k = −0.031FP0 = 147; k = −0.015
Heavy fuel oilFP0 = 42; k = −0.036FP0 = 42; k = −0.020FP0 = 42; k = −0.007
Table 3. Reactions between oxides the of iron and soot.
(1)4 Fe3O4 + O2 → 6Fe2O3Oxidation of Fe(II,III) oxide to Fe(III) oxide
(2)3 Fe2O3 + C → 2 Fe3O4 + COReduction of Fe(III) oxide to Fe(II,III) oxide by soot particles
(3)2 CO + O2 → 2 CO2Oxidation of carbon monoxide downstream of flame front
Table 4. High-temperature reactions between the oxides of cerium and soot.
(4)2 Ce2O3 + O2 → 4 CeO2Oxidation of Ce(III) oxide to Ce(IV) oxide (ceria)
(5)2 CeO2 + C → Ce2O3 + COReduction of Ce(IV) oxide to Ce(III) oxide by soot particles
(3)2 CO + O2 → 2 CO2Oxidation of carbon monoxide downstream the flame front
Disclaimer/Publisher’s Note: The statements, opinions and data contained in all publications are solely those of the individual author(s) and contributor(s) and not of MDPI and/or the editor(s). MDPI and/or the editor(s) disclaim responsibility for any injury to people or property resulting from any ideas, methods, instructions or products referred to in the content.

