Article

Association of Treatment Status with Cytokine and sCTLA-4 Profiles in Rheumatoid Arthritis

by
Sonia Elia Ishaq
1,*,
Taban Kamal Rasheed
1 and
Niaz Albarzingi
2
1
Department of Biology, College of Science, Salahaddin University-Erbil, Erbil 44001, Kurdistan Region, Iraq
2
College of Medicine, Hawler Medical University, Erbil P.O. Box 178, Kurdistan Region, Iraq
*
Author to whom correspondence should be addressed.
Immuno 2026, 6(1), 10; https://doi.org/10.3390/immuno6010010
Submission received: 7 January 2026 / Revised: 25 January 2026 / Accepted: 26 January 2026 / Published: 28 January 2026

Abstract

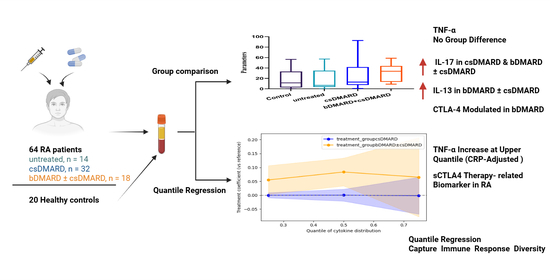
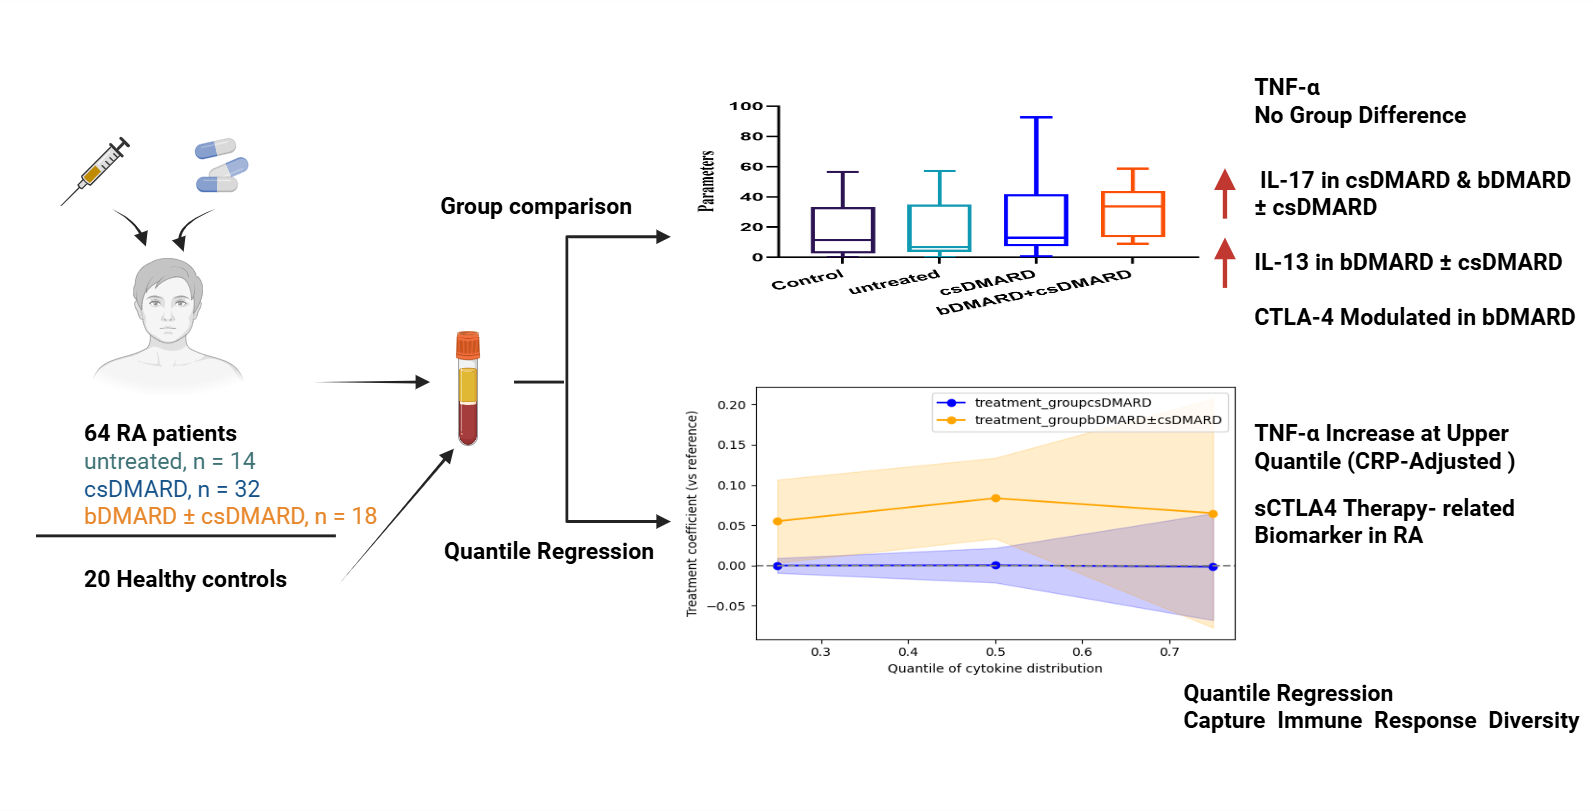
Rheumatoid arthritis (RA) is triggered by dysregulated cytokine networks, but the distributional association of conventional synthetic (csDMARDs) and biologic DMARDs (bDMARDs) with circulating mediators has not been fully described. In this study, we aimed to investigate the treatment-associated modulation of TNF-α, IL-17, IL-13, and soluble CTLA-4 (sCTLA-4) in 64 RA patients (untreated, n = 14; csDMARD, n = 32; bDMARD ± csDMARD, n = 18) and 20 controls. ELISA was used to determine the serum levels, and Kruskal–Wallis tests and false discovery rate correction were used to determine the differences between groups, accompanied by DAS28- and CRP-adjusted quantile regression. Group-level analysis demonstrated that the levels of IL-17 were higher in patients treated with csDMARDs and bDMARDs than in the controls (FDR-adjusted p = 0.0009 and <0.0001, respectively), and the levels of IL-13 were higher in patients treated with bDMARDs than in the controls (p = 0.026). However, quantile regression did not reveal consistent treatment-related associations, suggesting that long-term pathway-specific immune responses and context-dependent regulation may be involved. Smoking independently predicted higher IL-13 at lower quantiles (β = 35.5; p < 0.0001), while TNF-α showed treatment-related increases only at the upper quantile in CRP-adjusted models (β = 323.7; p = 0.049). On the other hand, sCTLA-4 had the largest and most significant treatment-based increase (p < 0.0001), regardless of disease activity, and constant effects across mid-quantiles. Taken together, these findings suggest that sCTLA-4 shows therapy-responsive distributional changes, supporting its potential utility as a biomarker of biological efficacy. In contrast, the observed increases in IL-17 and IL-13 reflect ongoing immune activity and possible environmental influences. Distribution-sensitive biomarker profiling provides a nuanced approach to capturing immune response diversity in RA and may enhance precision in monitoring procedures.

Graphical Abstract

1. Introduction

Rheumatoid arthritis (RA) is an autoimmune disorder that afflicts millions of people globally, characterized by continuous inflammation of the synovial membranes, gradual damage to joints, and considerable functional deficiency [1,2]. Its pathogenesis is marked by an intricate interrelationship between genetic and environmental factors, which leads to the formation of abnormal immunological stimulation in the synovial environment [3]. This immune dysregulation is rooted in the imbalance between pro-inflammatory and regulatory cytokines and results in diseases, sustained chronic inflammation, and joint degeneration [4,5].
RA treatment has improved over the past several decades. The primary treatment mode is still conventional synthetic disease-modifying antirheumatic drugs (csDMARDs); however, a significant number of patients also need biologic DMARDs (bDMARDs) due to an insufficient clinical response [6,7]. Despite these developments, the achievement of sustainable remission has been a problem for most patients, due to the fact that most patients show partial or no response [6,8,9]. This inconsistency underscores the significance of reliable biomarkers, which could be used to predict the treatment results and influence the creation of individual treatment strategies.
Immunological mediators involved in the pathophysiology of RA include the cytokines TNF-α, IL-17, and IL-13, as well as soluble cytotoxic T-lymphocyte-associated protein-4 (sCTLA-4). TNF-α and IL-17 play a leading role in the pathogenesis of the synovial inflammation and erosion of the joints, and IL-13 possesses more contextual regulatory characteristics. Furthermore, sCTLA-4 is a checkpoint immune molecule that reports the changes in the T-cell co-stimulatory pathways [10,11].
The status of treatment and its role in changing the cytokine and sCTLA-4 profiles are essential to explain the therapeutic response and to determine biomarkers that predict disease activity and progression. In this study, we measured the serum concentrations of TNF-α, IL-17, IL-13, and sCTLA-4 in untreated patients and those receiving csDMARDs or bDMARD ± csDMARD therapy. We aimed to identify the variations in these mediators among therapeutic strategies and to emphasize those patterns in distribution that can be missed using traditional mean-based tests.

2. Methods

2.1. Patient Characteristics

This study was conducted according to the Declaration of Helsinki, and the Human Ethics Committee of the College of Science, Salahaddin University, granted the approval for the study (Approval No: 45/224; 7 May 2024). Patients were recruited consecutively between June and December 2024 at Rizgary Teaching Hospital and CMC Private Hospital in Erbil, and all participants provided written informed consent. Sixty-four patients with RA, identified based on the 2010 EULAR/ACR classification criteria, and twenty age- and sex-matched healthy controls were included. The patients were categorized into untreated, csDMARD-treated, and bDMARD ± csDMARD-treated.
The therapy regimens were in accordance with relevant guidelines. csDMARDs included methotrexate, taken either by mouth or subcutaneously at a dose of 7.5–25 mg weekly in combination with a folic acid supplement; leflunomide was given as an initial loading dose of 100 mg orally, once a day for three days in a row, and then as a maintenance dose of 10–20 mg orally once a day; and hydroxychloroquine was prescribed 200–400 mg daily. The bDMARDs were rituximab (1000 mg on day 1 and 15), followed by maintenance every 24 weeks or as clinically indicated, adalimumab (40 mg every 2 weeks), and etanercept (50 mg weekly or 25 mg every 2 weeks).
Exposure to treatment was determined by the following variables: duration of therapy with csDMARDs and bDMARDs, previous therapies received, and concomitant use of glucocorticoids and NSAIDs, which represent major confounders.
Patients who had other autoimmune diseases, active severe infection, or malignancy or who were pregnant were excluded.

2.2. Blood Sample Collection and Laboratory Analysis

Peripheral blood samples were obtained from each participant. Two milliliters were placed in EDTA tubes for ESR measurement using the Westergren method, while 3 milliliters were placed in clot-activator tubes, centrifuged at 3000 rpm for 10 min, and aliquoted for storage at −80 °C. The CRP was measured using a turbidimetric assay (Roche, Penzberg, Germany) with a detection limit of 0.1 mg/L. The rheumatoid factor was determined using an immunoturbidimetric assay (Roche, Germany) with a positivity threshold of 14 IU/mL, and anti-CCP antibodies were assessed using an electrochemiluminescence immunoassay with a positive threshold of 17 U/mL.

2.3. The Calculation of the Disease Activity Score

The severity of the disease was measured using the Disease Activity Score in 28 joints (DAS28), which included the number of swollen and tender joints; the ESR and the self-reported health of the patient were measured using the Visual Analogue Scale (VAS) [12]. A DAS28 score below 3.2 represents low disease activity, a score between 3.2 and 5.1 represents moderate disease activity, and a score above 5.1 represents high disease activity.

2.4. Determination of Serum Cytokines and Soluble CTLA-4

The levels of cytokines and sCTLA-4 in the serum were measured using a sandwich enzyme-linked immunosorbent assay (ELISA), following the instructions provided by the manufacturer (Wuhan Feiyue Biotechnology Co., Ltd., Wuhan, China). The lower limits of detection (LOD) were 9.38 pg/mL for TNF-α (range 15.6–1000 pg/mL), 0.8 pg/mL for IL-17 (range 1.56–100 pg/mL), 1.5 pg/mL for IL-13 (range 3–48 pg/mL), and 2.5 ng/mL for sCTLA-4 (range 5–80 ng/mL). The intra-assay coefficients of variation (CVs) and inter-assay CVs were less than 10% and 12%, respectively, which were in line with the kit specifications. The serum samples were stored at −80 °C and subjected to only one freeze–thaw cycle.
All ELISA concentrations were analyzed as obtained. Values that were below the manufacturer’s LOD were retained in the dataset to reduce bias. The proportion of sub-LOD values was 17% for IL-13 and 13% for IL-17. The levels of TNF-α were consistently within the validated detection range. Conversely, the sCTLA-4 values were entirely below the LOD of the manufacturer, and the distribution was dominated by undetected values. Values below the LOD were coded as <LOD for analysis, while truly missing data were recorded separately. Because the sCTLA-4 concentrations were entirely below the manufacturer’s LOD, the distribution was effectively zero-inflated and treated as censored observations in the quantile regression analyses.

2.5. Statistical Analysis

The non-normal distribution was assessed using Shapiro–Wilk, Kolmogorov–Smirnov, and D’Agostino–Pearson tests; therefore, the continuous variables are summarized as the medians with interquartile ranges (IQR). Between-group differences in cytokine and sCTLA-4 concentrations were evaluated using the Kruskal–Wallis test, followed by Dunn’s post hoc pairwise comparisons, with p values adjusted for multiple testing, using the two-stage linear step-up procedure of Benjamini, Krieger, and Yekutieli to control the false discovery rate (FDR).
Quantile regression analyses were conducted at the 25th, 50th, and 75th percentiles, employing the default identity link. The cytokine concentrations were analyzed on their original scale, with models adjusted for age, sex, disease duration, smoking status, and either CRP or DAS28, using untreated RA patients as the reference group. A p value less than 0.05 was considered to be statistically significant. GraphPad Prism 9.0 (GraphPad Software, San Diego, CA, USA) and R 4.2.2 (R Foundation for Statistical Computing, Vienna, Austria) were used to perform the analyses.

3. Results

3.1. Demographic and Clinical Characteristics

The research group comprised 64 RA patients (untreated n = 14; csDMARD n = 32; bDMARD ± csDMARD n = 18) and 20 healthy controls (Table 1). The average age of the untreated RA group was higher (mean 60.2 years) than the other groups (50.5 to 52.9 years), but the difference was not statistically significant (p = 0.072). A sex imbalance was observed (p = 0.048), where women were predominant in the untreated and csDMARD groups.
The systemic markers of inflammation were different between the study groups. The median CRP levels of all RA groups were much higher than the controls (p = 0.0003), with the highest median levels observed in patients receiving csDMARD (median 8.77 mg/L, IQR 2.59–14.56 mg/L). The DAS28 ESR scores showed no significant differences between the therapy groups (p = 0.208).
There were differences in autoantibodies based on therapeutic categories, as shown by an increase in RF positivity from 28.6% in untreated patients to 53.1% in csDMARD-treated and to 61.1% in bDMARD ± csDMARD-treated patients (p < 0.0001). Likewise, the anti-CCP positive rates increased from 14.3% among untreated subjects to 46.9% among those treated with csDMARD and to 50% among those treated with a combination of bDMARD and csDMARD (p = 0.0008).

3.2. Serum Cytokine and sCTLA-4 Levels Across RA Treatment Groups

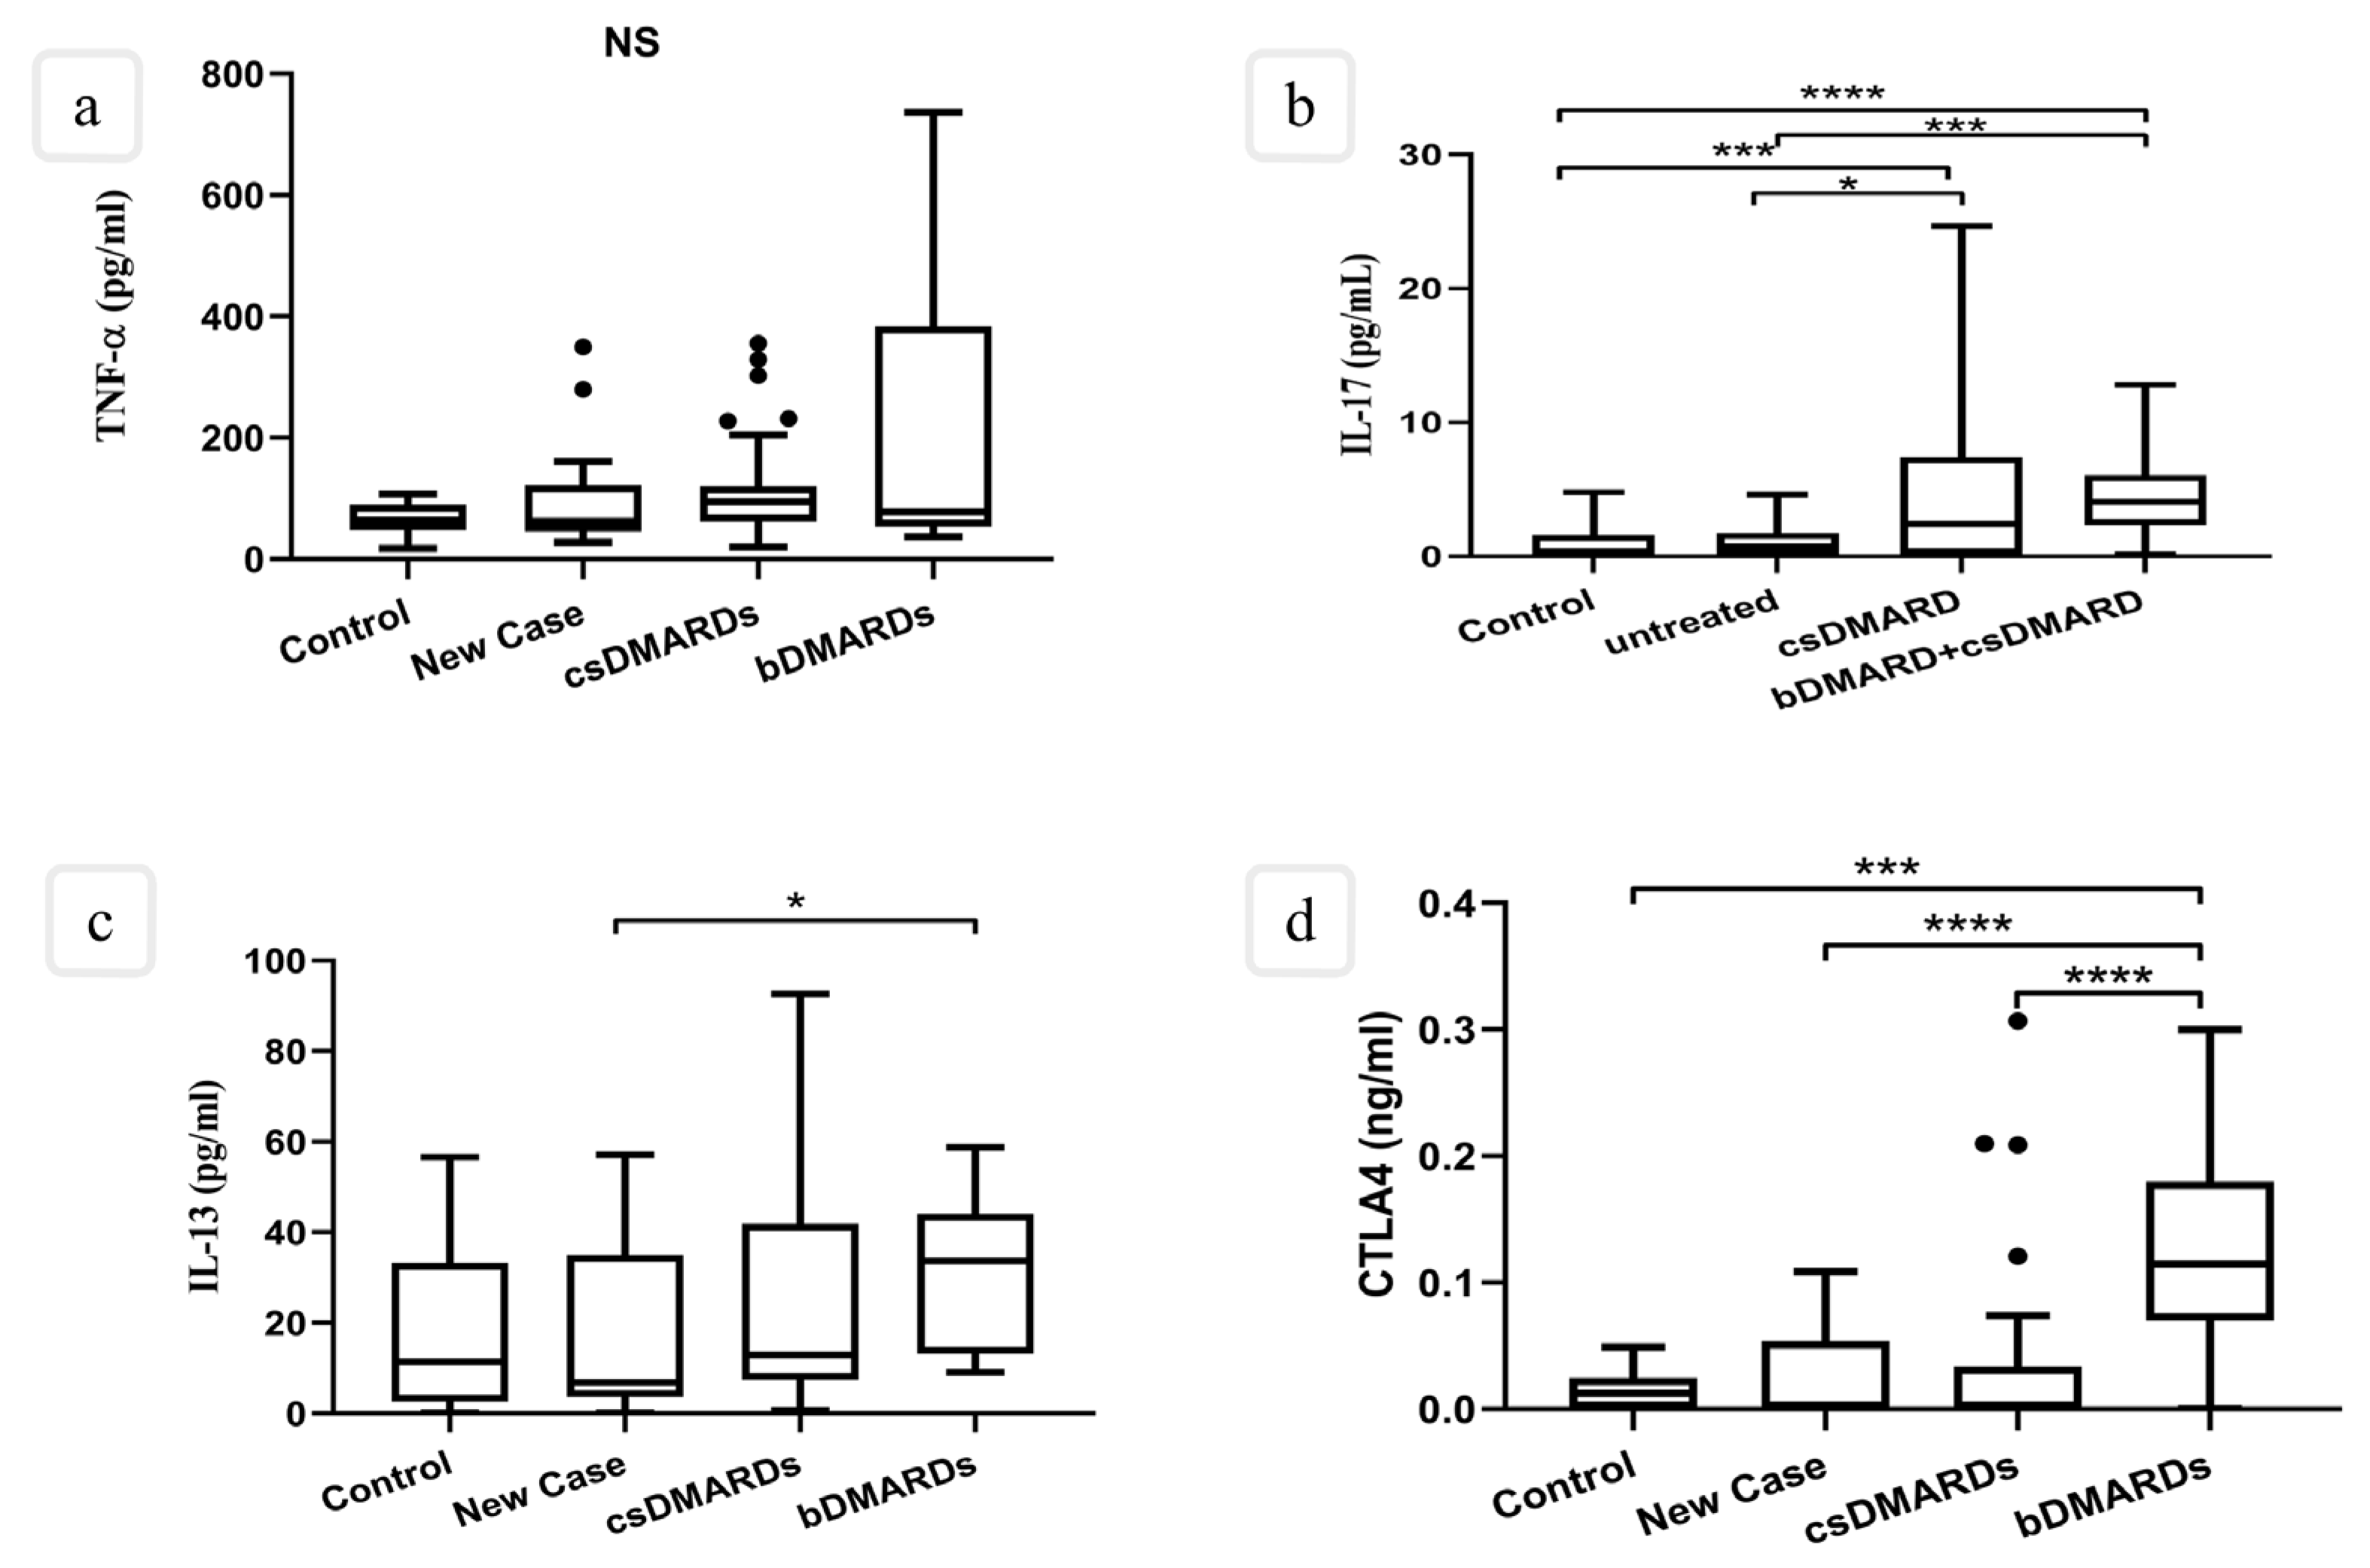
The serum cytokine levels varied significantly between groups, and the strongest deviation was found in IL-17, IL-13, and sCTLA-4 (Table 2; Supplementary Table S1; Figure 1). The false discovery rate (FDR) correction showed no difference between the RA cohorts and controls in terms of the levels of TNF-α. Pairwise comparisons revealed that all of the confidence intervals included zero, indicating that there was a large amount of inter-individual variation and that the distribution of the cytokine responses in RA patients exhibited heterogeneity.
The level of IL-17 was significantly increased in the treated RA patients compared to both untreated patients and healthy controls. The difference in the median IL-17 levels between controls and the csDMARD group was 1.896 pg/mL (FDR-adjusted p = 0.0009), while the difference between the controls and the bDMARD ± csDMARD group was 3.306 pg/mL (FDR-adjusted p = 0.0001). Similar increases were found in comparison with the untreated RA patients (csDMARD: 1.003 pg/mL, FDR-adjusted p = 0.0115; bDMARD + csDMARD: 3.222 pg/mL, FDR-adjusted p = 0.0009). This result suggests a sustained Th17-axis response in various forms of treatment modalities, which reveals that neither traditional nor biologic DMARD therapy can completely reverse the overexpression of IL-17.
IL-13 displayed a distinct treatment-specific pattern. Considerable differences were observed only in the bDMARD ± csDMARD patients, where the median difference was 11.33 pg/mL relative to the healthy controls (FDR-adjusted p = 0.026) and 11.49 pg/mL relative to the untreated RA patients (FDR-adjusted p = 0.026). No statistically significant difference was observed in the csDMARD group, which indicates that IL-13 increase is not a generalized RA-related cytokine response but a condition arising under the influence of biologic therapy.
sCTLA-4 exhibited the most prominent treatment-associated changes. The concentrations were markedly increased in the bDMARD ± csDMARD group compared with the controls (0.103 ng/mL, FDR-adjusted p < 0.0001), untreated patients (0.105 ng/mL, FDR-adjusted p < 0.0001), and csDMARD-treated patients (0.115 ng/mL, FDR-adjusted p < 0.0001). Conversely, the untreated and csDMARD groups were not significantly different than the controls. These data suggest sCTLA-4 to be the most closely linked biomarker to biologic therapy, suggesting its possible use as an immunoregulatory molecule that is sensitive to treatment.

3.3. Multivariable Quantile Regression Analysis of Cytokine and sCTLA-4 Distribution

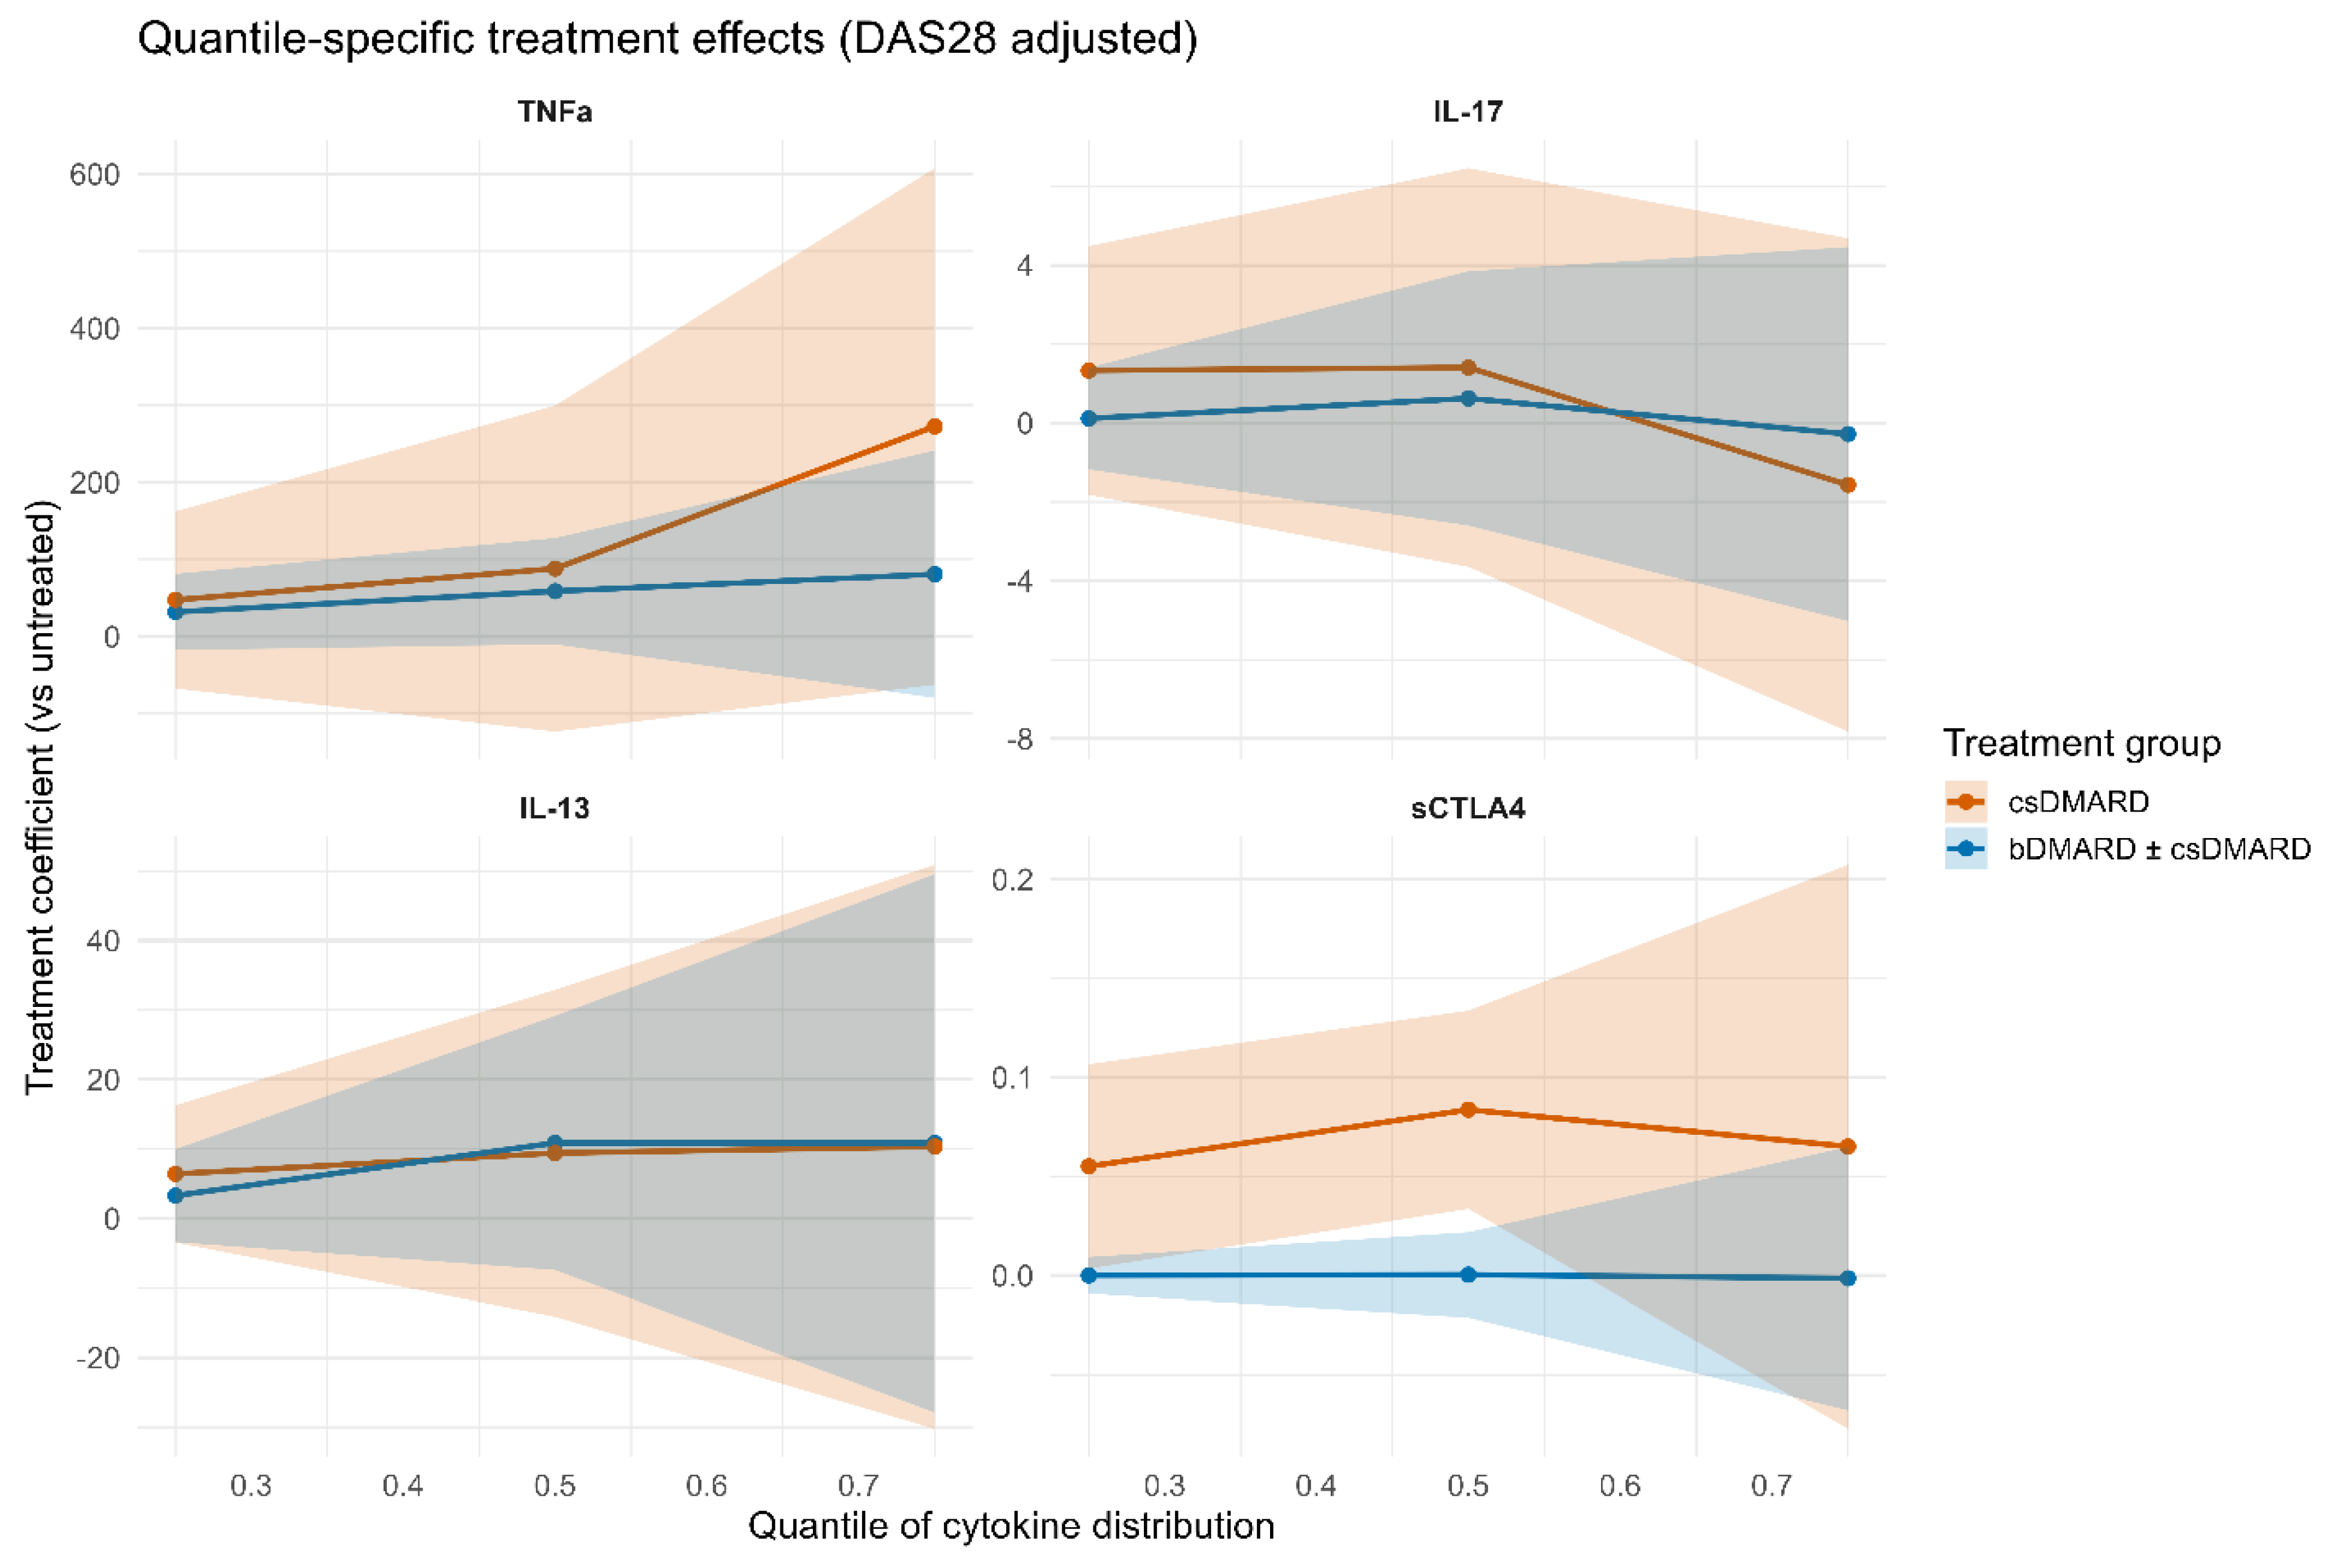
Quantile regression tests were performed to assess the distributional differences in cytokine and sCTLA-4concentrations across treatment groups, and the models were adjusted for the age, sex, duration of the disease, smoking status, and CRP or DAS28. Untreated patients were used as the reference group. The complete data are provided in Table 3 and Table S2, with the corresponding graphs shown in Figure 2 and Figure 3.
The association between the treatment group and TNF-α concentrations was evident only in the upper tail of the distribution. At the 75th quantile, bDMARD ± csDMARD therapy was significantly associated with higher TNF-α concentrations in the CRP-adjusted models (β = 323.7, 95% CI: 9.2–638.2, p = 0.049). CRP itself was also positively associated with TNF-α at this quantile (β = 3.34, 95% CI: 0.21–6.47, p = 0.041). However, treatment associations at the median and lower quantiles were not significant, and no relationship was detected in the DAS28-adjusted models, demonstrating the sensitivity of the distribution of TNF-α responses.
No significant treatment-related associations of IL-17 were observed across the quantiles; there was no relationship with either csDMARD or bDMARD therapy. At the 75th quantile, the DAS28-adjusted models showed a borderline inverse relationship with age (β = −0.264, 95% CI: −0.526 to −0.001, p = 0.054). However, this relationship did not reach conventional levels of statistical significance. Overall, IL-17 appeared resistant to modulation in DMARD therapy.
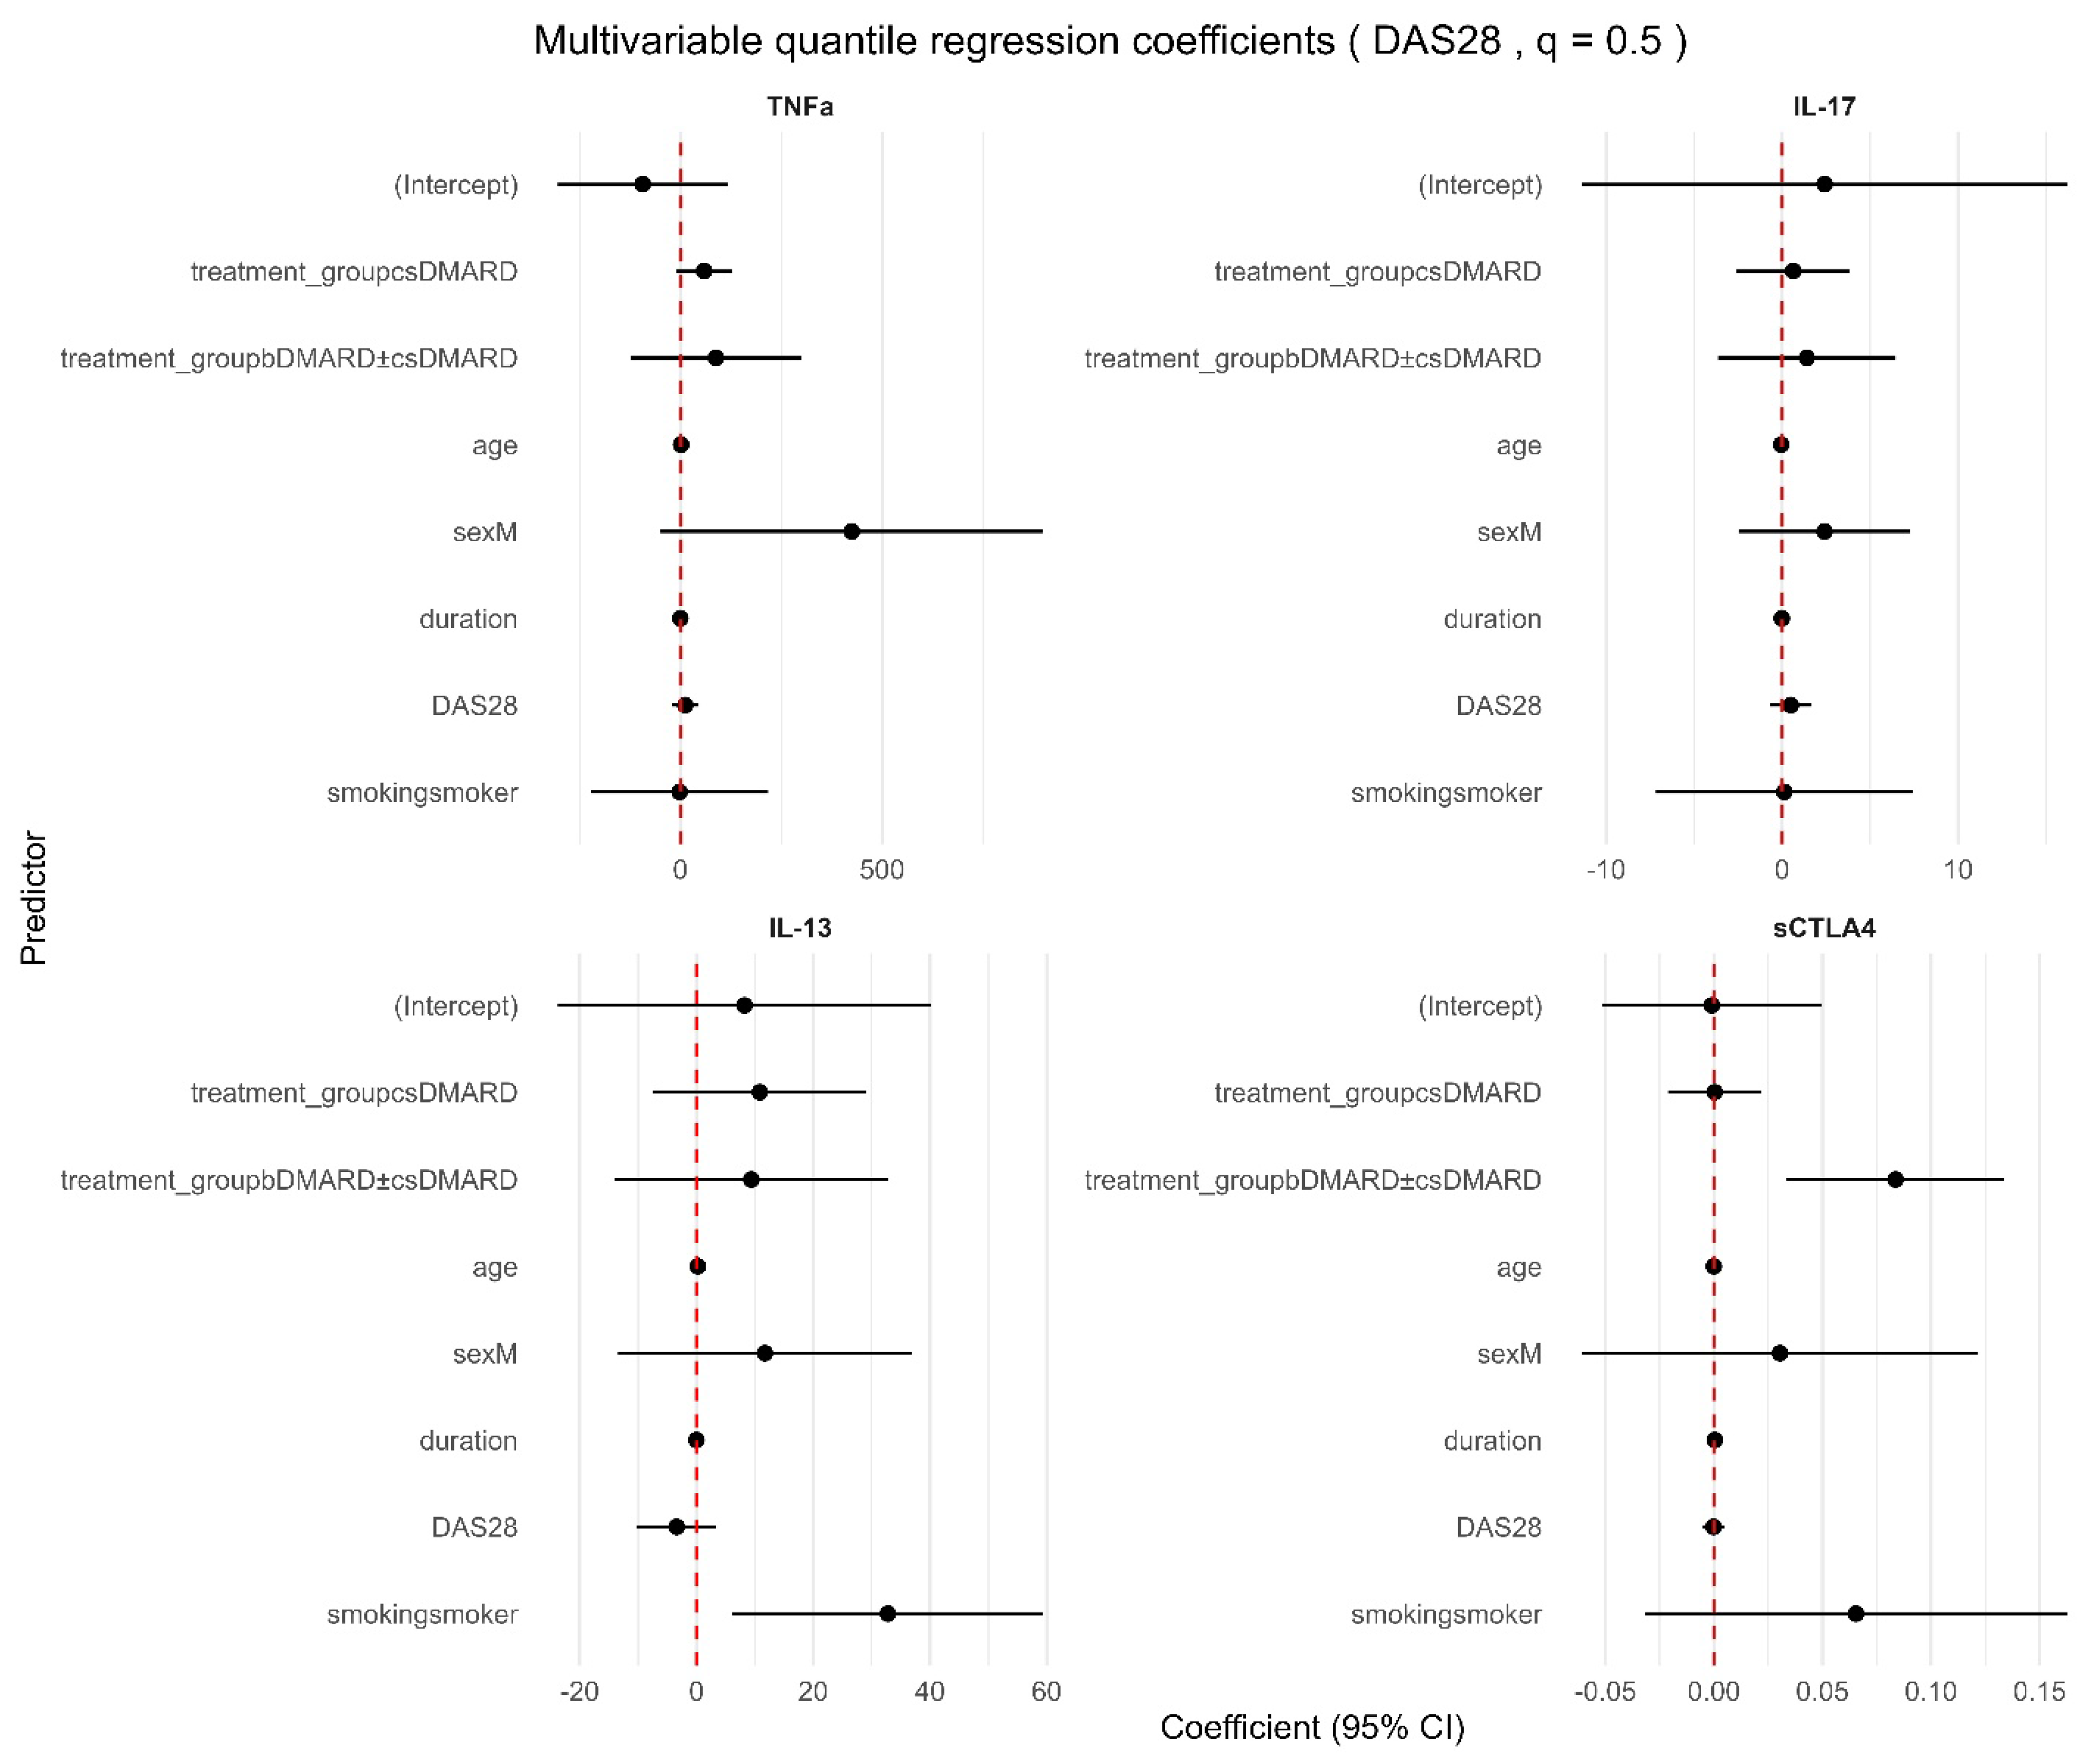
The IL-13 concentrations showed no significant association with csDMARD or bDMARD ± csDMARD therapy at any quantile in both the CRP- and DAS28-adjusted models. On the other hand, smoking was found to be a consistent predictor of the increase in IL-13, particularly in the 25th and 50th quantiles. This indicates that the level of IL-13 is mainly independent of DMARD treatment but is consistently influenced by the smoking status.
The sCTLA-4 concentrations were consistently increased in patients receiving bDMARD ± csDMARD therapy at the 25th and 50th quantiles in both the CRP- and DAS28-adjusted models. The CRP-adjusted analysis showed that the treatment was related to the elevated sCTLA-4 levels at the 25th quantile (β = 0.055, p = 0.037) and the 50th quantile (β = 0.083, p = 0.003). Similar results were replicated in the DAS28-adjusted models, with strong associations at the 25th quantile (β = 0.055, p = 0.042) and at the 50th quantile (β = 0.084, p = 0.002). No meaningful changes were detected at the 75th quantile, and the sCTLA-4 levels were not affected by csDMARD therapy.

4. Discussion

This study presents a combined evaluation of circulating cytokines and sCTLA-4 in untreated RA patients in individuals undergoing csDMARD therapy and in individuals undergoing bDMARD ± csDMARD therapy. Group comparisons together with multivariate quantile regression revealed treatment-related distributional patterns. These findings show that immune activation persists despite clinically effective treatment and highlights distinct immunological pathways that are affected by treatment and environmental factors.
The TNF-α levels did not show any significant difference between the groups after the FDR correction, although the clinical efficacy of the TNF inhibitors was likely to be recognized. Quantile regression showed significant treatment-related increases only at the 75th percentile, suggesting that systemic changes in TNF-α are mainly present only in individuals who had a high baseline level of inflammation. The CRP also showed comparable quantile-specific correlation. The findings confirm the hypothesis that TNF-α is the primary agent responsible for the harmful effect in the synovial milieu via localized paracrine and juxtacrine processes and not via systemic elevation [13,14]. Synovial macrophages and fibroblasts are known to play a crucial role in the production of TNF-α, stimulating osteoclastogenesis and RANKL expression and interfering with bone remodeling [15,16,17]. Although anti-TNF therapy is effective in inhibiting this local signaling, serum TNF-α is not always a predictor of disease severity or response to therapy [18,19,20]. As a result, peripheral TNF-α is still inadequate as a clinical monitoring biomarker.
IL-17 has been determined to be an important immunopathogenic factor of RA, which contributes to inflammation at the synovial level, osteoclast differentiation, and structural damage [21,22]. The serum IL-17 levels were distinctly more elevated in treated patients than in untreated and healthy controls, indicating persistent Th17 stimulation despite treatment. The continued production of IL-17 can be due to resident Th17 cells in the synovium, IL-23-sensitive amplification pathways, and long-lasting T-cell tissue-resident memory T-cells that survive despite systemic immunosuppression [23,24]. The long-term immunological stimulation and prolonged exposure to disease-modifying medication can contribute to the maintenance of these pathways, resulting in long-term IL-17 expression in people with controlled disease. This finding highlights the possible utility of IL-17-targeted therapy in RA, especially in patients who have Th17 dominance signatures, which have already been demonstrated to be useful in psoriatic arthritis and axial spondyloarthritis [25,26,27].
The absence of change in relation to treatment in the quantiles demonstrates that the current DMARD regimens are inadequate for suppressing IL-17 signaling. This is consistent with the previous findings, indicating that IL-17A and IL -17A/F heterodimers exhibit resistance to methotrexate, TNF inhibitors, and abatacept, even in the presence of clinical improvement [28,29]. Ongoing IL-17 modulation is thus indicative of partial immunological remission and not poor clinical control.
Patients receiving bDMARD therapy (with or without concurrent csDMARD therapy) showed specifically increased concentrations of IL-13, whereas untreated individuals and those on csDMARD monotherapy had similar concentrations to healthy individuals. This pattern at the group level implies that biologic therapy correlates with higher levels of IL-13, irrespective of the systemic burden of inflammation. However, quantile regression analyses adjusted for CRP and DAS28 did not demonstrate significant treatment effects throughout the distribution, suggesting that the observed rise signifies context-dependent immune regulation rather than a uniform or quantile-specific therapeutic response.
Smoking was determined to be an important variable affecting the IL-13 concentrations, with the quantile regression revealing higher concentrations at lower and middle percentiles. This observation demonstrates the impacts of environmental exposure on the systemic cytokine profiles in RA and has also demonstrated smoking cessation as a critical factor not only in overall health, but also in the restoration of immune balance and the characterization of treatment responses [30,31,32].
Previous investigations have provided inconsistent findings with respect to the IL-13 in RA, with some reporting an increase in serum and synovial fluid [33,34], some reporting a decrease in serum and synovial fluid following TNF inhibition [30], and some indicating no changes at all [35,36]. The identified discrepancies may indicate the difference in the duration of the disease, the exposition of the treatment, and the sampling situation. The evidence points to the fact that IL-13 may also be a context-dependent immunological signal that is affected by therapeutic and environmental factors and not a consistent biomarker of inflammatory disease activity, given the absence of significant treatment effects in the quantiles.
The sCTLA-4 levels were significantly elevated in patients undergoing bDMARD therapy compared to healthy controls, untreated individuals, and those obtaining csDMARD treatment. The observed result was still significant after adjusting the level for the DAS28, CRP, and demographic factors, thereby indicating that it is more likely to be a result of therapeutic intervention rather than indicative of the baseline severity of the disease. Moreover, quantile regression analyses showed that increases were evident at the 25th and 50th percentiles, indicating a general shift in the patient distribution without apparent differences at the extremes.
The previous research has shown inconsistent results. According to Cao et al. (2012), there was an increased level of sCTLA-4 linked to disease activity, and it decreased following leflunomide administration [37]. On the other hand, Garcasia Chagollan et al. (2020) detected higher levels of sCTLA-4 in untreated RA patients and in those with advanced disease [38]. These differences support the context-specific regulation of sCTLA-4, with particular emphasis on the importance of the distinction between immune regulation as a consequence of the therapeutic intervention process and immune regulation due to the underlying pathophysiology.
The upregulation of sCTLA-4 in bDMARD therapy, even in the absence of CTLA-4-Ig, is an intriguing observation. Instead of being a passive byproduct, sCTLA-4 can be a soluble feedback regulator of T-cell responses, as shown by Ward et al. [39], and future research should determine whether this effect indicates changes in T-cell or Treg activity in effectively suppressing inflammation.
Of the possible mediators, sCTLA-4 was found to be consistent and reproducible in biologic treatment, indicating that it could be more stable compared to traditional inflammatory markers. To determine whether the dynamics of sCTLA-4 can be used as predictors of therapeutic response, its durability, or desirable immune phenotypes, longitudinal studies are required to illustrate its potential as a treatment-responsive biomarker unlike conventional inflammatory mediators.

5. Conclusions

bDMARD ± csDMARD treatment was associated with a unique immunoregulatory response characterized by increased sCTLA-4, consistent with its potential role as a mechanistic biomarker of biologic activity. At the group level, the increases in IL-17 and IL-13 were consistent but variably distributed; the quantile regression showed that the changes were not homogenously induced during therapy, suggesting sustained pathway-specific immune activity. TNF-α was only increased in patients with a high inflammatory load, which highlights the diversity of immune reactions. Combined, these results suggest that biologic therapy is associated with a high sCTLA-4 state that coexists with differentially distributed cytokine activity, which can be further adjusted based on environmental factors such as smoking. Through this model, it is evident that distribution-sensitive biomarker profiling is necessary to inform precision monitoring in RA.

6. Limitations

There are a few limitations that should be considered. The cross-sectional study design does not allow causal inferences and the assessment of longitudinal alterations in cytokine profiles. Moreover, the subgroup sizes are relatively small, and this could limit the statistical power, particularly in the bDMARD ± csDMARD cohort. Notably, there were different agents with various mechanisms of action in this cohort (anti-TNF treatments, such as adalimumab and etanercept, and B-cell depletion treatment, such as rituximab). Although grouping was necessary to strengthen the analysis, future research should stratify according to the mechanism to determine whether the observed sCTLA-4 response is a class-wide effect or unique to some biologics. Nonetheless, this study gives a detailed distribution-sensitive analysis of treatment-based immune modulation. The presence of regular patterns among groups, as well as the quantile regression and covariate adjustment, strongly reinforces the reliability of the results. In order to confirm these findings and improve them, further research using larger samples and longitudinal samples will be necessary.

Supplementary Materials

The following supporting information can be downloaded at: https://www.mdpi.com/article/10.3390/immuno6010010/s1, Table S1: Serum cytokine and sCTLA4 concentrations in healthy controls and RA treatment cohorts; Table S2: Quantile regression results of cytokine (TNF α, IL 17, IL 13) and sCTLA 4 levels.

Author Contributions

All authors contributed equally to this manuscript. The collection of samples, processing of data, laboratory testing of serum, and manuscript drafting were conducted by S.E.I., T.K.R. and N.A. provided supervision, conducted critical revisions, and approved the final manuscript version. All authors have read and agreed to the published version of the manuscript.

Funding

This research received no external funding.

Institutional Review Board Statement

This study was conducted according to the Declaration of Helsinki, and the Human Ethics Committee of the College of Science, Salahaddin University, granted the approval for the study (Approval No: 45/224; 7 May 2024). Written informed consent was signed by each participant.

Informed Consent Statement

The authors affirm that all participants provided informed consent for publication.

Data Availability Statement

The data used and/or analyzed during the current study are available from the corresponding author upon reasonable request.

Acknowledgments

The authors wish to thank the University of Salahaddin for logistical support.

Conflicts of Interest

The authors report no conflicts of interest in this work.

References

  1. Wei, K.; Jiang, P.; Zhao, J.; Jin, Y.; Zhang, R.; Chang, C.; Xu, L.; Xu, L.; Shi, Y.; Guo, S.; et al. Biomarkers to predict DMARDs efficacy and adverse effect in rheumatoid arthritis. Front. Immunol. 2022, 13, 865267. [Google Scholar] [CrossRef] [PubMed]
  2. Pascual-García, S.; Martínez-Peinado, P.; López-Jaén, A.B.; Navarro-Blasco, F.J.; Montoyo-Pujol, Y.G.; Roche, E.; Peiró, G.; Sempere-Ortells, J.M. Analysis of novel immunological biomarkers related to rheumatoid arthritis disease severity. Int. J. Mol. Sci. 2023, 24, 12351. [Google Scholar] [CrossRef] [PubMed]
  3. Marasco, E.; Fabbriciani, G.; Rotunno, L.; Longhi, M.; De Luca, P.; de Girolamo, L.; Colombini, A. Identification of biomarkers in patients with rheumatoid arthritis responsive to DMARDs but with progressive bone erosion. Front. Immunol. 2023, 14, 1254139. [Google Scholar] [CrossRef] [PubMed]
  4. Salih, S.M.; Adam, S.A. Imbalance of Pro and Anti-Inflammatory Cytokines in Rheumatoid Arthritis in Iraqi Patients. J. Fac. Med. Baghdad 2024, 66, 388–392. [Google Scholar] [CrossRef]
  5. Malik, A.E.; Slauenwhite, D.; McAlpine, S.M.; Hanly, J.G.; Marshall, J.S.; Issekutz, T.B. Differences in IDO1+ dendritic cells and soluble CTLA-4 are associated with differential clinical responses to methotrexate treatment in rheumatoid arthritis. Front. Immunol. 2024, 15, 1352251. [Google Scholar] [CrossRef]
  6. Gremese, E.; Tolusso, B.; Petricca, L.; Di Mario, C.; Gigante, M.R.; Ferraccioli, G.; Alivernini, S. Peripheral blood CD4posCD25posFoxP3pos cells and inflammatory cytokines as biomarkers of response in rheumatoid arthritis patients treated with CTLA4-Ig. Arthritis Res. Ther. 2022, 24, 143. [Google Scholar] [CrossRef]
  7. Dua, A.B.; Ford, K.; Fiore, S.; Pappas, D.A.; Janak, J.C.; Blachley, T.; Roberts-Toler, C.; Emeanuru, K.; Kremer, J.M.; Kivitz, A. Clinical Outcomes in Patients with Rheumatoid Arthritis After Switching Between Interleukin-6-Receptor Inhibitors and Janus Kinase Inhibitors: Findings from an Observational Study. Rheumatol. Ther. 2023, 10, 1753–1768. [Google Scholar] [CrossRef]
  8. Radu, A.-F.; Bungau, S.G. Management of rheumatoid arthritis: An overview. Cells 2021, 10, 2857. [Google Scholar] [CrossRef]
  9. Šteigerová, M.; Šíma, M.; Slanař, O. Pathogenesis of Collagen-Induced Arthritis: Role of Immune Cells with Associated Cytokines and Antibodies, Comparison with Rheumatoid Arthritis. Folia Biol. 2023, 69, 41–49. [Google Scholar] [CrossRef]
  10. Brzustewicz, E.; Bzoma, I.; Daca, A.; Szarecka, M.; Bykowska, M.S.; Witkowski, J.M.; Bryl, E. Heterogeneity of the cytokinome in undifferentiated arthritis progressing to rheumatoid arthritis and its change in the course of therapy. Move toward personalized medicine. Cytokine 2017, 97, 1–13. [Google Scholar] [CrossRef]
  11. Zhong, G.; Chang, X.; Xie, W.; Zhou, X. Targeted protein degradation: Advances in drug discovery and clinical practice. Signal Transduct. Target. Ther. 2024, 9, 308. [Google Scholar] [CrossRef] [PubMed]
  12. Prevoo, M.; Van’THof, M.A.; Kuper, H.; Van Leeuwen, M.; Van De Putte, L.; Van Riel, P. Modified disease activity scores that include twenty-eight-joint counts development and validation in a prospective longitudinal study of patients with rheumatoid arthritis. Arthritis Rheum. Off. J. Am. Coll. Rheumatol. 1995, 38, 44–48. [Google Scholar] [CrossRef] [PubMed]
  13. Feldmann, M.; Brennan, F.M.; Maini, R.N. Role of cytokines in rheumatoid arthritis. Annu. Rev. Immunol. 1996, 14, 397–440. [Google Scholar] [CrossRef] [PubMed]
  14. Brennan, F.M.; McInnes, I.B. Evidence that cytokines play a role in rheumatoid arthritis. J. Clin. Investig. 2008, 118, 3537–3545. [Google Scholar] [CrossRef]
  15. Gilbert, L.; He, X.; Farmer, P.; Rubin, J.; Drissi, H.; van Wijnen, A.J.; Lian, J.B.; Stein, G.S.; Nanes, M.S. Expression of the osteoblast differentiation factor RUNX2 (Cbfa1/AML3/Pebp2αA) is inhibited by tumor necrosis factor-α. J. Biol. Chem. 2002, 277, 2695–2701. [Google Scholar] [CrossRef]
  16. Takayanagi, H. Osteoimmunology and the effects of the immune system on bone. Nat. Rev. Rheumatol. 2009, 5, 667–676. [Google Scholar] [CrossRef]
  17. Komatsu, N.; Takayanagi, H. Mechanisms of joint destruction in rheumatoid arthritis—Immune cell–fibroblast–bone interactions. Nat. Rev. Rheumatol. 2022, 18, 415–429. [Google Scholar] [CrossRef]
  18. Paramalingam, S.S.; Thumboo, J.; Vasoo, S.; Thio, S.T.; Tse, C.; Fong, K.-Y. In vivo pro-and anti-inflammatory cytokines in normal and patients with rheumatoid arthritis. Ann. Acad. Med. Singap. 2007, 36, 96–99. [Google Scholar] [CrossRef]
  19. Khan, I.H.; Krishnan, V.V.; Ziman, M.; Janatpour, K.; Wun, T.; Luciw, P.A.; Tuscano, J. A comparison of multiplex suspension array large-panel kits for profiling cytokines and chemokines in rheumatoid arthritis patients. Cytom. Part B Clin. Cytom. J. Int. Soc. Anal. Cytol. 2008, 76, 159–168. [Google Scholar] [CrossRef]
  20. Manhal, F.S. Cytokine profile in patients with rheumatoid arthritis. J. Fac. Med. Baghdad 2009, 51, 433–436. [Google Scholar] [CrossRef]
  21. Kotake, S.; Udagawa, N.; Takahashi, N.; Matsuzaki, K.; Itoh, K.; Ishiyama, S.; Saito, S.; Inoue, K.; Kamatani, N.; Gillespie, M.T.; et al. IL-17 in synovial fluids from patients with rheumatoid arthritis is a potent stimulator of osteoclastogenesis. J. Clin. Investig. 1999, 103, 1345–1352. [Google Scholar] [CrossRef] [PubMed]
  22. Byravan, S.; Samarasinghe, H.; Yuan, J.S.J.; Tahir, S.H.; Moorthy, A.; Tahir, H. From bench to bedside—Is there a role of IL-17 drugs in rheumatoid arthritis? Expert Opin. Investig. Drugs 2024, 33, 591–600. [Google Scholar] [CrossRef] [PubMed]
  23. Robert, M.; Miossec, P. IL-17 in rheumatoid arthritis and precision medicine: From synovitis expression to circulating bioactive levels. Front. Med. 2019, 5, 364. [Google Scholar] [CrossRef] [PubMed]
  24. Selimov, P.; Karalilova, R.; Damjanovska, L.; Delcheva, G.; Stankova, T.; Stefanova, K.; Maneva, A.; Selimov, T.; Batalov, A. Rheumatoid arthritis and the proinflammatory cytokine IL-17. Folia Med. 2023, 65, 53–59. [Google Scholar] [CrossRef]
  25. McGonagle, D.G.; McInnes, I.B.; Kirkham, B.W.; Sherlock, J.; Moots, R. The role of IL-17A in axial spondyloarthritis and psoriatic arthritis: Recent advances and controversies. Ann. Rheum. Dis. 2019, 78, 1167–1178. [Google Scholar] [CrossRef]
  26. Sarrand, J.; Baglione, L.; Bouvy, C.; Soyfoo, M. Bimekizumab in the Treatment of Axial Spondyloarthritis and Psoriatic Arthritis: A New Kid on the Block. Int. J. Mol. Sci. 2025, 26, 2315. [Google Scholar] [CrossRef]
  27. Lee, S.Y.; Biddle, K.; Lee, C.; Humby, F.; Kirkham, B. P168 Real-world experience of IL-17 inhibitors in ankylosing spondylitis and psoriatic arthritis, including intra-class drug switching. Rheumatology 2025, 64, keaf142.205. [Google Scholar] [CrossRef]
  28. Jain, M.; Attur, M.; Furer, V.; Todd, J.; Ramirez, R.; Lock, M.; Lu, Q.A.; Abramson, S.B.; Greenberg, J.D. Increased plasma IL-17F levels in rheumatoid arthritis patients are responsive to methotrexate, anti-TNF, and T cell costimulatory modulation. Inflammation 2015, 38, 180–186. [Google Scholar] [CrossRef]
  29. Sikorska, D.; Rutkowski, R.; Łuczak, J.; Samborski, W.; Witowski, J. No effect of anti-TNF-α treatment on serum IL-17 in patients with rheumatoid arthritis. Cent. Eur. J. Immunol. 2018, 43, 270–275. [Google Scholar] [CrossRef]
  30. Tokayer, A.; Carsons, S.E.; Chokshi, B.; Santiago-Schwarz, F. High levels of interleukin 13 in rheumatoid arthritis sera are modulated by tumor necrosis factor antagonist therapy: Association with dendritic cell growth activity. J. Rheumatol. 2002, 29, 454–461. [Google Scholar]
  31. Chang, K.; Yang, S.M.; Kim, S.H.; Han, K.H.; Park, S.J.; Shin, J.I. Smoking and rheumatoid arthritis. Int. J. Mol. Sci. 2014, 15, 22279–22295. [Google Scholar] [CrossRef] [PubMed]
  32. Masuko, K. Cigarette smoking: A modifiable environmental factor in the pathogenesis of rheumatoid arthritis. JMA J. 2025, 8, 1077–1086. [Google Scholar] [CrossRef] [PubMed]
  33. Isomäki, P.; Luukkainen, R.; Toivanen, P.; Punnonen, J. The presence of interleukin-13 in rheumatoid synovium and its antiinflammatory effects on synovial fluid macrophages from patients with rheumatoid arthritis. Arthritis Rheum. Off. J. Am. Coll. Rheumatol. 1996, 39, 1693–1702. [Google Scholar] [CrossRef] [PubMed]
  34. Spadaro, A.; Rinaldi, T.; Riccieri, V.; Valesini, G.; Taccari, E. Interleukin 13 in synovial fluid and serum of patients with psoriatic arthritis. Ann. Rheum. Dis. 2002, 61, 174–176. [Google Scholar] [CrossRef]
  35. Barra, L.; Summers, K.; Bell, D.; Cairns, E. Serum cytokine profile of unaffected first-degree relatives of patients with rheumatoid arthritis. J. Rheumatol. 2014, 41, 280–285. [Google Scholar] [CrossRef]
  36. Azizieh, F.Y.; Al Jarallah, K.; Shehab, D.; Gupta, R.; Dingle, K.; Raghupathy, R. Patterns of circulatory and peripheral blood mononuclear cytokines in rheumatoid arthritis. Rheumatol. Int. 2017, 37, 1727–1734. [Google Scholar] [CrossRef]
  37. Cao, J.; Zou, L.; Chen, P.; Zhang, L. Increased production of circulating soluble co-stimulatory molecules CTLA-4, CD28 and CD80 in patients with rheumatoid arthritis. Int. Immunopharmacol. 2012, 14, 585–592. [Google Scholar] [CrossRef]
  38. García-Chagollán, M.; Ledezma-Lozano, I.Y.; Hernández-Bello, J.; Sánchez-Hernández, P.E.; Gutiérrez-Ureña, S.R.; Muñoz-Valle, J.F. Expression patterns of CD28 and CTLA-4 in early, chronic, and untreated rheumatoid arthritis. J. Clin. Lab. Anal. 2020, 34, e23188. [Google Scholar] [CrossRef]
  39. Ward, F.J.; Dahal, L.N.; Wijesekera, S.K.; Abdul-Jawad, S.K.; Kaewarpai, T.; Xu, H.; Vickers, M.A.; Barker, R.N. The soluble isoform of CTLA-4 as a regulator of T-cell responses. Eur. J. Immunol. 2013, 43, 1274–1285. [Google Scholar] [CrossRef]
Figure 1. Serum concentrations of (a) TNF-α, (b) IL-17, (c) IL-13, and (d) sCTLA-4 in healthy controls and patients with RA; the latter were stratified into untreated, csDMARD-treated, and biologic bDMARD + csDMARD-treated groups. Statistical significance was defined as FDR-adjusted p < 0.05 (*); p < 0.001 (***); and p < 0.0001 (****); NS = not significant.
Immuno 06 00010 g001
Figure 2. Quantile regression analysis of cytokine and sCTLA-4 levels comparing csDMARD and bDMARD ± csDMARD therapy with untreated patients. The estimated treatment coefficients are shown for TNF-α, IL-17, IL-13, and sCTLA-4 at the 0.25, 0.5, and 0.75 quantiles, with adjustments made for DAS28. Associations of csDMARD and bDMARD ± csDMARD therapy with markers are presented in relation to the untreated group. The estimated coefficients are represented as solid lines, and the 95% confidence intervals are represented as shaded bands. The presence of coefficients higher than zero implies more significant concentrations, whereas the presence of coefficients lower than zero implies lower concentrations compared with untreated patients.
Immuno 06 00010 g002
Figure 3. Multivariable quantile regression coefficients for TNF-α, IL-17, IL-13, and soluble CTLA-4 (sCTLA-4) concentrations at the median (q = 0.5). The treatment group (csDMARD and bDMARD ± csDMARD) was the key exposure of regression models, and it was adjusted according to age, sex, the duration of illness, DAS28, and smoking status. Black points refer to the estimated coefficients with 95% confidence intervals, and the red dashed line represents the null value (coefficient = 0).
Immuno 06 00010 g003
Table 1. Demographic and clinical characteristics of patients and controls.
VariablesControls
n = 20
Untreated (n = 14)csDMARD
(n = 32)
bDMARD ± csDMARD (n = 18)p Value
Age (mean ± SD)50.50 ± 11.6360.19 ± 8.3451.88 ± 14.1652.90 ± 11.270.0725
Female, n (%)16 (80%)14 (100%)31 (96.9%)14 (77.8%)0.0481 *
Smoking, n (%)0 (0%)0 (0%)1 (3.1%)3 (16.6%)0.0572
Family history of RA, n (%)--10 (57.1%)13 (40.6%)11 (61.1)0.1135
RA duration (years)
median (IQR)
--8.5 (3–14.25)8 (2.25–14.5)12.5 (7.25–18.75)0.1853
CRP mg/L
median (IQR)
1.215 (0.897–2.435)3.300 (1.77–19.13)8.770 (2.595–14.56)2.815 (1.428–8.318)0.0003 ***
DAS28 ESR
median (IQR)
--5.01 (4.243–5.800)4.370 (3.748–5.173)4.530 (2.613–5.370)0.2081
RF positive, n (%) 0 (0%)4 (28.6%)17 (53.1%)11 (61.1%)<0.0001 ****
Anti-CCP positive, n (%)0 (0%)2 (14.3%)15 (46.9%)9 (50%)0.0008 ***
Depending on the distribution, continuous variables are presented as the mean ± standard or median [interquartile range]. Categorical variables are provided in the form of counts (percentages). The Kruskal–Wallis test was used to compare the four groups for continuous variables, and the Fisher test was used to compare the groups for the categorical variables. Statistical significance was defined as p < 0.05 (*); p < 0.001 (***); and p < 0.0001 (****).
Table 2. Serum cytokine and sCTLA4 concentrations in healthy controls and RA treatment groups.
VariablesControls
n = 20
Untreated (n = 14)CsDMARD
(n = 32)
bDMARD ± csDMARD (n = 18)p Value
TNF-α (pg/mL)63.64 (47.99–90.27)62.28 (45.48–122.5)95.05 (61.96–120.4)77.55 (53.90–383.6)0.094
IL-17 (pg/mL)0.154 (0.125–1.581)0.734 (0.134–1.740)2.402 (0.154–7.396)4.071 (2.329–6.065)<0.0001 ****
IL-13 (pg/mL)11.45 (2.654–33.21)6.908 (3.657–34.98)12.93 (7.452–41.87)33.59 (13.23–44.020.018 *
sCTLA-4 (ng/mL)0.012 (0–0.024)0 (0–0.053)0 (0–0.033)0.115 (0.070–0.180)<0.0001 ****
Variables are presented as the median [interquartile range]. Overall group differences were assessed using the Kruskal–Wallis test; the p values presented in this table correspond to unadjusted overall comparisons. The false discovery rate (FDR)-adjusted p values, calculated using the two-stage linear step-up procedure of Benjamini, Krieger, and Yekutieli to control multiplicity across cytokines and sCTLA-4, derived from Dunn’s post hoc pairwise contrasts, are reported in the Results section and detailed in Supplementary Table S1. Statistical significance was defined as FDR-adjusted p < 0.05 (*) and p < 0.0001 (****).
Table 3. Median regression estimates (τ = 0.5) of serum cytokine and sCTLA-4 concentrations by treatment group, adjusted for DAS28.
VariablesTreatment GroupRegression Coefficient (β) (95% CI)p Value
TNF-α (pg/mL)csDMARD58.61 (−10.29–127.51)0.102
bDMARD ± csDMARD87.93 (−123.65–299.52)0.419
IL-17 (pg/mL)csDMARD0.63 (−2.60–3.85)0.705
bDMARD ± csDMARD1.41 (−3.65–6.47)0.587
IL-13 (pg/mL)csDMARD10.86 (−7.42–29.14)0.250
bDMARD ± csDMARD9.40 (−14.11–32.91)0.437
sCTLA-4 (ng/mL)csDMARD0.00 (−0.02–0.02)0.978
bDMARD ± csDMARD0.08 (0.03–0.13)0.002 **
The regression models were adjusted for age, sex, disease duration, DAS28, and smoking status. The untreated patients served as the reference group. The regression coefficients (β) indicate variation at the median (τ = 0.5). Statistical significance was defined as p < 0.01 (**).
Disclaimer/Publisher’s Note: The statements, opinions and data contained in all publications are solely those of the individual author(s) and contributor(s) and not of MDPI and/or the editor(s). MDPI and/or the editor(s) disclaim responsibility for any injury to people or property resulting from any ideas, methods, instructions or products referred to in the content.