Article

Indole-3-Carbinol Enhances Alternative Activation of Macrophages via AHR Pathway and Glucose Transporter Regulation

by
Delara Omrani
1,†,
Saeed Mohammadi
2,3,†,
Moein Malekzadeh
1,
Mohsen Saeidi
4,
Fakhri Sadat Seyedhosseini
5,
Ahmed Al-Harrasi
2,* and
Yaghoub Yazdani
6,*
1
Department of Immunology, Faculty of Medicine, Golestan University of Medical Sciences, Gorgan 49341-74515, Iran
2
Natural and Medical Sciences Research Center, University of Nizwa, P.O. Box 33, Nizwa PC 616, Oman
3
Golestan Research Center of Gastroenterology and Hepatology, Golestan University of Medical Sciences, Gorgan 49341-74515, Iran
4
Stem Cell Research Center, Golestan University of Medical Sciences, Gorgan 49341-74515, Iran
5
Department of Internal Medicine, School of Medicine, Golestan University of Medical Sciences, Gorgan 49341-74515, Iran
6
Laboratory Sciences Research Center, Golestan University of Medical Sciences, Gorgan 49341-74515, Iran
*
Authors to whom correspondence should be addressed.
These authors contributed equally to this work.
Immuno 2025, 5(2), 15; https://doi.org/10.3390/immuno5020015
Submission received: 5 March 2025 / Revised: 25 April 2025 / Accepted: 30 April 2025 / Published: 2 May 2025
(This article belongs to the Section Innate Immunity and Inflammation)

Abstract

Disruption in macrophage polarization is linked to inflammatory diseases and metabolic disorders. Our study aimed to investigate how AHR activation by I3C and TCDD could impact glucose transporters and macrophage phenotypes and functions in human macrophages. Human monocyte-derived macrophages (hMDMs) and THP-1 cell-derived macrophage-like cells were treated for 24 h with 100 ng/mL LPS, 100 nM TCDD, and 10 ng/µL I3C. CYP1A1 and CYP1B1 expression was significantly increased in the I3C and TCDD treatments, with CYP1B1 showing a higher fold change in I3C compared to TCDD. The AHRR expression was the highest in the TCDD group. For macrophage polarization, I3C significantly elevated CD163 expression while reducing CD16 and CD86, indicative of M2-like polarization. Additionally, I3C promoted ARG1 expression and reduced NOS2 levels, while TCDD increased NOS2. A cytokine analysis revealed I3C-induced upregulation of IL-10 and TGF-β, while TCDD significantly elevated TNF-α and IL-12. I3C upregulated glucose transporter genes (GLUT1, GLUT3, GLUT6), in contrast to the downregulation observed in TCDD-treated cells. Our findings demonstrated that I3C distinctly modulates AHR activation genes, macrophage polarization, cytokine expression, and glucose transporter levels in THP-1 cells compared to the TCDD and LPS treatments. Our findings suggest that I3C favors an anti-inflammatory M2-like macrophage polarization coupled with enhanced metabolic activity.

1. Introduction

Macrophages, key mediators of innate immunity found in all tissues with significant anatomical and functional diversity, are highly adaptable cells that rapidly respond to pathogens or tissue damage to initiate or regulate inflammation [1]. Macrophages demonstrate exceptional plasticity, allowing them to adapt their phenotype in response to various environmental cues. Depending on their surrounding microenvironment, they adopt either the pro-inflammatory M1 or the anti-inflammatory M2 phenotype [2]. Triggered by inflammatory signals, macrophages express the M1 phenotype via transcription factors such as nuclear factor kappa B (NF-κB) and signal transducer and activator of transcription 1 (STAT1) for pro-inflammatory type 1 immune responses, while interleukins 4 (IL-4) and 13 (IL-13) induce the M2 phenotype for type 2 immune responses, wound healing, and tumor progression, involving STAT6 and interferon regulatory factor 4 (IRF4) [3]. Although M1 and M2 macrophages have their own characteristics and functions, they can be dynamically interconverted [4]. Disruption of macrophage polarity is a key factor in the pathogenesis of many inflammatory diseases, including cancer, autoimmune disorders, metabolic diseases, and chronic infections [5]. In metabolic diseases such as diabetes, the balance shifts toward inflammatory M1 macrophages, with their polarization and function controlled by metabolic pathways, emerging the concept of “immunometabolism” [6,7]. Therefore, discovering new compounds or signaling pathways that can effectively polarize macrophages toward the M2 phenotype could offer therapeutic benefits.
In recent years, the field of immunometabolism has emerged as an interesting framework for understanding how metabolic pathways regulate immune cell function and phenotype. Macrophages exemplify this concept, with M1-like macrophages primarily relying on glycolysis and the pentose phosphate pathway, while M2-like macrophages depend more on oxidative phosphorylation (OXPHOS) and fatty acid oxidation for energy production. This metabolic programming supports their functional roles [8]. Accordingly, metabolic reprogramming is associated with changes in glucose transporter expression, such as GLUT1 and GLUT3, which enhance glucose uptake in M1 macrophages, and potentially other transporters like GLUT6, whose roles are still being clarified [9].
Glucose metabolism and glucose transporters (GLUTs) are crucial in determining macrophages’ function, with GLUT1 and GLUT3 facilitating glucose uptake, especially in M1 polarization, where increased GLUT1 can enhance glycolysis and pentose phosphate pathway activity [10,11]. While the precise role of glucose transporters in macrophage polarization is unclear, LPS-stimulated M1 macrophages showed increased GLUT6 expression, though deletion of GLUT6 did not impact the glucose uptake, glycolysis, or cytokine production in these cells [10]. Glucose is converted to glucose-6-phosphate (G6P), which supports ATP production via glycolysis or enters the pentose phosphate pathway for cytokine and fatty acid synthesis. LPS-stimulated M1 macrophages switch to glycolysis for rapid ATP production, sustaining their defense response [12]. In M1 macrophages, most glucose is converted to lactate, with minimal oxidation through the Krebs cycle, which is disrupted at isocitrate dehydrogenase and succinate dehydrogenase. This disruption leads to the release of citrate and succinate into the cytosol, stimulating inflammation. Citrate is converted to acetyl-CoA for fatty acid and prostaglandin synthesis, while oxaloacetate produces NADPH, crucial for NO and ROS production. In contrast, M2 macrophages maintain an intact Krebs cycle [13,14,15].
Studies indicated that environmental factors and endogenous molecules can influence macrophage function and immune responses via the aryl hydrocarbon receptor (AHR) pathway, a ligand-activated transcription factor expressed in several organs, including immune cells. AHR can play a key regulatory role in both metabolic and immune processes [16,17]. AHR ligands are diverse and include compounds such as indole-3-carbinol (I3C), a plant-derived agonist with anti-inflammatory properties, commonly found in cruciferous vegetables, such as broccoli and cabbage [18]. In Mohammadi et al.’s study, the anti-inflammatory effects of I3C were observed in macrophages of systemic lupus erythematosus (SLE) patients, leading to a shift in macrophage phenotype toward M2 [19]. Some exogenous AHR ligands, such as TCDD, present in various environmental pollutants, activate the AHR pathway, stimulating genes that produce pro-inflammatory cytokines and promoting the M1 macrophage phenotype, which is linked to immune system damage, cancer, and endocrine diseases [20]. However, the potential of plant-derived AHR ligands such as I3C to influence macrophage glucose metabolism and contribute to immunometabolic reprogramming remains underexplored.
Regarding the role of AHR in regulating macrophage immune responses and its relationship with glucose metabolism, including its interaction with glucose in other cell types, this study aimed to explore how AHR activation by I3C and TCDD could affect glucose transporters, phenotypes, and functions in human monocyte-derived macrophages (hMDMs) and macrophages derived from THP-1 cells.

2. Materials and Methods

2.1. Cell Culture Studies and Treatments

THP-1 cells (ATCC: TIB-202), obtained from the Pasteur Institute of Iran (Tehran, Iran), were cultured in RPMI 1640 medium (Gibco, Carlsbad, CA, USA) containing 10% fetal bovine serum (FBS, Gibco, USA) and 1% antibiotics (penicillin 100 units/mL and streptomycin 100 µg/mL; Gibco, USA). The cells were incubated at 37 °C with 95% humidity and 5% CO₂. The cells were differentiated into macrophage-like cells using 5 ng/mL phorbol 12-myristate 13-acetate (PMA; Sigma-Aldrich, St. Louis, MO, USA) and 50 µM 2-mercaptoethanol (2ME; Sigma-Aldrich, USA). LPS (Escherichia coli O111:B4; Sigma-Aldrich) was used at a concentration of 100 ng/mL for 24 h. The THP-1 cells were differentiated for 48 h with PMA, after which the medium was replaced with fresh PMA-free RPMI 1640 containing 10% FBS. The cells were then incubated for an additional 24 h to allow for the recovery and reduction in residual PMA-induced activation before the experimental treatments. For the flow cytometry analysis, the adherent cells were gently detached using Accutase (Innovative Cell Technologies, San Diego, CA, USA), followed by washing and resuspension in PBS supplemented with 2% FBS. All steps were carried out at 4 °C or on ice to preserve the cell viability and surface marker integrity. All experiments were conducted at the Immunology Laboratory of Golestan University of Medical Sciences (GoUMS).
Peripheral blood mononuclear cells (PBMCs) were isolated from human whole blood samples from six healthy donors using Histopaque density gradient centrifugation (Sigma-Aldrich, USA), as previously described [19]. The monocytes were then separated from the PBMCs using an optimized attachment method. The cells were plated in T-25 tissue culture flasks and incubated for 3 h at 37 °C in a humidified atmosphere of 5% CO₂ to allow for monocyte adherence. Non-adherent cells, including lymphocytes, were removed by washing with warm PBS, and the adherent cells were subsequently detached using Accutase (Innovative Cell Technologies, USA). To differentiate the monocytes into macrophages, the cells were seeded into 6-well plates at a density of 10⁶ cells per well and treated with 50 ng/mL macrophage colony-stimulating factor (M-CSF) (Abclonal Technology, Woburn, MA, USA) for 4 days, with the culture medium replenished every 2 days, being polarized to an uncommitted (M0) state.
Macrophages (both generated from THP-1 cells and human monocytes) were treated in different groups for 24 h on 106 cells per well in 6-well tissue culture plates (SPL Life Sciences, Pocheon, Republic of Korea): untreated controls (NT), 100 ng/mL lipopolysaccharide (LPS; Sigma-Aldrich, USA), 100 nM 2,3,7,8-tetrachlorodibenzo-p-dioxin (TCDD; Sigma-Aldrich, USA), and 10 ng/µL indole-3-carbinol (I3C; Sigma-Aldrich, USA). The treatment concentrations were selected based on our previously published studies [19,21].

2.2. RNA Extraction and Real-Time RT-PCR

The total RNA was extracted from treated and non-treated macrophages using the TRIzol reagent (Thermo Fisher Scientific, Waltham, MA, USA), following the previously optimized protocol [22]. The RNA concentration and purity were measured using a spectrophotometer (NanoDrop, Thermo Scientific, Wilmington, DE, USA), and the RNA samples were stored at −80 °C for subsequent analysis. The complementary DNA (cDNA) was synthesized from the extracted RNA (500 ng) using a cDNA synthesis kit (Yekta Tajhiz, Tehran, Iran) after DNase I (Thermo Fisher Scientific, USA) treatment using random primers. The gene expression levels were quantified using real-time reverse transcription-polymerase chain reaction (RT-PCR). PCR reactions were prepared using specific exon junction primers for CYP1A1, CYP1B1, ARG1, IL-12B, AHRR, NOS2, IL-10, GLUT1, GLUT3, and GLUT6 (Table 1). The PCR mixtures were prepared with the SYBR Green master mix (Yekta Tajhiz, Tehran, Iran), which included ROX as a passive reference dye. The amplification cycles were performed on an ABI StepOnePlus real-time PCR machine (Applied Biosystems, Foster City, CA, USA). The relative expression levels were calculated using the 2−ΔΔCt method, normalizing gene expression to GAPDH as a reference gene and comparing it to the NT control samples.

2.3. Flow Cytometric Evaluation of Surface Markers

The expression of the surface markers CD86, CD16, and CD163 on THP-1-derived macrophage-like cells was analyzed using flow cytometry. After harvesting, the cells were washed twice with warm PBS and resuspended in staining buffer (BioLegend, San Diego, CA, USA). They were then incubated with the fluorochrome-conjugated monoclonal antibodies anti-CD86 (FITC-conjugated, BioLegend, USA), anti-CD16 (PE-conjugated, BioLegend, USA), and anti-CD163 (PerCP-Cy5.5-conjugated, BioLegend, USA) at the manufacturer’s recommended concentrations. The staining was performed at 4 °C for 30 min in the dark to prevent photobleaching. Following staining, the cells were washed to remove any unbound antibodies and resuspended in PBS. The samples were then acquired using a BD Accuri C6 flow cytometer (BD Biosciences, San Jose, CA, USA). Compensation controls, isotype controls, and fluorescence-minus-one (FMO) controls were used to set appropriate gates and correct for any spectral overlap. Initial gating was applied based on forward scatter (FSC) and side scatter (SSC) to select single, viable macrophage-sized cells. Doublets were excluded using FSC-A vs. FSC-H gating. Marker-specific gates were set based on matched isotype control histograms to determine the positivity thresholds for CD16, CD86, and CD163. Unstained controls were used during acquisition for instrument voltage adjustment and gate verification. All flow cytometry procedures were conducted on ice and in PBS with 2% FBS to preserve the cell surface integrity. Data were collected as a percentage of positive cells and then analyzed using the FlowJo software (version 10.7.1, FlowJo, Ashland, OR, USA). The final data are presented as histograms.

2.4. Cytokine Assays

Cytokine concentrations, including TNF-α and TGF-β, in the cell culture supernatants were quantified using an enzyme-linked immunosorbent assay (ELISA) kits (Zellbio, Lonsee, Baden-Württemberg, Germany). Specifically, the kits used were as follows: TNF-α ELISA kit (ZB-10082C-H9684, sensitivity: 12.5 pg/mL) and TGF-β-1 ELISA kit (ZB-13051C-H9648, sensitivity: 12.5 pg/mL). The optical density was measured using a StatFax 2100 microplate reader (Awareness Technology, Palm City, FL, USA) at the mentioned wavelength, and the cytokine concentrations were determined by comparison with a standard curve using a four-parameter logistic (4PL) regression.

2.5. Statistical Analysis

Data analysis was conducted using the SPSS software version 26.0 (IBM Corp., Armonk, NY, USA), GraphPad Prism version 9.0 (GraphPad Software, Boston, MA, USA), and Microsoft Excel version 16.0 (Microsoft Corp., Redmond, WA, USA). The normality of the data distributions was evaluated using the Shapiro–Wilk test. Based on the results of this test, appropriate statistical methods were selected for the analysis. For data that followed a normal distribution (p-value > 0.05), parametric tests were employed; a student’s t-test was used for comparisons between two groups, while a one-way analysis of variance (ANOVA) was utilized for comparisons across multiple groups. In cases where the data did not follow a normal distribution, non-parametric methods were applied; specifically, the Kruskal–Wallis test was used for comparisons among more than two groups. All experiments were conducted in six separate replicates, with a p-value of less than 0.05 considered as the threshold for significance.

3. Results

3.1. Expression of AHR Activation Genes (CYP1A1, CYP1B1, and AHRR) in Response to I3C, TCDD, and LPS

As shown in Figure 1, the expression of AHR activation genes (CYP1A1, CYP1B1, and AHRR) in THP-1 cells treated with I3C and TCDD was accomplished. The results demonstrated that CYP1A1 expression was significantly elevated in the I3C group (FC = 6.35 ± 1.59) compared to the NT group (p < 0.05). The TCDD group (FC = 7.86 ± 4.4) showed a 7.86-fold increase compared to the NT group (p < 0.01). The expression of CYP1A1 in the LPS group was 3.5 ± 1.73, which was significantly lower than the TCDD group (p < 0.05). The increase in CYP1A1 expression was not significant between the TCDD and I3C groups (p > 0.05) (Figure 1A). We also demonstrated that CYP1B1 expression in the I3C group was significantly elevated (6.77 ± 1.49) compared to the NT group (p < 0.0001). The TCDD group showed a 3.2 ± 0.82-fold increase compared to the NT group (p < 0.01). The LPS group exhibited a fold change of 2.26 ± 0.33, which was higher than the NT group and significantly lower than the I3C group (p < 0.001). Moreover, CYP1B1 expression was higher in the I3C group compared to the TCDD group (p < 0.01) (Figure 1B). Our results also indicated that AHRR expression in the I3C group was 2.08 ± 0.56. The TCDD group exhibited a 9.87 ± 5.6-fold increase compared to the NT group (p < 0.001). The LPS group showed a fold change of 6.95 ± 2.36, which was markedly higher than the NT control (p < 0.05). Furthermore, AHRR expression was lower in the I3C group compared to the TCDD group (p < 0.001) and the LPS group (p < 0.05) (Figure 1C).
We also evaluated the expression of AHR-associated genes in MDMs. As shown in Figure 1D, the expression of CYP1A1 in MDMs was significantly elevated in the I3C group (FC = 4.34 ± 1.23) compared to the NT group (p < 0.01). The TCDD group (FC = 6.00 ± 1.89) showed a 6.00-fold increase compared to the NT group (p < 0.0001). The expression of CYP1A1 in the LPS group (FC = 2.50 ± 0.89) was significantly lower than in the TCDD group (p < 0.01) but higher than in the NT group (p < 0.05). However, the increase in CYP1A1 expression was not significant between the TCDD and I3C groups (p > 0.05) (Figure 1D). For CYP1B1 expression, the I3C group showed a significant elevation (FC = 7.67 ± 1.49) compared to the NT group (p < 0.0001). The TCDD group exhibited a 3.51 ± 0.82-fold increase compared to the NT group (p < 0.01). The LPS group demonstrated a fold change of 1.70 ± 0.55, which was higher than the NT group but significantly lower than the I3C group (p < 0.0001). Moreover, CYP1B1 expression was significantly higher in the I3C group compared to the TCDD group (p < 0.0001) (Figure 1E). The expression of AHRR in MDMs is depicted in Figure 1F. The TCDD group exhibited a substantial increase in AHRR expression (FC = 8.50 ± 1.56) compared to the NT group (p < 0.0001). The I3C group showed a modest increase in AHRR expression (FC = 2.67 ± 0.56), though this was not statistically significant compared to the NT group (p > 0.05). The LPS group demonstrated a fold change of 2.17 ± 0.72, which was not significantly different from the NT group (p > 0.05). Furthermore, the TCDD group had significantly higher AHRR expression compared to both the LPS group (p < 0.0001) and the I3C group (p < 0.0001). No significant difference was observed between the LPS and I3C groups (p > 0.05) (Figure 1F).

3.2. I3C Alters Macrophage Polarization: Increased CD163 Expression and Reduced CD16 and CD86 Levels

To evaluate the macrophage polarization, as demonstrated in Figure 2, the expression of the CD16, CD86, and CD163 markers was analyzed in THP-1 macrophage-like cells treated with I3C, TCDD, and LPS and compared to the NT controls. CD16 expression in the NT group was 34.73 ± 1.82%, while the LPS group significantly increased CD16 expression to 58.2 ± 2.49% (p < 0.0001). The TCDD-treated cells showed a CD16 expression of 65.3 ± 2.82%, which was significantly comparable to LPS (p < 0.05). The I3C group exhibited 39.8 ± 1.16% CD16 expression, which was lower than both the LPS (p < 0.0001) and TCDD groups (p < 0.0001) but higher than the NT group (Figure 2A). In terms of CD86 expression, the NT group had a low expression level of 0.24 ± 0.05%, whereas LPS markedly increased CD86 expression to 4.40 ± 0.20% (p < 0.05). The TCDD treatment resulted in a significantly elevated CD86 expression of 71.26 ± 2.46%, the highest among all groups (p < 0.0001). In contrast, the I3C-treated cells exhibited low CD86 expression (0.20 ± 0.05%), similar to NT (Figure 2B). For CD163, the NT group showed minimal expression at 0.55 ± 0.03%, while LPS expressed CD163 at 3.38 ± 0.2% (p < 0.001). The TCDD-treated cells displayed CD163 expression of 0.47 ± 0.06%, while the I3C group exhibited significantly higher CD163 expression at 73.9 ± 0.41%, the highest among all groups (p < 0.0001) (Figure 2B).

3.3. I3C Promotes ARG1 Expression While Reducing NOS2 Levels in Macrophages

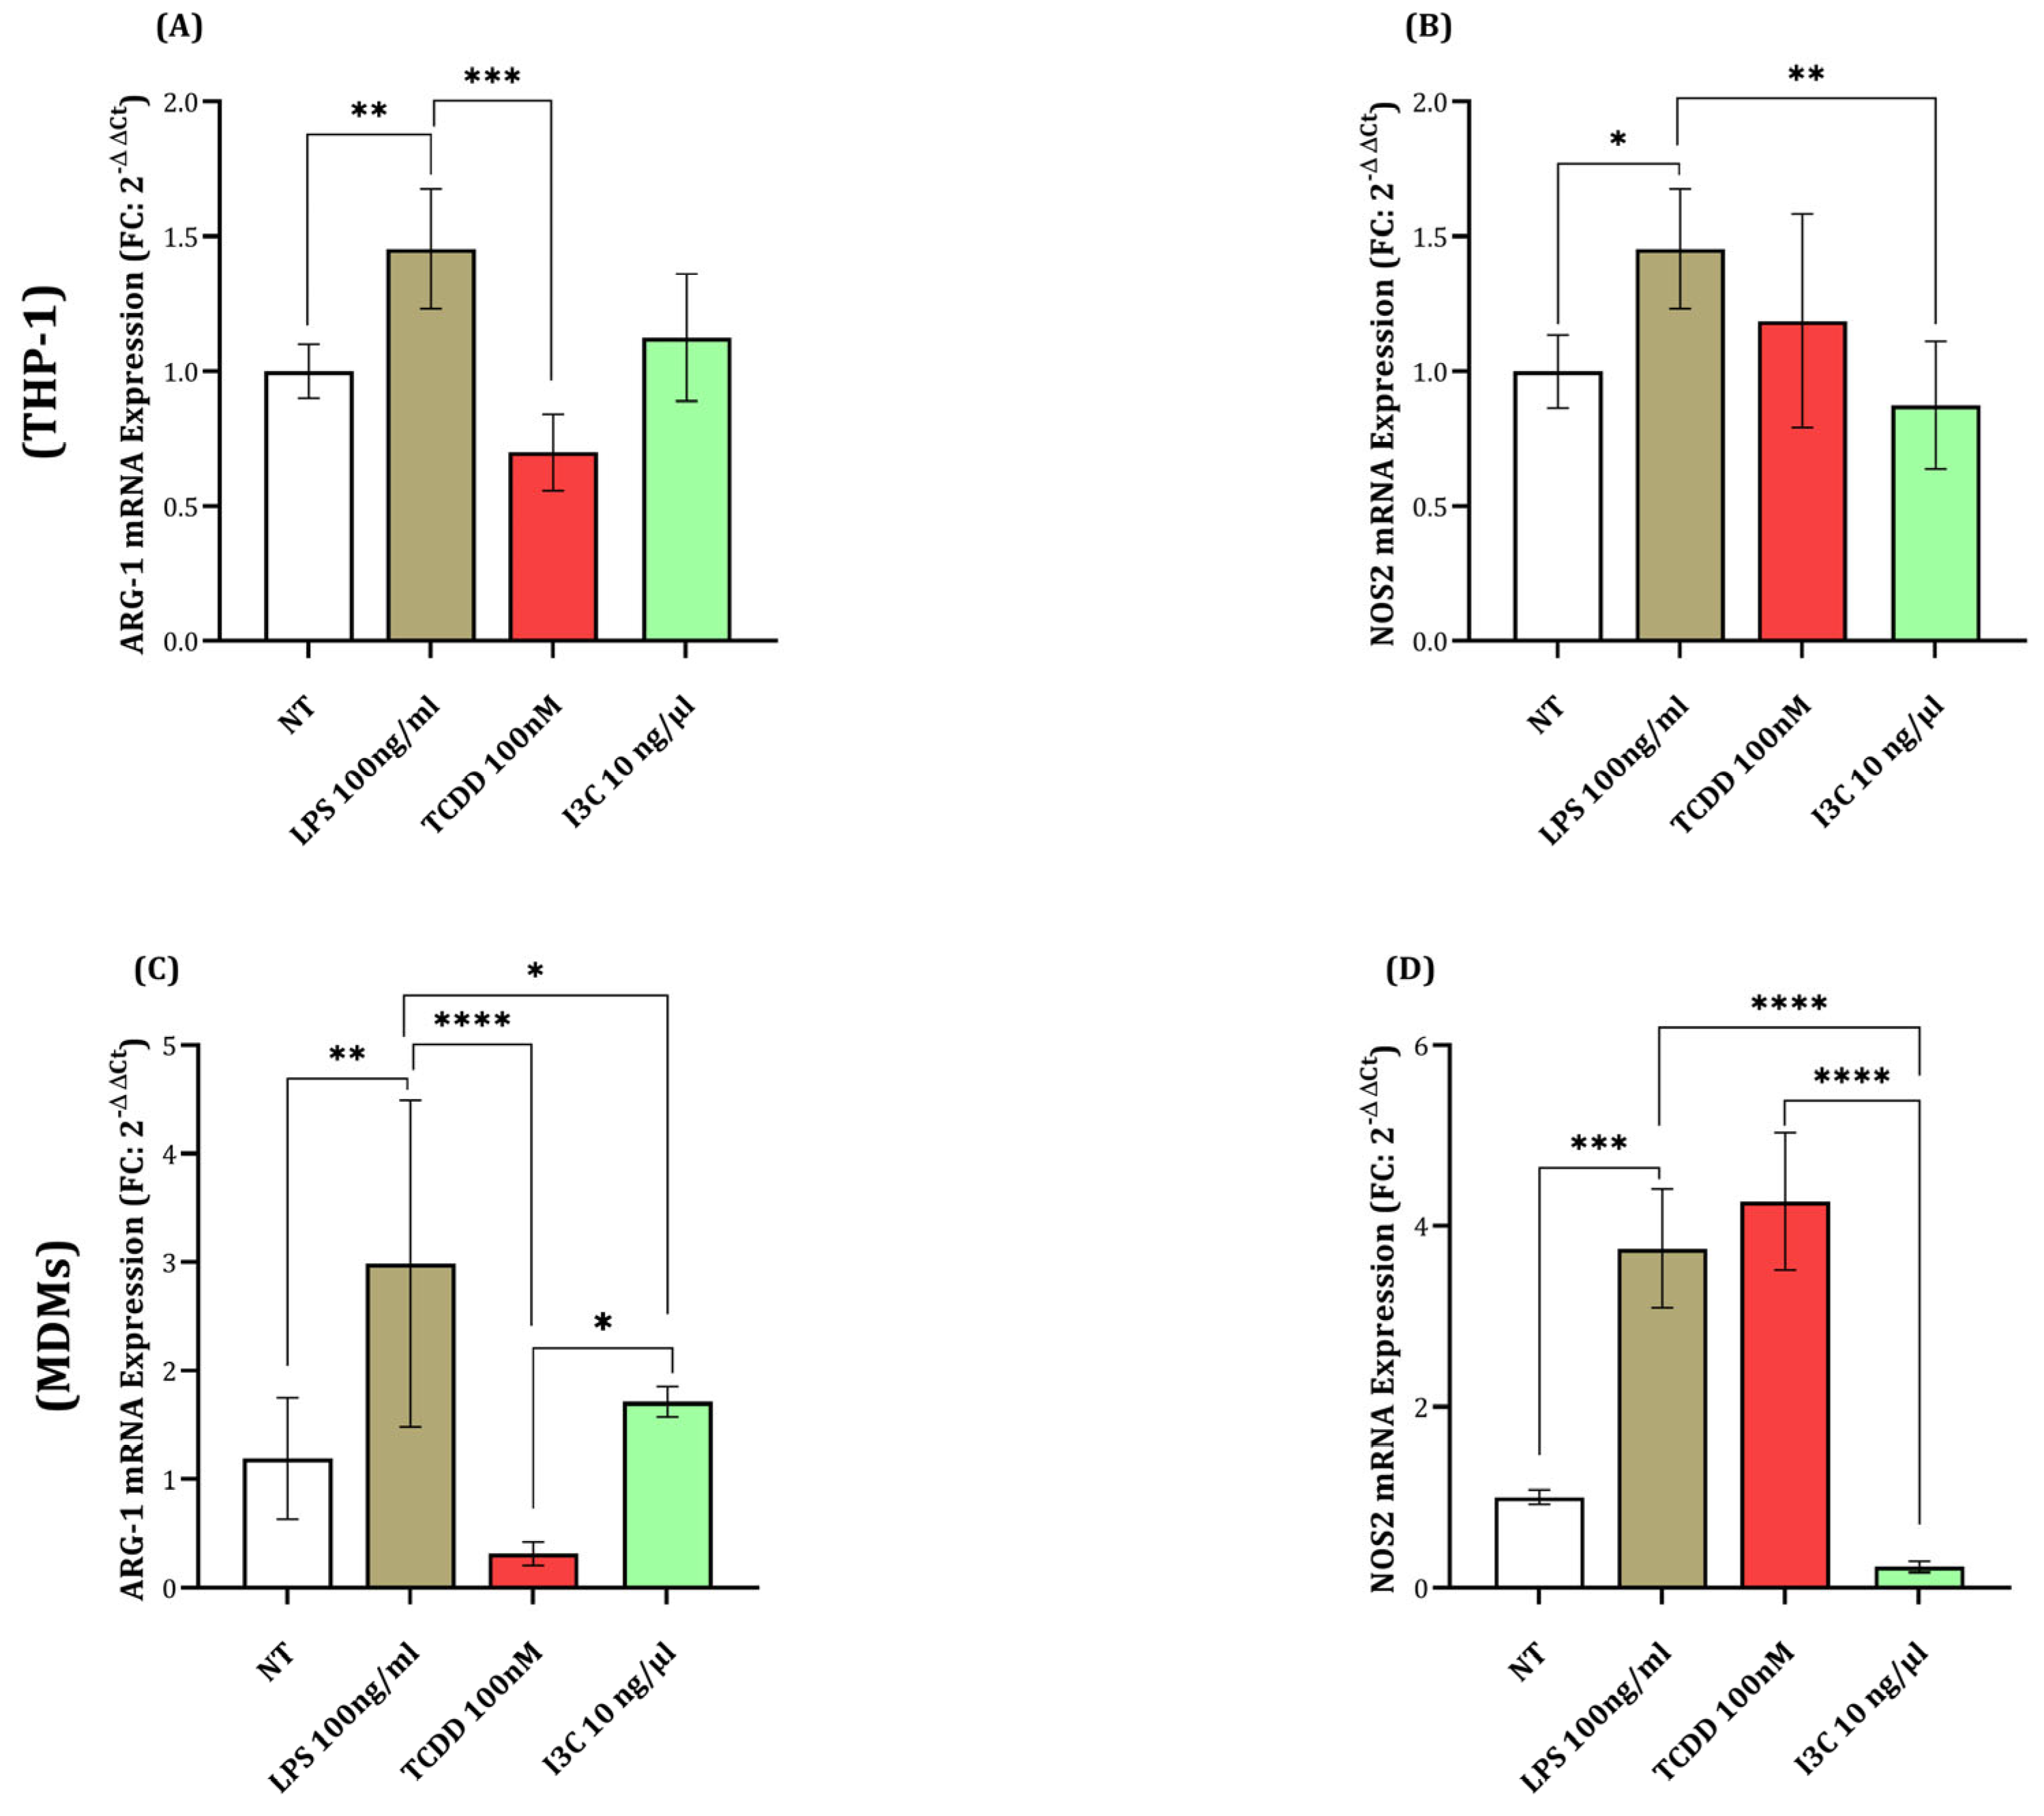
To investigate the expression of ARG1 and NOS2 genes in MDMs and THP-1 cells following treatment with I3C, TCDD, and LPS, a real-time PCR analysis was conducted (Figure 3). The results for the ARG1 expression in THP-1 cells showed that the LPS treatment significantly increased the ARG1 expression (FC = 1.44 ± 0.23) compared to the NT group (FC = 1.01 ± 0.09) (p < 0.01). The TCDD treatment significantly suppressed ARG1 expression, with levels approximately two times lower than the NT group (FC = 0.0.7 ± 0.13) (p < 0.001), while the I3C treatment had no significant effect on ARG1 expression (FC = 1.12 ± 0.22) (Figure 3A). For the NOS2 gene expression in THP-1 cells, the LPS treatment led to a significant increase (FC = 1.45 ± 0.27) compared to the NT group (FC = 1.00 ± 0.12). The TCDD treatment resulted in a not significant upregulation of NOS2 expression (FC = 1.19 ± 0.30). However, the I3C treatment significantly reduced the NOS2 expression (FC = 0.88 ± 0.18) compared to the LPS group (Figure 3B).
The results for the ARG1 expression in MDMs indicated that in the I3C-treated group, the expression was significantly higher (FC = 1.71 ± 0.14) compared to the TCDD group (FC = 0.312 ± 0.12) (p < 0.05). The TCDD treatment significantly suppressed ARG1 expression to about three times lower than in the NT group (FC = 1.19 ± 0.55) (p < 0.01). The LPS treatment resulted in an increased expression of ARG1 (FC = 2.98 ± 1.50) (Figure 3C). The analysis of NOS2 gene expression showed that treatment with I3C significantly decreased NOS2 expression (FC = 0.23 ± 0.06) compared to all other groups. The TCDD treatment resulted in a significant increase in NOS2 expression (FC = 4.27 ± 0.75), approximately four times higher than the NT group (p < 0.001). The LPS treatment also elevated the NOS2 expression (FC = 3.75 ± 0.65). NOS2 expression in the TCDD group was more than ten times higher than in the I3C group (p < 0.0001) (Figure 3D).

3.4. I3C Treatment Results in Elevated IL-10 and TGF-β and Modulated IL-12 and TNF-α Levels in Macrophages

The expression of the IL-10, IL-12, TNF-α, and TGF-β genes and cytokines was investigated in THP-1 cells treated with I3C, TCDD, and LPS (Figure 4). The IL-10 gene expression results showed significant variations among the treatment groups. Compared with the NT group, the I3C group demonstrated a 2.34 ± 0.31 FC (fold change) (p < 0.0001) increase, while the TCDD group exhibited a lower fold change of 0.25 ± 0.44 (p < 0.01). The LPS-treated group showed higher IL-10 expression, with a 2.97 ± 0.36 FC increase (p < 0.0001) (Figure 4A).
For the IL-12 gene expression, the I3C group demonstrated a fold change of 0.96 ± 0.18, while the TCDD group exhibited a fold change of 0.292 ± 0.07. The LPS group demonstrated significantly higher IL-12 expression (FC = 2.90 ± 0.61) (p < 0.0001) in comparison with the NT group. The TCDD group showed lower IL-12 expression compared to the NT (p < 0.05) and LPS (p < 0.0001) groups. Moreover, the I3C group displayed higher IL-12 expression than the TCDD group (p < 0.01) (Figure 4B).
TGF-β cytokine expression was 589.01 ± 5.30 pg/mL in the untreated cells, 547.54 ± 3.29 pg/mL in the LPS-treated group, 588.04 ± 4.23 pg/mL in the I3C group, and 557.35 ± 3.30 pg/mL in the TCDD group. Significant reductions in TGF-β expression were observed in the LPS-treated group compared to the untreated group (p < 0.05), and a similar reduction was noted in the TCDD group compared to the I3C group (p < 0.05) (Figure 4C).
In terms of TNF-α cytokine expression, the untreated cells had a level of 55.82 ± 1.49 pg/mL, while the LPS-treated cells exhibited 74.23 ± 0.98 pg/mL. The I3C group showed 67.84 ± 0.54 pg/mL, and the TCDD-treated group had TNF-α levels of 74.48 ± 0.58 pg/mL. The I3C group had markedly lower TNF-α expression compared to the TCDD group (p < 0.01). Moreover, TNF-α levels were significantly higher in the LPS-treated group compared to the untreated group (p < 0.0001) (Figure 4D).

3.5. I3C-Induced Upregulation of GLUT1, GLUT3, and GLUT6 in Macrophages

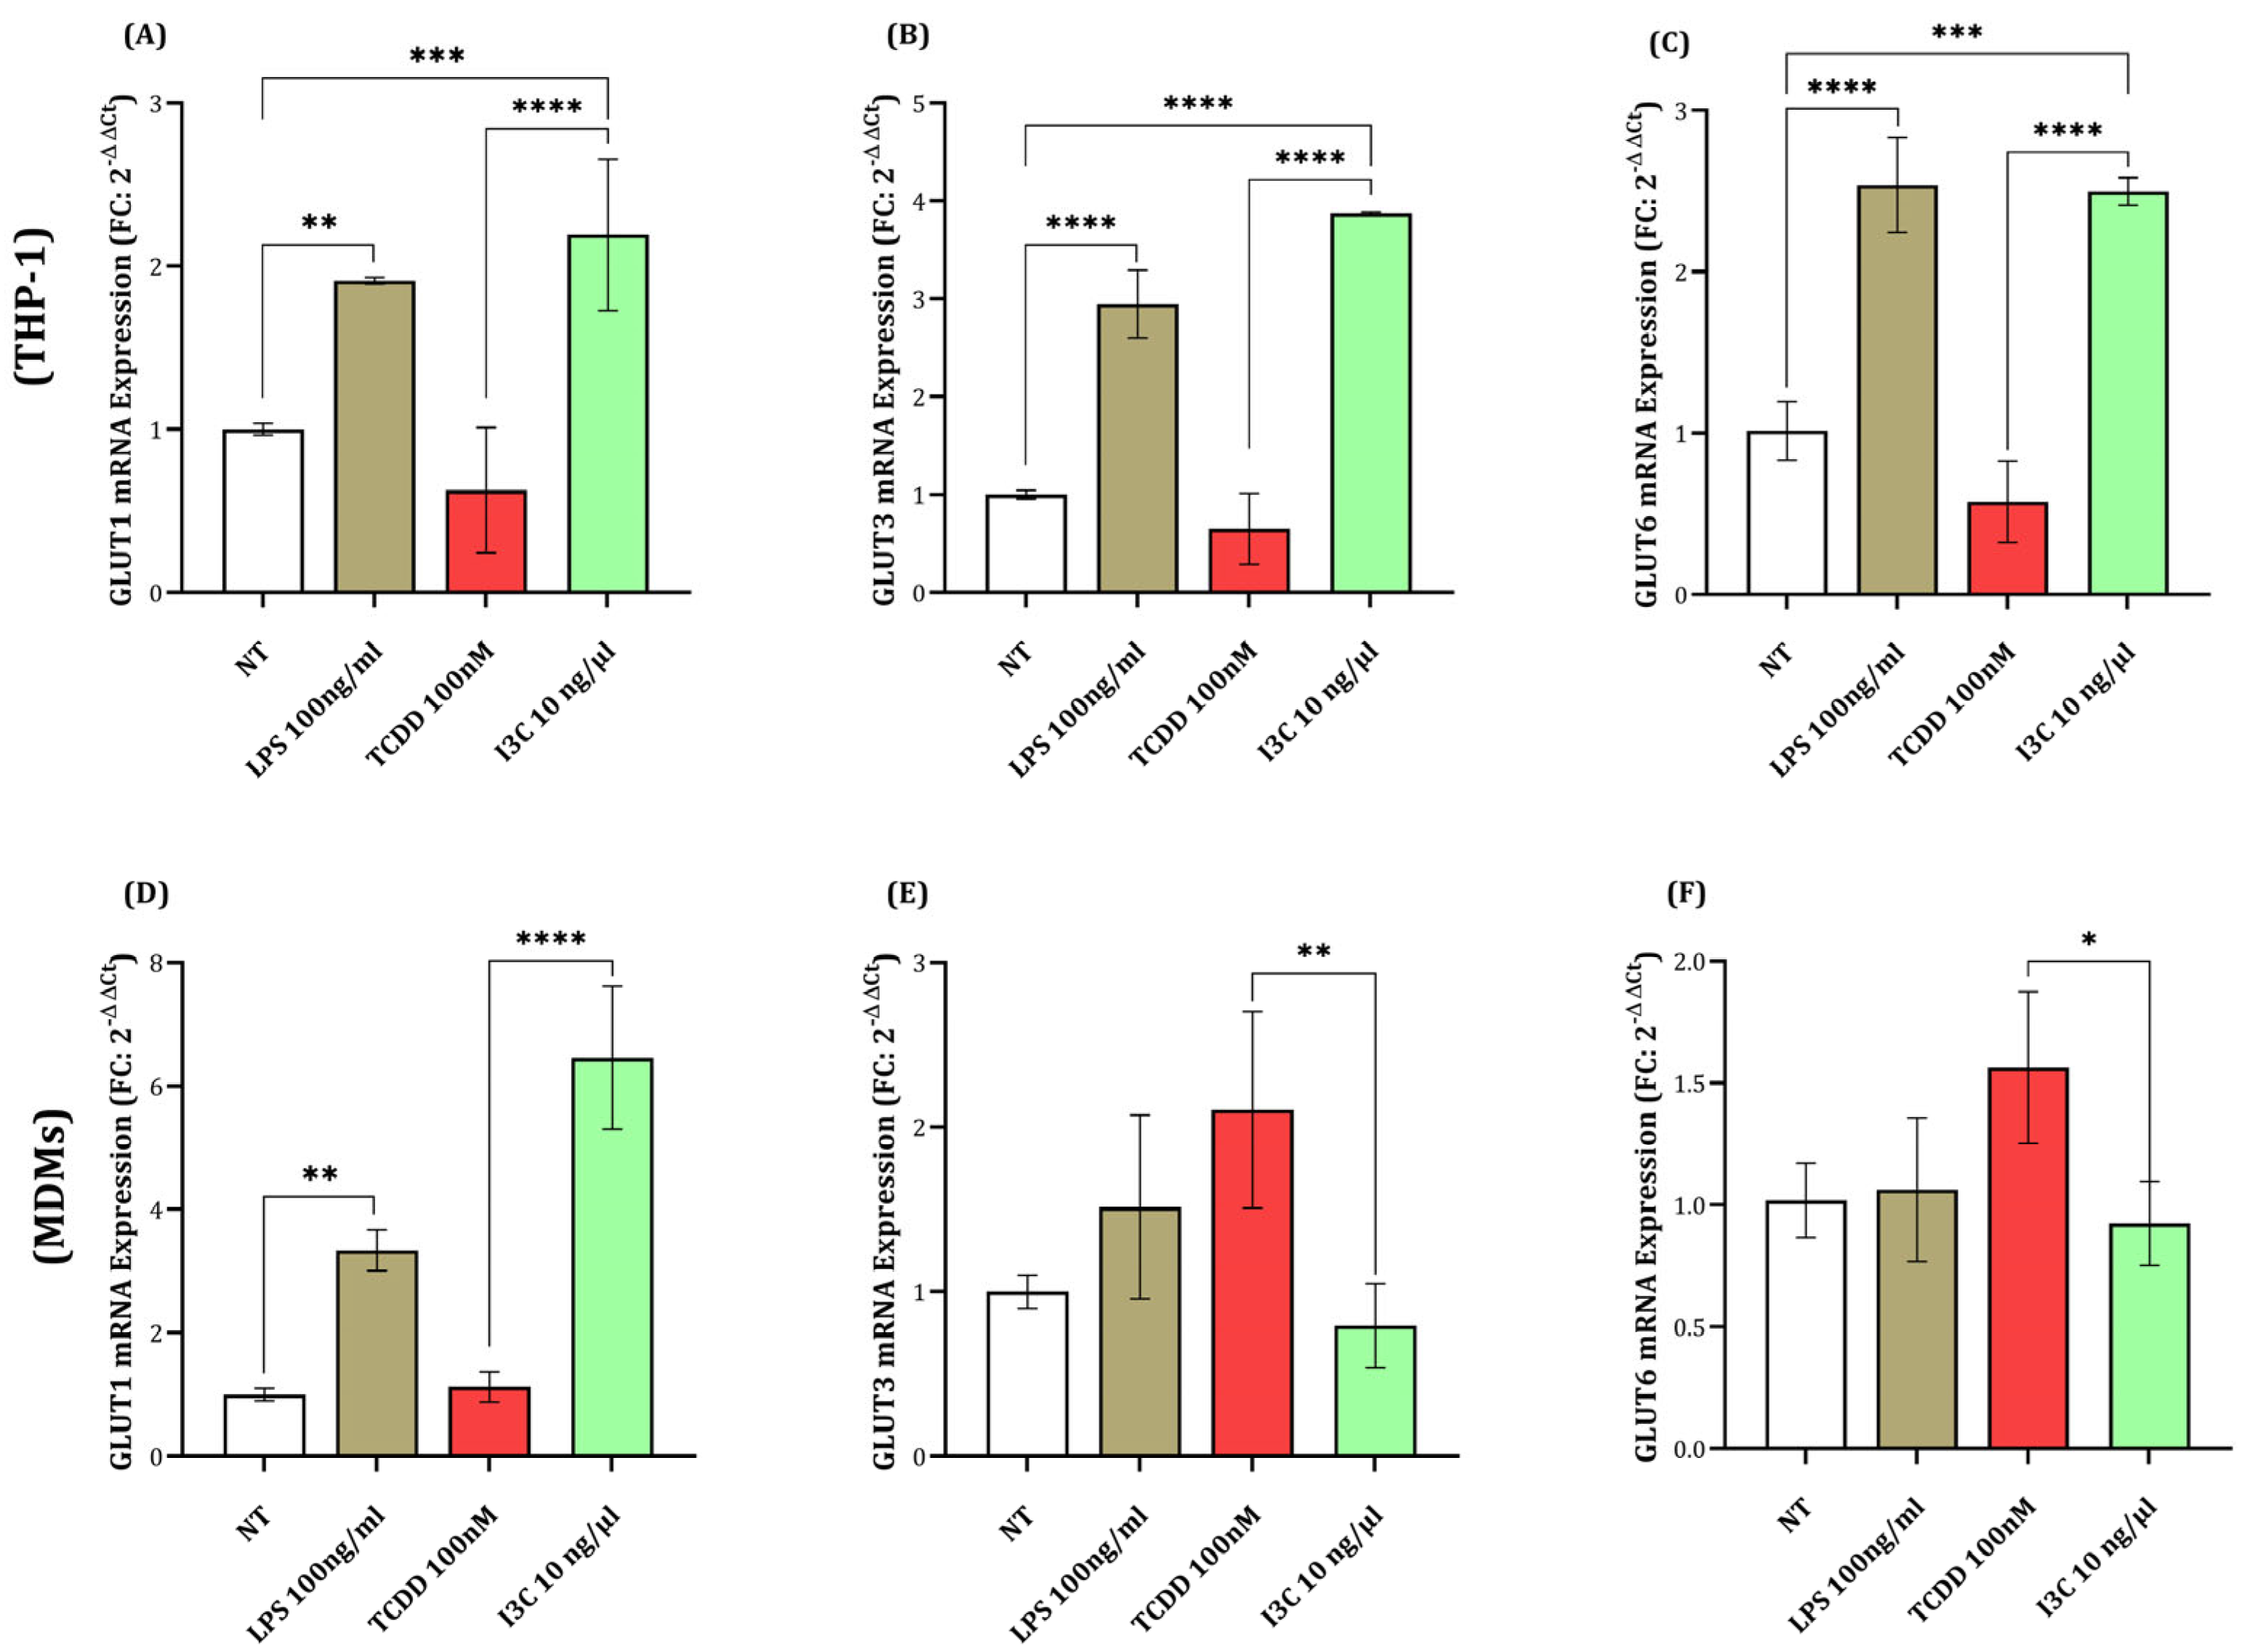
We assessed the expression levels of GLUT1, GLUT3, and GLUT6 genes in THP-1 cells and MDMs treated with I3C, TCDD, and LPS. Significant differences in gene expression were observed across the treatment groups for all three glucose transporters (Figure 5). The expression of GLUT1 in the I3C-treated group (FC = 2.19 ± 0.46) was significantly higher than in the NT group (p < 0.001). Although decreased, the TCDD treatment showed no significant change in GLUT1 expression compared to the NT group (FC = 0.63 ± 0.38; p > 0.05). The LPS treatment resulted in the significant upregulation of GLUT1 (FC = 1.9 ± 0.19) compared to the untreated controls. Moreover, the expression of GLUT1 in the I3C group was approximately 3.5-fold higher than in the TCDD group (p < 0.0001) (Figure 5A). For GLUT3, the I3C-treated group displayed a significantly higher expression (FC = 3.87 ± 0.13) than the NT group (p < 0.0001). The TCDD treatment (FC = 0.65 ± 0.36) resulted in a significant 1.5-fold decrease in GLUT3 expression compared to the untreated group (p < 0.01). The LPS treatment (FC = 2.94 ± 0.34) led to the significant upregulation of GLUT3 expression (p < 0.0001) (Figure 5B). Moreover, GLUT6 expression was significantly altered by the treatments. In the I3C-treated group, GLUT6 expression (FC = 2.49 ± 0.08) was increased compared to the NT (p < 0.001) and TCDD (FC = 0.57 ± 0.28) (p < 0.0001) groups. The TCDD treatment also led to a significant reduction in GLUT6 expression compared to the NT group (p < 0.01). Moreover, the LPS treatment significantly upregulated GLUT6 expression (FC = 2.54 ± 0.29) (p < 0.0001) (Figure 5C).
We also assessed the expression levels of the GLUT1, GLUT3, and GLUT6 genes in MDMs treated with I3C, TCDD, and LPS (Figure 5). The expression of GLUT1 in the I3C-treated group (FC = 6.56 ± 1.14) was significantly higher than in the NT group (FC = 1.02 ± 0.09) (p < 0.0001). The TCDD treatment resulted in a non-significant change in GLUT1 expression (FC = 1.13 ± 0.21) compared to the NT group (p > 0.05). The LPS treatment led to a significant upregulation of GLUT1 expression (FC = 3.34 ± 0.28) compared to the untreated control (p < 0.001). Moreover, GLUT1 expression in the I3C-treated group was approximately six times higher than in the TCDD group (p < 0.0001) (Figure 5D). For GLUT3, the I3C-treated group exhibited a decrease in expression (FC = 0.79 ± 0.21) compared to the NT group (FC = 1.01 ± 0.10) (p < 0.05). The TCDD treatment significantly upregulated GLUT3 expression (FC = 2.32 ± 0.38) compared to the NT group (p < 0.01). The LPS treatment resulted in a variable response, with a modest increase in GLUT3 expression (FC = 1.68 ± 0.25) compared to the NT group (p < 0.05) (Figure 5E). GLUT6 expression was significantly modulated by the treatments. In the I3C-treated group, GLUT6 expression (FC = 0.93 ± 0.14) showed no significant difference compared to the NT group (p > 0.05). However, the TCDD treatment significantly increased GLUT6 expression (FC = 1.66 ± 0.31) compared to the NT group (p < 0.01). The LPS treatment led to an upregulation of GLUT6 expression (FC = 1.26 ± 0.19), though the difference was not statistically significant (p > 0.05) (Figure 5F).

3.6. Indole-3-Carbinol Promotes Anti-Inflammatory Macrophage Polarization

In order to more deeply explore the immunomodulatory effects of I3C on THP-1 cells, we calculated the ratios of anti-inflammatory to pro-inflammatory markers, including IL-10/IL-12, TGF-β/TNF-α, and ARG1/NOS2, under each treatment condition (Figure 6). The TGF-β/TNF-α ratio was significantly lower in the LPS group (7.37 ± 0.08) compared to the NT group (10.57 ± 0.16), showing a pro-inflammatory shift. The treatment with I3C resulted in a partial reversal, with the TGF-β/TNF-α ratio increasing to 8.63 ± 0.06. However, treatment with TCDD did not markedly alter this ratio compared to the LPS group, with a mean value of 7.50 ± 0.08.
Regarding the IL-10/IL-12 ratio, the NT group had a baseline ratio of 0.95 ± 0.38. Upon LPS stimulation, this ratio increased to 1.06 ± 0.14, reflecting a modest anti-inflammatory response. The I3C treatment significantly elevated the IL-10/IL-12 ratio to 2.56 ± 0.90, suggesting a pronounced anti-inflammatory shift. The TCDD treatment showed a similar trend to I3C, but with a lower increase, reaching a mean ratio of 1.42 ± 0.53.
The ARG1/NOS2 ratio followed a similar trend to the IL-10/IL-12 ratio. The NT group showed a baseline mean of 1.16 ± 0.55. The LPS treatment reduced this ratio to 0.76 ± 0.37, indicating a pro-inflammatory response. However, the I3C treatment significantly increased the ARG1/NOS2 ratio to 7.71 ± 1.42, pointing to a strong shift toward an anti-inflammatory macrophage phenotype. In contrast, the TCDD treatment resulted in a markedly lower ARG1/NOS2 ratio (0.08 ± 0.05), lower than the LPS group, demonstrating an impact on elevated inflammation.

4. Discussion

Macrophages are versatile cells that respond to internal and external triggers to initiate or regulate inflammation [1]. Depending on their surrounding microenvironment, they tend to form either the pro-inflammatory M1 or the anti-inflammatory M2 phenotypes [2]. In metabolic diseases, the balance shifts toward inflammatory M1 macrophages [6,7]. Accordingly, discovering new compounds or signaling pathways that can polarize macrophages toward the M2 phenotype could offer therapeutic benefits. In the present study, we aimed to explore the effects of I3C, TCDD, and LPS on the expression of AHR activation genes, macrophage polarization markers, cytokine profiles, and glucose transporter genes in THP-1 cells. We conducted this study to better understand the role of AHR activation in modulating immune responses and metabolic functions in the context of inflammation.
Our results showed that I3C significantly elevated the expression of CYP1A1 and CYP1B1 [23], two key genes associated with AHR activation, similar to the effects observed with TCDD. However, AHRR, a feedback inhibitor of AHR signaling [24], was markedly lower in the I3C group compared to the TCDD and LPS groups. The AHR is a ligand-activated transcription factor, which is important in several biological processes, including immune response regulation and xenobiotic metabolism, and could be activated by diverse ligands, including TCDD and I3C [19,21]. CYP1A1, a target gene of the AHR, is upregulated upon AHR activation [25]. I3C, as a potent dietary AHR ligand, can also activate the AHR pathway upon cellular uptake and upregulate CYP1A1 [19,21]. CYP1B1, another key member of the cytochrome P450 enzyme family, is known to be involved in the metabolism of various endogenous compounds and xenobiotics [26]. The relatively modest overexpression of CYP1B1 in the I3C group in comparison to the TCDD and LPS groups suggests a more complicated role of I3C in the regulation of CYP1B1 expression, which was also implicated in other reports [27]. The AHRR functions as a feedback regulator that attenuates the transcriptional activity of AHR [24]. AHRR exerts its inhibitory action by competitively binding to AHR, preventing its dimerization with the ARNT (AHR nuclear translocator) protein and subsequent DNA binding [24]. The observed upregulation of AHRR following the I3C treatment could be due to a negative feedback loop aimed at counteracting the excessive activation of the AHR pathway. This upregulation could serve as a protective mechanism to maintain cellular homeostasis and prevent sustained immune activation. Comparing our findings with the study by Marta Ociepa-Zawal et al. [23], which focused on the effect of I3C on the expression of CYP1A1, CYP1B1, and AHR genes in MCF-7 cells, it is evident that I3C plays a crucial role in modulating the expression of these genes.
Moreover, the I3C treatment significantly influenced macrophage polarization. It increased CD163 expression, a marker of anti-inflammatory M2 macrophages [28], while reducing the expression of CD16 and CD86, markers associated with pro-inflammatory M1 macrophages [29]. This effect was distinct from both the TCDD and LPS treatments, which either did not alter CD163 expression or promoted higher CD16 and CD86 expression. Moreover, I3C enhanced the expression of ARG1, a marker associated with M2 polarization, while reducing NOS2 levels [30], which are typically elevated in M1 macrophages [31]. These findings suggested that I3C promotes a shift toward an anti-inflammatory M2 phenotype.
CD16, also known as Fc gamma receptor III (FcγRIII), is a cell surface marker associated with macrophages, neutrophils, and natural killer (NK) cells [32]. In macrophages, CD16 is crucial for mediating antibody-dependent cell-mediated cytotoxicity (ADCC) and phagocytosis [33]. The upregulation of CD16 observed in the LPS and TCDD groups suggests an activation of macrophages in response to inflammatory stimuli. The lower overexpression of CD16 in the I3C-treated cells suggests that I3C might not exert a remarkable effect on CD16 expression and macrophage activation.
CD86, also known as B7-2, is a co-stimulatory molecule primarily associated with antigen-presenting cells, including macrophages [34]. The higher expression of CD86 in the LPS and TCDD groups suggests a shift toward an M1-like polarization state in response to these stimuli. However, the low expression of CD86 in the I3C group indicates a potential deviation from the classical M1 polarization toward the M2 state, suggesting a differential impact of I3C on macrophage activation and the promotion of a pro-inflammatory response.
CD163 is a scavenger receptor predominantly expressed on anti-inflammatory macrophages, known as M2 macrophages [35]. It is involved in modulating the inflammatory response by mediating the clearance of free hemoglobin and dampening the pro-inflammatory cytokine response [36]. The higher expression of CD163 in the I3C group also implies a potential shift toward an anti-inflammatory phenotype in response to this stimulus. The observed changes in CD163 and CD86 expression following I3C treatment suggest a potential shift toward M2-like anti-inflammatory polarization, which could be beneficial for the resolution of inflammation and the restoration of tissue homeostasis.
Arginase-1 (ARG1) is a crucial enzyme involved in the metabolism of L-arginine, playing an important role in the regulation of immune responses and the modulation of macrophage polarization, associated with the alternatively activated M2 phenotype, which is characterized by anti-inflammatory and tissue-repair functions [37]. The ARG1-mediated L-arginine metabolism can decrease the production of nitric oxide (NO) by competing with inducible nitric oxide synthase (iNOS) for the common substrate L-arginine.
ARG1 also plays a main role in regulating T cell responses and modulating the balance between pro-inflammatory and anti-inflammatory cytokines, contributing to the establishment of an immunosuppressive microenvironment [38]. The overexpression of the ARG1 gene in the I3C-treated group demonstrates a potential role of I3C in the regulation of ARG1 expression, which might be due to the modulation of transcription factors and signaling pathways involved in the regulation of ARG1, including the nuclear factor kappa-light-chain-enhancer of activated B cells (NF-κB) and signal transducer and activator of transcription (STAT) pathways [39]. In the study by Kebria Hezaveh et al. [40], the overexpression of ARG1 in tumor-associated macrophages (TAMs) is associated with the suppression of anti-tumor immunity, delineating the role of ARG1 in shaping the tumor microenvironment and facilitating tumor immune escape. In contrast, our findings suggest potential differential effects of I3C on the regulation of ARG1 compared to the tryptophan-derived microbial metabolites evaluated by Kebria Hezaveh et al., which might be due to the diverse cellular contexts and structure of ligands.
Inducible nitric oxide synthase (iNOS), a critical enzyme involved in the production of nitric oxide (NO), is essential in modulating the immune response, inflammation, and various physiological processes [41]. The downregulation of the NOS2 gene in the I3C-treated group shows the possible immunoregulatory effects of I3C on macrophage cells, which needs further investigation. Rostoka et al. [42] demonstrated the distinct effects of natural compounds, including I3C, on NO production and iNOS expression in various rat tissues and concluded the tissue-specific effects of I3C iNOS expression. Moreover, Chang et al. [43] demonstrated the inhibitory effects of I3C on iNOS expression and nitrite production in co-cultured macrophages and adipocytes in line with our findings.
Furthermore, I3C was found to modulate the expression of inflammatory cytokines in a manner consistent with anti-inflammatory activity. The treatment resulted in elevated levels of IL-10 and TGF-β, cytokines known for their anti-inflammatory effects, and reduced levels of pro-inflammatory cytokines such as IL-12 and TNF-α. The IL-10/IL-12 ratio was significantly higher in the I3C group compared to the other treatment groups, further supporting its anti-inflammatory potential.
IL-10 is a pleiotropic cytokine with potent anti-inflammatory properties, known to play a critical role in regulating immune responses and maintaining immune homeostasis [44,45]. Specifically in macrophages, IL-10 serves as a key regulator of macrophage polarization, directing macrophages toward an anti-inflammatory M2 phenotype. This polarization is associated with the downregulation of pro-inflammatory cytokines and the upregulation of anti-inflammatory cytokines, contributing to the resolution of inflammation and the promotion of tissue repair [46]. IL-12 is a regulator of immune responses and plays a central role in the coordination of both innate and adaptive immunity [47]. It is a potent inducer of M1 cell differentiation, enhances the cytotoxic activity of NK cells, promotes the inflammatory activation of macrophages, and can stimulate the production of IgG and IgM antibodies [48].
The ratios of TGF-β/TNF-α, IL-10/IL-12, and ARG1/NOS2 can provide valuable information about the overall macrophage polarization, with a high ratio typically indicating a shift toward M2 polarization, whereas a low ratio indicates a bias toward M1 polarization. In our study, the abovementioned ratios were higher in I3C-treated macrophages, indicating a potential shift toward M2 polarization. Mohammadi et al. [19] investigated the immunoregulatory effects of I3C on monocyte-derived macrophages (MDMs) in systemic lupus erythematosus (SLE) and demonstrated that I3C enhances the nuclear accumulation of AHR in the MDMs of SLE patients, resulting in the alteration of AHR target genes, which can induce M2 polarization of macrophages.
The balance between M1 and M2 macrophages has been linked to immunometabolism, including glucose metabolism [49]. M1 macrophages are known to rely on glycolysis, while M2 macrophages tend to utilize oxidative phosphorylation (OXPHOS) for their energy needs, which is associated with anti-inflammatory and tissue repair processes [50]. In our study, the significant upregulation of M2 markers and anti-inflammatory cytokines upon I3C treatment is in favor of OXPHOS metabolic shifts.
The upregulation of glucose transporters observed in I3C-treated macrophages further supports this notion of metabolic reprogramming. While GLUT1 and GLUT3 are commonly associated with glycolytic activity, particularly in M1 macrophages, recent studies have shown that glucose transporter expression is not strictly limited to pro-inflammatory states and may also be modulated under anti-inflammatory conditions to support cellular energy requirements [51]. Interestingly, GLUT6, whose function is not fully elucidated, was also upregulated in THP-1 cells treated with I3C, suggesting a possible metabolic adaptation consistent with M2 polarization. These findings imply that I3C may induce a unique metabolic signature that blends the classical features of M2 macrophages with selective glucose transporter upregulation.
Glucose, as a vital energy source, is transported into macrophages by specific glucose transporters, collectively known as GLUTs [52]. Here, we found that the glucose transporters GLUT1, GLUT3, and GLUT6 were upregulated in I3C-treated macrophages, which indicates the potential enhancement of glucose uptake in macrophages, indicating an increased demand for glucose, likely to support the elevated energy requirements during immune responses.
While LPS is a potent M1-polarizing agent, our results showed only modest increases in CD86 expression and TNF-α secretion. This may reflect a partial or mixed activation state in THP-1 macrophages, which is consistent with previous studies showing variable responses to LPS in this cell line [53,54,55]. Factors such as PMA-induced differentiation, rest period duration, cell density, and LPS serotype have all been shown to affect the extent of polarization [54]. Moreover, several studies have reported concurrent IL-10 and ARG1 expression in LPS-stimulated THP-1 macrophages, supporting the idea that these cells do not always adopt a classical M1 profile under standard conditions [56].
Our study had certain limitations, including the use of an in vitro model, which may not fully reflect the complexity of in vivo systems and the dynamic interactions within a whole organism. Moreover, while we observed significant upregulation of glucose transporters at the gene expression level, we were unable to perform functional metabolic assays, such as glucose uptake measurements or real-time metabolic flux analyses, due to technical and resource constraints. Future studies incorporating such assays are warranted to validate the metabolic impact of I3C-induced GLUT upregulation and further elucidate the immunometabolic pathways involved. The impact of I3C on macrophage polarization and its ability to modulate the immune response demonstrate its potential as a treatment for immune-related disorders. I3C promotes an anti-inflammatory state and supports the resolution of inflammation. Changes in GLUT expression patterns also highlight the critical role of immunometabolism in regulating macrophage activity and shaping their function in both immune responses and inflammatory processes.
I3C is naturally derived from cruciferous vegetables such as broccoli, Brussels sprouts, and cabbage, where it is formed during the enzymatic hydrolysis of glucobrassicin [57]. This raises the possibility that regular dietary intake of I3C-rich vegetables may support natural immune regulation through AHR activation. Previous studies have shown that I3C and its dimeric derivative, 3,3′-diindolylmethane (DIM), exert anti-inflammatory effects in various immune cell types, including dendritic cells and T lymphocytes. For example, Banerjee et al. (2011) demonstrated that I3C inhibited NF-κB signaling in T cells, reducing pro-inflammatory cytokine production [58].
Taken together, our findings align with the growing body of literature highlighting the metabolic plasticity of macrophages in response to immunological stimuli. Nutritional AHR ligands, such as I3C, may offer a dual immunometabolic benefit, modulating inflammatory signaling pathways while influencing cellular metabolism [59]. This dual action may have important therapeutic implications in chronic inflammatory and metabolic diseases, where correcting macrophage dysfunction through metabolic reprogramming represents a promising strategy.
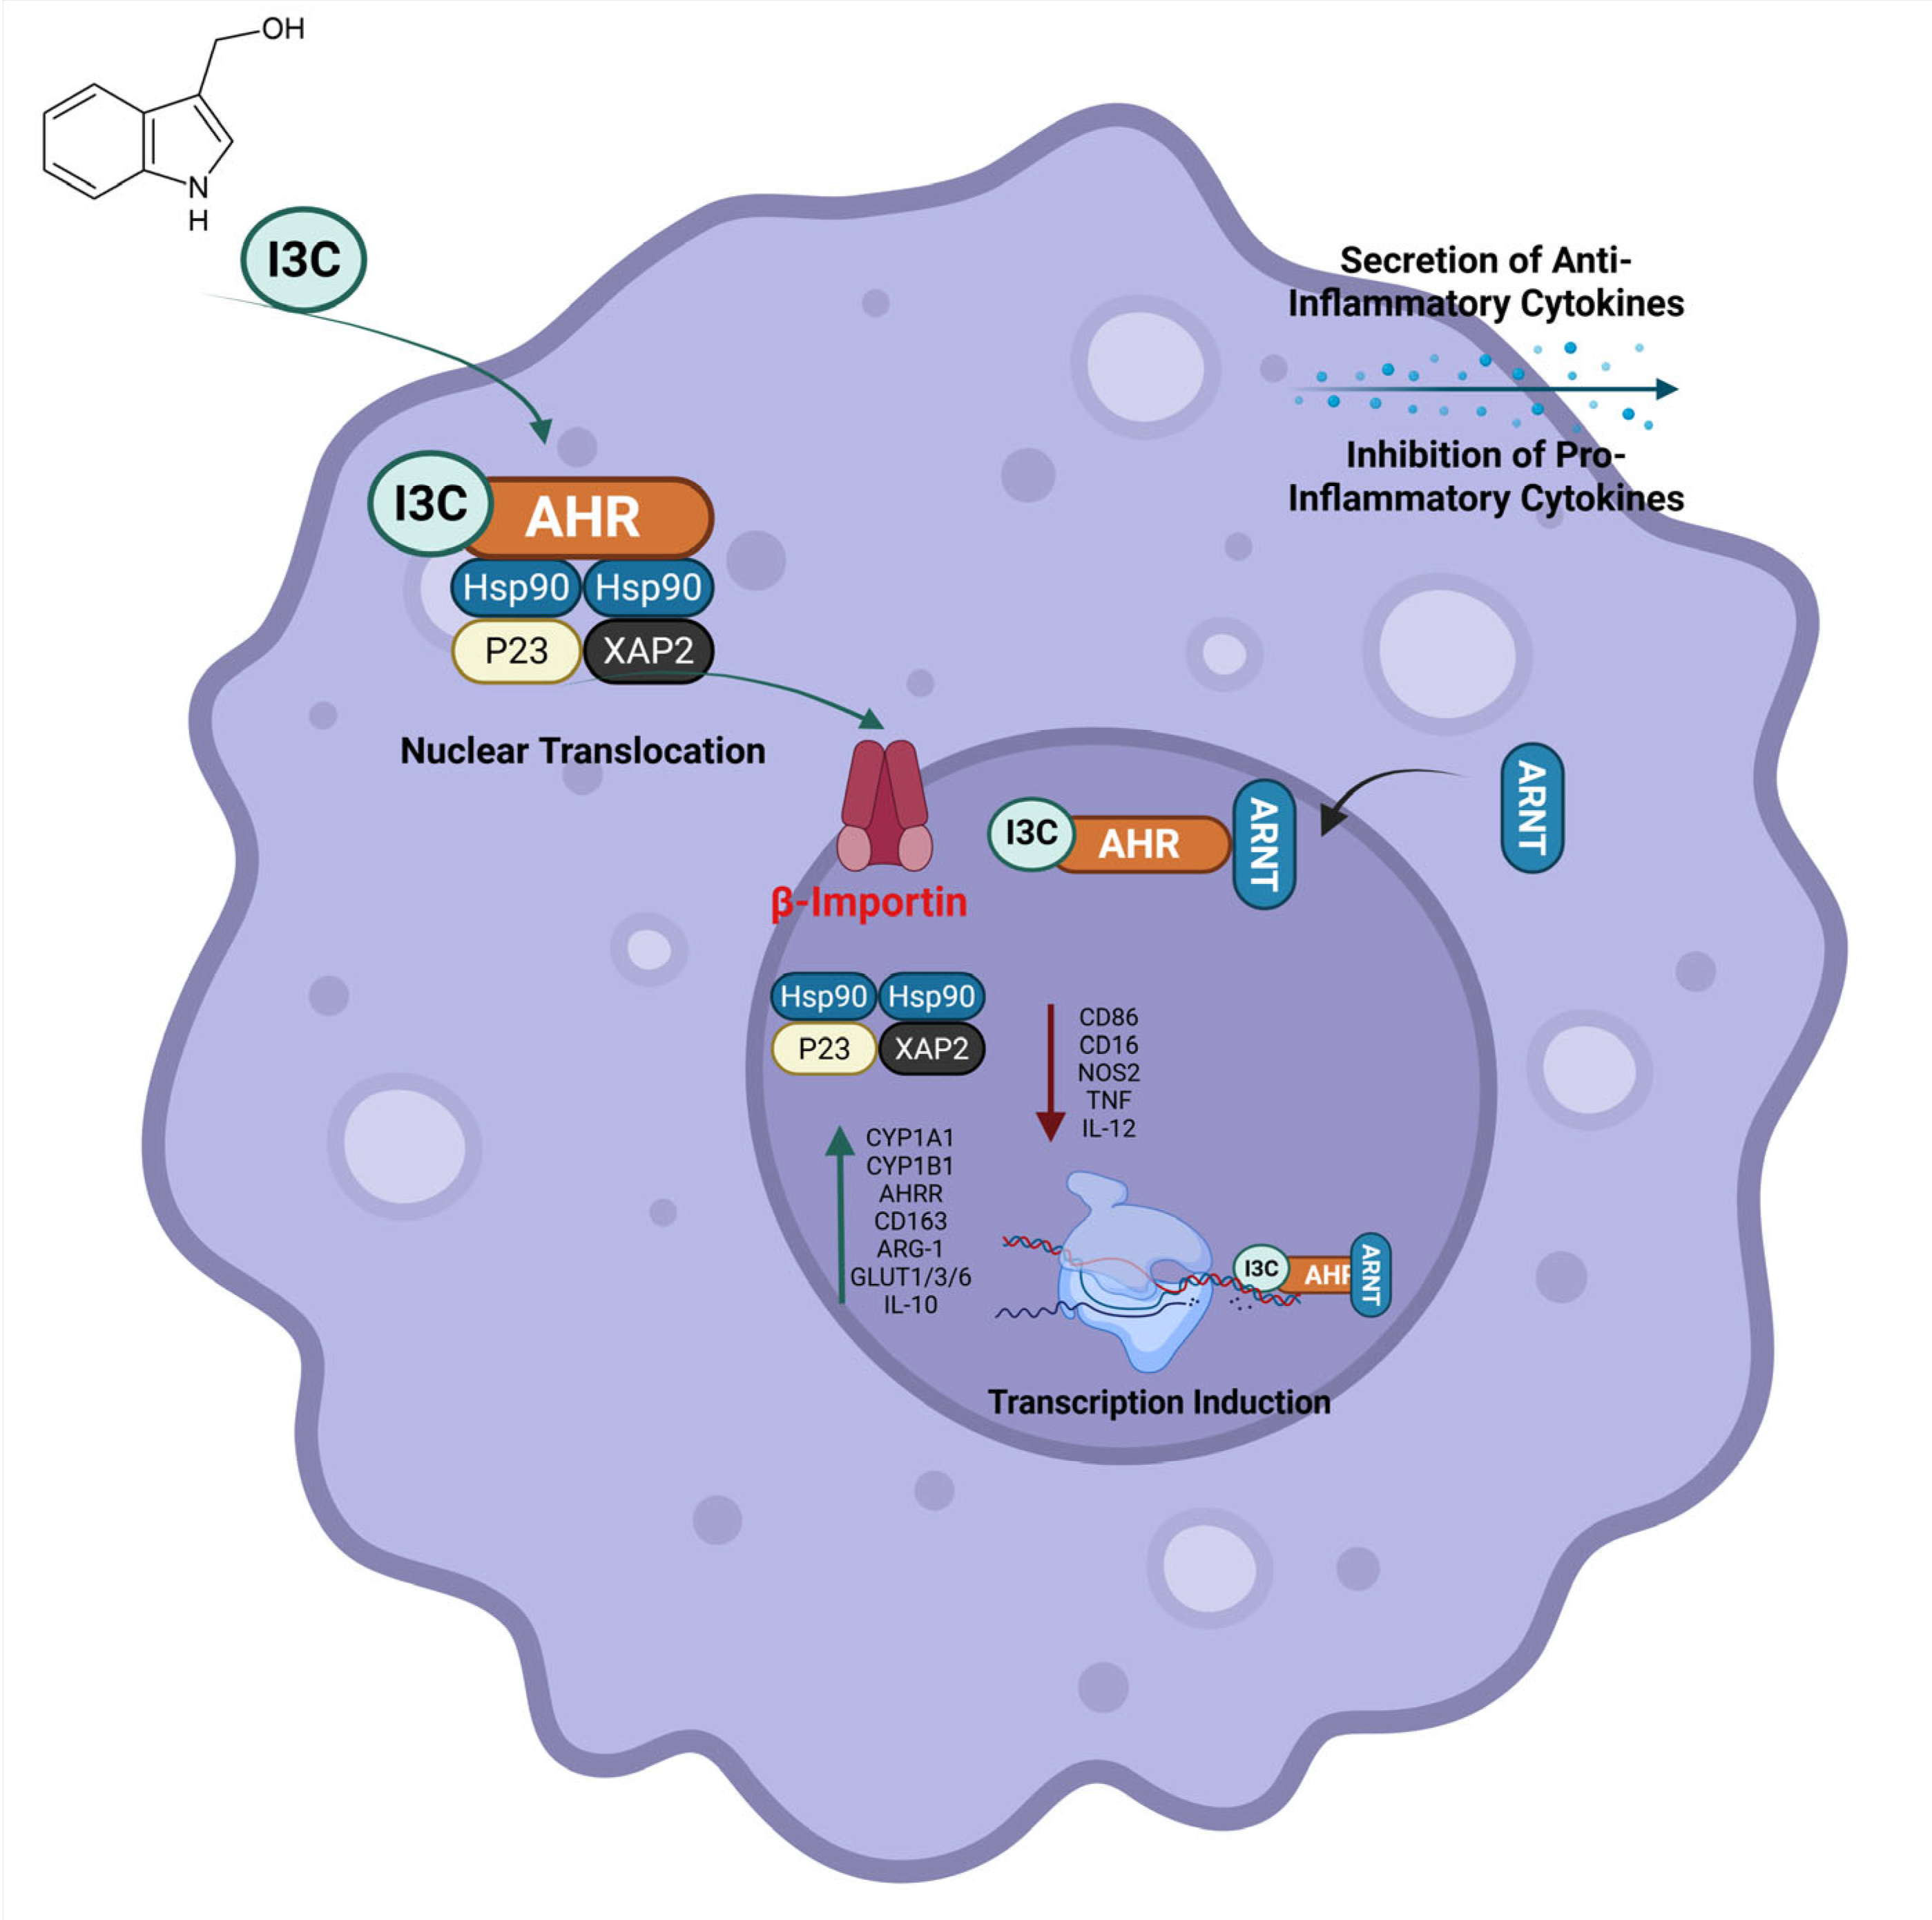
To visually consolidate our findings, we have proposed a mechanistic model summarizing the effects of I3C on macrophage polarization and glucose transporter regulation (Figure 7). This schematic outlines the activation of the AHR signaling pathway upon I3C treatment, leading to the transcription of key AHR target genes (CYP1A1, CYP1B1), the modulation of cytokine and surface marker expression, and a phenotypic shift toward M2-like macrophages. The figure also highlights the upregulation of glucose transporters (GLUT1, GLUT3, and GLUT6), suggesting a link between AHR signaling and metabolic reprogramming in support of anti-inflammatory function. This model emphasizes I3C’s dual role in modulating immune responses and cellular metabolism, and it provides a foundation for future mechanistic and functional validation studies.

5. Conclusions

Our study provides helpful information about the immunomodulatory effects of indole-3-carbinol (I3C) on THP-1 macrophages, particularly its role in activating AHR and influencing macrophage polarization. We observed that I3C significantly elevated the expression of CYP1A1 and CYP1B1, genes associated with AHR activation, similar to TCDD, while exhibiting a unique expression profile for AHRR, suggesting a nuanced regulatory mechanism. Moreover, I3C promoted an anti-inflammatory M2 macrophage phenotype by upregulating markers such as CD163 and ARG1 while downregulating M1 markers, including CD86 and NOS2. These changes were accompanied by overexpressed anti-inflammatory cytokines (IL-10, TGF-β) over pro-inflammatory ones (IL-12, TNF-α). Additionally, I3C influenced glucose transporter expression, suggesting a shift in immunometabolism that supports the anti-inflammatory function of M2 macrophages. Accordingly, I3C could be introduced as a therapeutic agent for immune-related disorders, emphasizing its role in promoting an anti-inflammatory state and modulating immune responses through both macrophage polarization and metabolic pathways. Further studies are needed to investigate the precise molecular mechanisms and to explore its clinical applications.

Author Contributions

Conceptualization, S.M., A.A.-H. and Y.Y.; methodology, D.O. and S.M.; software, S.M. and M.S.; validation, D.O., M.M. and S.M.; formal analysis, D.O. and S.M.; investigation, D.O., M.M., F.S.S. and S.M.; resources, S.M. and Y.Y.; data curation, D.O. and S.M.; writing—original draft preparation, D.O. and S.M.; writing—review and editing, S.M., A.A.-H. and Y.Y.; supervision, S.M. and Y.Y.; project administration, A.A.-H. and Y.Y. All authors have read and agreed to the published version of the manuscript.

Funding

This work was supported by grants from the Department of Research and Technology at Golestan University of Medical Sciences (No. 111884) and the Oman Ministry of Higher Education, Research, and Innovation (No. BFP/RGP/HSS/24/015). The APC was funded by s.mohammadi@goums.ac.ir (S.M.) reviewers’ vouchers.

Institutional Review Board Statement

The study acquired confirmation from the ethics committee at Golestan University of Medical Sciences (Code of Ethics: IR.GOUMS.REC.1400.333).

Informed Consent Statement

Informed consent was obtained from all subjects involved in the study.

Data Availability Statement

All data can be accessed upon a reasonable request directed to Y.Y. via yazdani@goums.ac.ir.

Acknowledgments

We extend our heartfelt gratitude to the personnel of the Research Central Laboratory at Golestan University of Medical Sciences for their crucial support and assistance during this research project.

Conflicts of Interest

The authors declare no conflicts of interest.

References

  1. Ta, W.; Chawla, A.; Pollard, J. Origins and hallmarks of macrophages: Development, homeostasis, and disease. Nature 2013, 496, 445–455. [Google Scholar]
  2. Viola, A.; Munari, F.; Sanchez-Rodriguez, R.; Scolaro, T.; Castegna, A. The Metabolic Signature of Macrophage Responses. Front. Immunol. 2019, 10, 1462. [Google Scholar] [CrossRef] [PubMed]
  3. Lichtnekert, J.; Kawakami, T.; Parks, W.C.; Duffield, J.S. Changes in macrophage phenotype as the immune response evolves. Curr. Opin. Pharmacol. 2013, 13, 555–564. [Google Scholar] [CrossRef]
  4. Sica, A.; Erreni, M.; Allavena, P.; Porta, C. Macrophage polarization in pathology. Cell. Mol. Life Sci. 2015, 72, 4111–4126. [Google Scholar] [CrossRef] [PubMed]
  5. Horhold, F.; Eisel, D.; Oswald, M.; Kolte, A.; Roll, D.; Osen, W.; Eichmuller, S.B.; Konig, R. Reprogramming of macrophages employing gene regulatory and metabolic network models. PLoS Comput. Biol. 2020, 16, e1007657. [Google Scholar] [CrossRef] [PubMed]
  6. Kraakman, M.J.; Murphy, A.J.; Jandeleit-Dahm, K.; Kammoun, H.L. Macrophage polarization in obesity and type 2 diabetes: Weighing down our understanding of macrophage function? Front. Immunol. 2014, 5, 470. [Google Scholar] [CrossRef]
  7. Stunault, M.I.; Bories, G.; Guinamard, R.R.; Ivanov, S. Metabolism plays a key role during macrophage activation. Mediat. Inflamm. 2018, 2018, 2426138. [Google Scholar] [CrossRef]
  8. Gauthier, T.; Chen, W. Modulation of macrophage immunometabolism: A new approach to fight infections. Front. Immunol. 2022, 13, 780839. [Google Scholar] [CrossRef]
  9. Wang, L.; Wang, D.; Zhang, T.; Ma, Y.; Tong, X.; Fan, H. The role of immunometabolism in macrophage polarization and its impact on acute lung injury/acute respiratory distress syndrome. Front. Immunol. 2023, 14, 1117548. [Google Scholar] [CrossRef]
  10. Caruana, B.T.; Byrne, F.L.; Knights, A.J.; Quinlan, K.G.R.; Hoehn, K.L. Characterization of Glucose Transporter 6 in Lipopolysaccharide-Induced Bone Marrow-Derived Macrophage Function. J. Immunol. 2019, 202, 1826–1832. [Google Scholar] [CrossRef]
  11. Freemerman, A.J.; Johnson, A.R.; Sacks, G.N.; Milner, J.J.; Kirk, E.L.; Troester, M.A.; Macintyre, A.N.; Goraksha-Hicks, P.; Rathmell, J.C.; Makowski, L. Metabolic reprogramming of macrophages glucose transporter 1 (GLUT1)-mediated glucose metabolism drives a proinflammatory phenotype. J. Biol. Chem. 2014, 289, 7884–7896. [Google Scholar] [CrossRef] [PubMed]
  12. Newsholme, E.A.; Newsholme, P.; Curi, R. The role of the citric acid cycle in cells of the immune system and its importance in sepsis, trauma and burns. In Proceedings of the Biochemical Society Symposium, London, UK; 1987; pp. 145–162. [Google Scholar]
  13. Newsholme, P.; Gordon, S.; Newsholme, E.A. Rates of utilization and fates of glucose, glutamine, pyruvate, fatty acids and ketone bodies by mouse macrophages. Biochem. J. 1987, 242, 631–636. [Google Scholar] [CrossRef]
  14. Jeon, E.H.; Park, T.S.; Jang, Y.; Hwang, E.; Kim, S.-J.; Song, K.-D.; Weinstein, D.A.; Lee, Y.M.; Park, B.-C.; Jun, H.S. Glucose-6-phosphate transporter mediates macrophage proliferation and functions by regulating glycolysis and mitochondrial respiration. Biochem. Biophys. Res. Commun. 2020, 524, 89–95. [Google Scholar] [CrossRef]
  15. Curi, R.; de Siqueira Mendes, R.; de Campos Crispin, L.A.; Norata, G.D.; Sampaio, S.C.; Newsholme, P. A past and present overview of macrophage metabolism and functional outcomes. Clin. Sci. 2017, 131, 1329–1342. [Google Scholar] [CrossRef]
  16. Quintana, F.J. The aryl hydrocarbon receptor: A molecular pathway for the environmental control of the immune response. Immunology 2013, 138, 183–189. [Google Scholar] [CrossRef] [PubMed]
  17. Korecka, A.; Dona, A.; Lahiri, S.; Tett, A.J.; Al-Asmakh, M.; Braniste, V.; D’Arienzo, R.; Abbaspour, A.; Reichardt, N.; Fujii-Kuriyama, Y.; et al. Bidirectional communication between the Aryl hydrocarbon Receptor (AhR) and the microbiome tunes host metabolism. NPJ Biofilms Microbiomes 2016, 2, 16014. [Google Scholar] [CrossRef] [PubMed]
  18. Aggarwal, B.B.; Ichikawa, H. Molecular targets and anticancer potential of indole-3-carbinol and its derivatives. Cell Cycle 2005, 4, 1201–1215. [Google Scholar] [CrossRef]
  19. Mohammadi, S.; Memarian, A.; Sedighi, S.; Behnampour, N.; Yazdani, Y. Immunoregulatory effects of indole-3-carbinol on monocyte-derived macrophages in systemic lupus erythematosus: A crucial role for aryl hydrocarbon receptor. Autoimmunity 2018, 51, 199–209. [Google Scholar] [CrossRef]
  20. Ma, X.; Yan, W.; Zheng, H.; Du, Q.; Zhang, L.; Ban, Y.; Li, N.; Wei, F. Regulation of IL-10 and IL-12 production and function in macrophages and dendritic cells. F1000Research 2015, 4, 1465. [Google Scholar] [CrossRef]
  21. Mohammadi, S.; Seyedhosseini, F.S.; Behnampour, N.; Yazdani, Y. Indole-3-carbinol induces G1 cell cycle arrest and apoptosis through aryl hydrocarbon receptor in THP-1 monocytic cell line. J. Recept. Signal Transduct. 2017, 37, 506–514. [Google Scholar] [CrossRef]
  22. Mohammadi, S.; Sedighi, S.; Memarian, A.; Yazdani, Y.J.L. Overexpression of interferon-γ and indoleamine 2, 3-dioxygenase in systemic lupus erythematosus: Relationship with the disease activity. LaboratoriumsMedizin 2017, 41, 41–47. [Google Scholar] [CrossRef]
  23. Ociepa-Zawal, M.; Rubiś, B.; Laciński, M.; Trzeciak, W.H. The effect of indole-3-carbinol on the expression of CYP1A1, CYP1B1 and AhR genes and proliferation of MCF-7 cells. Acta Biochim. Pol. 2007, 54, 113–117. [Google Scholar] [CrossRef] [PubMed]
  24. Gargaro, M.; Scalisi, G.; Manni, G.; Mondanelli, G.; Grohmann, U.; Fallarino, F. The landscape of AhR regulators and coregulators to fine-tune AhR functions. Int. J. Mol. Sci. 2021, 22, 757. [Google Scholar] [CrossRef] [PubMed]
  25. Coelho, N.; Pimpão, A.; Correia, M.; Rodrigues, T.; Monteiro, E.; Morello, J.; Pereira, S. Pharmacological blockage of the AHR-CYP1A1 axis: A call for in vivo evidence. J. Mol. Med. 2022, 100, 215–243. [Google Scholar] [CrossRef]
  26. Esteves, F.; Rueff, J.; Kranendonk, M.J. The central role of cytochrome P450 in xenobiotic metabolism—A brief review on a fascinating enzyme family. J. Xenobiotics 2021, 11, 94–114. [Google Scholar] [CrossRef]
  27. Guzman-Navarro, G.; León, M.B.d.; Martín-Estal, I.; Durán, R.C.-D.; Villarreal-Alvarado, L.; Vaquera-Vazquez, A.; Cuevas-Cerda, T.; Garza-García, K.; Cuervo-Pérez, L.E.; Barbosa-Quintana, Á.; et al. Prenatal indole-3-carbinol administration activates aryl hydrocarbon receptor-responsive genes and attenuates lung injury in a bronchopulmonary dysplasia model. Exp. Biol. Med. 2021, 246, 695–706. [Google Scholar] [CrossRef] [PubMed]
  28. Ohashi, Y.; Uchida, K.; Fukushima, K.; Satoh, M.; Koyama, T.; Tsuchiya, M.; Saito, H.; Uchiyama, K.; Takahira, N.; Inoue, G.; et al. Correlation between CD163 expression and resting pain in patients with hip osteoarthritis: Possible contribution of CD163+ monocytes/macrophages to pain pathogenesis. J. Orthop. Res. 2022, 40, 1365–1374. [Google Scholar] [CrossRef]
  29. Cutolo, M.; Campitiello, R.; Gotelli, E.; Soldano, S. The role of M1/M2 macrophage polarization in rheumatoid arthritis synovitis. Front. Immunol. 2022, 13, 867260. [Google Scholar] [CrossRef]
  30. Rath, M.; Müller, I.; Kropf, P.; Closs, E.I.; Munder, M. Metabolism via arginase or nitric oxide synthase: Two competing arginine pathways in macrophages. Front. Immunol. 2014, 5, 532. [Google Scholar] [CrossRef]
  31. Zhang, W.; Guan, N.; Zhang, X.; Liu, Y.; Gao, X.; Wang, L. Study on the imbalance of M1/M2 macrophage polarization in severe chronic periodontitis. Technol. Health Care 2023, 31, 117–124. [Google Scholar] [CrossRef]
  32. Dixon, K.J.; Wu, J.; Walcheck, B. Engineering anti-tumor monoclonal antibodies and Fc receptors to enhance ADCC by human NK cells. Cancers 2021, 13, 312. [Google Scholar] [CrossRef]
  33. Hullsiek, R.; Li, Y.; Snyder, K.M.; Wang, S.; Di, D.; Borgatti, A.; Lee, C.; Moore, P.F.; Zhu, C.; Fattori, C.; et al. Examination of IgG Fc receptor CD16A and CD64 expression by canine leukocytes and their ADCC activity in engineered NK cells. Front. Immunol. 2022, 13, 841859. [Google Scholar] [CrossRef]
  34. Mir, M.; Albaradeh, R.; Agrewala, J. Innate–effector immune response elicitation against tuberculosis through anti-B7-1 (CD80) and anti-B7-2 (CD86) signaling in macrophages. Int. J. Phar. Biol Allied Sci. 2013, 2, 1024–1043. [Google Scholar]
  35. Skytthe, M.K.; Graversen, J.H.; Moestrup, S.K. Targeting of CD163+ macrophages in inflammatory and malignant diseases. Int. J. Mol. Sci. 2020, 21, 5497. [Google Scholar] [CrossRef]
  36. Gantzel, R.H.; Kjær, M.B.; Laursen, T.L.; Kazankov, K.; George, J.; Møller, H.J.; Grønbæk, H. Macrophage activation markers, soluble CD163 and mannose receptor, in liver fibrosis. Front. Med. 2021, 7, 615599. [Google Scholar] [CrossRef] [PubMed]
  37. Martí i Líndez, A.-A.; Reith, W. Arginine-dependent immune responses. Cell. Mol. Life Sci. 2021, 78, 5303–5324. [Google Scholar] [CrossRef] [PubMed]
  38. Mondanelli, G.; Iacono, A.; Carvalho, A.; Orabona, C.; Volpi, C.; Pallotta, M.T.; Matino, D.; Esposito, S.; Grohmann, U. Amino acid metabolism as drug target in autoimmune diseases. Autoimmun. Rev. 2019, 18, 334–348. [Google Scholar] [CrossRef]
  39. Haydar, D.; Cory, T.J.; Birket, S.E.; Murphy, B.S.; Pennypacker, K.R.; Sinai, A.P.; Feola, D.J. Azithromycin polarizes macrophages to an M2 phenotype via inhibition of the STAT1 and NF-κB signaling pathways. J. Immunol. 2019, 203, 1021–1030. [Google Scholar] [CrossRef]
  40. Hezaveh, K.; Shinde, R.S.; Klötgen, A.; Halaby, M.J.; Lamorte, S.; Quevedo, R.; Neufeld, L.; Liu, Z.Q.; Jin, R.; Grünwald, B.T. Tryptophan-derived microbial metabolites activate the aryl hydrocarbon receptor in tumor-associated macrophages to suppress anti-tumor immunity. Immunity 2022, 55, 324–340.e328. [Google Scholar] [CrossRef]
  41. Shreshtha, S.; Sharma, P.; Kumar, P.; Sharma, R.; Singh, S. Nitric Oxide: It’s Role Immunity. J. Clin. Diagn. Res. 2018, 12. [Google Scholar] [CrossRef]
  42. Rostoka, E.; Isajevs, S.; Baumane, L.; Line, A.; Silina, K.; Dzintare, M.; Sharipova, J.; Svirina, D.; Kalvinsh, I.; Sjakste, N. Effects of lycopene, indole-3-carbinol, and luteolin on nitric oxide production and iNOS expression are organ-specific in rats. Arh. Za Hig. Rada I Toksikol. 2010, 61, 275–284. [Google Scholar] [CrossRef] [PubMed]
  43. Chang, H.; Wang, M.; Hsu, C.; Liu, M.; Chan, M.; Chen, Y.-H. Suppression of inflammation-associated factors by indole-3-carbinol in mice fed high-fat diets and in isolated, co-cultured macrophages and adipocytes. Int. J. Obes. 2011, 35, 1530–1538. [Google Scholar] [CrossRef] [PubMed]
  44. Emampanahi, M.; Masoudi Rad, S.; Saghaeian Jazi, M.; Mansour Samaei, N.; Behnampour, N.; Mohammadi, S.; Fakhari, E. Association between interleukin-10 gene polymorphisms and severe chronic periodontitis. Oral Dis. 2019, 25, 1619–1626. [Google Scholar] [CrossRef]
  45. Mohammadi, S.; Saghaeian Jazi, M.; Zare Ebrahimabad, M.; Eghbalpour, F.; Abdolahi, N.; Tabarraei, A.; Yazdani, Y. Interleukin 10 gene promoter polymorphisms (rs1800896, rs1800871 and rs1800872) and haplotypes are associated with the activity of systemic lupus erythematosus and IL10 levels in an Iranian population. Int. J. Immunogenet. 2019, 46, 20–30. [Google Scholar] [CrossRef]
  46. Wang, Y.; Smith, W.; Hao, D.; He, B.; Kong, L. M1 and M2 macrophage polarization and potentially therapeutic naturally occurring compounds. Int. Immunopharmacol. 2019, 70, 459–466. [Google Scholar] [CrossRef]
  47. Zhao, X.; Di, Q.; Liu, H.; Quan, J.; Ling, J.; Zhao, Z.; Xiao, Y.; Wu, H.; Wu, Z.; Song, W.; et al. MEF2C promotes M1 macrophage polarization and Th1 responses. Cell. Mol. Immunol. 2022, 19, 540–553. [Google Scholar] [CrossRef] [PubMed]
  48. Lee, K.Y. M1 and M2 polarization of macrophages: A mini-review. Med Biol. Sci. Eng. 2019, 2, 1–5. [Google Scholar] [CrossRef]
  49. Van den Bossche, J.; O’Neill, L.A.; Menon, D. Macrophage immunometabolism: Where are we (going)? Trends Immunol. 2017, 38, 395–406. [Google Scholar] [CrossRef]
  50. Shapiro, H.; Lutaty, A.; Ariel, A. Macrophages, meta-inflammation, and immuno-metabolism. Sci. World J. 2011, 11, 2509–2529. [Google Scholar] [CrossRef]
  51. Pålsson-McDermott, E.M.; O’Neill, L.A.J. Targeting immunometabolism as an anti-inflammatory strategy. Cell Res. 2020, 30, 300–314. [Google Scholar] [CrossRef]
  52. Cheng, J.; Cai, W.; Zong, S.; Yu, Y.; Wei, F. Metabolite transporters as regulators of macrophage polarization. Naunyn-Schmiedeberg’s Arch. Pharmacol. 2021, 395, 13–25. [Google Scholar] [CrossRef]
  53. Bai, G.; Matsuba, T.; Niki, T.; Hattori, T. Stimulation of THP-1 macrophages with LPS increased the production of osteopontin-encapsulating exosome. Int. J. Mol. Sci. 2020, 21, 8490. [Google Scholar] [CrossRef] [PubMed]
  54. Park, E.; Jung, H.; Yang, H.; Yoo, M.; Kim, C.; Kim, K.J. Optimized THP-1 differentiation is required for the detection of responses to weak stimuli. Inflamm Res. 2007, 56, 45–50. [Google Scholar] [CrossRef]
  55. Schliefsteiner, C.; Ibesich, S.; Wadsack, C. Placental Hofbauer cell polarization resists inflammatory cues in vitro. Int. J. Mol. Sci. 2020, 21, 736. [Google Scholar] [CrossRef] [PubMed]
  56. Liu, X.; Yin, S.; Chen, Y.; Wu, Y.; Zheng, W.; Dong, H.; Bai, Y.; Qin, Y.; Li, J.; Feng, S.; et al. LPS-induced proinflammatory cytokine expression in human airway epithelial cells and macrophages via NF-κB, STAT3 or AP-1 activation. Mol. Med. Rep. 2018, 17, 5484–5491. [Google Scholar] [CrossRef] [PubMed]
  57. Williams, D.E. Indoles derived from glucobrassicin: Cancer chemoprevention by indole-3-carbinol and 3, 3’-diindolylmethane. Front. Nutr. 2021, 8, 734334. [Google Scholar] [CrossRef]
  58. Banerjee, S.; Kong, D.; Wang, Z.; Bao, B.; Hillman, G.G.; Sarkar, F.H. Attenuation of multi-targeted proliferation-linked signaling by 3, 3′-diindolylmethane (DIM): From bench to clinic. Mutat. Res. Mol. Mech. Mutagen. 2011, 728, 47–66. [Google Scholar] [CrossRef]
  59. Rasheed, A.; Rayner, K.J. Macrophage responses to environmental stimuli during homeostasis and disease. Endocr. Rev. 2021, 42, 407–435. [Google Scholar] [CrossRef]
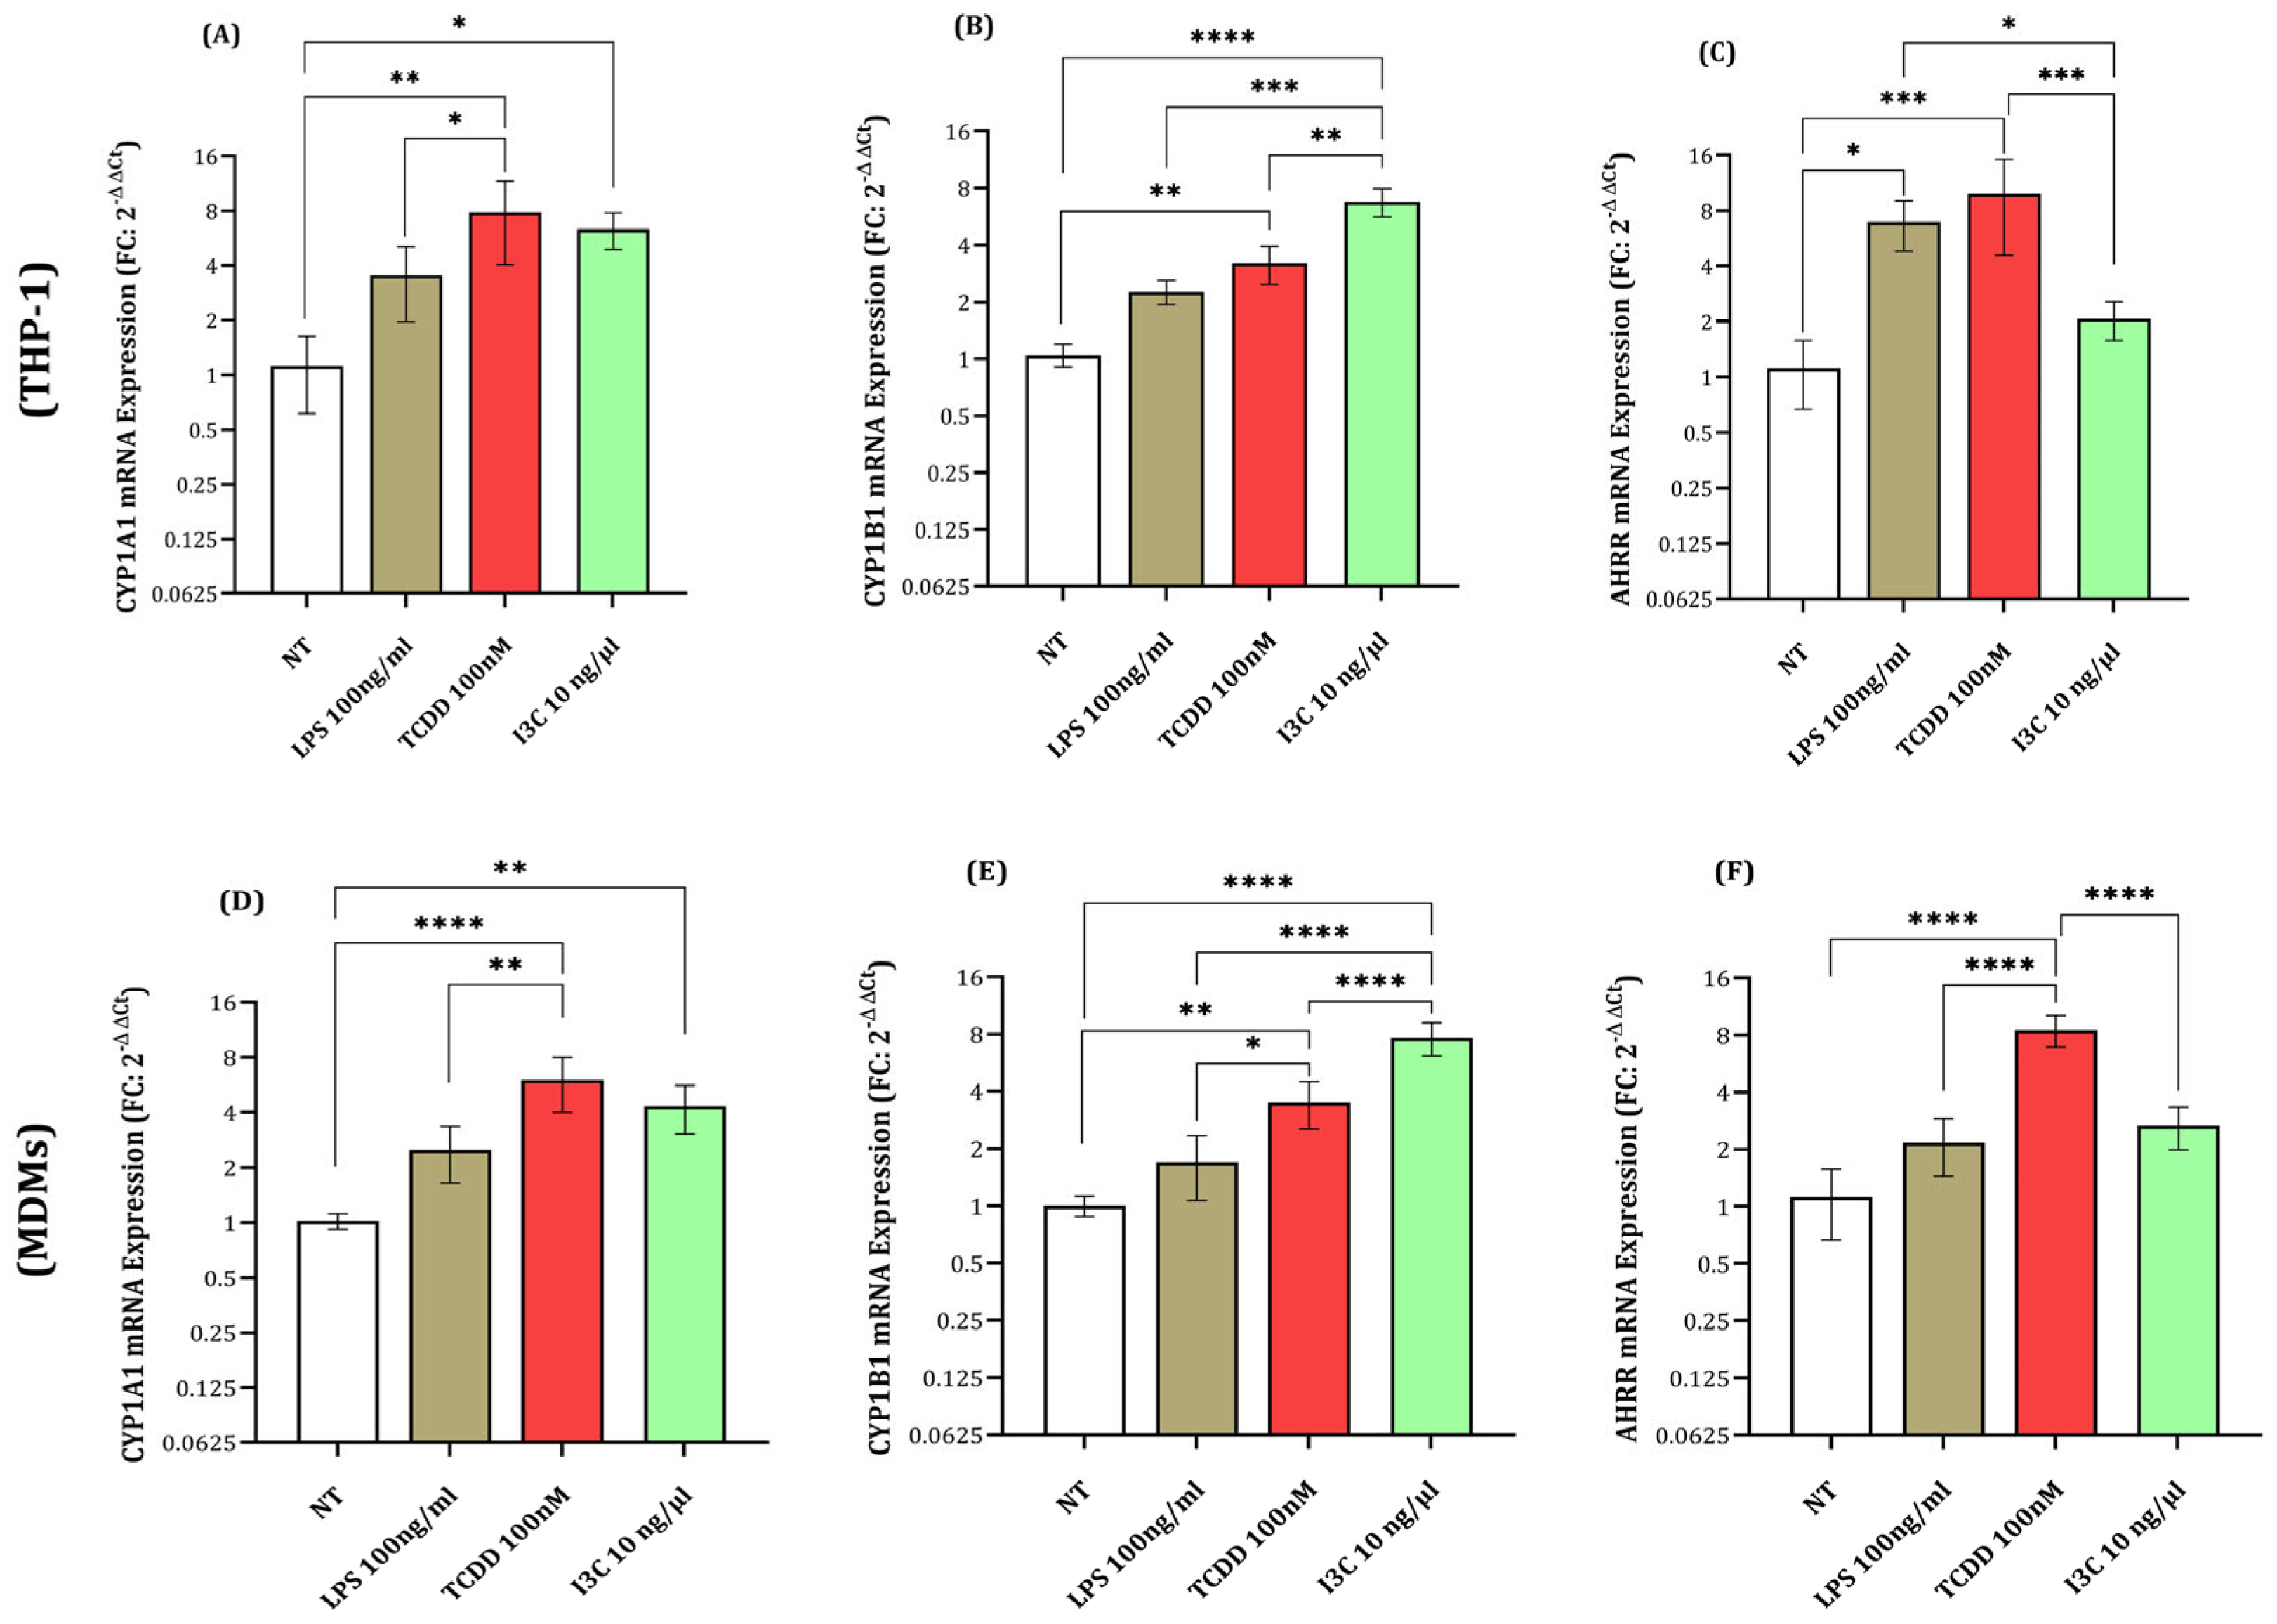
Figure 1. Expression of AHR activation genes in macrophages treated with I3C, TCDD, and LPS. (A) CYP1A1 expression increased in the I3C group (FC = 6.35 ± 1.59, p < 0.05) and TCDD group (FC = 7.86, p < 0.01) vs. the NT group. The LPS group (FC = 3.5 ± 1.73) was lower than TCDD (p < 0.05). (B) CYP1B1 expression was higher in the I3C group (FC = 6.77 ± 1.49, p < 0.0001) and TCDD group (FC = 3.2 ± 0.82, p < 0.01) vs. the NT group. The LPS group (FC = 2.26 ± 0.33) was lower than the I3C group (p < 0.001). (C) AHRR expression was lower in the I3C group (FC = 2.08 ± 0.56) vs. the TCDD (FC = 9.87 ± 5.6, p < 0.001) and LPS (FC = 6.95 ± 2.36, p < 0.05) groups. (D) In MDMs, CYP1A1 expression increased in the I3C group (FC = 4.34 ± 1.23, p < 0.01) and TCDD group (FC = 6.00 ± 1.89, p < 0.0001) vs. the NT group. The LPS group (FC = 2.50 ± 0.89) was lower than the TCDD group (p < 0.01). (E) CYP1B1 expression in MDMs was higher in the I3C group (FC = 7.67 ± 1.49, p < 0.0001) and TCDD group (FC = 3.51 ± 0.82, p < 0.01) vs. the NT group. The LPS group (FC = 1.70 ± 0.55) was lower than the I3C group (p < 0.0001). (F) AHRR expression in MDMs increased in the TCDD group (FC = 8.50 ± 1.56, p < 0.0001) vs. the NT group. The I3C group (FC = 2.67 ± 0.56) and LPS group (FC = 2.17 ± 0.72) showed no significant difference vs. the NT group (p > 0.05). Each column represents the mean fold change in gene expression, and the error bars indicate the standard deviation. The statistical significance was determined using a one-way ANOVA, followed by Tukey’s post hoc test. * p < 0.05, ** p < 0.01, *** p < 0.001, **** p < 0.0001.
Immuno 05 00015 g001
Figure 2. Expression of CD16, CD86, and CD163 markers in THP-1 macrophage-like cells treated with I3C, TCDD, and LPS compared to untreated controls. (A) CD16 expression, (B) CD86 expression, and (C) CD163 expression were analyzed by flow cytometry following a 24-h treatment. The blue histograms represent stained samples, while the red histograms indicate isotype control staining. Unstained controls were used during the acquisition for gate setting. Flow cytometry gating included FSC/SSC-based selection of viable macrophage populations, doublet exclusion, and marker-specific gating based on matched isotype controls. The data are presented as mean percentages of positive cells ± SD (n = 6). The statistical significance was determined using a one-way ANOVA, followed by Tukey’s post hoc test. * p < 0.05, *** p < 0.001, **** p < 0.0001.
Immuno 05 00015 g002
Figure 3. Gene expression analysis of ARG1 and NOS2 in THP-1 cells and MDMs treated with I3C, TCDD, and LPS. (A) In the THP-1 cells, the LPS treatment significantly increased ARG1 expression (FC = 1.44 ± 0.23) compared to the NT group (FC = 1.01 ± 0.09) (p < 0.01). The TCDD treatment significantly suppressed ARG1 expression, with levels approximately two times lower than the NT group (FC = 0.70 ± 0.13) (p < 0.001), while the I3C treatment had no significant effect on ARG1 expression (FC = 1.12 ± 0.22). (B) NOS2 expression in THP-1 cells was significantly increased following the LPS treatment (FC = 1.45 ± 0.27) compared to the NT group (FC = 1.00 ± 0.12). The TCDD treatment led to a mild but non-significant upregulation of NOS2 expression (FC = 1.19 ± 0.30), while the I3C treatment significantly reduced NOS2 expression (FC = 0.88 ± 0.18) compared to the LPS group. (C) In MDMs, ARG1 expression was significantly higher in the I3C-treated group (FC = 1.71 ± 0.14) compared to the TCDD group (FC = 0.312 ± 0.12) (p < 0.05). The TCDD treatment significantly suppressed ARG1 expression by approximately three times lower than in the NT group (FC = 1.19 ± 0.55) (p < 0.01). The LPS treatment led to a notable increase in ARG1 expression (FC = 2.98 ± 1.50). (D) NOS2 expression in MDMs was significantly decreased in the I3C-treated group (FC = 0.23 ± 0.06) compared to all other groups. The TCDD treatment resulted in a significant increase in NOS2 expression (FC = 4.27 ± 0.75) by approximately four times higher than in the NT group (p < 0.001). The LPS treatment also elevated NOS2 expression (FC = 3.75 ± 0.65), and NOS2 expression in the TCDD group was more than ten times higher than in the I3C group (p < 0.0001). Each column represents the mean fold change in gene expression, and the error bars indicate the standard deviation. The statistical significance was determined using a one-way ANOVA, followed by Tukey’s post hoc test. * p < 0.05, ** p < 0.01, *** p < 0.001, **** p < 0.0001.
Immuno 05 00015 g003
Figure 4. Gene expression and cytokine analysis of IL-10, IL-12, TNF-α, and TGF-β in THP-1 cells treated with I3C, TCDD, and LPS. (A) IL-10 gene expression was significantly higher in the I3C-treated group (FC = 2.34 ± 0.31) compared to the TCDD group (FC = 0.25 ± 0.44) (p < 0.01) and the NT group. The LPS treatment also significantly increased IL-10 expression (FC = 2.97 ± 0.36) (p < 0.0001). (B) IL-12 expression was higher in the I3C group (FC = 0.96 ± 0.18) compared to the TCDD group (FC = 0.292 ± 0.07) (p < 0.01) but lower than the LPS group (FC = 2.90 ± 0.61) (p < 0.0001). TCDD treatment resulted in significantly lower IL-12 expression compared to NT (p < 0.05) and LPS (p < 0.0001) groups. (C) TGF-β cytokine levels were 589.01 ± 5.30 pg/mL in the NT group, 547.54 ± 3.29 pg/mL in the LPS group, 588.04 ± 4.23 pg/mL in the I3C group, and 557.35 ± 3.30 pg/mL in the TCDD group. Significant reductions in TGF-β were observed in the LPS group compared to the NT group (p < 0.05) and in the TCDD group compared to the I3C group (p < 0.05). (D) The TNF-α levels were 55.82 ± 1.49 pg/mL in the NT group, 74.23 ± 0.98 pg/mL in the LPS group, 67.84 ± 0.54 pg/mL in the I3C group, and 74.48 ± 0.58 pg/mL in the TCDD group. The TNF-α expression was significantly lower in the I3C group compared to the TCDD group (p < 0.01) and higher in the LPS group compared to the NT group (p < 0.0001). Each column represents a mean fold change in the gene expression or cytokine concentration, with the error bars indicating the standard deviation. The statistical significance was determined using a one-way ANOVA, followed by Tukey’s post hoc test. * p < 0.05, ** p < 0.01, *** p < 0.001, **** p < 0.0001.
Immuno 05 00015 g004
Figure 5. Expression of GLUT1, GLUT3, and GLUT6 genes in THP-1 cells and MDMs treated with I3C, TCDD, and LPS compared to untreated controls. (A) In the THP-1 cells, GLUT1 expression was significantly upregulated in the I3C-treated group (FC = 2.19 ± 0.46, p < 0.001) compared to the NT group. The LPS treatment also significantly increased GLUT1 expression (FC = 1.9 ± 0.19, p < 0.001). Although decreased, the TCDD treatment did not show a significant change in GLUT1 expression (FC = 0.63 ± 0.38, p > 0.05) relative to the NT group. Moreover, the I3C-treated cells exhibited approximately 3.5-fold higher GLUT1 expression compared to the TCDD group (p < 0.0001). (B) GLUT3 expression was significantly elevated in the I3C-treated group (FC = 3.87 ± 0.13, p < 0.0001) and in the LPS-treated group (FC = 2.94 ± 0.34, p < 0.0001) compared to the NT group. The TCDD treatment resulted in a significant decrease in GLUT3 expression (FC = 0.65 ± 0.36, p < 0.01) relative to the NT group. (C) GLUT6 expression was significantly upregulated in both the I3C (FC = 2.49 ± 0.08, p < 0.001) and LPS (FC = 2.54 ± 0.29, p < 0.0001) treatment groups, whereas the TCDD treatment led to a significant downregulation of GLUT6 expression (FC = 0.57 ± 0.28, p < 0.01) compared to the NT group. (D) In the MDMs, GLUT1 expression was significantly higher in the I3C-treated group (FC = 6.56 ± 1.14) compared to the NT group (FC = 1.02 ± 0.09) (p < 0.0001). The TCDD treatment resulted in a non-significant change in GLUT1 expression (FC = 1.13 ± 0.21) (p > 0.05). The LPS treatment significantly upregulated GLUT1 expression (FC = 3.34 ± 0.28, p < 0.001). Moreover, GLUT1 expression in the I3C-treated group was approximately six times higher than in the TCDD group (p < 0.0001). (E) GLUT3 expression in the I3C-treated group was significantly lower (FC = 0.79 ± 0.21) compared to the NT group (FC = 1.01 ± 0.10) (p < 0.05). The TCDD treatment significantly increased GLUT3 expression (FC = 2.32 ± 0.38) compared to the NT group (p < 0.01). The LPS treatment induced a modest but significant increase in GLUT3 expression (FC = 1.68 ± 0.25, p < 0.05). (F) GLUT6 expression was significantly altered by the treatment. The I3C-treated cells showed no significant change in GLUT6 expression (FC = 0.93 ± 0.14) compared to the NT group (p > 0.05). However, the TCDD treatment significantly increased GLUT6 expression (FC = 1.66 ± 0.31, p < 0.01). The LPS treatment resulted in an upregulation of GLUT6 expression (FC = 1.26 ± 0.19), though this change was not statistically significant (p > 0.05). Each bar represents the fold change (FC) in gene expression, with the error bars indicating the standard deviation. The statistical significance was determined using a one-way ANOVA, followed by Tukey’s post hoc test. * p < 0.05 ** p < 0.01, *** p < 0.001, **** p < 0.0001.
Immuno 05 00015 g005
Figure 6. Heatmap showing the mean ratios of TGF-β/TNF-α, IL-10/IL-12, and ARG1/NOS2 in THP-1 macrophage-like cells under different treatment conditions. The cells were treated with LPS (100 ng/mL), I3C (10 ng/μL), and TCDD (100 nM). The warmer colors (red) indicate higher ratios (anti-inflammatory), while the cooler colors (blue) represent lower ratios (pro-inflammatory). The data are presented as mean values from independent experiments.
Immuno 05 00015 g006
Figure 7. Proposed mechanism of I3C-induced M2 macrophage polarization via AHR signaling and metabolic regulation. Indole-3-carbinol (I3C) activates the aryl hydrocarbon receptor (AHR) in human macrophages, triggering nuclear translocation and dimerization with ARNT. The AHR/ARNT complex induces transcription of AHR target genes, including CYP1A1 and CYP1B1. This signaling cascade promotes an anti-inflammatory phenotype characterized by increased expression of CD163, ARG1, IL-10, and TGF-β, along with the downregulation of CD86, CD16, NOS2, IL-12, and TNF-α. Concurrently, I3C enhances the expression of glucose transporters (GLUT1, GLUT3, and GLUT6), indicating a shift in metabolic activity. The outcome is an M2-like macrophage phenotype with both immunomodulatory and metabolic adaptation.
Immuno 05 00015 g007
Table 1. Specific primer sequences for real-time RT-PCR.
Gene IDGene NameForward Primer SequenceReverse Primer SequenceTm (°C)Product Size (bp)
1543CYP1A1CTCCTCAACCTCCTGCTACCGTCACTGATACCACCACATACC59129
1545CYP1B1GCTCACCAGTGCGATTTCAGCTTGCCTCTTGCTTCTTATTG59187
383ARG1GGTGGCAGAAGTCAAGAAGAACGTGGTTGTCAGTGGAGTGTTG60159
3593IL-12BCAGGAGGTCAAGGCTATGGTACTTACGGTGTTTCTGTGTCAT59181
57491AHRRCGGGATGTTGCCCAAAAGTGAAGCGTGTGTCTTAGGACGG61182
4843NOS2GCAGAGAACTCAGCCTCATTCGGAAGAGACCTGTGCCTTGA60.0107
3586IL-10ACATCAGGGTGGCGACTCCGTTCACAGAGAAGCTCAGTAA59.0185
6513GLUT1CACCACCTCACTCCTGTTACTTTCTGTCTCACTCCCATCCAAA59115
6515GLUT3TCCCCTCCGCTGCTCACTATTTATCTCCATGACGCCGTCCTTTC61.0190
11182GLUT6TCACCAAGTCCTTCCTGCCAGTCACAGCAGCCTGTGAACACCAG61105
2597GAPDHGAAATCCCATCACCATCTTCTCTGAGTGGCAGTGATGTC60.0345
Disclaimer/Publisher’s Note: The statements, opinions and data contained in all publications are solely those of the individual author(s) and contributor(s) and not of MDPI and/or the editor(s). MDPI and/or the editor(s) disclaim responsibility for any injury to people or property resulting from any ideas, methods, instructions or products referred to in the content.