Article

Machine-Learning Classification of Schizophrenia Using Automated Retinal-Imaging Analysis: A Pilot Study


1
Department of Psychiatry, Castle Peak Hospital, Hong Kong, China
2
Department of Psychiatry, Kwai Chung Hospital, Hong Kong, China
3
Centre for Clinical Research and Biostatistics, the Chinese University of Hong Kong, Hong Kong, China
*
Author to whom correspondence should be addressed.
Psychiatry Int. 2026, 7(5), 215; https://doi.org/10.3390/psychiatryint7050215
Submission received: 22 July 2026 / Revised: 22 September 2026 / Accepted: 23 September 2026 / Published: 26 September 2026

Abstract

Background: Schizophrenia is a debilitating disorder that exacts a heavy burden on sufferers and carers alike. Despite improvements in neuroimaging techniques in the past decades, schizophrenia has lacked a clear definition at the neuroanatomical level. The presence of diagnostic markers may lead to breakthroughs with our current phenomenological approach to schizophrenia, assisting with diagnosis and monitoring of the disease. Prior study findings suggest structural retinal changes in schizophrenia, including retinal-layer thinning and microvascular changes. Aim: We aim to evaluate whether retinal imaging, in combination with machine-learning approaches, can facilitate diagnostic classification of schizophrenia. Furthermore, we characterise retinal structural features in individuals with schizophrenia compared with healthy controls, and examine whether these retinal measures are associated with disease status, clinical severity, functional outcomes, and other key clinical variables. Method: This study recruited 64 individuals with schizophrenia and 64 healthy controls. Participants in the schizophrenia group completed standardized clinical rating scales to assess symptom severity and functional status. Additional clinical variables, including demographic characteristics, duration of untreated psychosis, and antipsychotic medication dosage, were recorded. All participants underwent fundus photography, and retinal images were processed using the Automated Retinal-Imaging Analysis (ARIA) system developed at the Chinese University of Hong Kong (CUHK). Extracted retinal parameters were used to train machine-learning models to classify schizophrenia cases versus controls. Using a cross-sectional design, we compared retinal characteristics between groups while adjusting for relevant confounders, and evaluated associations between retinal measures and clinical variables within the schizophrenia cohort. Results: Our machine-learning model successfully distinguished individuals with schizophrenia from healthy controls, achieving high sensitivity (96.9%) and specificity (92.2%). Consistent with prior literature, we observed reductions in some measures of retinal thickness in the schizophrenia group, along with some novel alterations in venular microvascular structure. No associations between retinal measurements and symptom severity or illness-related variables were statistically significant. Conclusions: The strong discriminatory performance of our machine-learning (ML) model underscores the potential value of ML-based retinal analysis as an adjunct to existing diagnostic and risk-stratification approaches for schizophrenia. Our findings suggest retinal-layer alterations in schizophrenia and novel microvascular changes that have not been examined in earlier work. Together, these results highlight promising directions for future large-scale investigations into retinal biomarkers in schizophrenia.

1. Introduction

Despite advances in neuroscience in the past decades, our understanding of the pathophysiology of schizophrenia remains largely incomplete (Luvsannyam et al., 2022) [1]. Schizophrenia has lacked a clear definition at the neuroanatomical level (Jiang et al., 2024) [2], despite improvements in neuroimaging techniques.
Schizophrenia has traditionally been explored with a phenomenological approach, categorising relevant and diagnostic symptoms based on lived experiences and observations of patients. However, this approach is constrained by its inability to integrate recent advances in our anatomical, genetic and biological understanding of schizophrenia. Alternative approaches to investigating schizophrenia at the neuroanatomical level have been proposed. In particular, the retina is an alternative window into deepening our understanding of schizophrenia. It offers a good vantage point to observe structural changes in schizophrenia, as the central nervous system can be visualised through retinal imaging with relative ease.
Given the retina’s shared developmental and microvascular features with the brain, retinal imaging provides a biologically plausible, non-invasive window to reflect disease processes of schizophrenia. We aim to evaluate whether it is feasible that a retinal-image-based model can classify schizophrenia with reasonable accuracy. Furthermore, we wish to identify possible retinal structural changes in individuals with schizophrenia compared with healthy controls, and examine whether retinal measurements are associated with clinical severity, functional outcomes, and other key clinical variables.

2. Literature Review

Developmentally, since the retina shares common cellular properties with the brain and its neurons, it has been proposed that the retina acts as a proxy for the neural circuitry of our brain structure (Bales et al., 2025) [3]. In recent years, studies have found associations of retinal-vessel characteristics and retinal cell-layer thickness with both schizophrenia and cortical thickness in MRI scans (Bannai et al., 2020; Korann et al., 2021; Zhuo et al., 2021) [4,5,6], with negative correlations between retinal venular diameters and global cortical thickness (Korann et al., 2021) [5]. Both retinal thickness reductions and grey-matter volume reductions in visual cortexes of the occipital lobes and fusiform gyrus are associated with schizophrenia (Zhuo et al., 2021) [6]. Retinal functional changes in schizophrenia measured by electroretinography (ERG), in particular retinal ganglion-cell activity, have been consistently observed (Duraković, 2020) [7]. Impaired low-level visual processing in schizophrenia, such as worsened contrast sensitivity and colour perception, further suggests a close relationship between the retina and schizophrenia (Silverstein et al., 2020) [8].
Although differences exist between retinal characteristics and schizophrenia during group-level analysis, it is neither specific nor sensitive for the classification of disease status at an individual level, given retinal variability within the normal population and multiple known factors that have been shown to influence retinal structure, such as hypertension and diabetes (Karczmarek et al., 2024) [9]. Appaji et al. (2019b) [10] attempted to use a single factor on retinal-vessel trajectory as a classification tool, but attained poor accuracy. Using multiple retinal characteristics to create a classification model allows for better accuracy and sensitivity.
To date, most fundus-imaging studies have focused on retinal venular and arteriolar diameters, with a study by Appaji et al. (2019b) [10] including retinal artery and vein trajectory measurements, and a study by Wagner et al. (2023) [11] showing differences in fractal dimension, vessel tortuosity and density. Wagner et al. (2023) [11] is the first known study that employed an open-source automated analysis of retinal vascular morphology in schizophrenia, including both fundal and OCT parameters. Other aspects of the retinal vasculature, including bifurcation coefficients, angles and asymmetry index of retinal vessels, as well as the presence of haemorrhages, exudates and nicking, have not been investigated thus far. These parameters are influenced by blood flow, angiogenesis, neuroinflammation and endothelial dysfunction, which are seen to be impaired in schizophrenia (Stankovic et al., 2024) [12]. Bifurcation angles, coefficients and asymmetry index are measures of efficient retinal blood flow, where deviations may indicate abnormal vascular remodelling or pathological changes in systemic circulation (Huang et al., 2020) [13]. Presence of haemorrhages, exudates and nicking is associated with poor cardiovascular health and microvascular disease (Klein et al., 2000) [14]. Beyond retinal-vessel diameter, these retinal vascular characteristics can also be influenced by candidate genes implicated in both central nervous system vasculature and schizophrenia (Kennedy et al., 2023; Schmidt-Kastner et al., 2012) [15,16]. These retinal characteristics may have possible implications for the pathophysiology of schizophrenia which have yet to be explored.

3. Methods

3.1. Study Design and Participants

This was a cross-sectional case-control study conducted at Castle Peak Hospital in Hong Kong. Patients with schizophrenia (SZ) were recruited by psychiatrist referral from the Tuen Mun Mental Health Centre, a specialist psychiatric outpatient clinic serving the New Territories West Cluster of Hong Kong. Controls without any psychiatric diagnosis were recruited from hospital staff and trainees.
Inclusion criteria for the SZ group were (1) a diagnosis of schizophrenia at any time point confirmed with the Chinese version of the Structured Clinical Interview for DSM-IV (SCID-I), (2) aged 18–65 years, (3) ability to comply with retinal-imaging procedures, (4) fluency in Cantonese, Mandarin or English, and (5) capacity to provide informed consent. Exclusion criteria were (1) other comorbid psychiatric disorders, including schizoaffective disorder, neurotic disorders and substance-use disorders; (2) poor retinal-image quality or ocular disease precluding analysis; (3) photosensitive seizures or distress from flashlights; (4) psychoactive substance use within the past year; or (5) severe sensory impairment. Controls had the same inclusion and exclusion criteria, with the additional requirement of no psychiatric diagnosis as assessed by SCID-I. Sample size was estimated for logistic regression in a case–control design (Hsieh, 1989) [17] with 90% power and a type I error of 5%, assuming a correlation value of 0.5 among covariates. Sample size estimation were from prior meta-analyses with available figures for standardized mean differences of retinal changes (Gonzalez-Diaz et al., 2022; Lizano et al., 2020) [18,19]. A total of 128 participants, evenly split between the subject and control groups, were recruited via convenience sampling. The recruitment of controls and the schizophrenia group were done by the same researchers and equipment, within the same time frame. An informed-consent process was carried out with all study participants. The protocol of this study was approved by the Central Institutional Review Board (Central IRB) of the Hospital Authority (Central IRB Ref. No.: CIRB-2024-297-4) in advance, and was conducted in compliance with the principles of the Declaration of Helsinki.

3.2. Clinical Assessment

SCID-I was administered by a trained psychiatrist to all participants to confirm or exclude the diagnosis of schizophrenia. For the SZ group, the Positive and Negative Syndrome Scale (PANSS), Brief Psychiatric Rating Scale (BPRS) and Global Assessment of Functioning (GAF) were administered by the same psychiatrist. Chlorpromazine-equivalent daily antipsychotic dose was calculated from clinical records (Andreasen et al., 2010) [20]. Demographic information, diabetes and hypertension status, family history of psychosis, duration of untreated psychosis and illness duration were recorded.

3.3. Retinal-Image Acquisition and Analysis

Retinal fundus images of both eyes were obtained using a Canon non-mydriatic retinal camera, CR-2, with a 45-degree angle of view. No pupil dilation was required in acquiring the retinal images. Fundus images of participants’ left and right eyes were taken sequentially. All images were then processed using the Automated Retinal-Imaging Analysis (ARIA) software developed by the Chinese University of Hong Kong (CUHK), which assessed for imaging quality of the retinal images and disqualified those with poor imaging quality based on assessments of the grey-level retinal image and the vessel-extracted image, before generating retinal parameters for the remaining images (Shi et al., 2022) [21]. Images from 9 individuals (18 eyes) were judged to be of poor quality as assessed by the ARIA software, all of which are from the schizophrenia group, and these individuals were excluded from this study and subsequent data analysis, and replaced during recruitment, such that 128 participants in total were analysed. The ARIA software has been validated for such measurements in prior studies (Zee et al., 2014) [22]. It differs from other retinal-imaging software such as Vascular Assessment and Measurement Platform for Images of the Retina (VAMPIRE) and Integrative Vessel Analysis (IVAN) used in other retinal studies (Korann et al., 2021; Meier et al., 2015) [5,23], in that this software is fully automated and does not require manual input to review the quality of the retinal images.
Both fundus-imaging parameters and estimated OCT parameters were generated, the latter derived from the fundal images via mathematical morphological operations. Besides retinal-vessel diameter, arteriole-to-venule ratio (AVR), and vessel tortuosity measures, ARIA was also able to generate retinal measurements not included in other automated software, such as bifurcation coefficients, and angles and asymmetry index of retinal vessels, as well as the probability index of haemorrhages, exudates and nicking. A total of 22 measurements were generated per eye.

3.4. Statistical Analysis

All analyses were performed using R statistical software (version 4.5.0). The significance threshold was set at p < 0.05. Group differences in demographics were examined with independent t-tests for continuous variables, chi-square tests for sex, and Fisher’s exact tests for diabetes, hypertension and family history of psychosis.
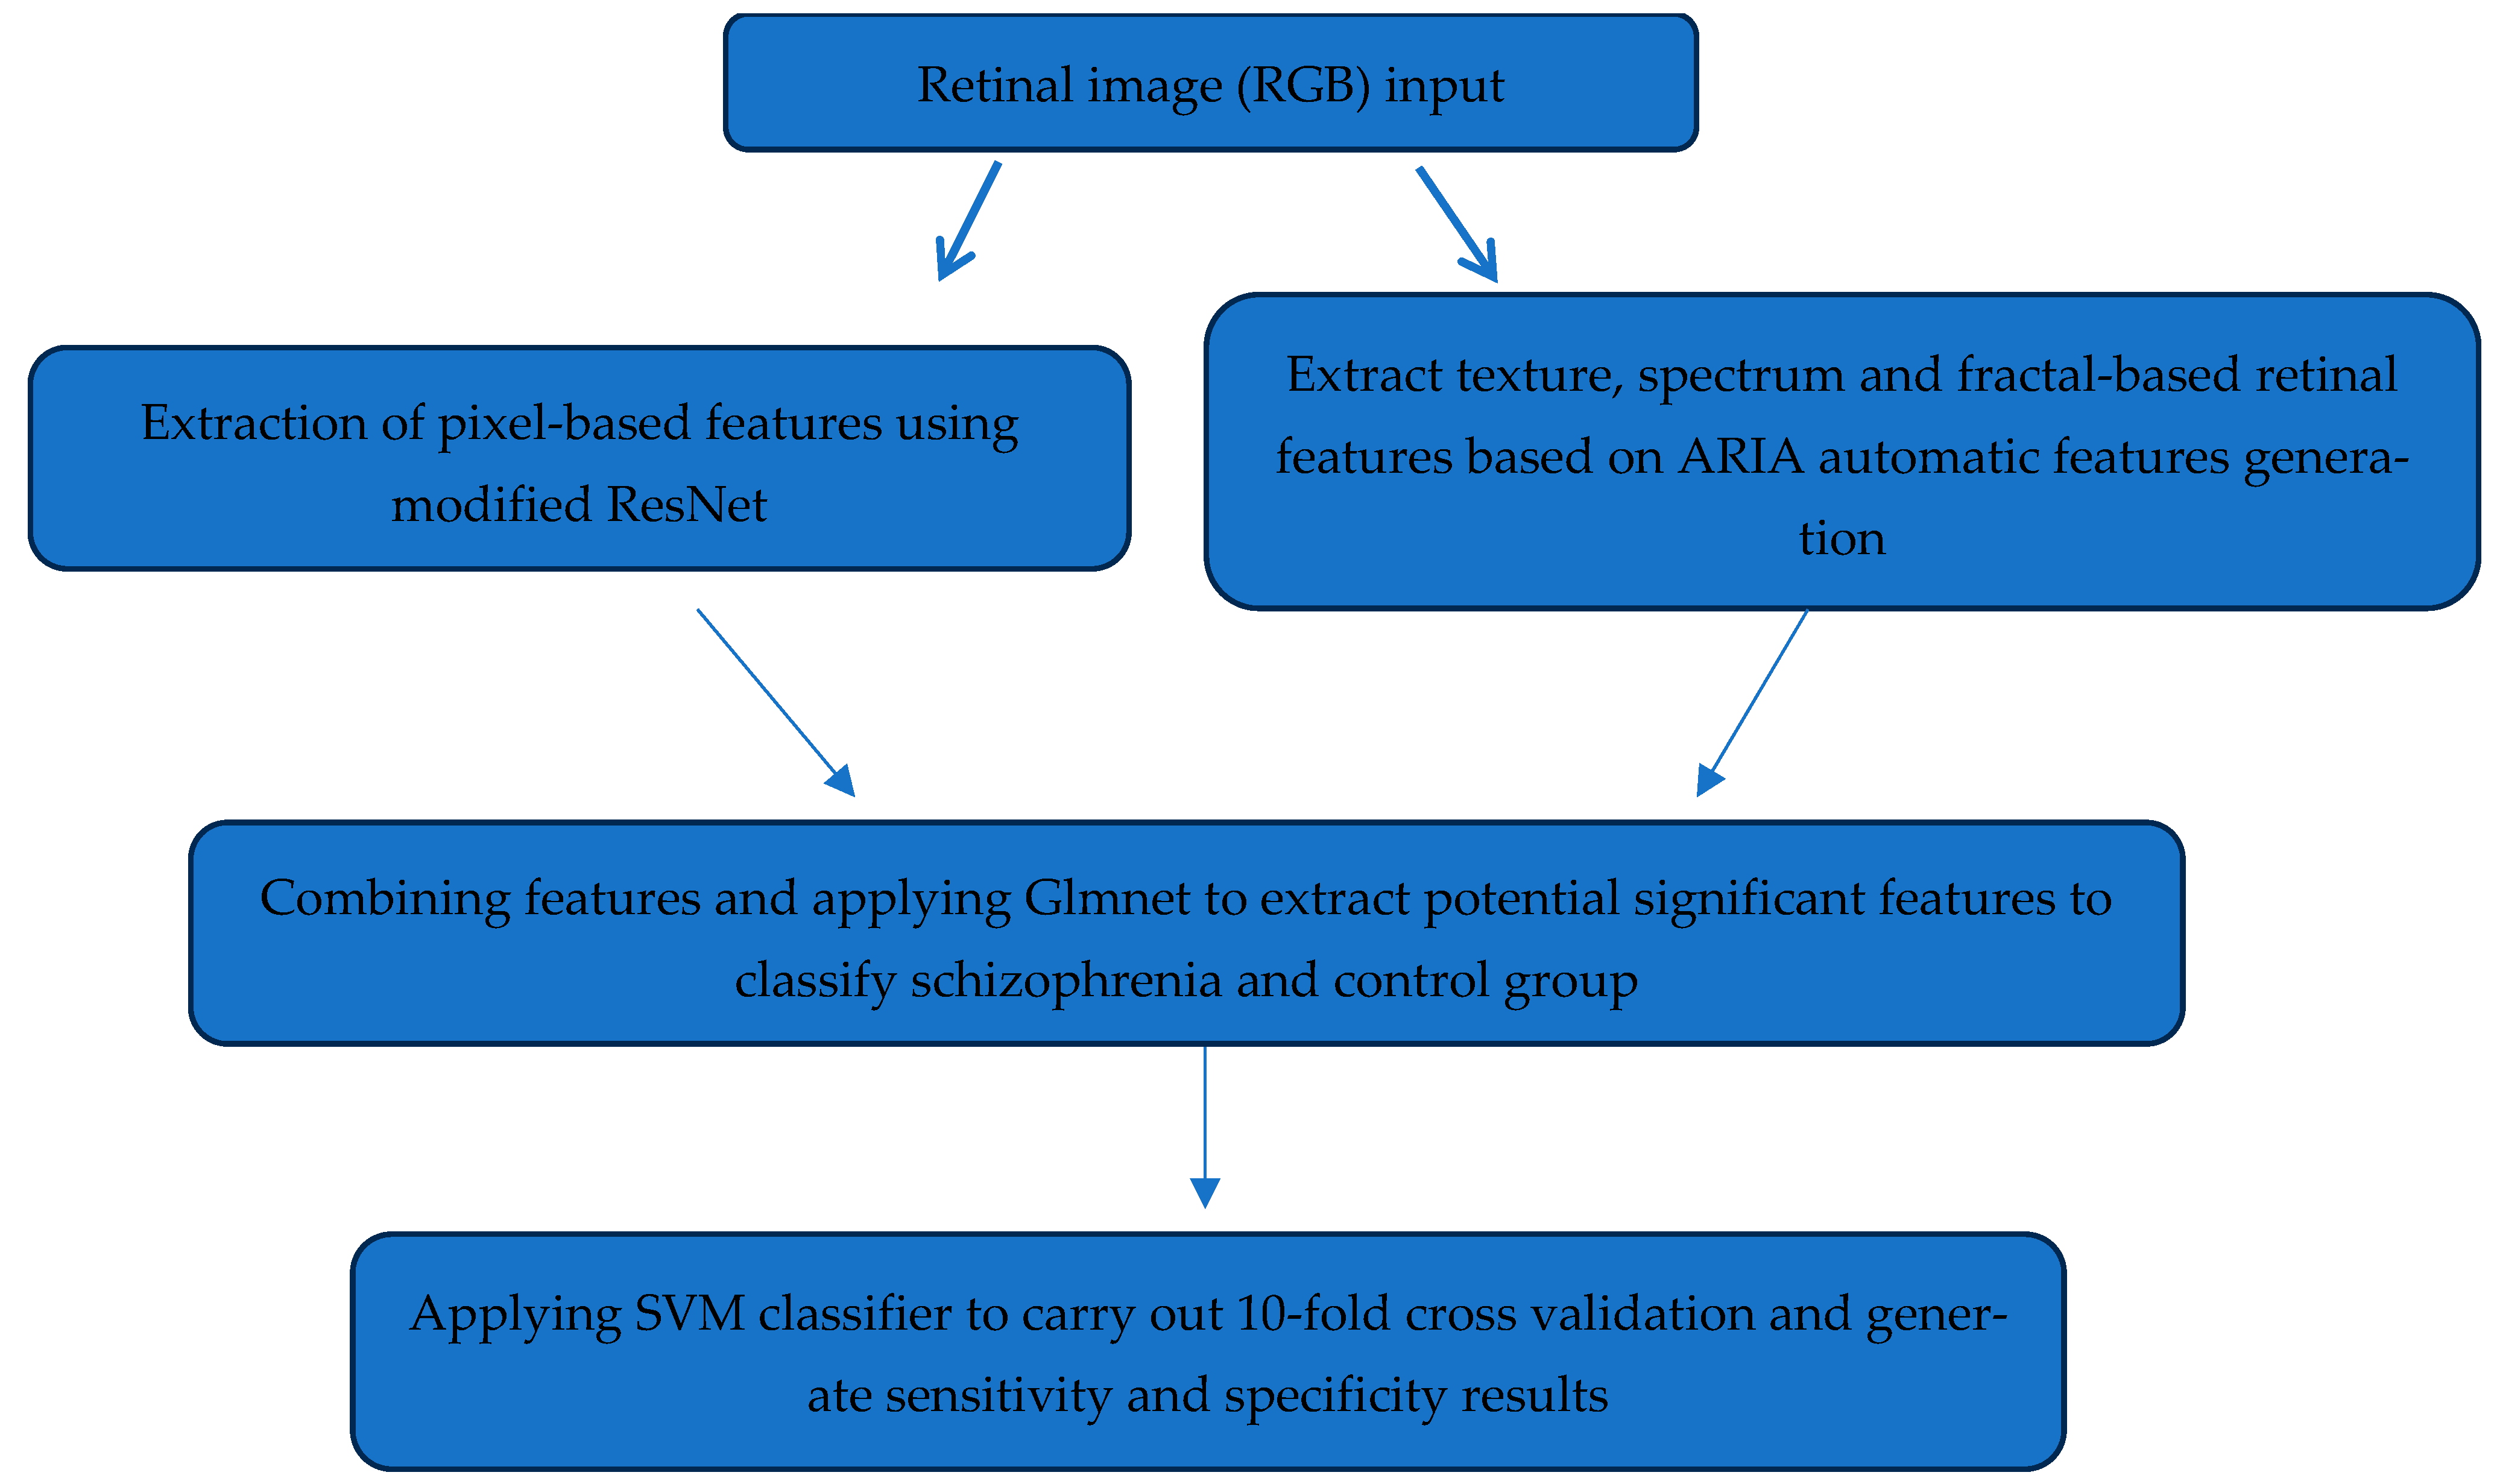
Using penalised maximum likelihood in R and MATLAB (version 2026a), features for classifying schizophrenia were extracted from the available ARIA retinal measurements, together with pixel-based features from a modified open-source ResNet. A generalised linear model via penalized maximum likelihood (Glmnet) was used to extract potential significant features for inclusion in the machine-learning model, while reducing the number of variables. A support vector machine (SVM) classifier is then used to carry out a 10-fold cross validation. Data partitioning was performed at the participant level, with both eyes of each subject remaining in the same partition. Feature selection, model fitting and threshold decision was performed using training data only. Figure 1 shows the flowchart of the development of the machine-learning classification model. The process is repeated with 70% of the dataset randomly selected, with the remaining 30% as a validation set, as internal holdout validation. The holdout set is untouched during model and threshold decisions.
For retinal-vessel diameters, the effects for arteriolar and venular calibre were adjusted for the effect of the other vessel, as the vessel diameters are strongly correlated with each other, which would affect analyses. This study adopted the approach taken by previous studies (Appaji et al., 2019; Appaji et al., 2020; Meier et al., 2013; Meier et al., 2015) [23,24,25,26] who investigated the differences in retinal vascular calibre in schizophrenia. The left- and right-eye measurements were first averaged out. Afterwards, to isolate the unique effects of each vessel, arteriolar and venular calibre were each compared using linear regression, adjusting for the other vessel, age, and sex. For all other retinal parameter variables, independent t-tests were used to compare differences between the subject and control groups. The retinal characteristics of the schizophrenia group were compared against continuous clinical variables, including PANSS and its subscales, BPRS, GAF, and daily drug dosage calculated by chlorpromazine equivalence. Spearman’s correlation test was used for comparison. False discovery rate (FDR) correction was used to reduce the expected proportion of false positives arising from repeated testing of multiple hypotheses.

4. Results

4.1. Participants

There were no statistically significant differences between the subject (SZ) and control (C) groups for age, sex, presence of diabetes and presence of hypertension. There was a statistically significant difference in the presence of family history of psychosis (p < 0.001). The demographics and clinical characteristics of both groups are listed in Table 1.

4.2. Diagnostic Classification of Schizophrenia with a Machine-Learning Model

The combined classifier, built from ARIA-derived parameters and ResNet image features and validated by 10-fold cross-validation, correctly identified 62 of 64 schizophrenia cases (two misclassified as controls) and 59 of 64 controls (five misclassified as schizophrenia). Sensitivity was 96.9% (CI 0.892–0.996), specificity 92.2% (CI 0.827–0.974), positive predictive value 92.5%, negative predictive value 96.7%, overall accuracy 94.5% and the area under the ROC curve 0.987.
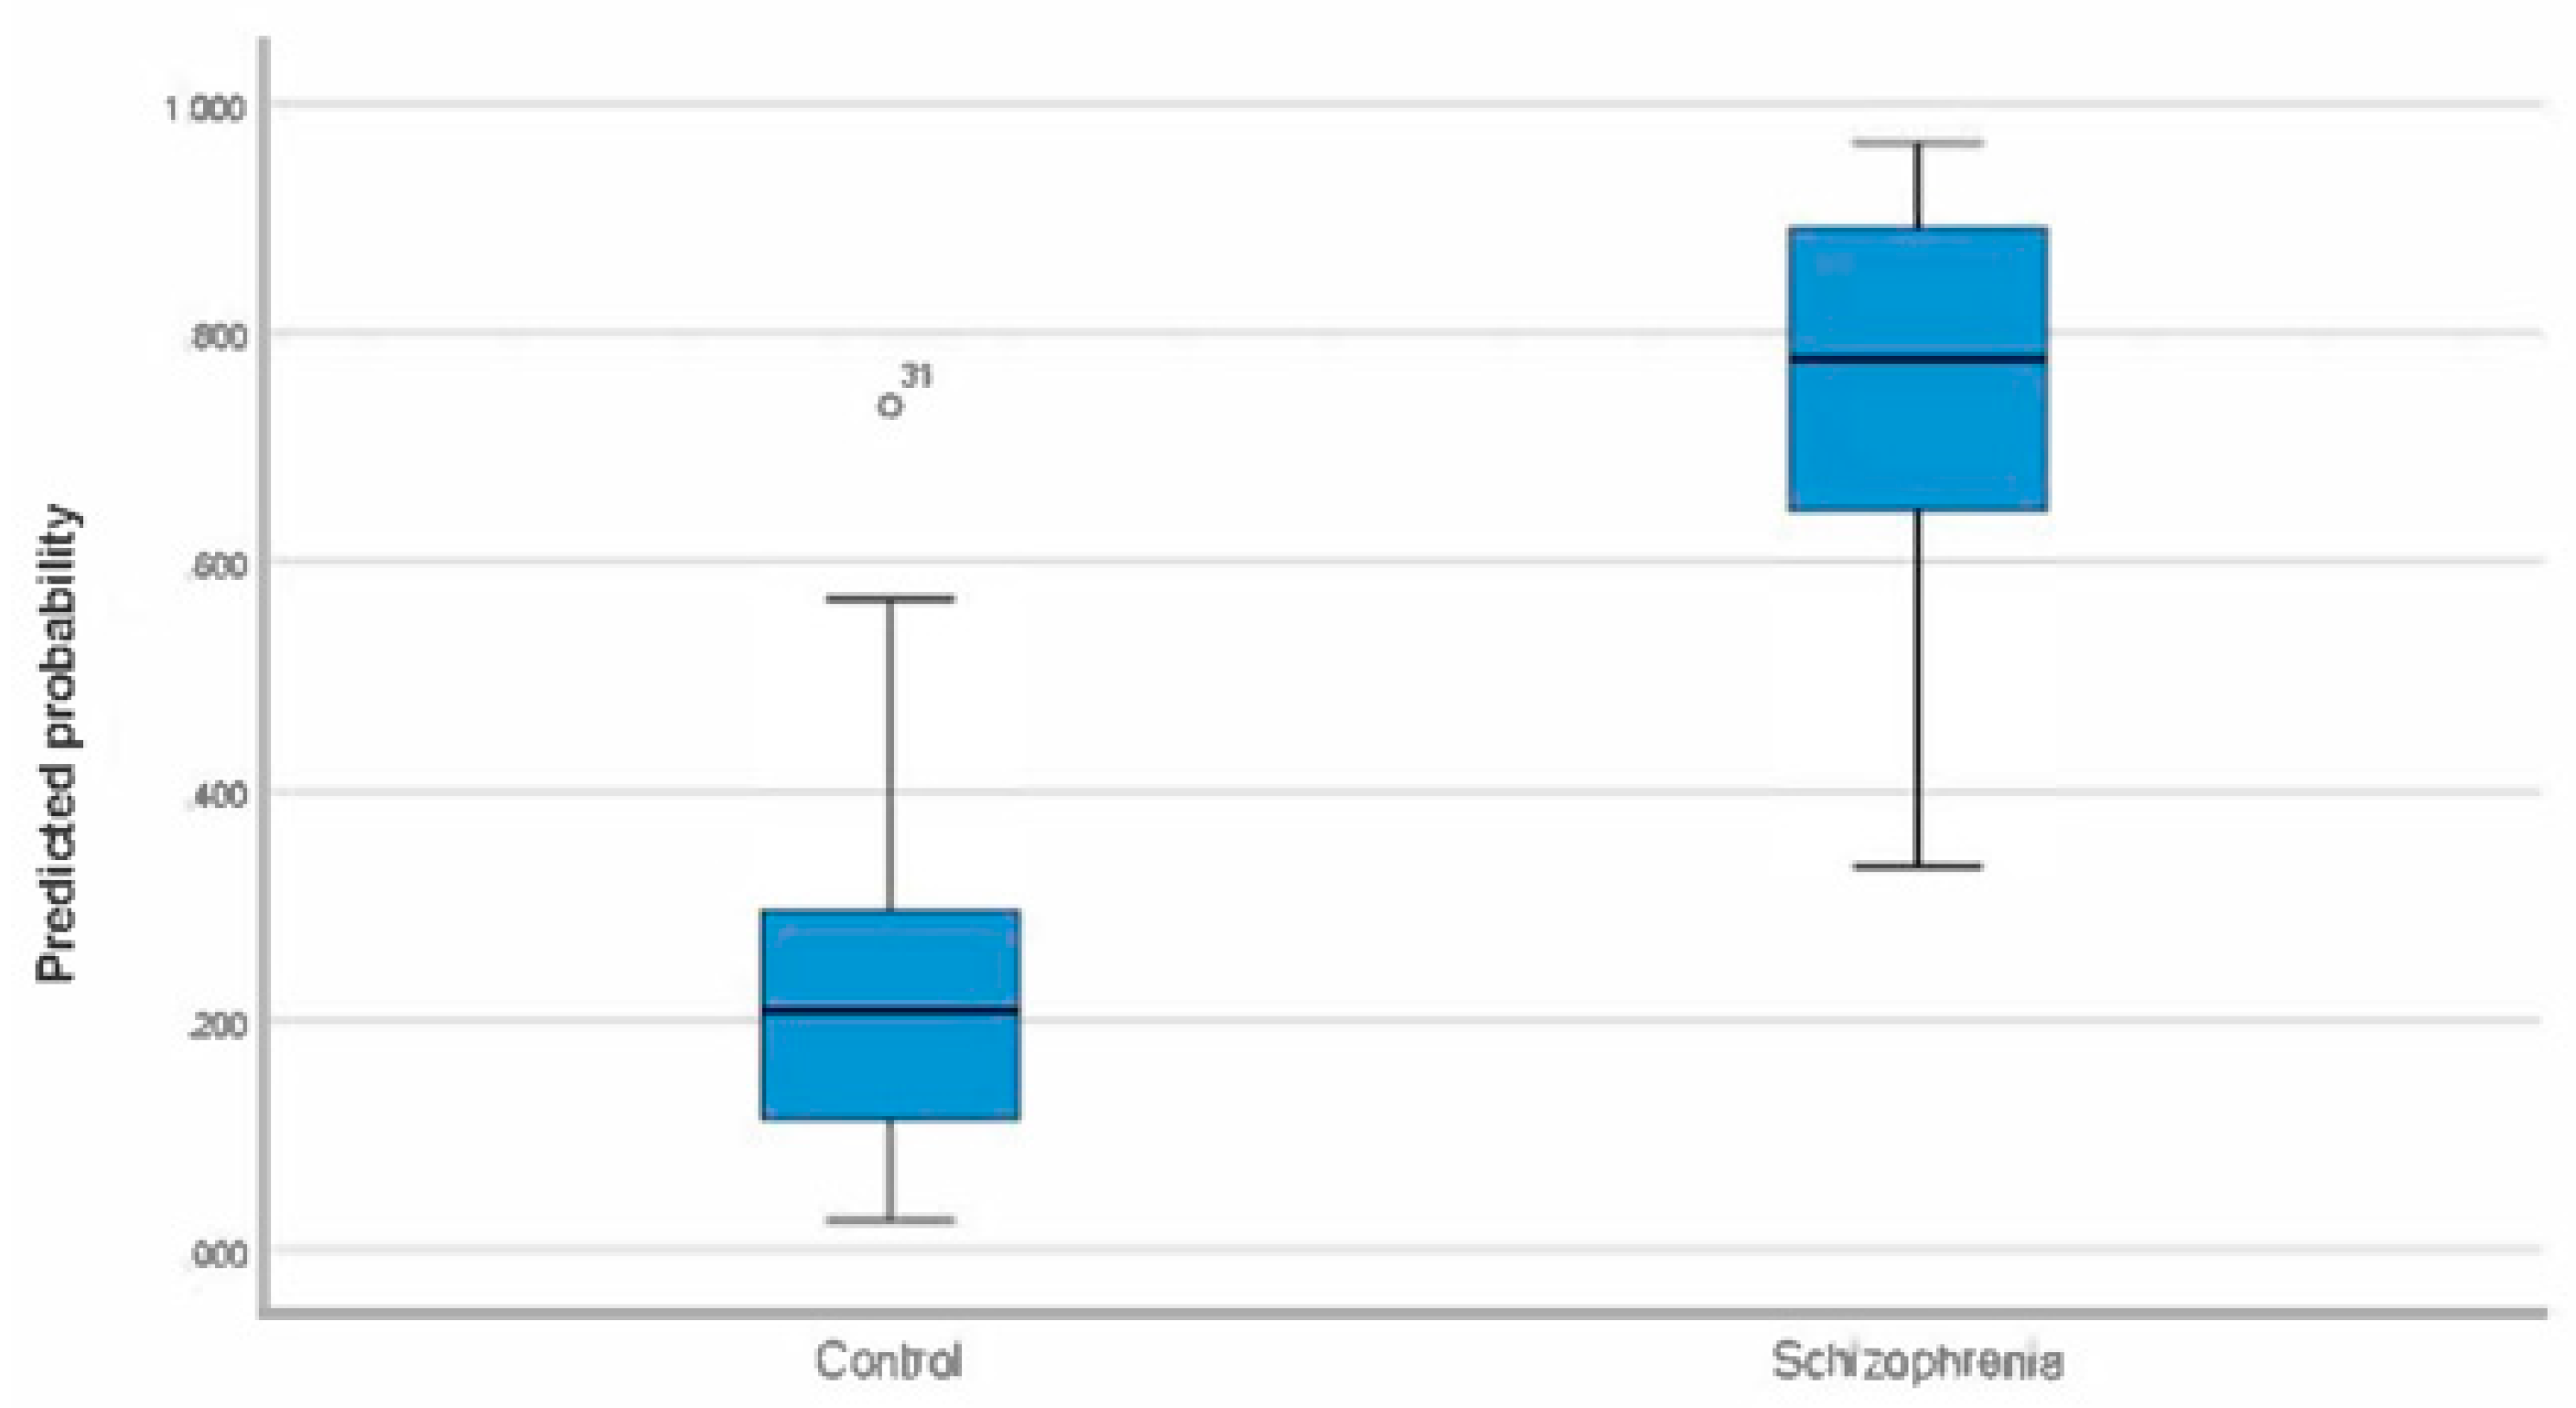
The probability score distribution in Figure 2 summarises the classification performance of the machine-learning model. The distributions of predicted probabilities for the two groups showed clear separation with minimal overlap, consistent with strong classification signal.
Further analysis is carried out by random sampling of 70% of the data for training and 30% of the data for validation. For the validation set, the specificity decreases slightly, to 89.5% (CI 0.669–0.987), while the sensitivity decreases to 0.842 (0.604–0.966). AUC is 0.927 (0.847–1.000). Table 2 shows the values in table form.

4.3. Retinal Characteristics in Schizophrenia

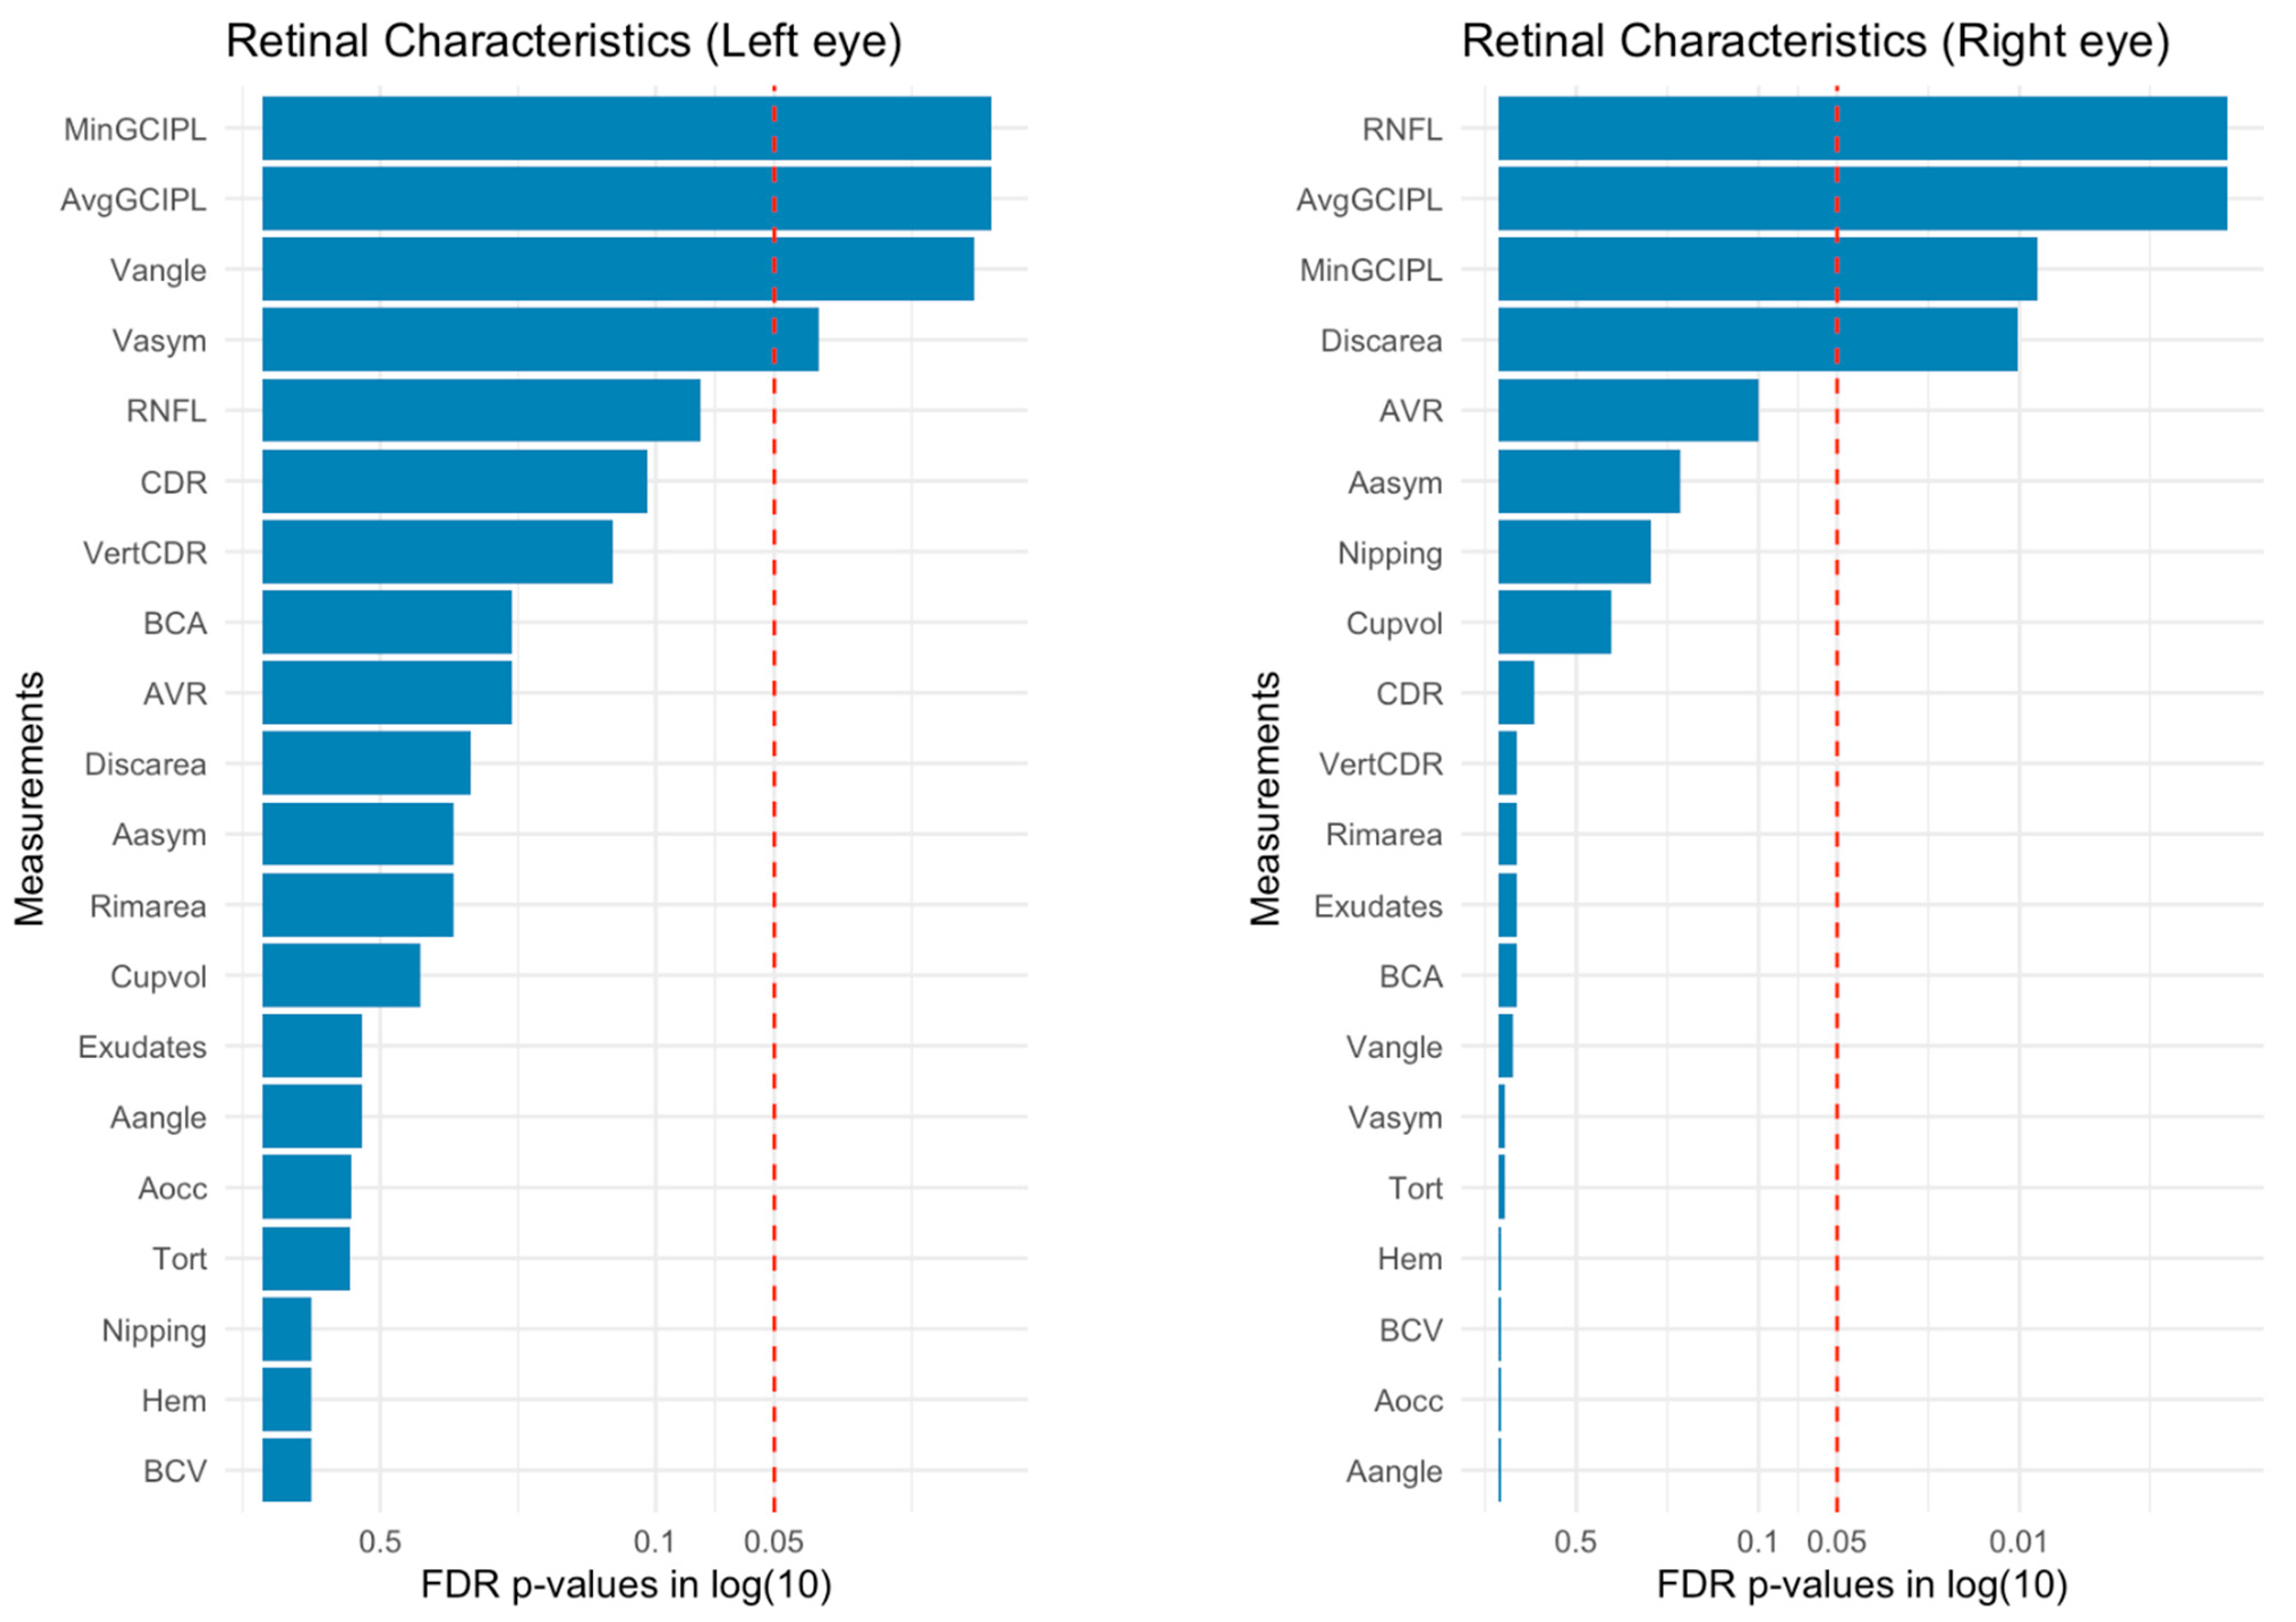
The average ganglion-cell–inner-plexiform layer (GCIPL) was thinner in schizophrenia patients in both the left eye (p = 0.009) and the right eye (p = 0.003). The minimum GCIPL was also thinner in both the left eye (p = 0.011) and the right eye (p = 0.011). The mean peripapillary retinal nerve-fibre layer (pRNFL) thickness was thinner in the schizophrenia group in the right eye (p = 0.003), but did not reach statistical significance in the left eye (p = 0.085). Reported p-values are FDR-corrected.
For retinal vessels, the mean venular asymmetry index was higher in the schizophrenia group in the left eye (p = 0.038), although the difference was not significant in the right eye (p = 0.836). The mean venular bifurcation angle in the left eye was wider in schizophrenia (p = 0.013), but did not differ in the right eye (p = 0.787). A higher asymmetry index and more obtuse bifurcation angles indicate possible abnormalities in the retinal vasculature. The optic disc area in the right eye was larger in the schizophrenia group than in controls (p = 0.013), but did not differ significantly in the left eye (p = 0.327). The tests were repeated while excluding participants with diabetes and hypertension, respectively. All differences seen remain significant, even when excluding participants with diabetes and hypertension. Figure 3 summarizes the measured retinal parameter differences between the schizophrenia and control groups for the left and right eyes.
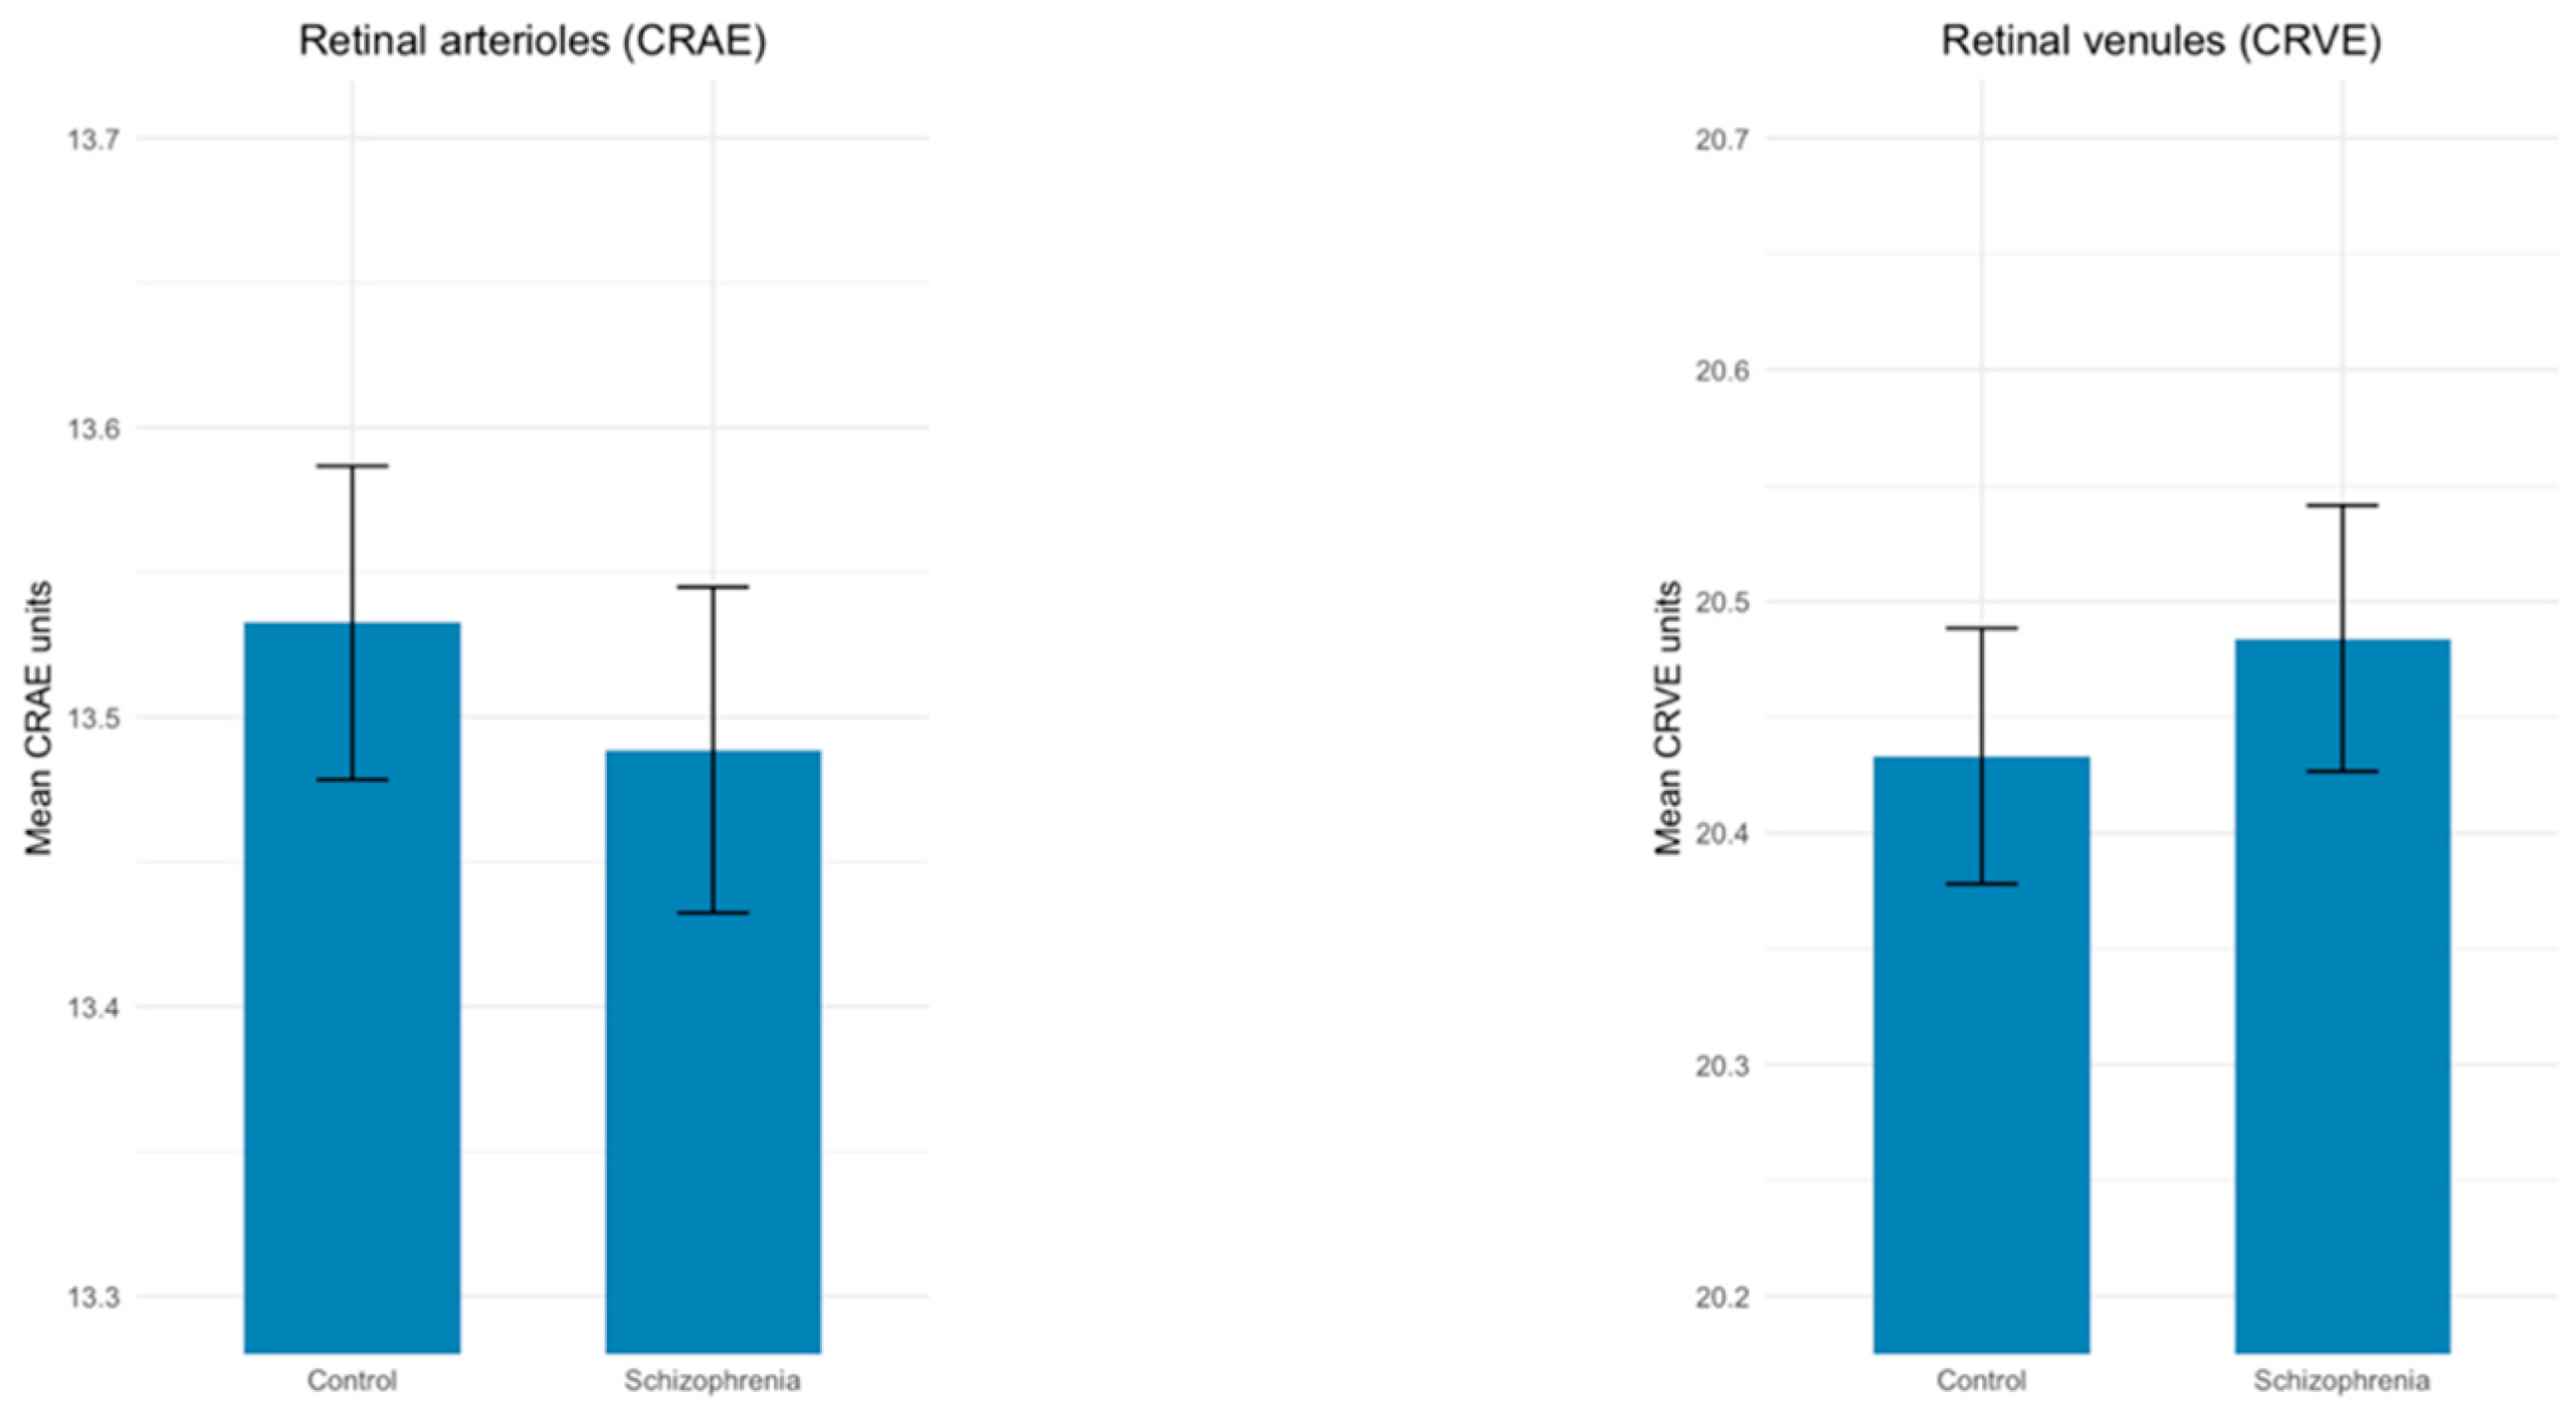
The central retinal arteriolar and venular equivalents (CRAE and CRVE) were not significantly associated with schizophrenia status (p = 0.257, p = 0.199), as seen in Figure 4. The error bars show the 95% confidence interval, and show that the difference is non-significant in our study. The full set of results are listed in Appendix A.

4.4. Correlations with Clinical Variables and Subgroup Analyses

After FDR correction, no retinal parameter showed a statistically significant correlation with PANSS total or subscales, BPRS, GAF, or chlorpromazine-equivalent dose. There were no differences seen in retinal characteristics between those with a positive family history of psychosis (n = 12) and those without (n = 116). Duration of untreated psychosis was available for 57 of the 64 patients; those with a short duration (0–1 years, n = 46) showed no difference in retinal characteristics compared with those with a longer duration (>1 year, n = 11). No correlation was found when comparing retinal characteristics to illness duration. The full results table is available in Supplementary Materials.

5. Discussion

This is one of the few studies to analyse both fundal imaging and estimated OCT parameters in schizophrenia, several of which have not been examined before in a fully automated pipeline, to the authors’ knowledge. A diagnostic approach supplemented by reproducible, quantifiable biological characteristics could improve on the current reliance on symptomatology alone, and may point to new intervention targets and treatment possibilities.
Group-level differences in retinal characteristics are, on their own, neither specific nor sensitive enough to classify disease status in an individual, given the variability of retinal structure in the general population and the influence of factors such as hypertension and diabetes (Karczmarek et al., 2024) [9]. Combining multiple retinal characteristics into a single classification model through machine learning may be feasible in generating models with reasonable accuracy, such that it can be a useful supplement to existing diagnostic methods.
Deep neural network refers to an artificial neural network consisting of multiple layers, which aims to process and transform data through weighted connections. It is a subset of machine-learning techniques that leverage complex data and associations to improve prediction and analysis. This method is uniquely suited to the analysis of medical conditions in which multiple factors can interact non-linearly and may have a mediating effect on one another. Schizophrenia is one of those conditions that is influenced by multiple genes of small effect (Heinzer & Curtis, 2024) [27], with various structural differences seen in brain and retinal imaging (Bannai et al., 2020; Korann et al., 2021; Zhuo et al., 2021) [4,5,6]. Appaji et al. (2022) [28] was the first published study to use retinal images on a machine-learning model for the classification of schizophrenia, with an accuracy comparable to MRI imaging. Karczmarek et al. (2024) [9] explored various machine-learning techniques to classify schizophrenia in OCT images, favouring models that use deep neural networks and aggregation techniques.
For our study’s machine-learning model, we combined extracted retinal parameters with a generalized linear model as a supervised learning technique, with penalized maximum likelihood to shrink coefficients and less-relevant variables, for a stable estimate (Matloff, 2017) [29]. We then used transfer learning to incorporate pixel-based features. This machine-learning model demonstrated the ability to meaningfully differentiate the retinal images of schizophrenia and control groups, with good sensitivity and specificity. The use of multiple retinal features extracted from the fundus imaging may explain the stronger performance seen in this study. Nonetheless, because the sample size is modest and no external dataset was used for validation, our study results should be interpreted cautiously as proof of concept of the machine-learning approach in building diagnostic classifiers for schizophrenia. It is likely to be optimistic, relative to real-world performance. In our own study, using 70% of the dataset for model training and 30% of the dataset for validation leads to a decrease in sensitivity and specificity. The decreased sample size of the model may partly explain the decrease in accuracy, but also, the accuracy of the full-sample model may be optimistic, since the training set was also used for validation. Indeed, a similar approach taken by Appaji et al., 2022 [28] shows a significant decrease in accuracy when an external dataset is used for validation.
In this study, patients with schizophrenia showed bilateral thinning of the GCIPL, right pRNFL thinning, and novel venular microvascular differences in the left eye, namely a higher venular asymmetry index and a wider venular bifurcation angle. Our finding of reduced GCIPL and pRNFL thickness is consistent with a growing literature suggesting macular and peripapillary neuronal loss in schizophrenia (Bannai et al., 2020) [4]. In contrast to some earlier reports, the central retinal arteriolar and venular calibres (CRAE and CRVE) did not differ significantly between groups in our sample.
Findings of retinal microvascular changes reflect increased blood-flow resistance and suboptimal haemodynamics in the retinal vessels. Such retinal vasculature changes may reflect microvascular changes in the brain, possibly due to shared candidate genetic influences, such as the VEGF gene and BDNF, implicated in both cerebral and retinal vasculature, as well as in schizophrenia (Hanson & Gottesman, 2005; Katsel et al., 2017) [30,31]. Changes in cerebral blood flow are seen in brain imaging studies for schizophrenia, notably cortical and fronto-limbic hypoperfusion and hyperperfusion in subcortical structures (Percie du Sert et al., 2023) [32]. Neurotransmitter changes seen in schizophrenia may explain vasculature differences in the retina and brain, since glutamate receptors, dopamine, acetylcholine and serotonin transmission have vasoactive properties (Eisenberg et al., 2017) [33]. The vasoactive effects of various neurotransmitters are seen in both the brain and retina. Dopamine, in particular, can reduce permeability of endothelial cells through inhibition of VEGF, and can lead to vasoconstriction through adrenergic receptors (Basu et al., 2001; Sonne et al., 2023) [34,35]. Prolonged changes in vasoactive substances can affect angiogenesis (Lee et al., 2009; Shalabi et al., 2024) [36,37]. In the retina, experiments have found that retinal ganglion-cell-derived dopamine production inhibited retinal-vessel growth, occurring downstream of VEGF receptor activation (Liang et al., 2023) [38]. In the brain, while direct studies are scarce, increased cerebral blood-flow and -volume correspond with dopaminergic, serotonergic, glutamatergic and GABAergic changes (Choi et al., 2006; Dukart et al., 2018) [39,40].
This study’s findings identified the possibility of retinal-layer changes in schizophrenia. In the study, there is reduced ganglion-cell–inner-plexiform layer thickness (GCIPL) in both the averaged-out and minimum measurements for both eyes, as well as reduced peripapillary retinal nerve-fibre layer (pRNFL) thickness for the right eye, consistent with findings from prior studies. This shows a loss of neurons in the macula, which is the area with the highest density of neurons in the retina, as well as the peripapillary region, which borders the optic nerve. The retina is an outgrowth of the neural tube that shares the same neuronal and glial cell types and synaptic structures in the brain (Bales et al., 2025) [3]. Retinal changes have reflected brain disorders. Ganglion-cell layer and nerve-fibre thickness are implicated in other neurological degenerative disorders such as Alzheimer’s disease (Koronyo et al., 2023) [41], multiple sclerosis (Green et al., 2010) [42] and Parkinson’s disease (Altintaş et al., 2008) [43], and can reflect both structural brain changes and neurodevelopmental processes in psychiatric illnesses. The retinal cell-layer thinning, indicative of neuronal loss, is thought to reflect structural changes in the brain in schizophrenia, particularly in the precuneus, diencephalon and primary visual cortex (Zhao et al., 2024) [44].
It is possible that neuroinflammation played a major role in the retinal neuronal loss observed in our study. Inflammatory processes are thought to cause neurotransmitter dysregulation and alter blood–brain barrier permeability, through disrupting the normal functioning of astrocytes and amacrine cells in the retina. Prior studies suggested that altered dopamine-mediated connections in amacrine cells led to loss of retinal ganglion cells (Samani et al., 2018) [45], with animal studies showing improvement in retinal function with antipsychotics (Jensen, 2016) [46] and recovery from ischemic retinal damage with dopamine antagonists (Chiou & Li, 1993) [47]. Retinal functional changes on electroretinography (ERG) are consistently observed in schizophrenia, with reduced a- and b-wave amplitudes (Duraković, 2020; Komatsu et al., 2024) [7,48]. These indicate diffuse outer- and inner-retinal dysfunction, with impaired photoreceptor function. Reductions in both a-wave and b-wave amplitudes are also seen in retinal ischemia (Block & Schwarz, 1998) [49]. Retinal cells are innervated by similar neurotransmitters implicated in schizophrenia, such as dopamine, glutamate and acetylcholine (Kolb, 1995) [50]. The inflammatory processes involved in retinal neuronal loss are possibly shared in schizophrenia. Elevated acute-phase protein levels in a genetic susceptibility study suggested a role for neuroinflammation in schizophrenia (Rabe et al., 2025) [51]. Changes in genes regulating cytokines, the major histocompatibility complex (MHC) locus, and complement cascade expression are also observed in schizophrenia (Rodrigues-Amorim et al., 2018) [52]. Inflammatory processes may, additionally, lead to microvascular structural congestion and vascular dysfunction in the macula (Rabe et al., 2025) [51], which may account for the retinal vascular changes. Ischemic events and axonal injury can lead to retinal cell loss and decreased retinal cell-layer thickness (Kim et al., 2018) [53].
Reduced retinal perfusion and microvascular changes can lead to loss of retinal cells, as reflected in the thinning of the GCIPL and pRNFL seen in our study. Evidence for hypoperfusion in many cortical regions is seen in schizophrenia populations, and there are common genetic associations between schizophrenia and neurovascular dysfunction (Katsel et al., 2017) [31]. There are suggested phenotypic and genetic correlations between GCIPL thickness and pRNFL measurements with brain structure (Zhao et al., 2024) [44]. Known candidate genes of schizophrenia, such as neuregulin-1, are expressed in the retina and are thought to have a major role in synaptic signalling (Samani et al., 2018) [45]. Previous genetic analysis has found that expression profiles of amacrine cells and GCIPL thickness are associated with individuals presenting with higher polygenic risk of schizophrenia (Boudriot et al., 2025) [54]. This study provides further evidence that retinal-layer changes in schizophrenia are possibly mediated by genetics, neuroinflammatory processes and vasculature abnormalities shared in both retinal cells and brain neurons.
However, this study’s findings on retinal changes should be interpreted cautiously, since retinal vasculature changes were not consistently observed in both measured eyes. This may be due to a small effect size on these relationships. Our sample size estimate relied on other retinal parameters from past studies; therefore, the actual sample size required to detect a statistically significant difference in novel retinal parameters may be larger than previously estimated. Our study also failed to confirm prior findings of narrower arteriolar and wider venular diameters in retinal vessels. Possible explanations may include the fact that some studies used population cohort results, which may differ from our recruited controls. Differences in retinal-image processing software may also account for the different results obtained. Finally, the possibility that the null hypothesis is true for those findings must also be considered, especially for narrower CRAE, where findings have been heterogeneous (Kennedy et al., 2023) [15].
A notable limitation is the possibility of non-specificity of some retinal findings, in particular, on retinal-layer thinning in the RNFL and GCIPL. For this study, there was no comparison group of other mental health disorders and other conditions which may have similar retinal changes, especially when retinal changes have also been reported in bipolar disorder and neurodegenerative disorders. It is possible that the similarities may be a transdiagnostic marker for common pathological pathways. Prior research has also suggested a differential pattern of retinal thinning (Lizano et al., 2020) [19], although studies on this have been limited.
In addition, other limitations in our study should be noted. First, the cross-sectional design cannot detect causality. Second, selection bias through convenience sampling in an outpatient setting limits clinical severity, and may have reduced the power to detect correlations. The relatively homogenous ethnicity of the study population also limits applicability of this study. Third, other confounders that may influence retinal parameters such as smoking, past antipsychotic exposure, and refractive errors may have influenced the study results. Fourth, there is possible measurement bias on the ARIA software used in retinal measurements, although this is also present in retinal measurement software used in other retinal studies. The software also identified nine subjects with poor-quality retinal image, all of which are from the schizophrenia group, which may be due to the schizophrenia group’s increased difficulty in following instructions while collecting retinal images leading to motion artifacts or a decrease in image quality, although whether other reasons exist for this discrepancy should be further explored. Finally, the machine-learning model had a modest sample size, with a relatively low events-per-predictor count. Our study’s findings on sensitivity and specificity may be overly optimistic, and a larger dataset with external validation would improve the robustness of the classification model.
Our study could have potential clinical implications, given its use of an automated fundus-imaging pipeline. Fundal imaging is rapid, widely available, non-invasive and cost-effective. The use of fully automated software for retinal-image analysis allows for quick, convenient and reproducible measurements. This study has shown that certain retinal parameters are different in schizophrenia from healthy controls, and machine-learning models are a feasible way to create good classifiers from these retinal changes. With more diverse datasets and larger sample sizes, the sensitivity and specificity may be further improved, leading to better clinical utility. The development of machine-learning models for diagnostic classification and risk stratification is still in its infancy. Still, if validated with external datasets, this approach may augment existing psychiatric assessments and serve as a screening tool for at-risk individuals.
To conclude, this study’s machine-learning classifier, which used automated extraction of retinal parameters achieved promising results in distinguishing patients with schizophrenia from healthy controls. As a pilot study, it demonstrates that this approach may be feasible for building future diagnostic classifiers for schizophrenia. This study also lends further evidence that there is GCIPL and pRNFL thinning in schizophrenia, and identified possible novel venular microvascular differences in bifurcation angle and asymmetry index, consistent with the hypothesis of shared neuroinflammatory and neurovascular mechanisms between the retina and brain. These findings highlight the potential of retinal imaging to become an accessible, quantitative assessment for schizophrenia.

Supplementary Materials

The following supporting information can be downloaded at: https://www.mdpi.com/article/10.3390/psychiatryint7050215/s1, Table S1: Table of retinal characteristics of Schizophrenia and control groups, excluding diabetes mellitus; Table S2: Table of retinal characteristics of Schizophrenia and control groups, excluding hypertension; Table S3: Table of correlation between retinal parameters and PANSS (total score) in Schizophrenia; Table S4: Table of correlation between retinal parameters and PANSS (positive) in Schizophrenia; Table S5: Table of correlation between retinal parameters and PANSS (negative) in Schizophrenia; Table S6: Table of correlation between retinal parameters and PANSS (general psychopathology) in Schizophrenia; Table S7: Table of correlation between retinal parameters and Brief Psychiatric Rating Scale; Table S8: Table of correlation between retinal parameters and chlorpromazine equivalent daily drug dosage; Table S9: Table of characteristics of duration of untreated psychosis of 0–1y and >1y; Table S10: Table of correlation between retinal characteristics and illness duration in Schizophrenia.

Author Contributions

W.W.-L.C. conceived and designed the study, wrote the protocol, obtained ethical approval, coordinated the study, recruited participants, acquired the retinal images, performed statistical analysis and drafted the manuscript. B.C.-Y.Z., K.M.C., H.H., C.L. and M.L. contributed to study design and protocol development; M.L. assisted with ethical approval and study coordination; B.C.-Y.Z. and J.L. performed the retinal-image analysis; N.T. assisted with acquisition of retinal images; B.C.-Y.Z., K.M.C., H.H. and C.L. assisted with drafting of the manuscript. All authors have read and agreed to the published version of the manuscript.

Funding

This study received no external funding.

Institutional Review Board Statement

The study was conducted in accordance with the Declaration of Helsinki, and approved by the Central Institutional Review Board (Central IRB) of the Hospital Authority (protocol code: No.: CIRB-2024-297-4 and approval date: 15 October 2024).

Informed Consent Statement

Informed consent was obtained from all subjects involved in the study.

Data Availability Statement

The original contributions presented in this study are included in the article. Further inquiries can be directed to the corresponding author.

Acknowledgments

The authors thank the staff of the Tuen Mun Mental Health Centre and Castle Peak Hospital for their support during recruitment and data collection, and all participants for their contribution. The retinal camera used in this study was provided by the Chinese University of Hong Kong.

Conflicts of Interest

BZ and JL have a patent “Method and device for retinal image analysis” licensed to Health View Bioanalytic Ltd., and receive royalties through the Chinese University of Hong Kong. BZ and JL are founders and shareholders of Health View Bioanalytic Ltd., Bioanalytic Holdings Ltd., and Bioanalytic International Holdings Ltd. ML is director of Bioanalytic Holdings Ltd., and Bioanalytic International Holdings Ltd. BZ is co-founder and shareholder of Beth Bioinformatics Company Ltd. The remaining authors have no conflict of interest to declare.

Appendix A

Table A1. Retinal parameters of Schizophrenia and control groups (left eye).
Left EyeSchizophrenia Group (n = 64)Control Group (n = 64)Mean Difference (MD) (SZ − C)p-Value (Unadjusted)p-Value (FDR)
Vasym1.65 ± 0.0911.69 ± 0.0995−0.04570.008 **0.038 *
Aasym1.37 ± 0.03611.38 ± 0.0358−0.008590.1790.376
Vangle70.0 ± 2.0068.9 ± 1.821.050.002 **0.013 *
Aangle71.5 ± 1.6871.7 ± 1.80−0.2490.4190.697
BCV0.817 ± 0.01640.816 ± 0.01570.001090.7010.836
BCA0.775 ± 0.01410.778 ± 0.0102−0.003560.1040.260
AVR0.66 ± 0.01780.665 ± 0.0148−0.004840.0970.258
Tortuosity0.322 ± 0.06180.329 ± 0.0623−0.00730.5070.732
Nicking0.171 ± 0.05910.167 ± 0.06420.003910.7210.836
Hem0.175 ± 0.07150.171 ± 0.06720.003910.7510.836
Aocc0.091 ± 0.06860.0993 ± 0.061−0.008220.4750.731
Exudates0.139 ± 0.06810.13 ± 0.05620.009190.4070.698
Average GCIPL73.7 ± 4.1575.9 ± 2.97−2.210.001 **0.009 **
Minimum GCIPL65.4 ± 6.1068.4 ± 4.22−3.040.001 **0.011 *
CDR0.543 ± 0.02980.554 ± 0.0267−0.01090.031 *0.114
pRNFL thickness88.4 ± 3.7789.9 ± 3.80−1.590.019 *0.085
Rim area1.83 ± 0.6251.97 ± 0.664−0.1480.1960.392
Disc area2.17 ± 0.1182.14 ± 0.1000.02820.1470.327
Vertical CDR0.607 ± 0.02560.596 ± 0.03790.01160.045 *0.150
Cup volume0.453 ± 0.03580.446 ± 0.03860.007470.2580.492
Note. Vasym: mean asymmetry index of venules; Aasym: mean asymmetry index of arterioles; Vangle: mean bifurcation angles of venules; Aangle: mean bifurcation angles of arterioles; BCV: mean bifurcation coefficient of venules; BCA: mean bifurcation coefficient of arterioles; AVR: arteriole-to-venule ratio; Hem: probability of haemorrhages; Aocc: probability of arteriole occlusion; GCIPL: ganglion-cell–inner-plexiform layer thickness; CDR: cup–disc ratio; pRNFL: peripapillary retinal nerve-fibre layer. * indicates p < 0.05; ** indicates p < 0.005.
Table A2. Retinal parameters of Schizophrenia and control groups (right eye).
Right EyeSchizophrenia Group (n = 64)Control Group (n = 64)Mean Difference (SZ − C)p-Value (Unadjusted)p-Value (FDR)
Vasym1.65 ± 0.09841.65 ± 0.104−0.005660.7520.836
Aasym1.33 ± 0.03121.34 ± 0.0329−0.01080.0600.184
Vangle70.5 ± 2.3370.7 ± 2.46−0.2170.6100.787
Aangle72.0 ± 2.0072.0 ± 1.760.01130.9730.973
BCV0.828 ± 0.01410.828 ± 0.0152−0.000130.9620.973
BCA0.776 ± 0.01320.777 ± 0.00983−0.001480.4730.731
AVR0.662 ± 0.01690.655 ± 0.01670.006730.025 *0.100
Tortuosity0.335 ± 0.06560.331 ± 0.06620.004170.7210.836
Nicking0.198 ± 0.06260.219 ± 0.0739−0.02070.0900.258
Hem0.206 ± 0.0750.209 ± 0.0767−0.002910.8290.896
Aocc0.0749 ± 0.04260.0738 ± 0.04080.001120.8790.925
Exudates0.110 ± 0.05560.117 ± 0.0631−0.006530.5350.732
Average GCIPL69.9 ± 3.1471.8 ± 2.22−1.88<0.001 ***0.003 **
Minimum GCIPL57.2 ± 3.7659.2 ± 3.07−2.000.001 **0.011 *
CDR0.509 ± 0.02790.514 ± 0.0242−0.004530.3280.595
pRNFL thickness87.3 ± 2.7789.0 ± 2.06−1.73<0.001 ***0.003 **
Rim area1.14 ± 0.04241.15 ± 0.0403−0.004410.5470.731
Disc area2.20 ± 0.03282.17 ± 0.06410.02850.002 **0.013 *
Vertical CDR0.606 ± 0.01590.604 ± 0.0180.00180.5490.731
Cup volume0.447 ± 0.02750.441 ± 0.02020.006230.1470.326
Note. Vasym: mean asymmetry index of venules; Aasym: mean asymmetry index of arterioles; Vangle: mean bifurcation angles of venules; Aangle: mean bifurcation angles of arterioles; BCV: mean bifurcation coefficient of venules; BCA: mean bifurcation coefficient of arterioles; AVR: arteriole-to-venule ratio; Hem: probability of haemorrhages; Aocc: probability of arteriole occlusion; GCIPL: ganglion-cell–inner-plexiform layer thickness; CDR: cup–disc ratio; pRNFL: peripapillary retinal nerve-fibre layer. * indicates p < 0.05; ** indicates p < 0.005; *** indicates p < 0.001.
Table A3. Differences in CRAE and CRVE in Schizophrenia and control groups.
Mean +/− SDCIEstimateSET Valuep-Value
CRAE
SZ status −0.0440.039−1.140.257
Age (years) −0.00160.0017−0.9360.351
Sex 0.0350.0420.8400.402
CRVE 0.9050.03426.8<0.001 ***
Control (n = 64)13.53 +/− 0.027413.48, 13.59
SZ (n = 64)13.49 +/− 0.028413.43, 13.54
Model fit: R2 = 0.8785; F (4, 123) = 222.3; p < 2.2 × 10⁻¹⁶; Residual SE = 0.2158
CRVE
SZ status 0.05080.03931.290.199
Age (years) −0.0008590.00174−0.4950.621
Sex −0.007720.0428−0.1800.857
CRAE 0.9430.035226.8<0.001 ***
Control (n = 64)20.43 +/− 0.027920.38, 20.49
SZ (n = 64)20.48 +/− 0.029020.43, 20.54
Model fit: R2: 0.8777; F (4, 123) = 220.7; p < 2.2 × 10⁻¹⁶; Residual SE: 0.2202
Note. SD: Standard deviation; CRAE: central retinal arteriolar equivalent; SZ: Schizophrenia; CRVE: central retinal venular equivalent; CI: Confidence interval; SE: standard error; R2: coefficient of determination. *** indicates p < 0.001.

Appendix B

Table A4. Retinal measurements by ARIA.
AbbreviationMeasurementCharacteristic
Fundal-imaging measurements
CRAEDiameter equivalent of retinal arteriolesA summary measure of the average diameter of retinal arterioles, choosing the six largest arterioles lying within 0.5–1 disc diameters from the optic disc.
CRVEDiameter equivalent of retinal venulesA summary measure of the average diameter of retinal venules, choosing the six largest venules lying within 0.5–1 disc diameters from the optic disc.
AVRArteriole-to-venule ratio, or the ratio of CRAE to CRVEA ratio of arteriole against venular diameter, which measures generalized arteriolar narrowing, relative to venular size.
BCAMean bifurcation coefficient of arteriolesThe diameter of daughter arterioles relative to the width of parent arterioles. Higher values indicate dilation and lower values indicate constriction.
BCVMean bifurcation coefficient of venulesThe diameter of daughter arterioles relative to the width of parent venules. Higher values indicate dilation and lower values indicate narrowing.
AangleMean bifurcation angles of arteriolesThe average angle between two daughter arterioles at branching points, of all visible arteriolar bifurcations, measured within 0.5–1 disc diameters from the optic disc.
VangleMean bifurcation angles of venulesThe average angle between two daughter arterioles at branching points, of all visible venular bifurcations, measured within 0.5–1 disc diameters from the optic disc.
AasymMean asymmetry index of arteriolesDegree of size difference between two daughter arteriole diameters. The lesser the value, the bigger the arteriole asymmetry.
VasymMan asymmetry index of venulesDegree of size difference between two daughter venule diameters. The lesser the value, the bigger the venule asymmetry.
TortVessel tortuosityThe length of vessel segments against the straight-line distance between endpoints.
NippingArteriole–venule nickingThe degree of overlap where an arteriole presses on the vein, causing a narrowing of the venule.
Hem Probability of haemorrhagesThe probability of haemorrhage presence in the retinal image.
Exudates Probability of exudatesThe probability of exudate presence in the retinal image.
AoccProbability of arteriole occlusionThe probability of occlusions in the retinal image.
CDROptic-cup-to-optic-disc ratioDiameter of the optic cup against the optic disc. A larger cup size relative to the disc indicates loss of neuronal tissue at the optic-nerve head.
Vert CDRVertical optic-cup-to-optic-disc ratioVertical height of the optic cup against the optic disc. Vertical elongation indicates optic-nerve damage.
RimareaArea of the neuroretinal rim of the optic-nerve headArea of the neuroretinal rim of the optic-nerve head, in equivalent units.
DiscareaArea of the optic discArea of the optic disc, in equivalent units.
OCT-imaging measurements
RNFLPeripapillary retinal nerve-fibre layer thicknessThickness of the nerve-fibre layer in the retina, in micrometres.
Avg GCIPLAverage ganglion-cell–inner-plexiform layer thicknessAverage thickness of both the ganglion-cell layer (GCL) and inner-plexiform layer (ICL) in the retina, in micrometres.
Min GCIPLMinimum ganglion-cell–inner-plexiform layer thicknessMinimum thickness of both the ganglion-cell layer (GCL) and inner-plexiform layer (ICL) in the retina, in micrometres.
Cup volumeOptic-cup volumeVolume of the optic cup, in equivalent units.

References

  1. Luvsannyam, E.; Jain, M.S.; Pormento, M.K.L.; Siddiqui, H.; Balagtas, A.R.A.; Emuze, B.O.; Poprawski, T. Neurobiology of Schizophrenia: A Comprehensive Review. Cureus 2022, 14, e23959. [Google Scholar] [CrossRef] [Scilit] [PubMed]
  2. Jiang, Y.; Palaniyappan, L.; Luo, C.; Chang, X.; Zhang, J.; Tang, Y.; Zhang, T.; Li, C.; Zhou, E.; Yu, X.; et al. Neuroimaging epicenters as potential sites of onset of the neuroanatomical pathology in schizophrenia. Sci. Adv. 2024, 10, eadk6063. [Google Scholar] [CrossRef] [Scilit] [PubMed]
  3. Bales, T.R.; Lopez, M.J.; Clark, J. Embryology, Eye. In StatPearls [Internet]; StatPearls Publishing: Treasure Island, FL, USA, 2025. [Google Scholar]
  4. Bannai, D.; Lizano, P.; Kasetty, M.; Lutz, O.; Zeng, V.; Sarvode, S.; Kim, L.A.; Hill, S.; Tamminga, C.; Clementz, B.; et al. Retinal layer abnormalities and their association with clinical and brain measures in psychotic disorders: A preliminary study. Psychiatry Res. Neuroimaging 2020, 299, 111061. [Google Scholar] [CrossRef] [Scilit] [PubMed]
  5. Korann, V.; Appaji, A.; Jacob, A.; Devi, P.; Nagendra, B.; Chako, D.M.; Padmanabha, A.; Thonse, U.; Bharath, R.D.; Kumar, V.; et al. Association between retinal vascular caliber and brain structure in schizophrenia. Asian J. Psychiatry 2021, 61, 102707. [Google Scholar] [CrossRef] [Scilit] [PubMed]
  6. Zhuo, C.; Xiao, B.; Ji, F.; Lin, X.; Jiang, D.; Tian, H.; Xu, Y.; Wang, W.; Chen, C. Patients with first-episode untreated schizophrenia who experience concomitant visual disturbances and auditory hallucinations exhibit co-impairment of the brain and retinas—A pilot study. Brain Imaging Behav. 2021, 15, 1533–1541. [Google Scholar] [CrossRef] [Scilit] [PubMed]
  7. Duraković, D.; Silić, A.; Peitl, V.; Tadić, R.; Lončarić, K.; Glavina, T.; Šago, D.; Turk, L.P.; Karlović, D. The Use of Electroretinography and Optical Coherence Tomography in Patients with Schizophrenia. Acta Clin. Croat. 2020, 59, 729–738. [Google Scholar] [CrossRef] [Scilit] [PubMed]
  8. Silverstein, S.M.; Fradkin, S.I.; Demmin, D.L. Schizophrenia and the retina: Towards a 2020 perspective. Schizophr. Res. 2020, 219, 84–94. [Google Scholar] [CrossRef] [Scilit] [PubMed]
  9. Karczmarek, P.; Plechawska-Wójcik, M.; Kiersztyn, A.; Domagała, A.; Wolinska, A.; Silverstein, S.M.; Jonak, K.; Krukow, P. On the improvement of schizophrenia detection with optical coherence tomography data using deep neural networks and aggregation functions. Sci. Rep. 2024, 14, 31903. [Google Scholar] [CrossRef] [Scilit] [PubMed]
  10. Appaji, A.; Nagendra, B.; Chako, D.M.; Padmanabha, A.; Jacob, A.; Hiremath, C.V.; Varambally, S.; Kesavan, M.; Venkatasubramanian, G.; Rao, S.V.; et al. Examination of retinal vascular trajectory in schizophrenia and bipolar disorder. Psychiatry Clin. Neurosci. 2019, 73, 738–744. [Google Scholar] [CrossRef] [Scilit] [PubMed]
  11. Wagner, S.K.; Cortina-Borja, M.; Silverstein, S.M.; Zhou, Y.; Romero-Bascones, D.; Struyven, R.R.; Trucco, E.; Mookiah, M.R.K.; MacGillivray, T.; Hogg, S.; et al. Association Between Retinal Features From Multimodal Imaging and Schizophrenia. JAMA Psychiatry 2023, 80, 478–487. [Google Scholar] [CrossRef] [Scilit] [PubMed]
  12. Stankovic, I.; Notaras, M.; Wolujewicz, P.; Lu, T.; Lis, R.; Ross, M.E.; Colak, D. Schizophrenia endothelial cells exhibit higher permeability and altered angiogenesis patterns in patient-derived organoids. Transl. Psychiatry 2024, 14, 53. [Google Scholar] [CrossRef] [Scilit] [PubMed]
  13. Huang, L.; Aris, I.M.; Teo, L.L.Y.; Wong, T.Y.; Chen, W.-Q.; Koh, A.S.; Li, L.-J. Exploring Associations Between Cardiac Structure and Retinal Vascular Geometry. J. Am. Heart Assoc. 2020, 9, e014654. [Google Scholar] [CrossRef] [Scilit] [PubMed]
  14. Klein, R.; Sharrett, A.R.; Klein, B.E.K.; Chambless, L.E.; Cooper, L.S.; Hubbard, L.D.; Evans, G. Are Retinal Arteriolar Abnormalities Related to Atherosclerosis? Arter. Thromb. Vasc. Biol. 2000, 20, 1644–1650. [Google Scholar] [CrossRef] [Scilit] [PubMed]
  15. Kennedy, K.G.; Mio, M.; Goldstein, B.I.; Brambilla, P.; Delvecchio, G. Systematic review and meta-analysis of retinal microvascular caliber in bipolar disorder, major depressive disorder, and schizophrenia. J. Affect. Disord. 2023, 331, 342–351. [Google Scholar] [CrossRef] [Scilit] [PubMed]
  16. Schmidt-Kastner, R.; van Os, J.; Esquivel, G.; Steinbusch, H.W.M.; Rutten, B.P.F. An environmental analysis of genes associated with schizophrenia: Hypoxia and vascular factors as interacting elements in the neurodevelopmental model. Mol. Psychiatry 2012, 17, 1194–1205. [Google Scholar] [CrossRef] [Scilit] [PubMed]
  17. Hsieh, F.Y. Sample size tables for logistic regression. Stat. Med. 1989, 8, 795–802. [Google Scholar] [CrossRef] [Scilit] [PubMed]
  18. Gonzalez-Diaz, J.M.; Radua, J.; Sanchez-Dalmau, B.; Camos-Carreras, A.; Zamora, D.C.; Bernardo, M. Mapping Retinal Abnormalities in Psychosis: Meta-analytical Evidence for Focal Peripapillary and Macular Reductions. Schizophr. Bull. 2022, 48, 1194–1205. [Google Scholar] [CrossRef] [Scilit] [PubMed]
  19. Lizano, P.; Bannai, D.; Lutz, O.; Kim, L.A.; Miller, J.; Keshavan, M. A Meta-analysis of Retinal Cytoarchitectural Abnormalities in Schizophrenia and Bipolar Disorder. Schizophr. Bull. 2020, 46, 43–53. [Google Scholar] [CrossRef] [Scilit] [PubMed]
  20. Andreasen, N.C.; Pressler, M.; Nopoulos, P.; Miller, D.; Ho, B.-C. Antipsychotic Dose Equivalents and Dose-Years: A Standardized Method for Comparing Exposure to Different Drugs. Biol. Psychiatry 2010, 67, 255–262. [Google Scholar] [CrossRef] [Scilit] [PubMed]
  21. Shi, C.; Lee, J.; Wang, G.; Dou, X.; Yuan, F.; Zee, B. Assessment of image quality on color fundus retinal images using the automatic retinal image analysis. Sci. Rep. 2022, 12, 10455. [Google Scholar] [CrossRef] [Scilit] [PubMed]
  22. Zee, B.; Lee, J.; Li, Q. Method and Device for Retinal Image Analysis. Patent No. US8787638 B2, 22 July 2014. [Google Scholar]
  23. Meier, M.H.; Gillespie, N.A.; Hansell, N.K.; Hewitt, A.W.; Hickie, I.B.; Lu, Y.; McGrath, J.; MacGregor, S.; Medland, S.E.; Sun, C.; et al. Retinal microvessels reflect familial vulnerability to psychotic symptoms: A comparison of twins discordant for psychotic symptoms and controls. Schizophr. Res. 2015, 164, 47–52. [Google Scholar] [CrossRef] [Scilit] [PubMed]
  24. Appaji, A.; Nagendra, B.; Chako, D.M.; Padmanabha, A.; Hiremath, C.V.; Jacob, A.; Varambally, S.; Kesavan, M.; Venkatasubramanian, G.; Rao, S.V.; et al. Retinal vascular abnormalities in schizophrenia and bipolar disorder: A window to the brain. Bipolar Disord. 2019, 21, 634–641. [Google Scholar] [CrossRef] [Scilit] [PubMed]
  25. Appaji, A.; Nagendra, B.; Chako, D.M.; Padmanabha, A.; Jacob, A.; Hiremath, C.V.; Varambally, S.; Kesavan, M.; Venkatasubramanian, G.; Rao, S.V.; et al. Relation between retinal vascular abnormalities and working memory impairment in patients with schizophrenia and bipolar disorder. Asian J. Psychiatry 2020, 49, 101942. [Google Scholar] [CrossRef] [Scilit] [PubMed]
  26. Meier, M.H.; Shalev, I.; Moffitt, T.E.; Kapur, S.; Keefe, R.S.E.; Wong, T.Y.; Belsky, D.W.; Harrington, H.L.; Hogan, S.; Houts, R.; et al. Microvascular abnormality in schizophrenia as shown by retinal imaging. Am. J. Psychiatry 2013, 170, 1451–1459. [Google Scholar] [CrossRef] [Scilit] [PubMed]
  27. Heinzer, L.; Curtis, D. What have genetic studies of rare sequence variants taught us about the aetiology of schizophrenia? J. Transl. Genet. Genom. 2024, 8, 1–12. [Google Scholar] [CrossRef] [Scilit]
  28. Appaji, A.; Harish, V.; Korann, V.; Devi, P.; Jacob, A.; Padmanabha, A.; Kumar, V.; Varambally, S.; Venkatasubramanian, G.; Rao, S.V.; et al. Deep learning model using retinal vascular images for classifying schizophrenia. Schizophr. Res. 2022, 241, 238–243. [Google Scholar] [CrossRef] [Scilit] [PubMed]
  29. Matloff, N. Statistical Regression and Classification: From Linear Models to Machine Learning; CRC Press: Boca Raton, FL, USA, 2017. [Google Scholar]
  30. Hanson, D.R.; Gottesman, I.I. Theories of schizophrenia: A genetic-inflammatory-vascular synthesis. BMC Med. Genet. 2005, 6, 7. [Google Scholar] [CrossRef] [Scilit] [PubMed]
  31. Katsel, P.; Roussos, P.; Pletnikov, M.; Haroutunian, V. Microvascular anomaly conditions in psychiatric disease. Schizophrenia—Angiogenesis connection. Neurosci. Biobehav. Rev. 2017, 77, 327–339. [Google Scholar] [CrossRef] [Scilit] [PubMed]
  32. Percie du Sert, O.; Unrau, J.; Gauthier, C.J.; Chakravarty, M.; Malla, A.; Lepage, M.; Raucher-Chéné, D. Cerebral blood flow in schizophrenia: A systematic review and meta-analysis of MRI-based studies. Prog. Neuro-Psychopharmacol. Biol. Psychiatry 2023, 121, 110669. [Google Scholar] [CrossRef] [Scilit] [PubMed]
  33. Eisenberg, D.P.; Yankowitz, L.; Ianni, A.M.; Rubinstein, D.Y.; Kohn, P.D.; Hegarty, C.E.; Gregory, M.D.; Apud, J.A.; Berman, K.F. Presynaptic Dopamine Synthesis Capacity in Schizophrenia and Striatal Blood Flow Change During Antipsychotic Treatment and Medication-Free Conditions. Neuropsychopharmacology 2017, 42, 2232–2241. [Google Scholar] [CrossRef] [Scilit] [PubMed]
  34. Basu, S.; Nagy, J.A.; Pal, S.; Vasile, E.; Eckelhoefer, I.A.; Bliss, V.S.; Manseau, E.J.; Dasgupta, P.S.; Dvorak, H.F.; Mukhopadhyay, D. The neurotransmitter dopamine inhibits angiogenesis induced by vascular permeability factor/vascular endothelial growth factor. Nat. Med. 2001, 7, 569–574. [Google Scholar] [CrossRef] [Scilit] [PubMed]
  35. Sonne, J.; Goyal, A.; Lopez-Ojeda, W. Dopamine. In StatPearls [Internet]; Updated 3 July 2023; StatPearls Publishing: Treasure Island, FL, USA, 2025. Available online: https://www.ncbi.nlm.nih.gov/books/NBK535451/ (accessed on 1 July 2026).
  36. Lee, H.S.; Han, J.; Bai, H.; Kim, K. Brain angiogenesis in developmental and pathological processes: Regulation, molecular and cellular communication at the neurovascular interface. FEBS J. 2009, 276, 4622–4635. [Google Scholar] [CrossRef] [Scilit] [PubMed]
  37. Shalabi, S.; Belayachi, A.; Larrivée, B. Involvement of neuronal factors in tumor angiogenesis and the shaping of the cancer microenvironment. Front. Immunol. 2024, 15, 1284629. [Google Scholar] [CrossRef] [Scilit] [PubMed]
  38. Liang, J.H.; Akhanov, V.; Ho, A.; Tawfik, M.; D’sOuza, S.P.; Cameron, M.A.; Lang, R.A.; Samuel, M.A. Dopamine signaling from ganglion cells directs layer-specific angiogenesis in the retina. Curr. Biol. 2023, 33, 3821–3834.e5. [Google Scholar] [CrossRef] [Scilit] [PubMed]
  39. Choi, J.-K.; Chen, Y.I.; Hamel, E.; Jenkins, B.G. Brain hemodynamic changes mediated by dopamine receptors: Role of the cerebral microvasculature in dopamine-mediated neurovascular coupling. NeuroImage 2006, 30, 700–712. [Google Scholar] [CrossRef] [Scilit] [PubMed]
  40. Dukart, J.; Holiga, Š.; Chatham, C.; Hawkins, P.; Forsyth, A.; McMillan, R.; Myers, J.; Lingford-Hughes, A.R.; Nutt, D.J.; Merlo-Pich, E.; et al. Cerebral blood flow predicts differential neurotransmitter activity. Sci. Rep. 2018, 8, 4074. [Google Scholar] [CrossRef] [Scilit] [PubMed]
  41. Koronyo, Y.; Rentsendorj, A.; Mirzaei, N.; Regis, G.C.; Sheyn, J.; Shi, H.; Barron, E.; Cook-Wiens, G.; Rodriguez, A.R.; Medeiros, R.; et al. Retinal pathological features and proteome signatures of Alzheimer’s disease. Acta Neuropathol. 2023, 145, 409–438. [Google Scholar] [CrossRef] [Scilit] [PubMed]
  42. Green, A.J.; McQuaid, S.; Hauser, S.L.; Allen, I.V.; Lyness, R. Ocular pathology in multiple sclerosis: Retinal atrophy and inflammation irrespective of disease duration. Brain 2010, 133, 1591–1601. [Google Scholar] [CrossRef] [Scilit] [PubMed]
  43. Altintaş, Ö.; Işeri, P.; Özkan, B.; Çağlar, Y. Correlation between retinal morphological and functional findings and clinical severity in Parkinson’s disease. Doc. Ophthalmol. 2008, 116, 137–146. [Google Scholar] [CrossRef] [Scilit] [PubMed]
  44. Zhao, B.; Li, Y.; Fan, Z.; Wu, Z.; Shu, J.; Yang, X.; Yang, Y.; Wang, X.; Li, B.; Wang, X.; et al. Eye-brain connections revealed by multimodal retinal and brain imaging genetics. Nat. Commun. 2024, 15, 6064. [Google Scholar] [CrossRef] [Scilit] [PubMed]
  45. Samani, N.N.; Proudlock, F.A.; Siram, V.; Suraweera, C.; Hutchinson, C.; Nelson, C.P.; Al-Uzri, M.; Gottlob, I. Retinal Layer Abnormalities as Biomarkers of Schizophrenia. Schizophr. Bull. 2018, 44, 876–885. [Google Scholar] [CrossRef] [Scilit] [PubMed]
  46. Jensen, R.J. Effects of Antipsychotic Drugs Haloperidol and Clozapine on Visual Responses of Retinal Ganglion Cells in a Rat Model of Retinitis Pigmentosa. J. Ocul. Pharmacol. Ther. 2016, 32, 685–690. [Google Scholar] [CrossRef] [Scilit] [PubMed]
  47. Chiou, G.C.; Li, B.H. Effects of Dopamine Antagonists on Retinal B-Wave Recovery After Retinal Ischemia. J. Ocul. Pharmacol. Ther. 1993, 9, 179–185. [Google Scholar] [CrossRef] [Scilit] [PubMed]
  48. Komatsu, H.; Onoguchi, G.; Silverstein, S.M.; Jerotic, S.; Sakuma, A.; Kanahara, N.; Kakuto, Y.; Ono, T.; Yabana, T.; Nakazawa, T.; et al. Retina as a potential biomarker in schizophrenia spectrum disorders: A systematic review and meta-analysis of optical coherence tomography and electroretinography. Mol. Psychiatry 2023, 29, 464–482. [Google Scholar] [CrossRef] [Scilit] [PubMed]
  49. Block, F.; Schwarz, M. The b-Wave of the Electroretinogram as an Index of Retinal Ischemia. Gen. Pharmacol. Vasc. Syst. 1998, 30, 281–287. [Google Scholar] [CrossRef] [Scilit] [PubMed]
  50. Kolb, H. Neurotransmitters in the Retina. In Webvision: The Organization of the Retina and Visual System [Internet]; Kolb, H., Fernandez, E., Nelson, R., Eds.; University of Utah Health Sciences Center: Salt Lake City, UT, USA, 1995. Available online: https://www.ncbi.nlm.nih.gov/books/NBK11546/ (accessed on 1 July 2026).
  51. Rabe, F.; Smigielski, L.; Georgiadis, F.; Kallen, N.; Omlor, W.; Edkins, V.; Kirschner, M.; Cathomas, F.; Grünblatt, E.; Silverstein, S.; et al. Genetic susceptibility to schizophrenia through neuroinflammatory pathways associated with retinal thinness. Nat. Ment. Health 2025, 3, 538–547. [Google Scholar] [CrossRef] [Scilit] [PubMed]
  52. Rodrigues-Amorim, D.; Rivera-Baltanás, T.; Spuch, C.; Caruncho, H.J.; González-Fernandez, Á.; Olivares, J.M.; Agís-Balboa, R.C. Cytokines dysregulation in schizophrenia: A systematic review of psychoneuroimmune relationship. Schizophr. Res. 2018, 197, 19–33. [Google Scholar] [CrossRef] [Scilit] [PubMed]
  53. Kim, H.; Kim, H.K.; Yang, J.Y.; Kim, S.S. Optical Coherence Tomography Measurement and Visual Outcome in Acute Central Retinal Artery Occlusion. Korean J. Ophthalmol. 2018, 32, 303–311. [Google Scholar] [CrossRef] [Scilit] [PubMed]
  54. Boudriot, E.; Stephan, M.; Rabe, F.; Smigielski, L.; Schmitt, A.; Falkai, P.; Ziller, M.J.; Rossner, M.J.; Homan, P.; Papiol, S.; et al. Genetic Analysis of Retinal Cell Types in Neuropsychiatric Disorders. JAMA Psychiatry 2025, 82, 285–295. [Google Scholar] [CrossRef] [Scilit] [PubMed]
Figure 1. Flowchart of development of the machine-learning classification model. Note. RGB: red, green and blue; Modified ResNet: pretrained Inception-ResNet-v2 convolutional neural network; Glmnet: generalized linear model via penalized maximum likelihood; SVM: support vector machine.
Psychiatryint 07 00215 g001
Figure 2. Probability score distribution for the machine-learning model.
Psychiatryint 07 00215 g002
Figure 3. Differences in retinal characteristics between schizophrenia and control groups.
Psychiatryint 07 00215 g003
Figure 4. Central-retinal-arterial and venular equivalent differences between schizophrenia and control groups.
Psychiatryint 07 00215 g004
Table 1. Demographics and clinical characteristics of study participants.
Schizophrenia Group
(n = 64)
Control Group
(n = 64)
Comparison
Mean/nSDMean/nSDp-valueCIx2(df)OR
Age (years)44.011.044.113.00.959−4.1, 4.32
Sex (Male:Female)26:38 18:46 0.193 x2(1) = 1.70
Presence of diabetes7 (10.9%) 2 (3.12%) 0.1640.68, 38.67 3.77
Presence of hypertension8 (12.5%) 9 (14.1%) 1.000.27, 2.76 0.87
Presence of family history12 (18.8%) 0 (0%) <0.001 1.6, 476 ^ 27.78 ^
Duration of untreated psychosis (years)1.07 #
# n = 57
2.88
Age known to psychiatric service (years)29.89.38
Illness duration (years)14.3 #
# n = 57
9.57
Drug dosage ^^ (mg/day)414316
PANSS44.413
PANSS positive8.473.08
PANSS negative12.55.11
PANSS general psychopathology23.56.56
BPRS26.27.3
GAF70.49.97
Note. SD: standard deviation; CI: confidence interval; x2: chi-square; df: degrees of freedom; OR: odds ratio; ^ continuity correction of 0.5 added; # missing information excluded; PANSS: Positive and Negative Syndrome Scale; BPRS: Brief Psychiatric Rating Scale; GAF: Global Assessment of Functioning; ^^ chlorpromazine daily drug dose equivalence (Andreasen et al., 2010) [20].
Table 2. Classification results for internal holdout validation (30%) and 10-fold cross validation, based on training data (70%) with SVM.
ResultsValidation (30% Randomized Data)
Point Estimate 95% CI
Training (70% Randomized Data) 10-Fold Cross Validation (SVM)
Point Estimate 95% CI
Specificity0.8950.669–0.9870.9780.882–0.999
Sensitivity0.8420.604–0.9660.9560.849–0.995
Area under curve0.9270.847–1.0000.9940.982–1.000
Note. SVM: support vector machine. Area under curve generated under nonparametric assumption, with null hypothesis being true area = 0.5.
Disclaimer/Publisher’s Note: The statements, opinions and data contained in all publications are solely those of the individual author(s) and contributor(s) and not of MDPI and/or the editor(s). MDPI and/or the editor(s) disclaim responsibility for any injury to people or property resulting from any ideas, methods, instructions or products referred to in the content.