Communication

Immune Correlates of Non-Necrotic and Necrotic Granulomas in Pulmonary Tuberculosis: A Pilot Study

The Public Health Research Institute, New Jersey Medical School, Rutgers University, Newark, NJ 07103, USA
*
Author to whom correspondence should be addressed.
J. Respir. 2021, 1(4), 248-259; https://doi.org/10.3390/jor1040023
Submission received: 27 August 2021 / Revised: 25 October 2021 / Accepted: 27 October 2021 / Published: 29 October 2021

Abstract

:
A granuloma, a pathologic hallmark of tuberculosis (TB), is a complex cellular structure that develops at the site of Mycobacterium tuberculosis (Mtb) infection and is comprised of different immune cell types. Severe pulmonary TB in humans is characterized by the presence of heterogeneous granulomas, ranging from highly cellular to solid/non-necrotic and necrotic lesions, within the lungs. The host-Mtb interactions within the granulomas dictate the containment of Mtb infection or its progression into a necrotic, cavitary disease. However, the immune environment in various granulomas is poorly understood. The myeloid-derived suppressor cells (MDSCs) are key immune cells that regulate the protective versus permissive host responses against Mtb infection. However, their contexture within the lung granulomas remains unclear. In this study, using single and multiplex immunohistochemical staining, we analyzed the distribution of MDSCs, macrophages, CD4+ T cells and their immunometabolic and effector function states in the solid/non-necrotic and necrotic granulomas in patients with active pulmonary TB. We found increased MDSCs with elevated expression of immunosuppressive molecules in the solid/non-necrotic granulomas. In contrast, cells in the solid and necrotic granulomas produced similar levels of IL-6 and IL-10. Our findings suggest that MDSCs are present in solid/non-necrotic granuloma, which may play an essential role in the progression into a necrotic lesion, thus exacerbating disease pathology and transmission.

1. Introduction

Tuberculosis (TB) has been a leading cause of mortality and morbidity around the globe for decades. Mycobacterium tuberculosis (Mtb), the etiological agent of TB, infected approximately 10 million people and caused 1.5 million deaths in 2019 [1]. Following inhalation into the lungs, Mtb interacts with phagocytes, which elicit an immune response to recruit more leukocytes to the site of infection to eliminate the pathogen [2]. The recruitment and retention of immune cells, including monocytes, dendritic cells, granulocytes, and lymphocytes from the blood to the site of infection, leads to the formation of granuloma, a hallmark in TB pathology [3,4,5]. Within the granuloma, complex and intricate host-pathogen interactions regulate the outcome of Mtb infection as a progressive disease or transform the infection into an asymptomatic latency [6,7,8].
In humans and some animal models (e.g., rabbits and nonhuman primates), pulmonary Mtb infection results in a spectrum of granulomas, ranging from highly cellular to necrotic lesions within the same lung [8,9]. Histologically, solid/non-necrotic granulomas contain “caseum,” a cheese-like material derived from the necrosis of Mtb-infected macrophages and monocytes. This acellular region is surrounded by epithelioid macrophages and a lymphocytic cuff consisting of B and T lymphocytes. In a non-progressive or a latent Mtb infection, these solid/non-necrotic granulomas are calcified at the caseous center and become fibrotic nodules [10,11]. However, during the progression of the disease, some solid/non-necrotic granulomas develop cavitation (necrotic granuloma), which flows into the airways and enables the expulsion of caseum contents in the form of sputum, with abundant Mtb, thereby facilitating bacterial dissemination and the transmission of infection [10,11].
One of the host mechanisms to counteract the excessive inflammation caused by Mtb infection is the recruitment, differentiation and expansion of immunosuppressive cells, such as myeloid-derived suppressor cells (MDSCs) [12]. MDSCs are a heterogeneous population of phagocytic myeloid cells, which fail to undergo terminal differentiation to mature monocytes or neutrophils before being released into the circulation12. In hyper-inflammatory conditions, such as Mtb infection, MDSCs actively suppress the host immune activation mediated by innate natural killer (NK) cells as well as CD4+ and CD8+ T lymphocytes, in both an antigen-specific and non-specific manner [13,14,15]. However, the topologic analysis of MDSCs and their functional/activation state in solid/non-necrotic and necrotic lesions of human TB granulomas is not fully understood.
In this study, using single and multiplex immunohistochemical techniques, we analyzed the distribution of immune cells, specifically MDSCs, macrophages, CD4+ lymphocytes and their immunometabolic and functional status in the solid/non-necrotic and necrotic granulomas isolated from patients with active pulmonary TB. We applied a sequential hybridization procedure for multiplexing with different target antibodies, followed by an immunofluorescence imaging analysis. We observed more MDSCs and an increased presence of inducible nitric oxide synthase (iNOS or NOS2), arginase-1 (ARG1), and hypoxia-inducible factor 1-alpha (HIF-1α) in the solid/non-necrotic granulomas. In contrast, the level of IL-6 and IL-10 production was similar in both types of granulomas. Thus, our study highlights the complex immune environment in two different types of lung granulomas in human TB patients.

2. Materials and Methods

2.1. Tissue Samples and Ethics

Lung sections of active pulmonary TB cases (n = 33) were obtained as tissue biopsy samples through a biobank (US Biomax, Inc., Rockville, MD, USA). Both the disease status and its severity were confirmed by the clinical symptoms, radiology, and acid-fast bacilli in the patient samples (Figure S1). One granuloma from 33 TB cases, and four control, non-TB lung sections were collected for this study. Of the 33 lung TB granulomas, 7 were of a solid (cellular) type, and 26 were necrotic lesions as confirmed by the gross morphology and a microscopic analysis of H&E stained sections (Figure S1, Table S1). This study complied with the Helsinki Declaration and was approved by the Institutional Review Board (IRB) of Rutgers University, New Jersey, USA (Protocol#: Pro2021001092).

2.2. Chemicals and Antibodies

Unless specified otherwise, all chemicals and reagents were purchased from Sigma-Aldrich, St. Louis, MO, USA. Antibodies used against IBA1 (cat no. ab5076), CD11b (cat no. ab8878) and Calprotectin (a.k.a. S100A8/A9) (cat no. ab22506) were purchased from (Abcam, Waltham, MA, USA), CD33 (cat no. sc19660), CD15 (cat no. sc-19649), ARG1 and NOS2 (cat no. sc-7271) (Santa Cruz Biotechnology, Dallas, TX, USA), HIF-1α (cat no. MA5-160048) Invitrogen, Thermo Fisher Scientific, Waltham, MA, USA), IL-6 (cat no. MAB206) and IL-10 (cat no. AF-217-NA) (R& D Systems Inc, Minneapolis, MN, USA) and CD4 from (cat no. NBP1-19371AF647) Novus Biologicals, Centennial, CO, USA). The corresponding secondary antibodies including the anti-mouse (cat no. ab150113 or ab136127), anti-goat (cat no. ab 150129) and anti-rat (cat no. ab150165) antibodies were purchased from Abcam, Waltham, MA, USA.

2.3. Single and Multiplex Immunohistochemistry

The FFPE tissue sections were deparaffinized by dipping them twice in xylene for 5 min, followed by rehydration through washing them in graded ethanol (10 min each wash in absolute ethanol, followed by 95% and 70% ethanol) for 10 min. Then the tissue sections were kept in a citrate buffer at 90 °C for 40 min to retrieve the antigen. After antigen retrieval, the tissues were washed with distilled water and blocked with a 5% bovine serum albumin (BSA) in 1× PBS. An antibody was prepared in 5% BSA at 1:1000 dilution, applied to the tissue section, and incubated overnight at 4 °C. The tissue sections were washed with 1× PBS and a fluorophore-tagged secondary antibody, prepared at 1:2000 dilution in 5% BSA, added to the tissue section and incubated at room temperature for 1h. Finally, a TrueBlack Lipofuschin autofluorescence quencher (Biotium Inc, Fremont, CA, USA) was applied to the tissue sections and mounted. The slides were stripped from the first target antibody for multiplex staining through treatment with a stripping buffer (62.5 mM Tris-HCl pH 6.7 + 2% SDS, 100 mM 2-ME) at 65 °C for 30 min and was washed 10 times in fresh 1× PBS for 1 h and used for sequential immunostaining. The slides were analyzed through microscopy to confirm the complete removal of the antibody from the first round before reprobing with a second target antibody. Up to 3 rounds of staining/stripping were performed to image three target marker expressions on the same sections. The following pair of antibodies were used in multiplex imaging: CD11b and CD33; CD4 and IBA1; IL-6 and IL-10. All other antibodies (CD15, S100A8/A9, NOS2, ARG1, and HIF-1α) were used as singleplex imaging due to compatibility issues with secondary antibodies and/or detection fluorophores (i.e., if two or more primary antibodies were generated in the same host animal species, they could not be used together, unless they were conjugated with different fluorophores).

2.4. Imaging and Analysis

Images were acquired using an Axiovert 200M inverted fluorescence microscope (Zeiss, Oberkochen, Germany) using a 20× objective or 63× oil-immersion objective and a Prime sCMOS camera (Photometrics, Tucson, A2) controlled by Metamorph image acquisition software (Molecular Devices, San Jose, CA, USA). To enumerate the various cell types in the granulomas, a computer algorithm, that was developed in MatLab and measures signal intensities from immunostained tissue sections was used [16]. A total of 6926 cells in the control samples (n = 3), 12,765 cells in the solid/non-necrotic (n = 6) granulomas, and 46,282 cells in the necrotic (n = 18) granulomas were counted across several fields at 200× the original magnification, across each lesion and were then pooled into their respective groups (i.e., control, solid/solid/non-necrotic or necrotic lesions) for analysis. The number of cells positive for a marker was normalized to the total number of cells in each field (40–50 fields analyzed per sample).

2.5. Statistical Analysis

GraphPad Prism-8 (GraphPad Software, San Diego, CA, USA) was used for the statistical analysis of data. A one-way ANOVA with Tukey’s multi-group comparison was used to determine the differences between the study groups. All p values of <0.05 were considered statistically significant.

3. Results

3.1. MDSCs Are Predominantly Present in Solid/Non-Necrotic Granulomas

We applied multiple cell markers in either a single or multiplex format to identify various myeloid cell populations and their functional status in the solid/non-necrotic and necrotic lung TB granulomas and compared them to the uninfected control sections. In these granulomas, the host cells immediately surrounding the central solid/non-necrotic region or around the necrotic area Figure S1 were used to analyze the expression of target markers.
Human MDSCs are comprised of monocytic (M-MDSC) and polymorphonuclear (PMN-MDSC) subtypes in the peripheral blood, and they bear the phenotype CD11b + CD14 + CD15 (M-MDSC) and CD11b + CD14CD15+ (PMN-MDSC) [17,18]. To analyze the presence of both M- and PMN-MDSCs in human lung granulomatous regions, we used cell surface markers CD11b, CD33 as displayed in Figure 1A. We observed significantly greater levels of CD11b and CD33 expressing cells in the solid/non-necrotic lesions, compared to necrotic granulomas Figure 1B,C. Furthermore, a co-localization of CD11b and CD33 was observed in many cells, suggesting them to be MDSCs as presented in Figure 1. Although the necrotic granulomas showed an increased expression of these markers, the expression level was comparable to the uninfected/control samples. Next, we determined CD15 and S100A8/A9-expressing cells (Figure 2A) and quantified their distribution Figure 2B,C). Similar to both CD11b and CD33, we observed significantly greater CD15 and S100A8/A9-expressing cells in the solid/non-necrotic lesions, compared to necrotic granulomas. These observations suggest the abundant presence of MDSCs in the solid/non-necrotic cellular granulomas. A further characterization of the immune cells in the granulomas using antibodies against activated macrophages (IBA1) [19], and CD4-positive lymphocytes as presented in Figure 2 showed a significantly high infiltration of both these immune cell types in the solid/non-necrotic granulomas compared to the necrotic samples (Figure 2D,E).

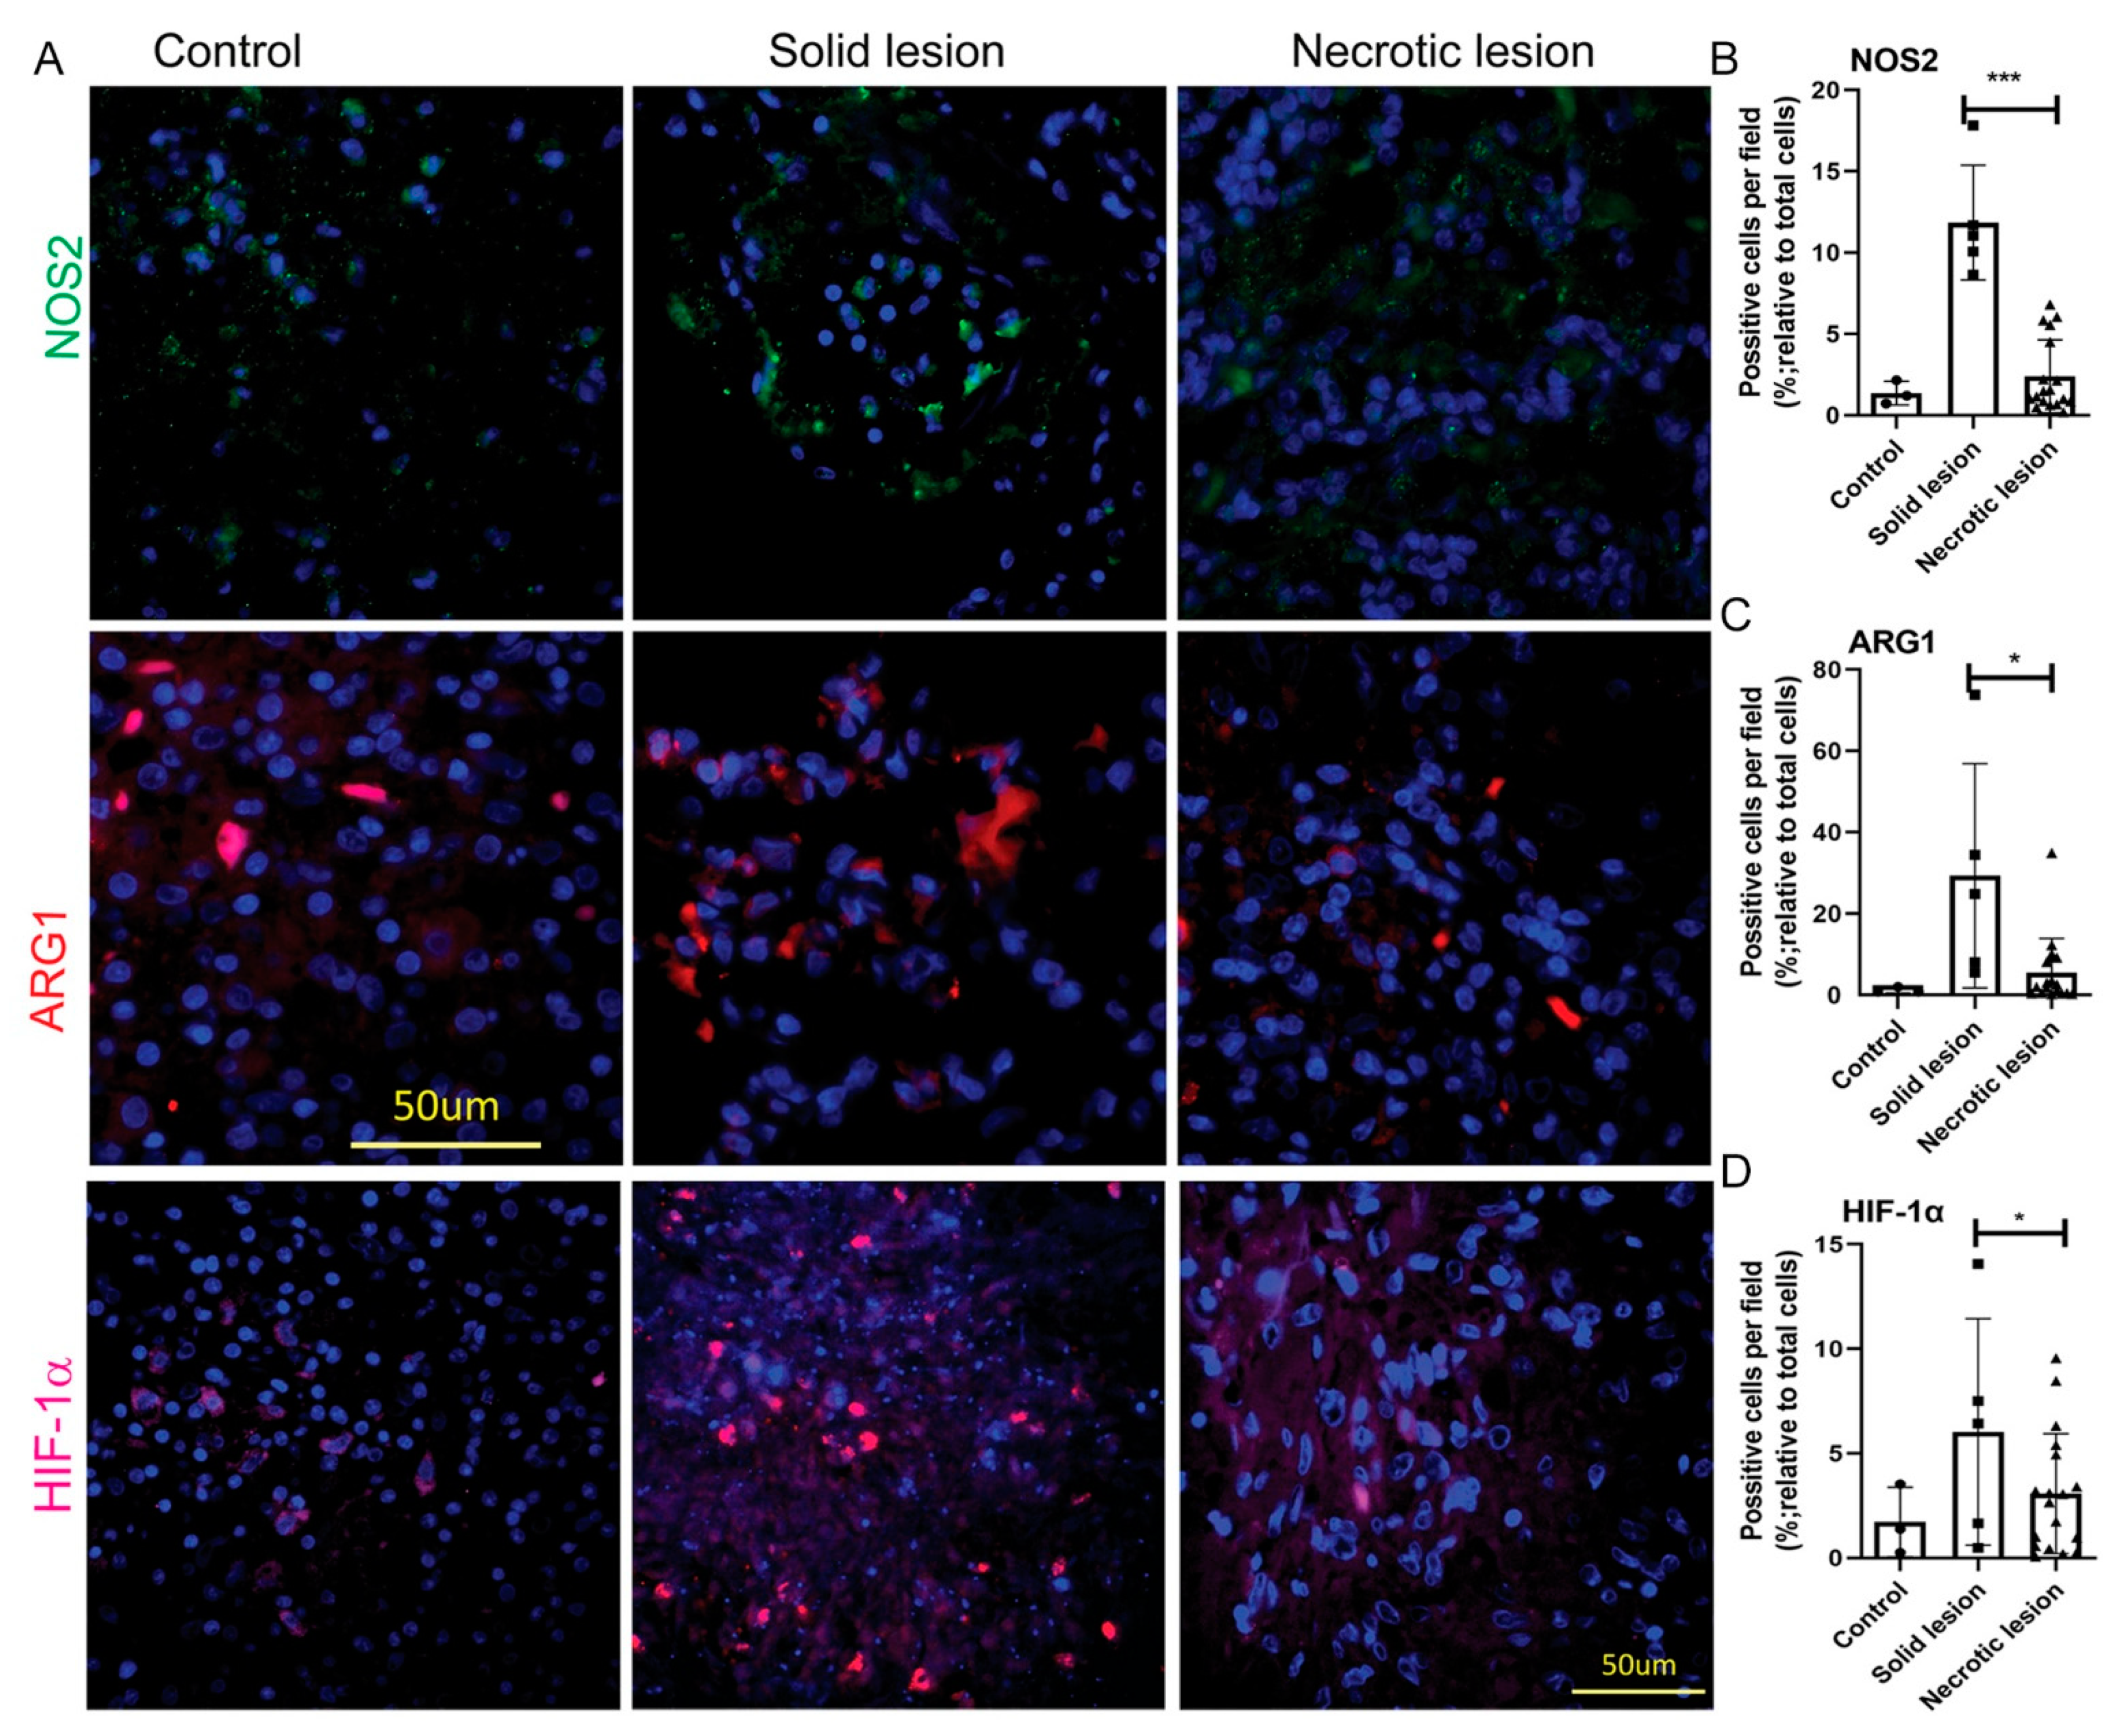
3.2. MDSCs Elicit Their Immunosuppressive Function through an Induced Expression of NOS2, ARG1 and HIF-1α in Solid/Non-necrotic Granulomas

The suppressive activity of MDSCs is associated with the metabolism of L-arginine, which serves as a substrate for the following two enzymes: inducible nitric oxide synthase (iNOS or NOS2), which generates NO, and arginase, encoded by ARG1, which converts L-arginine into urea and L-ornithine. A high expression of both of these enzymes has been reported in MDSCs during Mtb infection [20,21]. We therefore tested the expression of NOS2 and ARG1 in the lung TB granulomas, shown in Figure 3. We found a significantly higher expression of NOS2 (Figure 3B) and ARG1, shown in Figure 3C, in the cellular granulomas compared to the necrotic lesion and control samples. These observations were consistent with the increased number of MDSCs present in the solid/non-necrotic cellular granulomas and supported by previous reports [20,22].
Hypoxia-inducible factor-1a (HIF-1α) is a transcription factor that induces the expression of genes involved in several cellular functions, including cell survival, apoptosis, glucose metabolism, and pH regulation under hypoxic conditions [23]. HIF-1α also mediates the transition of immune cells from a proinflammatory to an immunosuppressive phenotype while maintaining antimicrobial and protective functions during sepsis [24]. HIF-1α has been demonstrated to promote the immunosuppressive properties of MDSCs and the recruitment of Treg cells to tumor sites [25]. This prompted us to investigate the cell population expressing HIF-1α in the TB lung granulomas, demonstrated in Figure 3. We observed a significantly higher expression of HIF-1α in the cellular granulomas compared to necrotic granulomas and the control samples presented in Figure 3D.

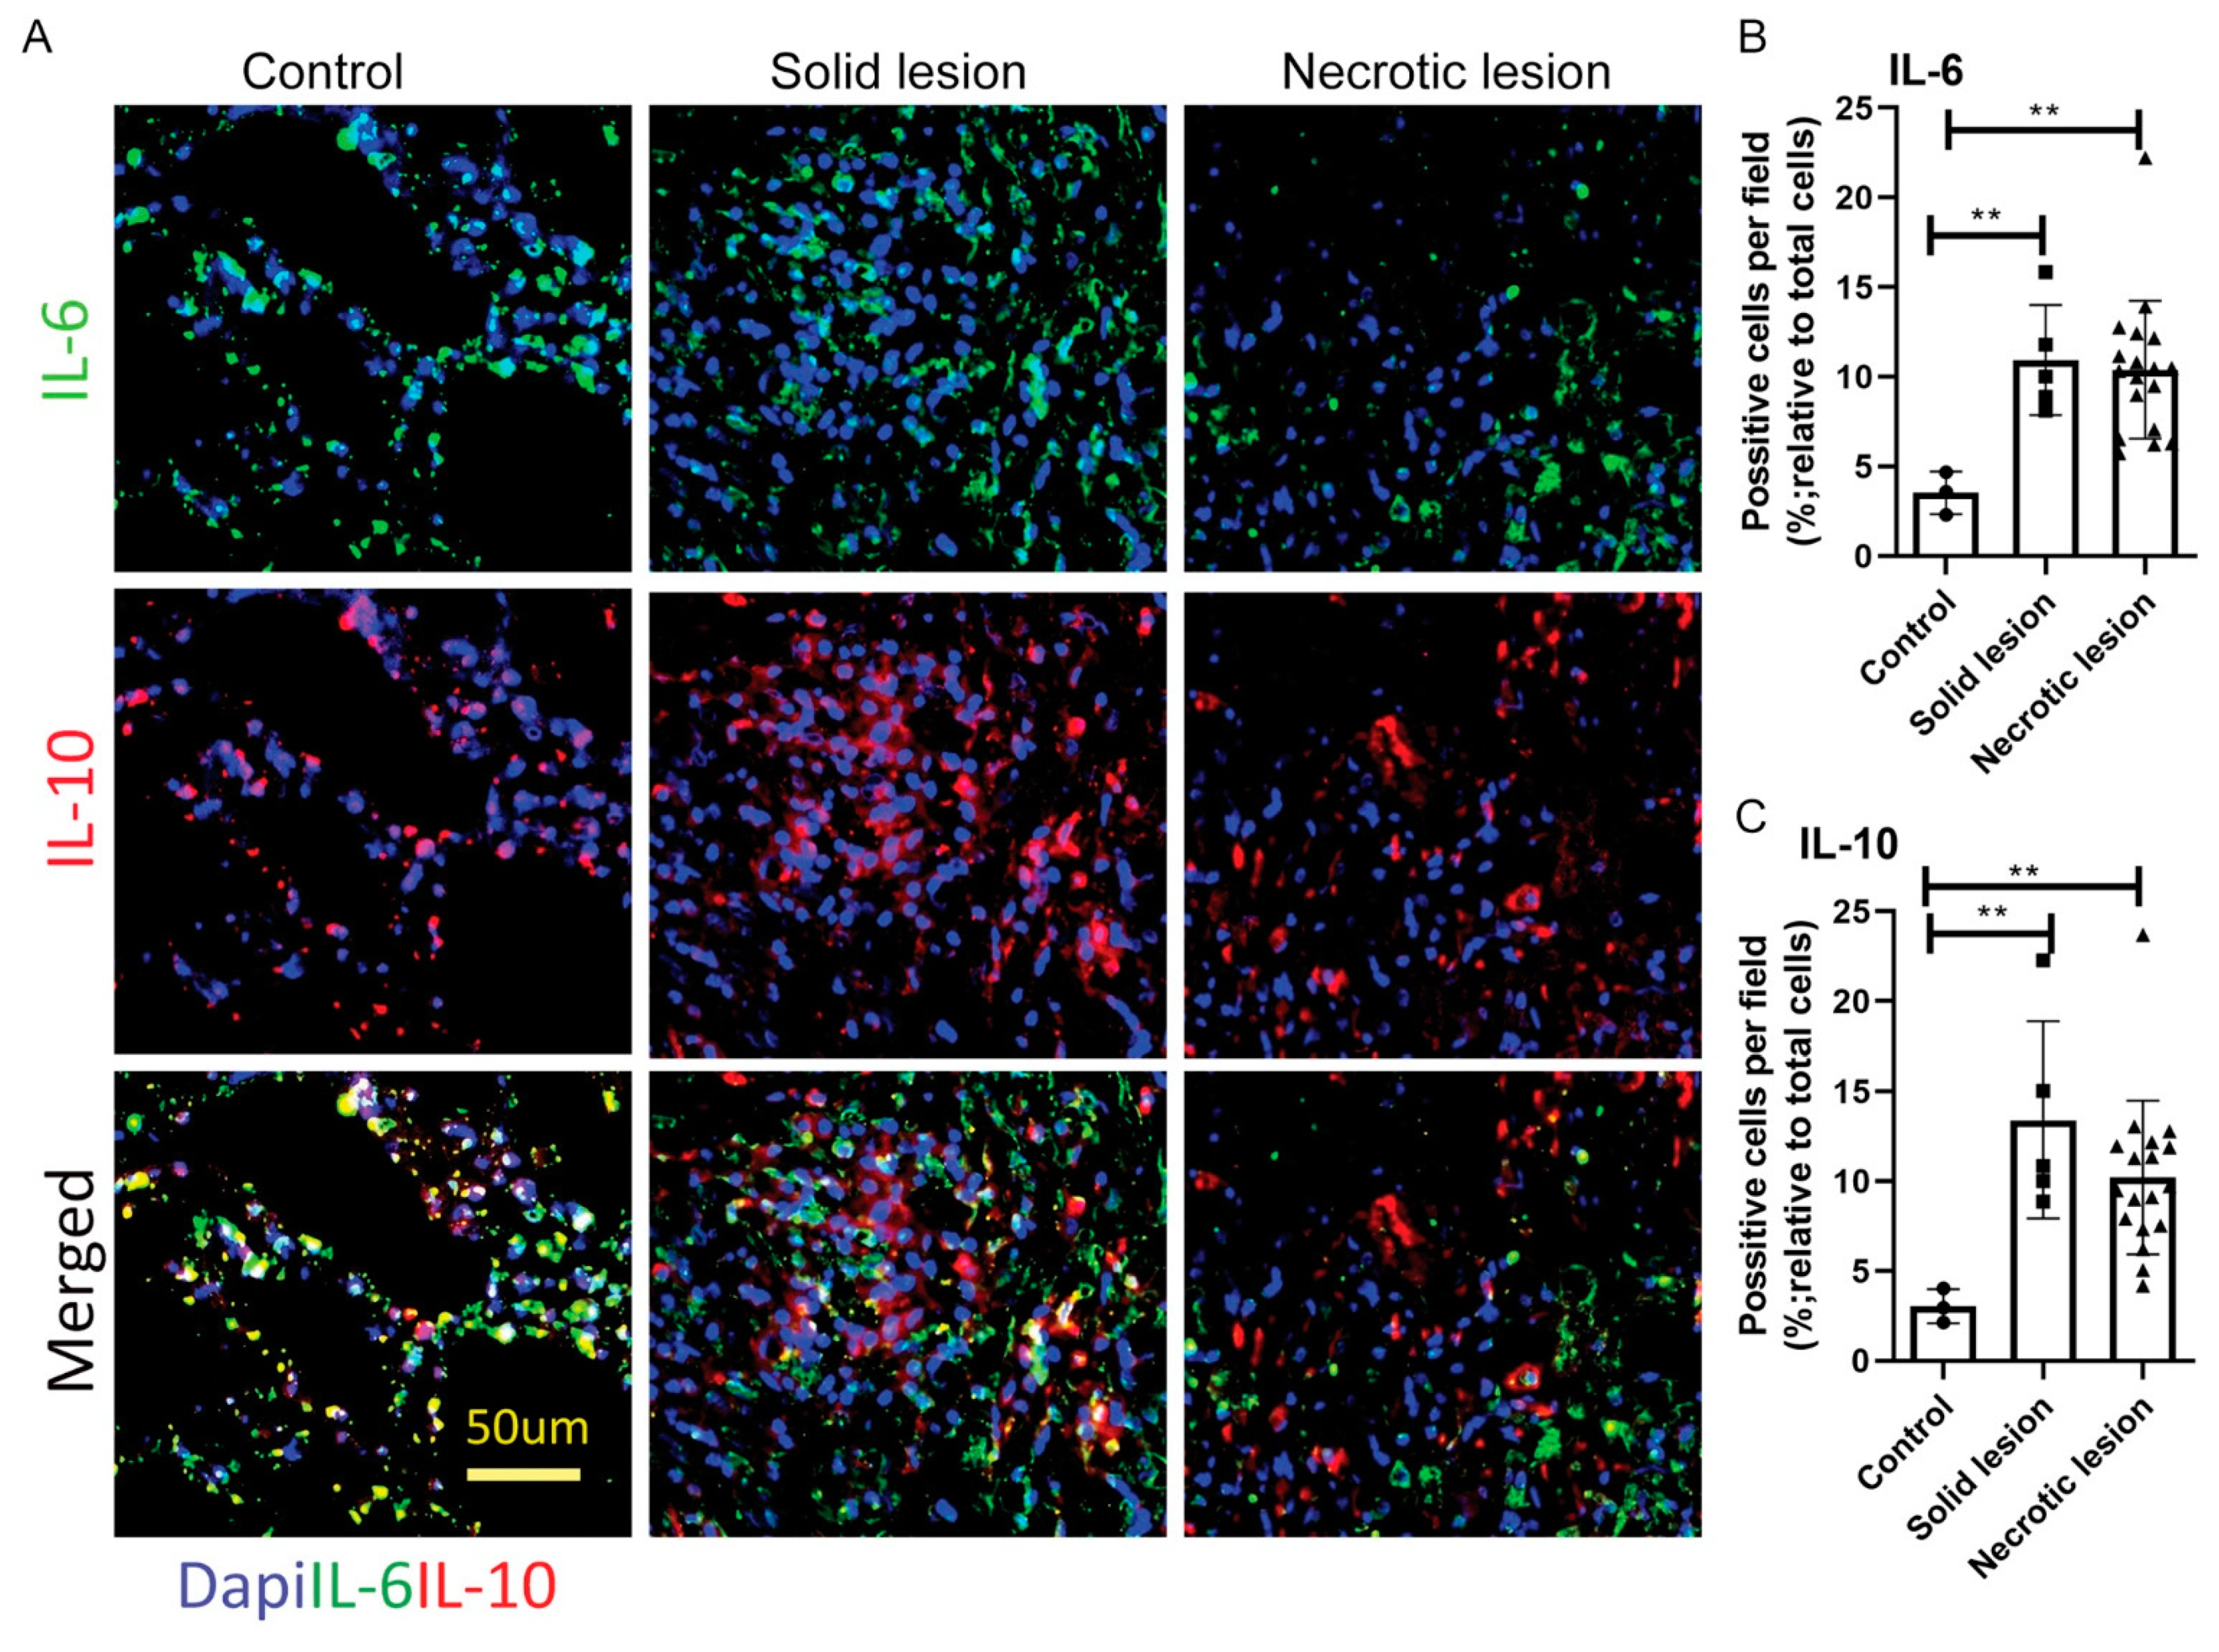
3.3. Solid/Non-Necrotic and Necrotic Granulomas Produce Similar Levels of IL-6 and IL-10

IL-6 promotes the proliferation of MDSCs, which exert an immunosuppressive effect by inducing regulatory T-cells (Treg) through an elevated IL-10 production [15,26]. To determine the expression of these two cytokines in TB lung granulomas, we probed the lung sections with antibodies specific to IL-6 or IL-10 (Figure 4). Compared to the controls, a significantly higher expression of IL-6 (Figure 4B) and IL-10 (Figure 4C) in both solid/non-necrotic and necrotic lung TB granulomas were observed. However, the difference in the IL-6 and IL-10 expression between solid/non-necrotic and necrotic granulomas was not statistically significant. These observations suggest that although solid/non-necrotic cellular granulomas contained significantly more MDSCs, macrophages and CD+ T cells relative to necrotic lesions, the immune cells in the latter type of granulomas produced more IL-6 and IL-10.

4. Discussion

Studies on the immune environment of various lung granulomas are essential for a complete understanding of the host-pathogen interactions and the disease progression during Mtb infection. While in most Mtb-infected individuals, the infection is successfully controlled or overcome, it sometimes progresses to a cavitary TB disease due to the ability of Mtb to evade host-protective immune responses and/or weakened host immunity. Some of the strategies used by Mtb to establish the disease in the infected host include the prevention of phagolysosome fusion in phagocytes, the preferential usage of endocytic pathways to access innate immune cells, which bypass traditional phagocytic antimicrobial pathways, and exploiting other host immune functions, including regulatory cell types [27,28]. The role of regulatory T cells (Treg) in preventing immunopathology during chronic infections or inflammatory conditions has been previously reported [27,28]. Recently, the role of a specific population of myeloid regulatory cells (MRC), known as myeloid-derived suppressor cells (MDSC), that act as an essential innate immune checkpoint regulator providing suppressive effects on the host’s immune response, have been reported to perform a role in TB pathogenesis [12,13].
This study analyzed the distribution of MDSCs and their expression of effector markers in two types of granulomas (i.e., solid/non-necrotic and necrotic) in the lungs of patients with pulmonary TB. To characterize the various immune cell types in the granulomas, we used antibodies against the cell markers (CD11b, CD33, CD15, S100A8/A9, IBA1 and CD4). We observed a marked heterogeneous distribution of myeloid cells (CD11b), macrophages (CD33), MDSCs (CD11b, CD15 and CD33 combined), and neutrophils (S100A8/A9 or Calprotectin) across the granulomas, with solid/non-necrotic granulomas possessing relatively higher proportion of these cells, as compared to the necrotic granulomas (Figure S2). We further determined the propensity of the immuno-metabolic components of cells across the granulomas, using a panel of antibodies targeting against the markers (HIF-1α, NOS2, ARG1), to characterize and quantify metabolically active cells. We observed a significantly higher proportion of the cells in the solid/non-necrotic granulomas to be activated metabolically, expressing an increased number of HIF-1α, NOS2 and ARG1 positive cells, as compared to the necrotic granulomas. However, the production of IL-6 and IL-10 did not differ significantly between the two types of granulomas.
Our findings suggest that solid/non-necrotic granulomas contain more MDSCs compared to necrotic granulomas. The solid/non-necrotic granulomas in pulmonary TB patients and the nonhuman primates and rabbit models of Mtb infections are hypoxic in nature [29,30]. Accordingly, our observations support the hypothesis that the hypoxic environment in the solid/non-necrotic granulomas induces the proliferation of MDSCs at these sites, and HIF-1α, a highly effective regulator of the immunometabolism in this environment, plays a significant role in promoting MDSC proliferation. Recently, it was reported that both the M-MDSCs and PMN-MDSCs expand systemically in mice primed with Mtb as part of complete a Freund’s adjuvant (CFA) [12,31]. CFA is constituted of paraffin oil that is emulsified with heat-killed Mtb. It has been used as a non-specific immunostimulant in animal studies, for example, to provide insight on the mode of action of designed vaccines. The role of MDSCs in TB progression is further confirmed by the abundance of MDSCs in mouse strains that are vulnerable to progressive disease, including the NOS2−/−, C3HeB/FeJ, 129S2 strains, for which the highest levels were observed in immunodeficient (RAG2−/−) animals, when compared to TB resistant mice that are devoid of solid/non-necrotic granulomas [32]. Furthermore, the frequency of MDSCs circulating in the blood of TB patients correlates with the disease severity [13,33,34,35]. While M-MDSCs constitute the significant subset of circulating MDSCs, accounting for 4% to 10% of the peripheral blood mononuclear cell (PBMC) fraction, the PMN-MDSC frequency can account for up to 30% of the total PBMCs of TB patients [13,20]. In addition, the PMN-MDSC were enriched in the bronchoalveolar lavage (BAL) of pulmonary TB patients, and elevated M-MDSC levels were observed in the pleural effusions [13,20]. However, both the abundance of MDSC and their functional/metabolic roles in various lung TB granulomas are poorly understood. Thus, our study supports and elaborates on previous reports on the distribution of MDSCs and contributes to the topological understanding of these cells in the lung granulomas of TB patients.
The mechanism underpinning the recruitment and activation of MDSCs in human lung TB granulomas is also poorly understood. Myeloid cells producing S100A8/A9 proteins are dominant within TB granulomas and are associated with the exacerbation of inflammation, as observed in the tumor environment [36,37]. The S100A8/A9 is a damage-associated molecular pattern (DAMP) family of proteins produced by myeloid cells, including MDSCs [36]. Thus, our findings suggest that the inflammatory niche, established by host cell necrosis during pulmonary Mtb infection, is associated with the upregulation of S100A8/A9 in MDSCs in the granulomas.
L-arginine is a commonly found substrate in enzymes, produced by ARG1 and NOS2. Therefore, the concurrent overexpression of these enzymes through MDSCs depletes L-arginine levels, required to express the T cell receptor ζ chain. This impedes T cell proliferation, preventing CD4+ T cells from expressing proinflammatory IFN-γ and inducing an efficient level of intracellular pathogen killing in macrophages [38,39]. ARG1 expression correlates with the abundance of MDSCs in solid/non-necrotic granulomas in a murine model of an Mtb infection [22,32]. Similarly, NO produced by increased NOS2 activity leads to the inhibition of STAT5 phosphorylation in T cells, resulting in the expansion of CD4+ Tregs [40]. Furthermore, MDSCs suppress lymphocyte proliferation through the production of NO for both in vitro and aerosol Mtb infections [32]. BCG studies further indicate that the NO release and suppressor function depend on TLR/caveolin-1 signals [41]. However, studies that correlate ARG1 or NOS2 expression with MDSC the mediated suppression of immune response in TB patients have not been conclusive. Our findings in this study suggest that the inflammatory niche prevailing in the lung TB granulomas is associated with the immunosuppressive effects of increased ARG1 and NOS2 expression.

5. Conclusions

In summary, in this study, we applied immunohistostaining with combinations of antibodies and a sequential probing/reprobing method on lung sections from TB patients to analyze the distribution and the functional state of MDSCs in solid/non-necrotic granulomas compared with necrotic granulomas. Our data support and extend earlier reports on various in vitro and animal model studies of TB pathogenesis. Some of the limitations of our study include the classification the granulomas as (i). solid/non-necrotic (only inflammatory cells and no necrosis) and (ii). necrotic (both inflammatory cell and necrosis) for the analysis, based primarily on the morphological structure. However, heterogeneous granuloma types exist in the lungs of TB patients, and the maturation of each granuloma occurs as a continuous process and is distinctly regulated within the infected host. Therefore, the evolution of cellular granulomas into a necrotic and cavitary lesion or to a fibrotic and non-progressive lesion can impact the outcome of Mtb infection as an active TB or LTBI [42]. Thus, our findings on the solid/non-necrotic granulomas do not conclusively indicate that these lesions progress toward a necrotic lesion. Secondly, immune cells, other than MDSCs, present in the granulomas can affect the expression of the immune marker, including cytokine and effector molecules. Thus, our findings may be limited by the contribution of other host cells in the granulomas. This is a pilot study conducted on an array of lung biopsy sections from TB patients. Our study demonstrates the phenotypic and functional changes in specific host immune cells using a multiplex imaging analysis of non-necrotic and necrotic granulomas in pulmonary TB patients. Future studies on the characterization of other immune cells and their activation status are needed to understand the evolution of granulomas in pulmonary TB.

Supplementary Materials

The following items are available online at https://www.mdpi.com/article/10.3390/jor1040023/s1, Table S1: Clinical characteristics of patients and control subjects; Figure S1: Representative images of H&E stained lung sections of patients with lung TB; Figure S2: Proportion of various host immune cells expressing cell surface and effector molecules in the individual samples of control and solid or necrotic granulomas.

Author Contributions

Conceptualization, S.S.; methodology, R.K.; formal analysis, S.S. and R.K.; writing—original draft preparation, R.K.; writing—review and editing, R.K. and S.S.; supervision, S.S.; project administration, S.S. All authors have read and agreed to the published version of the manuscript.

Funding

This research received no external funding.

Institutional Review Board Statement

The study was conducted according to the guidelines of the Declaration of Helsinki and approved by the Institutional Review Board (or Ethics Committee) of Rutgers University (protocol code Pro2021001092 approved on 30 July 2021).

Informed Consent Statement

Informed consent was obtained from all subjects involved in the study.

Conflicts of Interest

The authors declare no conflict of interest.

References

  1. WHO. Global Tuberculosis Report 2020; WHO: Geneva, Switzerland, 2020.
  2. Cohen, S.B.; Gern, B.H.; Delahaye, J.L.; Adams, K.N.; Plumlee, C.R.; Winkler, J.K.; Sherman, D.R.; Gerner, M.Y.; Urdahl, K.B. Alveolar Macrophages Provide an Early Mycobacterium tuberculosis Niche and Initiate Dissemination. Cell Host Microbe 2018, 24, 439–446.e4. [Google Scholar] [CrossRef] [PubMed] [Green Version]
  3. Russell, D.G.; Cardona, P.J.; Kim, M.J.; Allain, S.; Altare, F. Foamy macrophages and the progression of the human tuberculosis granuloma. Nat. Immunol. 2009, 10, 943–948. [Google Scholar] [CrossRef] [Green Version]
  4. Egen, J.G.; Rothfuchs, A.G.; Feng, C.G.; Horwitz, M.A.; Sher, A.; Germain, R.N. Intravital imaging reveals limited antigen presentation and T cell effector function in mycobacterial granulomas. Immunity 2011, 34, 807–819. [Google Scholar] [CrossRef] [PubMed] [Green Version]
  5. Kumar, R.; Singh, P.; Kolloli, A.; Shi, L.; Bushkin, Y.; Tyagi, S.; Subbian, S. Immunometabolism of Phagocytes During Mycobacterium tuberculosis Infection. Front. Mol. Biosci. 2019, 6, 105. [Google Scholar] [CrossRef] [Green Version]
  6. Singh, P.S.; Kolloli, A.K.; Subbian, S. Animal models of tuberculosis. In Understanding the Host Immune Response against Mycobacterium Tuberculosis Infection; Venketaraman, V., Ed.; Springer Nature A.G.: Cham, Switzerland, 2020; Chapter 4; pp. 67–97. [Google Scholar]
  7. Eum, S.Y.; Kong, J.H.; Hong, M.S.; Lee, Y.J.; Kim, J.H.; Hwang, S.H.; Cho, S.N.; Via, L.E.; Barry, C.E., 3rd. Neutrophils are the predominant infected phagocytic cells in the airways of patients with active pulmonary TB. Chest 2010, 137, 122–128. [Google Scholar] [CrossRef] [Green Version]
  8. Kolloli, A.K.; Singh, P.S.; Subbian, S. Granulomatous response to Mycobacterium tuberculosis infection. In Understanding the Host Immune Response against Mycobacterium Tuberculosis Infection; Venketaraman, V., Ed.; Springer Nature A.G.: Cham, Switzerland, 2020; Chapter 3; pp. 41–66. [Google Scholar]
  9. North, R.J.; Jung, Y.J. Immunity to tuberculosis. Annu. Rev. Immunol. 2004, 22, 599–623. [Google Scholar] [CrossRef]
  10. Mattila, J.T.; Ojo, O.O.; Kepka-Lenhart, D.; Marino, S.; Kim, J.H.; Eum, S.Y.; Via, L.E.; Barry, C.E., 3rd; Klein, E.; Kirschner, D.E.; et al. Microenvironments in tuberculous granulomas are delineated by distinct populations of macrophage subsets and expression of nitric oxide synthase and arginase isoforms. J. Immunol. 2013, 191, 773–784. [Google Scholar] [CrossRef] [Green Version]
  11. Gengenbacher, M.; Kaufmann, S.H. Mycobacterium tuberculosis: Success through dormancy. FEMS Microbiol. Rev. 2012, 36, 514–532. [Google Scholar] [CrossRef] [Green Version]
  12. Magcwebeba, T.; Dorhoi, A.; du Plessis, N. The Emerging Role of Myeloid-Derived Suppressor Cells in Tuberculosis. Front. Immunol. 2019, 10, 917. [Google Scholar] [CrossRef]
  13. du Plessis, N.; Loebenberg, L.; Kriel, M.; von Groote-Bidlingmaier, F.; Ribechini, E.; Loxton, A.G.; van Helden, P.D.; Lutz, M.B.; Walzl, G. Increased frequency of myeloid-derived suppressor cells during active tuberculosis and after recent mycobacterium tuberculosis infection suppresses T-cell function. Am. J. Respir. Crit. Care Med. 2013, 188, 724–732. [Google Scholar] [CrossRef] [PubMed]
  14. Nagaraj, S.; Gabrilovich, D.I. Regulation of suppressive function of myeloid-derived suppressor cells by CD4+ T cells. Semin. Cancer Biol. 2012, 22, 282–288. [Google Scholar] [CrossRef] [Green Version]
  15. Kotze, L.A.; Young, C.; Leukes, V.N.; John, V.; Fang, Z.; Walzl, G.; Lutz, M.B.; du Plessis, N. Mycobacterium tuberculosis and myeloid-derived suppressor cells: Insights into caveolin rich lipid rafts. EBioMedicine 2020, 53, 102670. [Google Scholar] [CrossRef] [PubMed]
  16. Raj, A.; van den Bogaard, P.; Rifkin, S.A.; van Oudenaarden, A.; Tyagi, S. Imaging individual mRNA molecules using multiple singly labeled probes. Nat. Methods 2008, 5, 877–879. [Google Scholar] [CrossRef] [Green Version]
  17. Gabrilovich, D.I.; Bronte, V.; Chen, S.H.; Colombo, M.P.; Ochoa, A.; Ostrand-Rosenberg, S.; Schreiber, H. The terminology issue for myeloid-derived suppressor cells. Cancer Res. 2007, 67, 425. [Google Scholar] [CrossRef] [PubMed] [Green Version]
  18. Movahedi, K.; Guilliams, M.; Van den Bossche, J.; Van den Bergh, R.; Gysemans, C.; Beschin, A.; De Baetselier, P.; Van Ginderachter, J.A. Identification of discrete tumor-induced myeloid-derived suppressor cell subpopulations with distinct T cell-suppressive activity. Blood 2008, 111, 4233–4244. [Google Scholar] [CrossRef]
  19. Ohsawa, K.; Imai, Y.; Sasaki, Y.; Kohsaka, S. Microglia/macrophage-specific protein Iba1 binds to fimbrin and enhances its actin-bundling activity. J. Neurochem. 2004, 88, 844–856. [Google Scholar] [CrossRef]
  20. El Daker, S.; Sacchi, A.; Tempestilli, M.; Carducci, C.; Goletti, D.; Vanini, V.; Colizzi, V.; Lauria, F.N.; Martini, F.; Martino, A. Granulocytic myeloid derived suppressor cells expansion during active pulmonary tuberculosis is associated with high nitric oxide plasma level. PLoS ONE 2015, 10, e0123772. [Google Scholar] [CrossRef]
  21. Ribechini, E.; Eckert, I.; Beilhack, A.; Du Plessis, N.; Walzl, G.; Schleicher, U.; Ritter, U.; Lutz, M.B. Heat-killed Mycobacterium tuberculosis prime-boost vaccination induces myeloid-derived suppressor cells with spleen dendritic cell-killing capability. JCI Insight 2019, 5, e128664. [Google Scholar] [CrossRef] [Green Version]
  22. Domingo-Gonzalez, R.; Das, S.; Griffiths, K.L.; Ahmed, M.; Bambouskova, M.; Gopal, R.; Gondi, S.; Munoz-Torrico, M.; Salazar-Lezama, M.A.; Cruz-Lagunas, A.; et al. Interleukin-17 limits hypoxia-inducible factor 1alpha and development of hypoxic granulomas during tuberculosis. JCI Insight 2017, 2, e92973. [Google Scholar] [CrossRef] [Green Version]
  23. Semenza, G.L. HIF-1, mediator of physiological and pathophysiological responses to hypoxia. J. Appl. Physiol. 2000, 88, 1474–1480. [Google Scholar] [CrossRef] [PubMed] [Green Version]
  24. Shalova, I.N.; Lim, J.Y.; Chittezhath, M.; Zinkernagel, A.S.; Beasley, F.; Hernandez-Jimenez, E.; Toledano, V.; Cubillos-Zapata, C.; Rapisarda, A.; Chen, J.; et al. Human monocytes undergo functional re-programming during sepsis mediated by hypoxia-inducible factor-1alpha. Immunity 2015, 42, 484–498. [Google Scholar] [CrossRef] [PubMed] [Green Version]
  25. Kumar, V.; Gabrilovich, D.I. Hypoxia-inducible factors in regulation of immune responses in tumour microenvironment. Immunology 2014, 143, 512–519. [Google Scholar] [CrossRef] [Green Version]
  26. Park, M.J.; Lee, S.H.; Kim, E.K.; Lee, E.J.; Baek, J.A.; Park, S.H.; Kwok, S.K.; Cho, M.L. Interleukin-10 produced by myeloid-derived suppressor cells is critical for the induction of Tregs and attenuation of rheumatoid inflammation in mice. Sci. Rep. 2018, 8, 3753. [Google Scholar] [CrossRef] [PubMed]
  27. Liu, C.H.; Liu, H.; Ge, B. Innate immunity in tuberculosis: Host defense vs. pathogen evasion. Cell Mol. Immunol. 2017, 14, 963–975. [Google Scholar] [CrossRef] [PubMed]
  28. Brighenti, S.; Ordway, D.J. Regulation of Immunity to Tuberculosis. Microbiol. Spectr. 2016, 4. [Google Scholar] [CrossRef] [PubMed]
  29. Belton, M.; Brilha, S.; Manavaki, R.; Mauri, F.; Nijran, K.; Hong, Y.T.; Patel, N.H.; Dembek, M.; Tezera, L.; Green, J.; et al. Hypoxia and tissue destruction in pulmonary TB. Thorax 2016, 71, 1145–1153. [Google Scholar] [CrossRef] [Green Version]
  30. Via, L.E.; Lin, P.L.; Ray, S.M.; Carrillo, J.; Allen, S.S.; Eum, S.Y.; Taylor, K.; Klein, E.; Manjunatha, U.; Gonzales, J.; et al. Tuberculous granulomas are hypoxic in guinea pigs, rabbits, and nonhuman primates. Infect. Immun. 2008, 76, 2333–2340. [Google Scholar] [CrossRef] [PubMed] [Green Version]
  31. Coffman, R.L.; Sher, A.; Seder, R.A. Vaccine adjuvants: Putting innate immunity to work. Immunity 2010, 33, 492–503. [Google Scholar] [CrossRef] [Green Version]
  32. Obregon-Henao, A.; Henao-Tamayo, M.; Orme, I.M.; Ordway, D.J. Gr1(int)CD11b+ myeloid-derived suppressor cells in Mycobacterium tuberculosis infection. PLoS ONE 2013, 8, e80669. [Google Scholar] [CrossRef]
  33. Grassi, G.; Vanini, V.; De Santis, F.; Romagnoli, A.; Aiello, A.; Casetti, R.; Cimini, E.; Bordoni, V.; Notari, S.; Cuzzi, G.; et al. PMN-MDSC Frequency Discriminates Active Versus Latent Tuberculosis and Could Play a Role in Counteracting the Immune-Mediated Lung Damage in Active Disease. Front. Immunol. 2021, 12, 594376. [Google Scholar] [CrossRef]
  34. Jontvedt Jorgensen, M.; Jenum, S.; Tonby, K.; Mortensen, R.; Walzl, G.; Du Plessis, N.; Dyrhol-Riise, A.M. Monocytic myeloid-derived suppressor cells reflect tuberculosis severity and are influenced by cyclooxygenase-2 inhibitors. J. Leukoc. Biol. 2021, 110, 177–186. [Google Scholar] [CrossRef]
  35. Davids, M.; Pooran, A.; Smith, L.; Tomasicchio, M.; Dheda, K. The Frequency and Effect of Granulocytic Myeloid-Derived Suppressor Cells on Mycobacterial Survival in Patients with Tuberculosis: A Preliminary Report. Front. Immunol. 2021, 12, 676679. [Google Scholar] [CrossRef]
  36. Dorhoi, A.; Kotze, L.A.; Berzofsky, J.A.; Sui, Y.; Gabrilovich, D.I.; Garg, A.; Hafner, R.; Khader, S.A.; Schaible, U.E.; Kaufmann, S.H.; et al. Therapies for tuberculosis and AIDS: Myeloid-derived suppressor cells in focus. J. Clin. Investig. 2020, 130, 2789–2799. [Google Scholar] [CrossRef]
  37. Gopal, R.; Monin, L.; Torres, D.; Slight, S.; Mehra, S.; McKenna, K.C.; Fallert Junecko, B.A.; Reinhart, T.A.; Kolls, J.; Baez-Saldana, R.; et al. S100A8/A9 proteins mediate neutrophilic inflammation and lung pathology during tuberculosis. Am. J. Respir. Crit. Care Med. 2013, 188, 1137–1146. [Google Scholar] [CrossRef] [Green Version]
  38. Rodriguez, P.C.; Ochoa, A.C.; Al-Khami, A.A. Arginine Metabolism in Myeloid Cells Shapes Innate and Adaptive Immunity. Front. Immunol. 2017, 8, 93. [Google Scholar] [CrossRef] [Green Version]
  39. Duque-Correa, M.A.; Kuhl, A.A.; Rodriguez, P.C.; Zedler, U.; Schommer-Leitner, S.; Rao, M.; Weiner, J., 3rd; Hurwitz, R.; Qualls, J.E.; Kosmiadi, G.A.; et al. Macrophage arginase-1 controls bacterial growth and pathology in hypoxic tuberculosis granulomas. Proc. Natl. Acad. Sci. USA 2014, 111, e4024–e4032. [Google Scholar] [CrossRef] [Green Version]
  40. Niedbala, W.; Cai, B.; Liew, F.Y. Role of nitric oxide in the regulation of T cell functions. Ann. Rheum. Dis. 2006, 65 (Suppl. 3), iii37–iii40. [Google Scholar] [CrossRef] [Green Version]
  41. John, V.; Kotze, L.A.; Ribechini, E.; Walzl, G.; Du Plessis, N.; Lutz, M.B. Caveolin-1 Controls Vesicular TLR2 Expression, p38 Signaling and T Cell Suppression in BCG Infected Murine Monocytic Myeloid-Derived Suppressor Cells. Front. Immunol. 2019, 10, 2826. [Google Scholar] [CrossRef] [Green Version]
  42. Subbian, S.; Tsenova, L.; Kim, M.J.; Wainwright, H.C.; Visser, A.; Bandyopadhyay, N.; Bader, J.S.; Karakousis, P.C.; Murrmann, G.B.; Bekker, L.G.; et al. Lesion-Specific Immune Response in Granulomas of Patients with Pulmonary Tuberculosis: A Pilot Study. PLoS ONE 2015, 10, e0132249. [Google Scholar] [CrossRef] [Green Version]
Figure 1. Multiplex immunostaining and imaging of human granulomas with MDSCs markers. (A) Representative images showing the of expression of MDSC markers CD11b (green spots) and CD33 (red spots) as well as their co-localization (brown spots) in lung tissues corresponding to control, solid/solid/non-necrotic and necrotic granulomas. Host cell nucleus is stained blue with DAPI. Scale bar in “Merged” panel (50 microns) is common for all the images. (B) Proportion of cells positive for CD11b relative to the total number of cells in the field in control, solid/solid/non-necrotic granulomas and necrotic granulomas. (C) Proportion of cells positive for CD33 in control, solid/solid/non-necrotic granulomas and necrotic granulomas. Data plotted in (B,C) are mean and standard error mean (SEM) of n = 3 (control); n = 5 (solid lesion) and n = 18 (necrotic lesion). Data were analyzed by One-way ANOVA with Tukey’s post-hoc correction for multiple group comparison; ** p < 0.01.
Jor 01 00023 g001
Figure 2. Distribution of CD15, S100A8/A9, CD4 and IBA1 positive immune cells in human lung TB granulomas. (A) Representative images singleplex (CD15 and S100A8/A9; red spots) and multiplex (CD4; green spots and IBA1; red spots) immunostaining of control, solid/non-necrotic and necrotic granulomas. Host cell nucleus is stained blue with DAPI. Scale bar in S100A8/A9 panel (50 microns) is common for CD15 and S100A8/A9 images. Scale bar in the IBA1 panel (50 microns) is common for CD4 and IBA1 images. (B) Distribution of CD15 positive cells (including MDSCs) relative to the total number of cells in the field in control, solid/non-necrotic granulomas and necrotic granulomas. (C) Distribution of S100A8/A9 positive cells (mainly neutrophils) relative to the total number of cells in the field in control, solid/non-necrotic granulomas and necrotic granulomas. (D) Distribution of CD4 positive T-cells relative to the total number of cells in the field in control, solid/non-necrotic granulomas and necrotic granulomas. (E) Distribution of IBA1 positive cells (activated macrophages) relative to the total number of cells in the field in control, solid/non-necrotic granulomas and necrotic granulomas. Data plotted in (BE) are mean and standard error mean (SEM) of n = 3 (control); n = 5 (solid lesion) and n = 18 (necrotic lesion). Data were analyzed by One-way ANOVA with Tukey’s post-hoc correction for multiple group comparison; * p < 0.05; ** p < 0.01; *** p < 0.005.
Jor 01 00023 g002
Figure 3. Expression pattern of NOS2 and ARG1 and HIF-1α in human granulomas. (A) Representative images singleplex immunostaining of control, solid/non-necrotic and necrotic granulomas showing the expression pattern of inducible nitric oxide (NOS2; green spots), arginase (ARG1; red spots) and hypoxia-inducible factor-1alpha (HIF-1α; fuchsia red spots). Host cell nucleus is stained blue with DAPI. Scale bar in ARG1 panel is 50 microns. Scale bar in HIF-1α panel (50 microns) is shared for NOS2 and HIF-1α images. (B) Distribution of NOS2 positive cells relative to the total number of cells in the field in control, solid/non-necrotic granulomas and necrotic granulomas. (C) Distribution of ARG1 positive cells relative to the total number of cells in the field in control, solid/non-necrotic granulomas and necrotic granulomas. (D) Distribution of HIF-1α positive cells relative to the total number of cells in the field in control, solid/non-necrotic granulomas and necrotic granulomas. Data plotted in (BE) are mean and standard error mean (SEM) of n = 3 (control); n = 5 (solid lesion) and n = 18 (necrotic lesion). Data were analyzed by One-way ANOVA with Tukey’s post-hoc correction for a multiple group comparison; * p < 0.05; *** p < 0.005.
Jor 01 00023 g003
Figure 4. Multiplex immunostaining and imaging of IL-6 and IL-10 expressing cells in human granulomas. (A) Graphical representation of the expression of IL-6 (green spots) and IL-10 (red spots) as well as their co-localization (brown spots) in lung tissues corresponding to control, solid/non-necrotic and necrotic granulomas determined by immunofluorescence. Host cell nucleus is stained blue with DAPI. Scale bar (50 microns) is common for all the images. (B) Cells positive for IL-6 relative to the total number of cells in the field in control, solid/non-necrotic granulomas and necrotic granulomas. (C) Cells positive for IL-10 relative to the total number of cells in the field in the control and solid/non-necrotic granulomas and necrotic granulomas. Data plotted in (B,C) are mean and standard error mean (SEM) of n = 3 (control); n = 5 (solid lesion) and n = 18 (necrotic lesion). Data were analyzed by One-way ANOVA with Tukey’s post-hoc correction for a multiple group comparison; ** p < 0.01.
Jor 01 00023 g004
Publisher’s Note: MDPI stays neutral with regard to jurisdictional claims in published maps and institutional affiliations.

