
An Operationally Relevant Framework for Mapping Spot Fire Transmission Potential †


Abstract
:1. Introduction
2. Materials and Methods
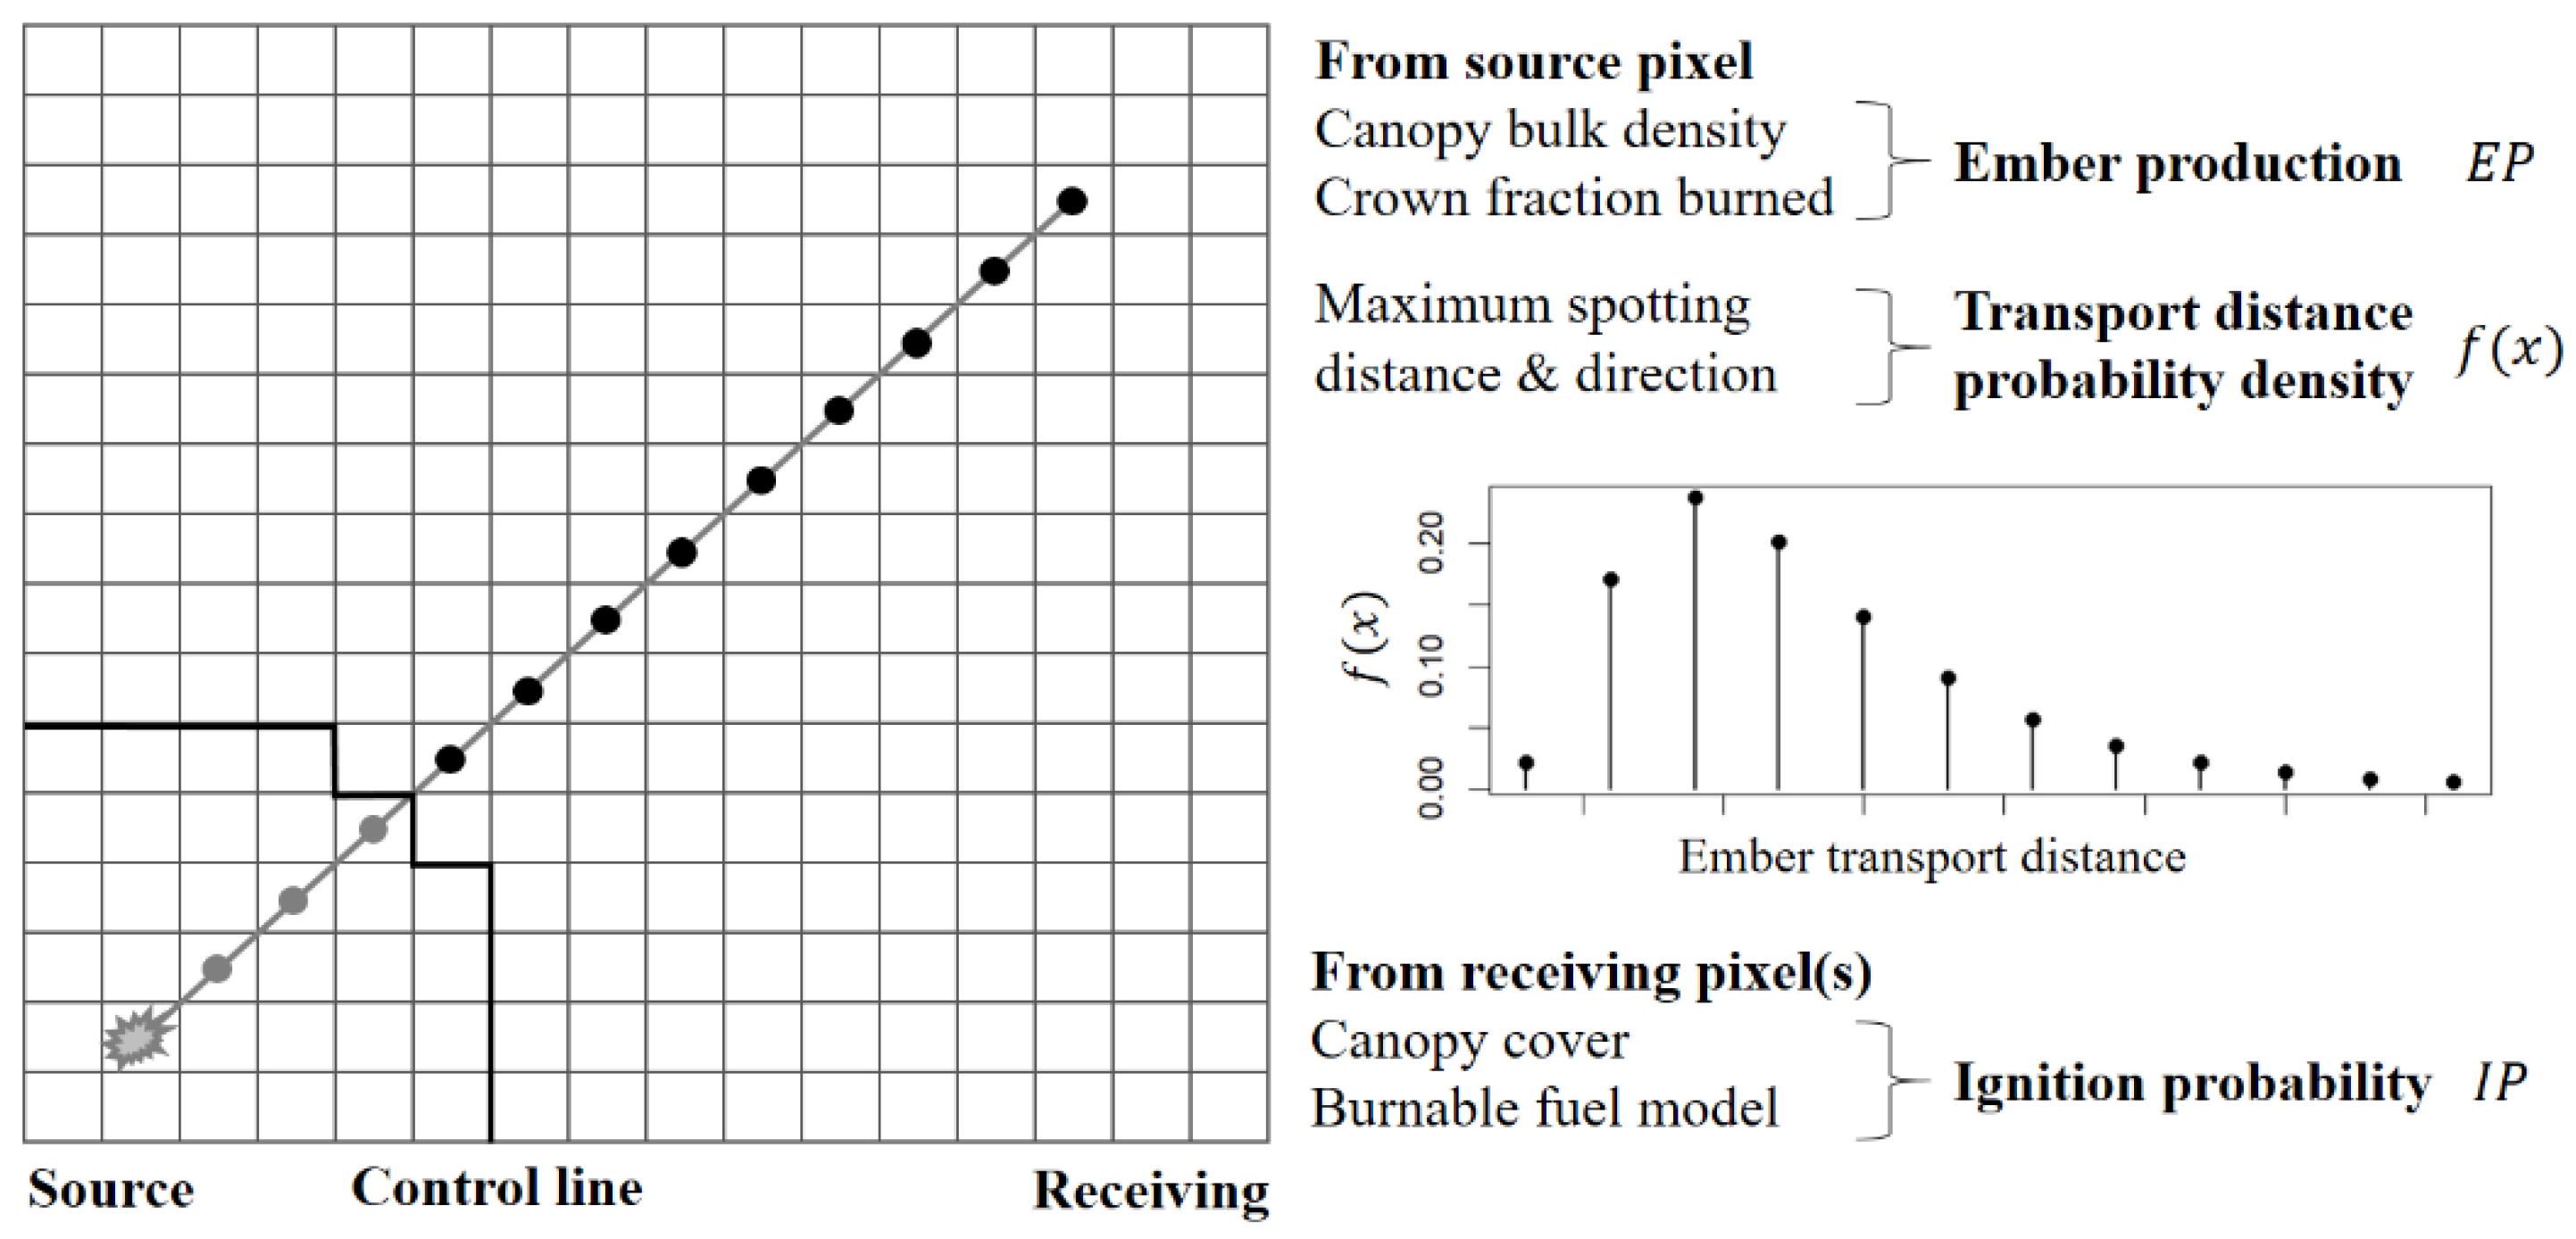
2.1. Spotting Potential Framework
2.2. Test Cases
3. Results
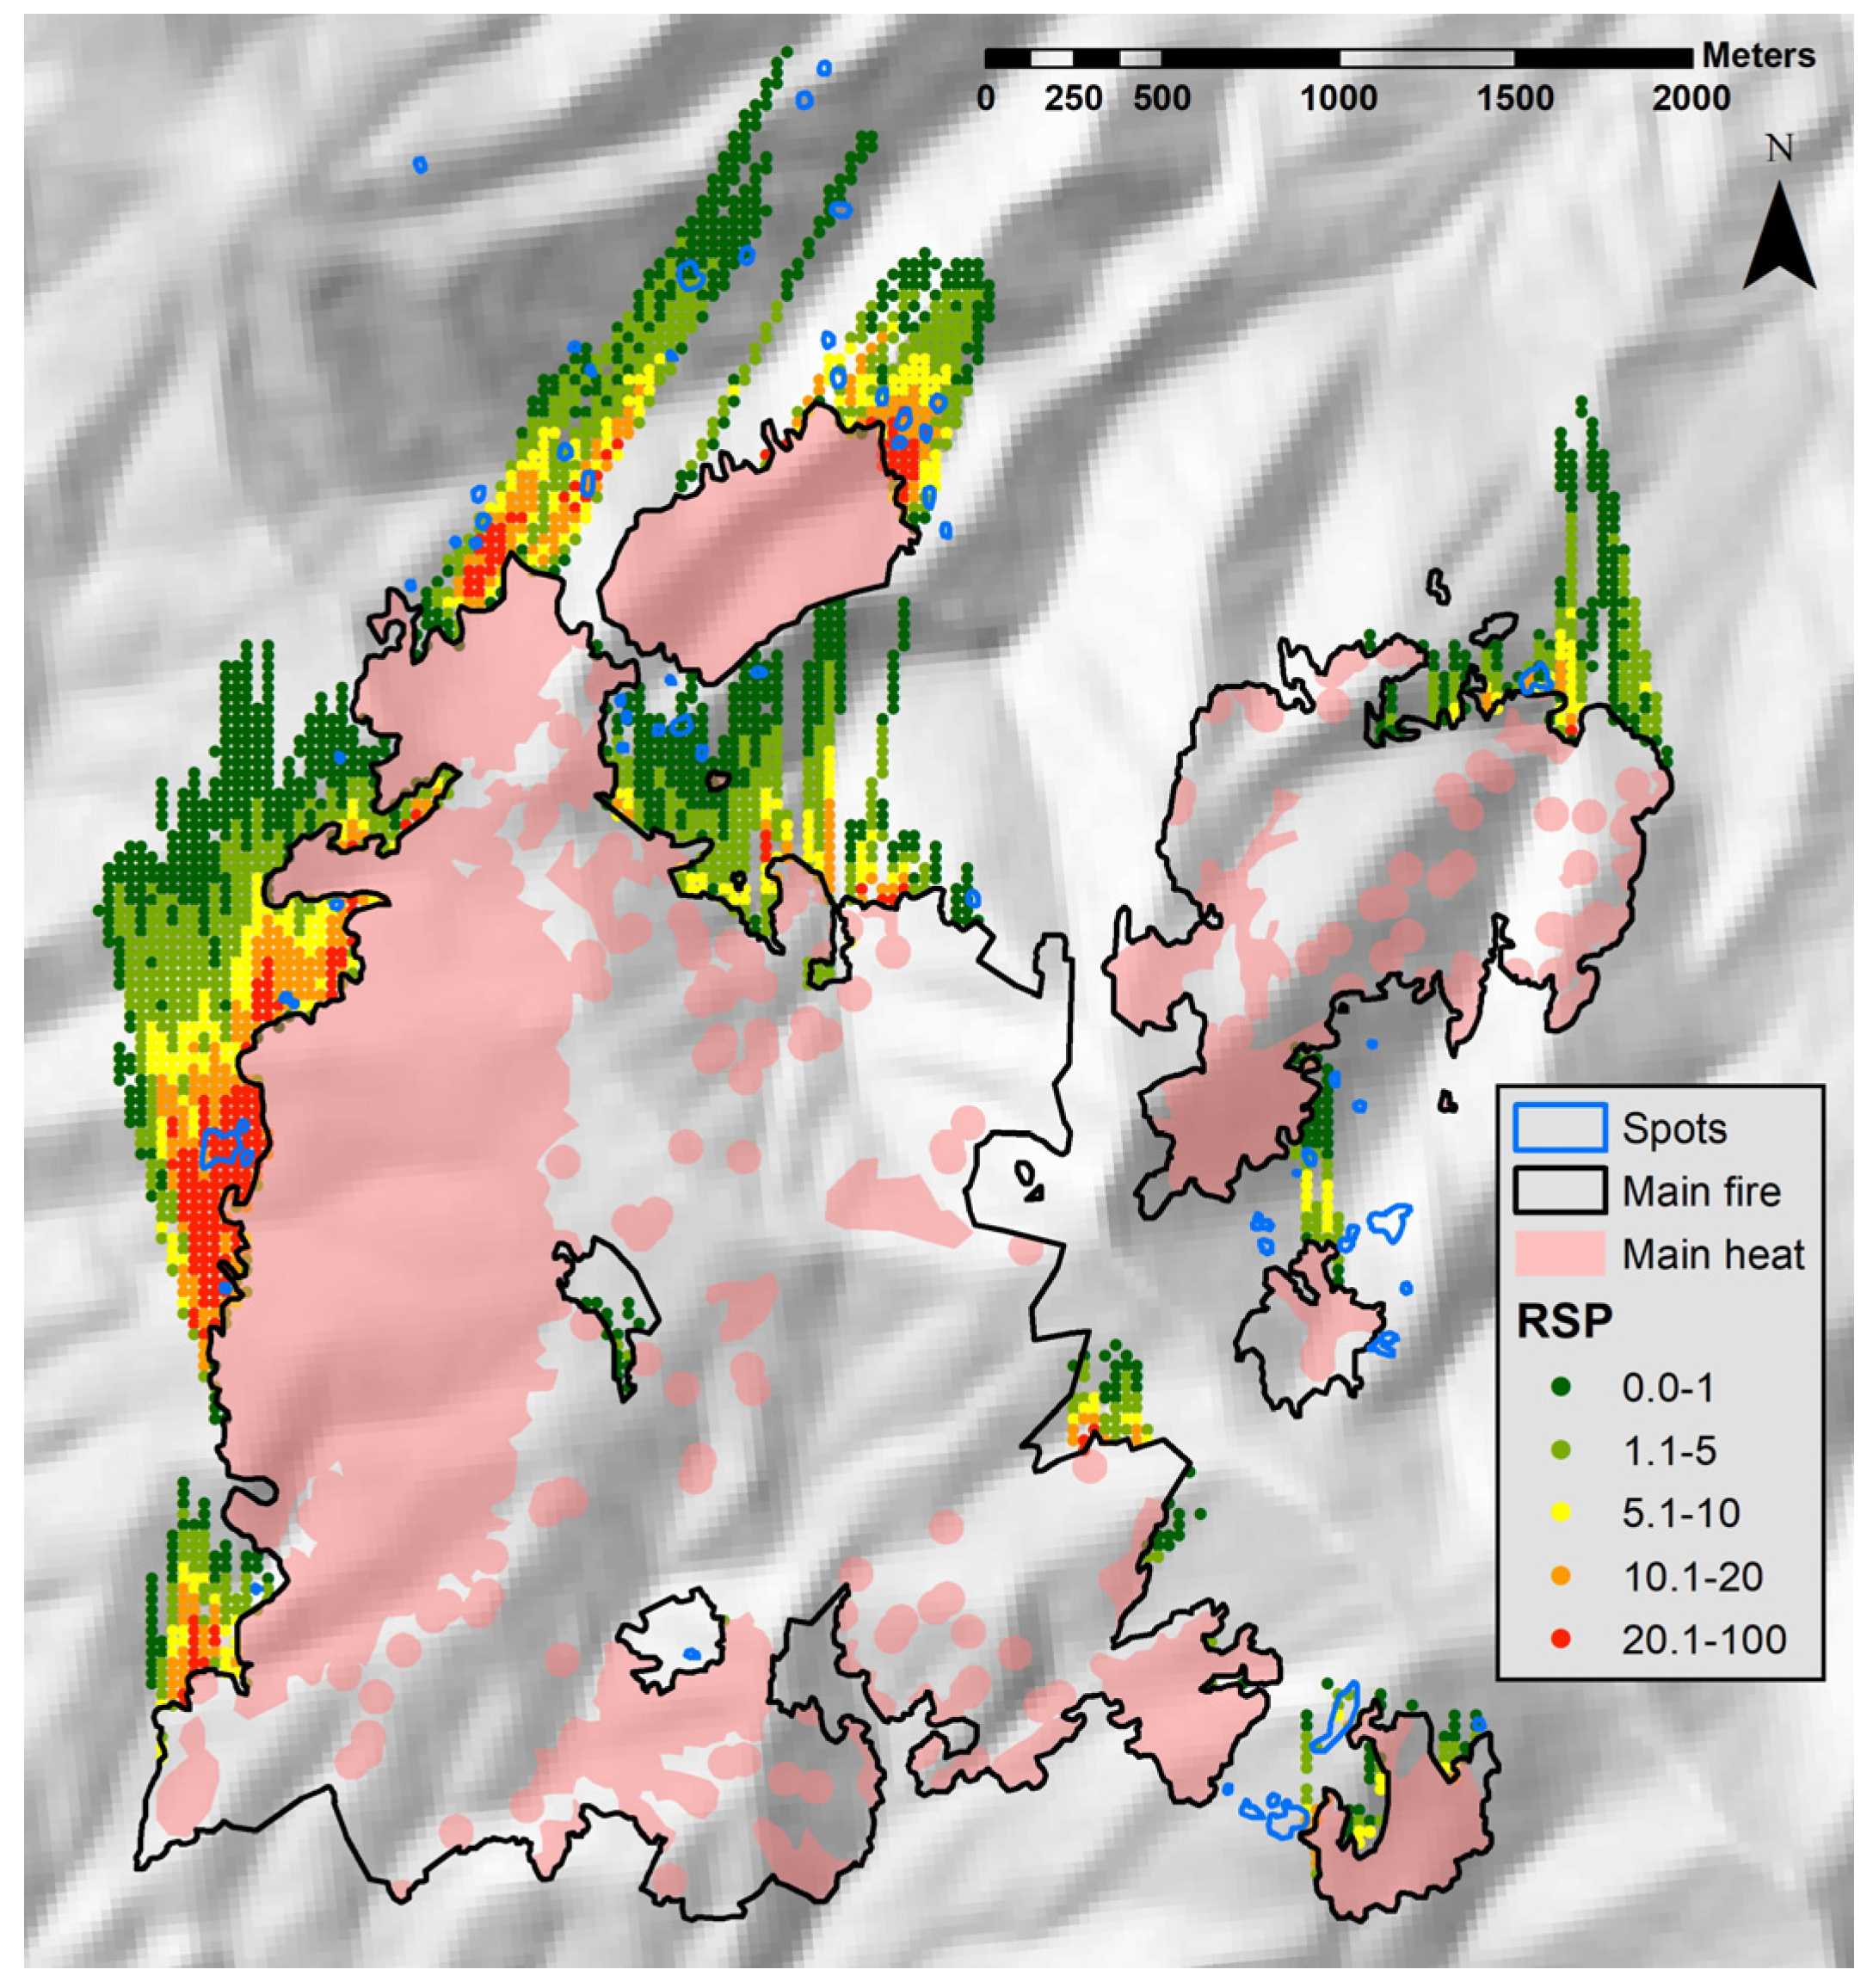
3.1. Decker Fire
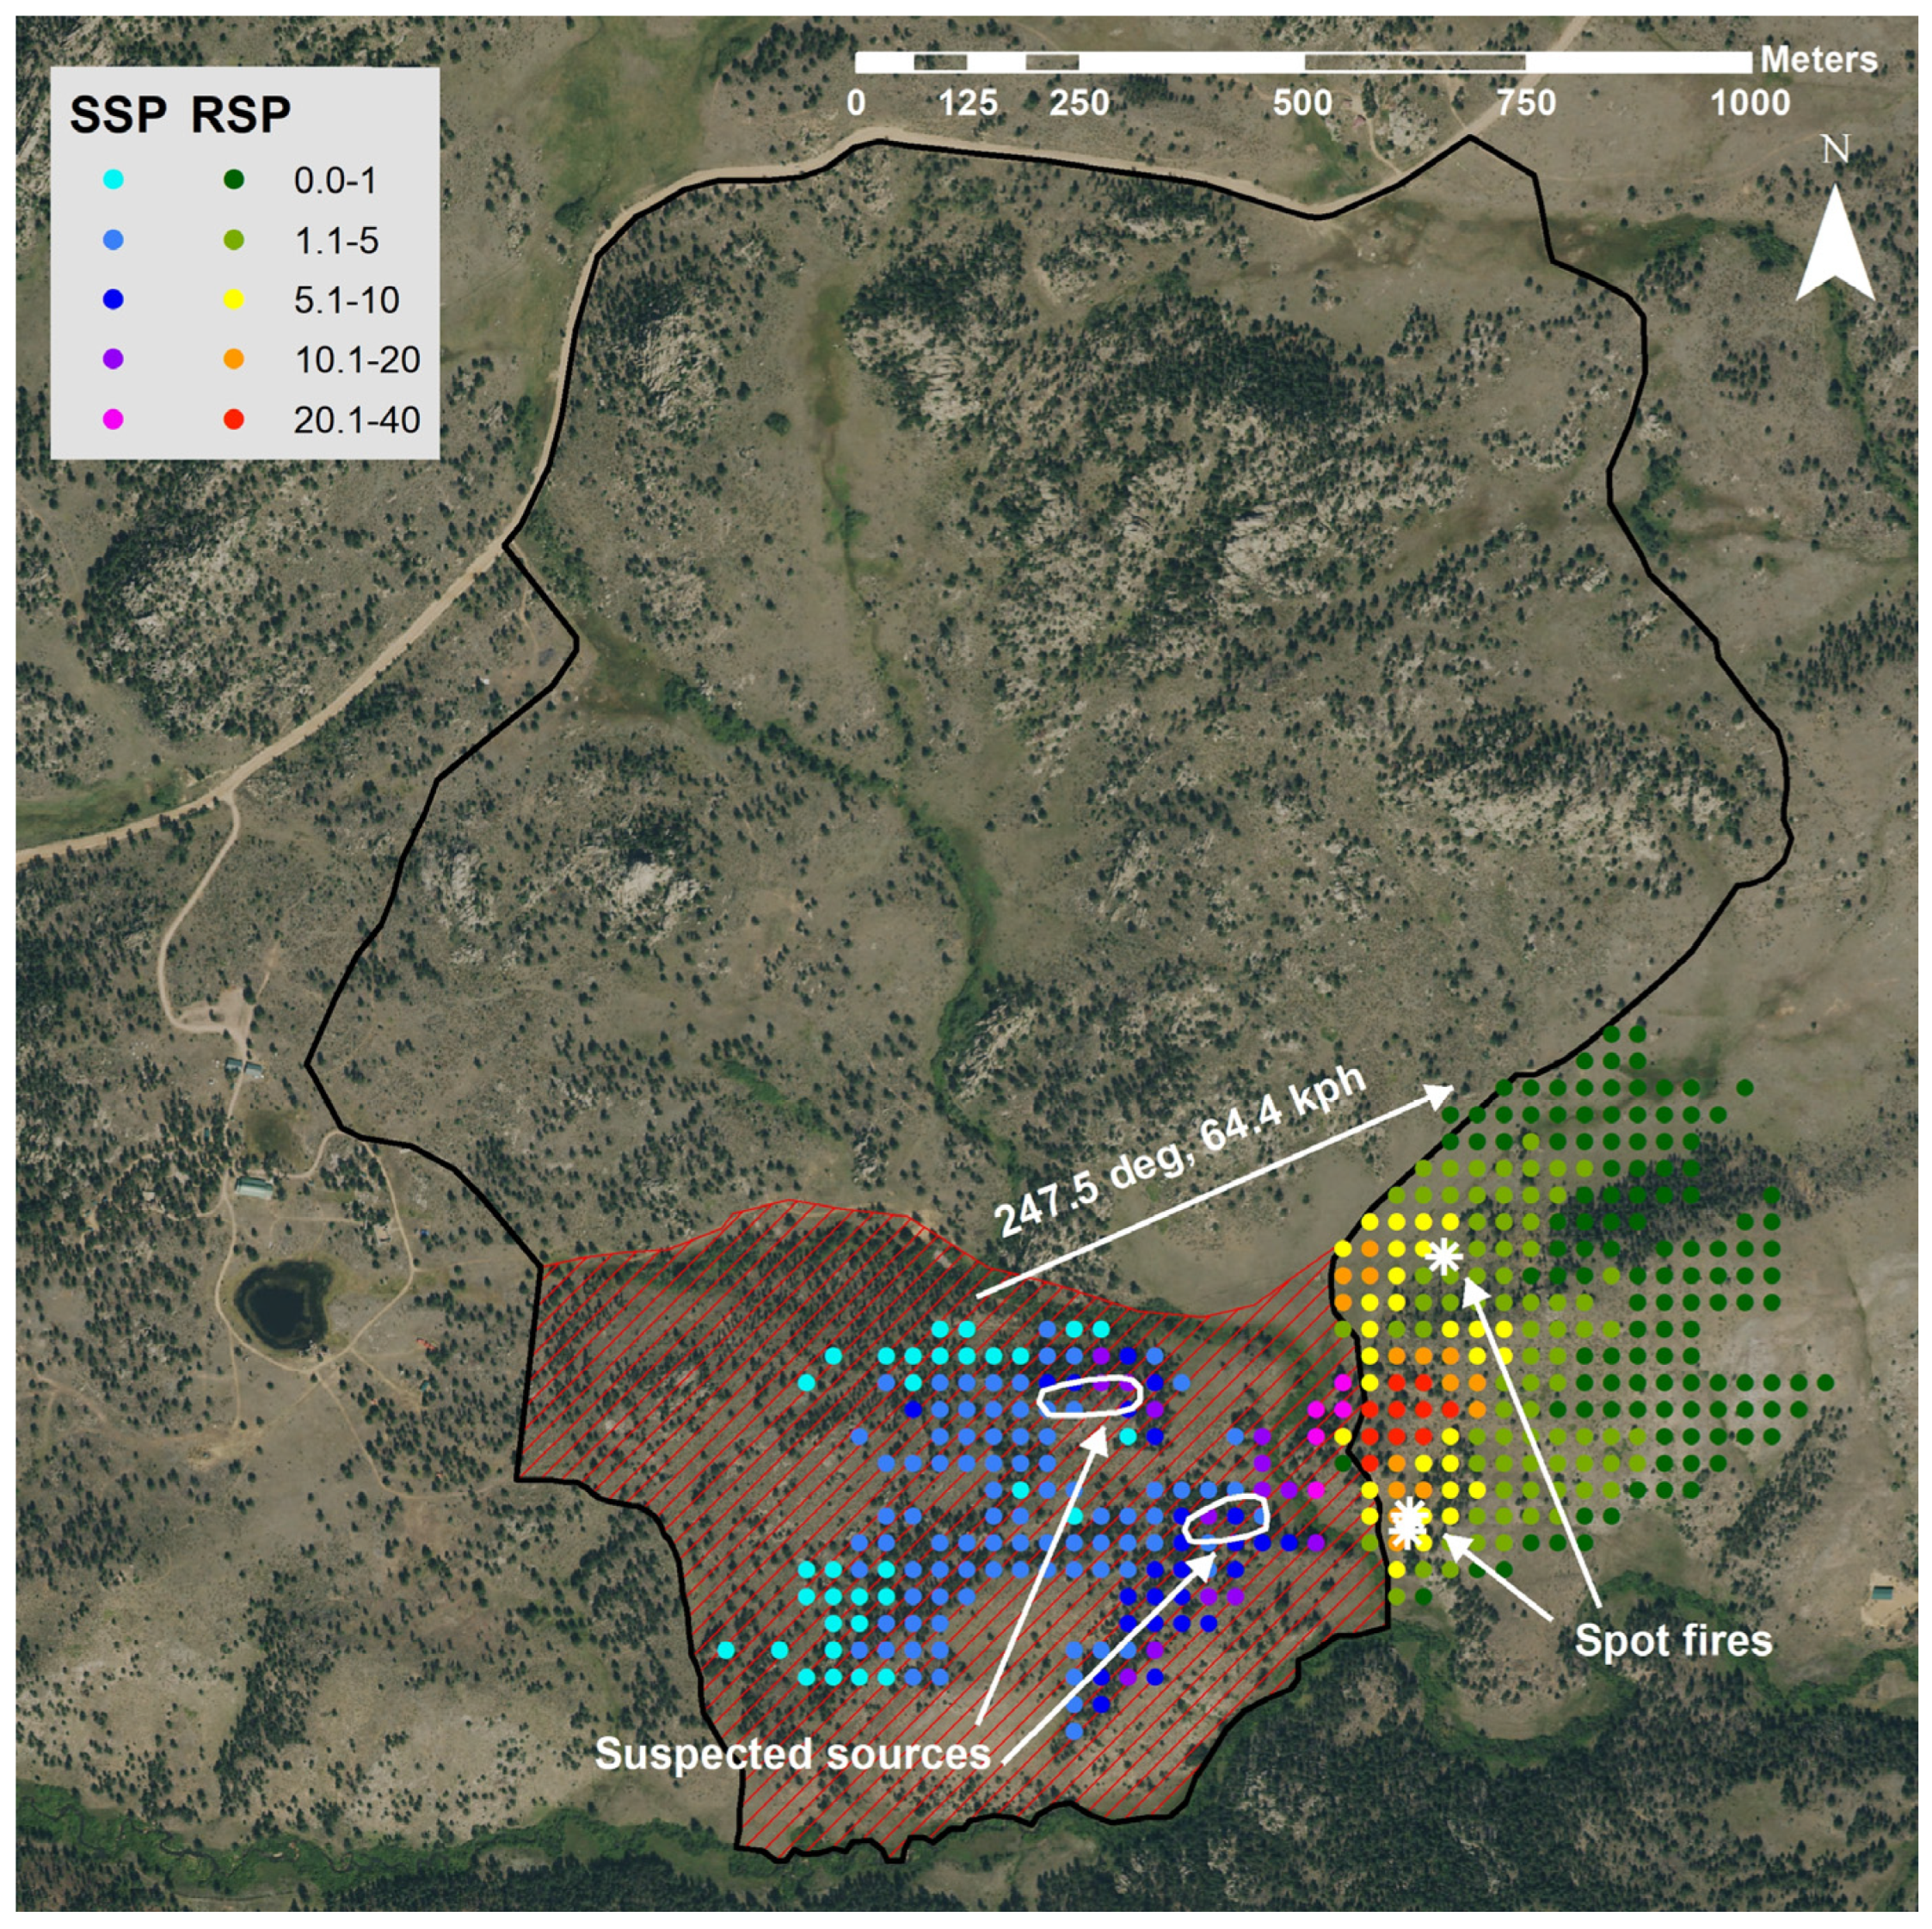
3.2. Elk Fire
4. Discussion
5. Conclusions
Author Contributions
Funding
Acknowledgments
Conflicts of Interest
References
- Green, L.R. Fuelbreaks and Other Fuel Modification for Wildland Fire Control; Agriculture Handbook No. 499; USDA Forest Service: Washington, DC, USA, 1977. [Google Scholar]
- Wilson, A.A.G. Width of firebreak that is necessary to stop grass fires: Some field experiments. Can. J. Fro. Res. 1988, 18, 682–687. [Google Scholar] [CrossRef]
- Agee, J.K.; Bahro, B.; Finney, M.A.; Omi, P.N.; Sapsis, D.B.; Skinner, C.N.; van Wagtendonk, J.W.; Weatherspoon, C.P. The use of shaded fuelbreaks in landscape fire management. For. Ecol. Manag. 2000, 127, 55–66. [Google Scholar] [CrossRef]
- Koo, E.; Pagni, P.J.; Weise, D.R.; Woycheese, J.P. Firebrands and spotting ignition in large-scale fires. Int. J. Wildland Fire 2010, 19, 818–843. [Google Scholar] [CrossRef]
- Storey, M.A.; Price, O.F.; Sharples, J.J.; Bradstock, R.A. Drivers of long-distance spotting during wildfires in south-eastern Australia. Int. J. Wildland Fire 2020, 29, 459–472. [Google Scholar] [CrossRef]
- Albini, F.A. Spot Fire Distance from Burning Trees—A Predictive Model; General Technical Report INT-29; USDA Forest Service, Intermountain Forest and Range Experiment Station: Ogden, UT, USA, 1979. [Google Scholar]
- Finney, M.A. FARSITE: Fire Area Simulator—Model Development and Evaluation; Research Paper RMRS-RP-4; USDA Forest Service, Rocky Mountain Research Station: Fort Collins, CO, USA, 2004. [Google Scholar]
- Finney, M.A.; Grenfell, I.C.; McHugh, C.W.; Seli, R.C.; Trethewey, D.; Stratton, R.D.; Brittain, S. A method for ensemble wildland fire simulation. Environ. Model. Assess. 2011, 16, 153–167. [Google Scholar] [CrossRef]
- Quintilio, D.; Anderson, A.W. Simulation Study of Initial Attack Fire Operations in the Whitecourt Forest, Alberta; Information Report NOR-X-166; Environment Canada, Canadian Forest Service, Northern Forest Research Centre: Edmonton, AB, Canada, 1976. [Google Scholar]
- Mees, R.; Strauss, D.; Chase, R. Modeling wildland fire containment with uncertain flame length and fireline width. Int. J. Wildland Fire 1993, 3, 179–185. [Google Scholar] [CrossRef]
- Mees, R.; Strauss, D. Allocating resources to large wildland fires: A model with stochastic production rates. For. Sci. 1992, 38, 842–853. [Google Scholar]
- O’Connor, C.D.; Calkin, D.E.; Thompson, M.P.T. An empirical machine learning method for predicting potential fire control locations for pre-fire planning and operational fire management. Int. J. Wildland Fire 2017, 26, 587–597. [Google Scholar] [CrossRef]
- Rodrigues, M.; Alcasena, F.; Gelabert, P.; Vega-García, C. Geospatial modeling of containment probability for escaped wildfires in a Mediterranean Region. Risk Anal. 2020, 40, 1762–1779. [Google Scholar] [CrossRef]
- Haas, J.R.; Calkin, D.E.; Thompson, M.P.T. Wildfire risk transmission in the Colorado Front Range, USA. Risk Anal. 2015, 35, 226–240. [Google Scholar] [CrossRef]
- Ager, A.A.; Palaiologou, P.; Evers, C.R.; Day, M.A.; Barros, A.M.G. Assessing transboundary wildfire exposure in the southwestern United States. Risk Anal. 2018, 38, 2105–2127. [Google Scholar] [CrossRef] [PubMed]
- Finney, M.A.; Brittain, S.; Seli, R.C.; McHugh, C.W.; Gangi, L. FlamMap: Fire Mapping and Analysis System, Version 6.0; USDA Forest Service, Rocky Mountain Research Station: Missoula, MT, USA, 2019. [Google Scholar]
- LANDFIRE. Fuel, Topography, and Existing Vegetation Type Layers, Version 2.0; USDOI Geological Survey: Washington, DC, USA, 2019. Available online: http://landfire.cr.usgs.gov/viewer/ (accessed on 23 August 2019).
- Scott, J.H.; Reinhardt, E.D. Assessing Crown Fire Potential by Linking Models of Surface and Crown Fire Behavior; General Technical Research Paper RMRS-RP-29; USDA Forest Service, Rocky Mountain Research Station: Fort Collins, CO, USA, 2001. [Google Scholar]
- Cruz, M.G.; Alexander, M.E.; Wakimoto, R.H. Assessing canopy fuel stratum characteristics in crown fire prone fuel types of western North America. Int. J. Wildland Fire 2003, 12, 39–50. [Google Scholar] [CrossRef]
- Sardoy, N.; Consalvi, J.L.; Kaiss, A.; Fernandez-Pello, A.C.; Porterie, B. Numerical study of ground-level distribution of firebrands generated by line fires. Combust. Flame 2008, 154, 478–488. [Google Scholar] [CrossRef]
- Wang, H.-H. Analysis on downwind distribution of firebrands sourced from a wildland fire. Fire Technol. 2011, 47, 321–340. [Google Scholar] [CrossRef]
- Martin, J.; Hillen, T. The spotting distribution of wildfires. Appl. Sci. 2016, 6, 177. [Google Scholar] [CrossRef]
- Thurston, W.; Kepert, J.D.; Tory, K.J.; Fawcett, R.J.B. The contribution of turbulent plume dynamics to long-range spotting. Int. J. Wildland Fire 2017, 26, 317–330. [Google Scholar] [CrossRef]
- Schroeder, M.J. Ignition Probability; Office Report 2106-1; USDA Forest Service, Rocky Mountain Forest and Range Experiment Station: Fort Collins, CO, USA, 1969. [Google Scholar]
- National Wildfire Coordinating Group (NWCG). Probability of Ignition. Available online: https://www.nwcg.gov/publications/pms437/fuel-moisture/probability-of-ignition (accessed on 25 October 2020).
- R Core Team. R: A language and Environment for Statistical Computing, Version 3.5.3; R Foundation for Statistical Computing: Vienna, Austria, 2019; Available online: http://www.R-project.org/ (accessed on 27 August 2019).
- Hijmans, R.J. Raster: Geographic Data Analysis and Modeling, R Package Version 2.8-19. 2019. Available online: https://CRAN.R-project.org/package=raster (accessed on 27 August 2019).
- Bivand, R.; Keitt, T.; Rowlingson, B. Rgdal: Bindings for the ‘Geospatial’ Data Abstraction Library, R package Version 1.4-3. 2019. Available online: https://CRAN.R-project.org/package=rgdal (accessed on 27 August 2019).
- Bivand, R.; Rundel, C. Rgeos: Interface to Geometry Engine—Open Source (‘GEOS’), R Package Version 0.4-2. 2018. Available online: https://CRAN.R-project.org/package=rgeos (accessed on 27 August 2019).
- Wickham, H. The split-apply-combine strategy for data analysis. J. Stat. Softw. 2011, 40, 1–29. [Google Scholar] [CrossRef]
- National Interagency Fire Center (NIFC). Fire Perimeter Records; National Interagency Fire Center: Boise, ID, USA, 2019. Available online: www.nifc.gov (accessed on 1 September 2020).
- National Wildfire Coordinating Group (NWCG). Incident Status Summary Report for the Decker Fire; National Wildfire Coordinating Group: Washington, DC, USA, 2019. Available online: https://fam.nwcg.gov/fam-web/ (accessed on 1 September 2020).
- Colorado Division of Fire Prevention and Control (CDFPC). Elkhorn Creek Unit #4 Prescribed Fire Review; Colorado Division of Fire Prevention and Control: Lakewood, CO, USA, 2020. Available online: https://www.colorado.gov/pacific/dfpc/elkhorn-creek-unit-4-prescribed-fire-review (accessed on 31 March 2020).
- Albini, F.A.; Alexander, M.E.; Cruz, M.G. A mathematical model for predicting the maximum poptential spotting distance from a crown fire. Int. J. Wildland Fire 2012, 21, 609–627. [Google Scholar] [CrossRef]
- Ellis, P.F.M. Fuelbed ignition potential and bark morphology explain the notoriety of the eucalypt messmate ‘stringybark’ for intense spotting. Int. J. Wildland Fire 2011, 20, 897–907. [Google Scholar] [CrossRef]
- Page, W.G.; Alexander, M.E.; Jenkins, M.J. Wildfire’s resistance to control in mountain pine beetle-attacked lodgepole pine forests. For. Chron. 2013, 89, 783–794. [Google Scholar] [CrossRef]
- Moriarty, K.; Cheng, A.S.; Homan, C.M.; Cottrell, S.P.; Alexander, M.E. Firefighter observations of “surprising” fire behavior in mountain pine beetle-attacked lodgepole pine forests. Fire 2019, 2, 34. [Google Scholar] [CrossRef]
- Bahrani, B.; Zhuo, A. Firebrands generated from selected vegetative fuels. Fire Prot. Eng. 2020, Q2, 34–40. [Google Scholar]


| Fire Scenario | Fire Size (ha) | Wind Speed (kph @ 6 m) | Wind dir. (deg) | Temp (deg C) | 1-h F.M. (%) | 10-h F.M. (%) | 100-h F.M. (%) | Herb. F.M. (%) | Woody F.M. (%) |
|---|---|---|---|---|---|---|---|---|---|
| Decker | 885 | 72.4 | 180 | 18.3 | 2 | 4 | 8 | 30 | 65 |
| Elk—observed | 50 | 64.4 | 248 | 21.1 | 2 | 3 | 7 | 30 | 60 |
| Elk—low | 200 | 16.1 | 225 | 4.4 | 13 | 15 | 17 | 60 | 90 |
| Elk—preferred | 200 | 29.0 | 225 | 21.1 | 7 | 9 | 12 | 40 | 70 |
| Elk—high | 200 | 38.6 | 225 | 29.4 | 4 | 6 | 8 | 30 | 60 |
Publisher’s Note: MDPI stays neutral with regard to jurisdictional claims in published maps and institutional affiliations. |
© 2020 by the authors. Licensee MDPI, Basel, Switzerland. This article is an open access article distributed under the terms and conditions of the Creative Commons Attribution (CC BY) license (https://creativecommons.org/licenses/by/4.0/).
Share and Cite
Gannon, B.M.; Thompson, M.P.; Wei, Y. An Operationally Relevant Framework for Mapping Spot Fire Transmission Potential. Environ. Sci. Proc. 2021, 3, 13. https://doi.org/10.3390/IECF2020-08001
Gannon BM, Thompson MP, Wei Y. An Operationally Relevant Framework for Mapping Spot Fire Transmission Potential. Environmental Sciences Proceedings. 2021; 3(1):13. https://doi.org/10.3390/IECF2020-08001
Chicago/Turabian StyleGannon, Benjamin M., Matthew P. Thompson, and Yu Wei. 2021. "An Operationally Relevant Framework for Mapping Spot Fire Transmission Potential" Environmental Sciences Proceedings 3, no. 1: 13. https://doi.org/10.3390/IECF2020-08001
APA StyleGannon, B. M., Thompson, M. P., & Wei, Y. (2021). An Operationally Relevant Framework for Mapping Spot Fire Transmission Potential. Environmental Sciences Proceedings, 3(1), 13. https://doi.org/10.3390/IECF2020-08001