Abstract
Public transportation has been an essential part of the urban lifestyle and a necessary means for effective transportation within most of the capital cities worldwide. That is why there is a great need for further monitoring and evaluation of the health impacts in Public Transportation (PT) due to air quality. Specifically, in this work the Athens metro was monitored throughout different hours of the day and studied in order to evaluate the average particulate matter (PM) exposure for a passenger. A strong emphasis was given in calculating the inhalation dose of PM2.5 over time. By considering the ventilation rate of a passenger an estimation of the total PM2.5 inhalation dose for males and females as well as for different age groups was made.
1. Introduction
Air pollution throughout the world has grown to be a great concern regarding its effects on health and quality of life for people. Each country has an increased concern over some specific air pollutants depending on their climate and industrial profile, but Particulate Matter (PM) is a pollutant of interest for every country, especially in Asia.
Particulate Matter emissions are directly connected with industrial activity and vehicles; thus, PM is mostly prominent in urban areas [1,2]. Due to the increase in industrial activity and the tendency of urbanization in developing countries, PM exposure has been on the rise and many major urban cities are affected by the effects of PM. There have been numerous studies that suggest that the chemical composition of PM is directly connected to the source that produces it and depends on the chemical composition, presenting varying effects on health. Some studies have found that the PM may contain toxic substances like arsenic (As) and even heavy metals such as cadmium (Cd) and lead (Pb) [3], while in another study that took place in a suburban area found that PM may contain barium (Ba), strontium (Sr), and zinc (Zn) [4], and in a study within an industrial area it was even found to contain copper (Cu) and mercury (Hg) [5]. In the case of microenvironments of public transportation a study that took place in the subway of Barcelona suggested that PM2.5 had a variety of different species of iron (Fe), like hematite (α-Fe2O3) and magnetite (Fe3-O4), that are directly connected to the breaks of wagons, the friction of wheels of the subway, and the electrical supply system [6]. All of the above may pose health risks to the passengers of the subway and buses but, most importantly, the drivers and the workers that are exposed to such pollutants on a daily basis for multiple hours each day.
In this study, a presentation of the total exposure to PM2.5 within the Athens subway system is developed and analyzed in depth.
2. Materials and Methods
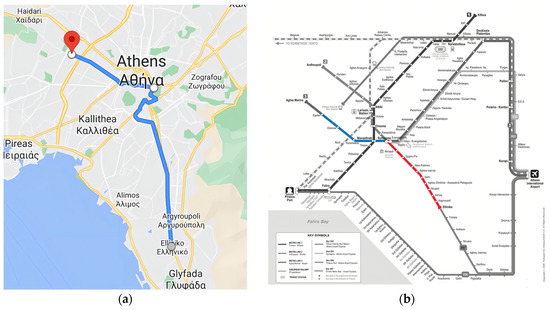
The monitoring took place on a route from the suburban area of Elliniko, south-east of the center of Athens, to the metro station of Egaleo, an urban area west of the center of Athens. More specifically, two separate metro lines were monitored. The metro lines that were monitored were the red metro (Elliniko station to Anthoupoli station) starting from Elliniko to Syntagma station (10 stations-stops) and the blue metro line (Airport station to Agia Marina station) starting from Syntagma station to Egaleo (4 station stops). At Syntagma station, a metro line change was required. Both Syntagma’s and Elliniko’s metro platforms were monitored as well, with a minimum recording time of 5 min (Figure 1).

Figure 1.
Map showing location of starting point at Elliniko station (grey dot), Syntagma station (white dot), and Egaleo station (red marker) (a). A map of the Athenian Metro lines, showcasing each station individually (b).
The sensor used for the monitoring was the Purple Air SD-II [7], which was directly connected to a power bank, powering the sensor continuously. The sensor was mounted on top of a back-pack carried by a passenger and the monitoring took place while standing through the whole route. The Purple Air was set to record data every 10 s, storing the data on an SD card. This research followed the main principles of an adopted methodology of low-cost sensor measurements performedby the authors [8,9].
The monitoring of the route took place during April and May of 2022, during the working days of the week (Monday through Friday). The monitoring hours were set at three different time intervals covering different trends within the day for further comparison of the results. The three time intervals were separated in the early morning hours, late morning hours and afternoon hours. More specifically, the first time interval started from 6:00 in the morning to 9:00, the second time interval was set on the rush hours of 9:00 in the morning until 12:00, and finally the third time interval was set from 12:00 to 15:00. The total distance of the route is 16 km and, on average, it would take 31 min (around 42 min including the minimum 5 min of recording on the subway platforms).
Using the concentration of PM2.5 monitored from the Purple Air a calculation of the inhalation dose of PM2.5 was made using the following equation (Equation (1)), as suggested by Novak et al. [10].
where ID stands for the Inhalation Dose of the pollutant in μg/min, is the ventilation rate in m3/min, and C is the PM2.5 concentration in μg/m3. In this study, the ventilation rate was assumed as sedentary and at a passive activity level.
3. Results
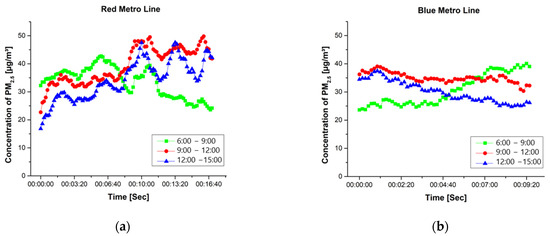
Figure 2 depicts PM2.5 concentrations for the three time intervals for both red and blue metro lines. In the first time interval, the concentration highlighted an increase at the first stops of the route. Concerning the red line, a peak concentration equal to 43 μg/m3 and an average of 34 μg/m3 were recorded. Similarly, concerning the blue metro line, the peak concentration was recorded as equal to 40 μg/m3 and the average as equal to 31 μg/m3. In the case of the second and the third time intervals, concentrations show a significant increase in the second half of the trip using the red metro line, with the second time interval presenting an average concentration equal to 39 μg/m3 and a peak value equal to 50 μg/m3 for the red metro line, and an average concentration equal to 35 μg/m3 and a peak value equal to 39 μg/m3 for the blue metro line. The third time interval presents an average value equal to 34 μg/m3 and a peak value equal to 48 μg/m3 for the red metro line, and an average value equal to 30 μg/m3 and a peak value equal to 37 μg/m3 for the blue metro line.

Figure 2.
Average PM2.5 concentrations for the three time intervals—red line (a). Average PM2.5 concentrations for the three time intervals—blue line (b).
Table 1 and Table 2 present the analysis of the inhaled dose of PM2.5 for different age groups (from 16 up to 61 years old) for males (Table 1) and females (Table 2). For the specific ID analysis, for the red metro line route, data from Elliniko station up to Syntagma station were used. For the blue metro line route, data from Syntagma station up to Egaleo station were used accordingly. In all cases, data concerning both platforms and wagons were applied.

Table 1.
Statistics of the ID (μg/min) for males of different age groups and different time intervals.

Table 2.
Statistics of the ID (μg/min) for females of different age groups and different time intervals.
As seen in Table 1 and Table 2 the age group of 21–31 for both males and females present the lowest ID. The age group of 51–61 years old shows the highest ID. Of the three time intervals, the second depicts the highest amount of ID, which was expected because the second time interval takes place during rush hour. The first and the third time intervals show insignificant differences for ID (±0.05 μg/min), with the first time interval having a slightly higher average ID. Here, it is important to note that during the second time interval. the number of passengers was notably higher than the corresponding number during the third time interval, leading to the conclusion that, in addition to passenger numbers, there is likely another “source” that has an important influence on PM2.5 concentrations inside the wagon. A possible factor might be that during rush hour and some hours after, where passengers within the metro station are still relatively high, an amount of PM2.5 is trapped in the metro station building, which might contribute to the increased concentration of the third time interval.
For males, the cumulative ID (total staying duration in the metro facilities: approximately 42 min) was consistently higher than 7 μg with the only exception being the age group of 21–31 during the first and third time intervals (Table 1). The highest ID was recorded for the age group of 51–61, which was equal to 9.6 μg during the second time interval. For females, the highest cumulative ID was equal to 7 μg in the age group of 51–61 during the second time interval. Overall, the female cumulative ID was significantly lower than that of the male equivalents. Finally, the highest observed value of maximum ID for males was equal to 0.32 μg/min, which is lower than the one reported in a similar study (0.55 μg/min) within a car [11].
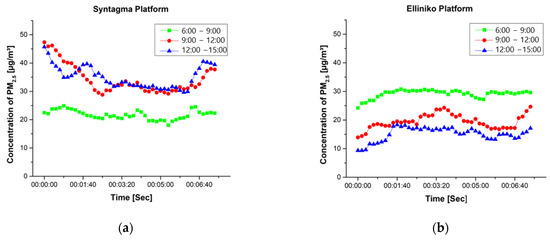
Figure 3 depicts the recorded PM2.5 concentrations (μg/m3) per 10 s, during the experimental campaign in the Syntagma station platform (Figure 3a) and Elliniko station platform (Figure 3b). Using the values of Figure 3 and taking into account the ventilation rate for men belonging to the group of 31–41 years old, equal to 5.57 × 10⁻³ m3/min [12] we conclude that the Elliniko station platform (Figure 3b) is the only case where the first time interval has the highest ID, with a maximum value equal to 0.17 μg/min and an average equal to 0.16 μg/min. In the Syntagma station platform (Figure 3a) for both the second and third time intervals, a similar ID was observed with an average value equal to 0.19 μg/min. The first time interval has the lowest ID, with an average value equal to 0.12 μg/min.

Figure 3.
Average PM2.5 concentrations for the three time intervals—Syntagma platform (a). Average PM2.5 concentrations for the three time intervals—Elliniko platform (b).
Overall, the highest PM2.5 exposure took place within the subway and specifically within the wagon of the red metro line, with the Syntagma station platform presenting a similar ID to the blue metro line’s wagon. The Elliniko station platform indicated a low ID, with the exception of the first time interval.
4. Conclusions
According to the global bibliography both on the concentration and inhaled dose of PM2.5, the highest concentration was observed within the metro platforms [13].
In this work, the highest concentration was recorded within the wagons, with significant increases during rush hour and after rush hour, on the central stations in proximity of Syntagma station. A tendency was observed during the early morning hours (first time interval) in which PM2.5 concentrations were higher in the suburban stations of the metro in comparison with the central stations. An unorthodox phenomenon was observed during the first time interval, where overall lower PM2.5 concentrations were recorded in comparison to the third time interval, despite the third time interval having significantly fewer passengers throughout the route. A possible reason for this is that early in the morning, the train is clean and empty, and suddenly fills up with people, while at the end of the day, thousands of passengers have already boarded.
In summary, the findings suggest that there should be a concern for vulnerable groups of people such as older individuals and other sensitive groups (people with asthma, respiratory and cardiovascular problems, etc.) that use the subway during rush hour.
Author Contributions
Conceptualization, D.-M.R., K.M. and G.S.; methodology, D.-M.R., K.M., and G.S.; formal analysis, D.-M.R. and K.M.; investigation, D.-M.R.; data curation, D.-M.R.; writing—original draft preparation, D.-M.R.; writing—review and editing, D.-M.R., K.M. and G.S.; supervision, K.M. and G.S. All authors have read and agreed to the published version of the manuscript.
Funding
This research received no external funding.
Institutional Review Board Statement
Not applicable.
Informed Consent Statement
Not applicable.
Data Availability Statement
Data availability in https://map.purpleair.com/ (accessed on 20 May 2022).
Conflicts of Interest
The authors declare no conflict of interest.
References
- Spyropoulos, G.C.; Nastos, P.T.; Moustris, K.P.; Chalvatzis, K.J. Transportation and Air Quality Perspectives and Projections in a Mediterranean Country, the Case of Greece. Land 2022, 11, 152. [Google Scholar] [CrossRef]
- Ntourou, K.; Moustris, K.; Spyropoulos, G.; Fameli, K.-M.; Manousakis, N. Adverse Health Effects (Bronchitis Cases) Due to Particulate Matter Exposure: A Twenty-Year Scenario Analysis for the Greater Athens Area (Greece) Using the AirQ+ Model. Atmosphere 2023, 14, 389. [Google Scholar] [CrossRef]
- Guo, L.C.; Lv, Z.; Ma, W.; Xiao, J.; Lin, H.; He, G.; Li, X.; Zeng, W.; Hu, J.; Zhou, Y.; et al. Contribution of heavy metals in PM2.5 to cardiovascular disease mortality risk, a case study in Guangzhou, China. Chemosphere 2022, 297, 134102. [Google Scholar] [CrossRef] [PubMed]
- Gao, Y.; Guo, X.; Li, C.; Ding, H.; Tang, L.; Ji, H. Characteristics of PM2.5 in Miyun, the northeastern suburb of Beijing: Chemical composition and evaluation of health risk. Environ. Sci. Pollut. Res. 2015, 22, 16688–16699. [Google Scholar] [CrossRef] [PubMed]
- Zheng, N.; Liu, J.; Wang, Q.; Liang, Z. Health risk assessment of heavy metal exposure to street dust in the zinc smelting district, Northeast of China. Sci. Total Environ. 2010, 408, 726–733. [Google Scholar] [CrossRef]
- Moreno, T.; Martins, V.; Querol, X.; Jones, T.; BéruBé, K.; Minguillón, M.C.; Amato, F.; Capdevila, M.; De Miguel, E.; Centelles, S.; et al. A new look at inhalable metalliferous airborne particles on rail subway platforms. Sci. Total Environ. 2015, 505, 367–375. [Google Scholar] [CrossRef] [PubMed]
- PurpleAir, Inc. PurpleAir, Sensors for Real Time Air Quality Monitoring. 2023. Available online: https://www.purpleair.com/ (accessed on 15 February 2023).
- Spyropoulos, G.; Nastos, P.; Moustris, K. Performance of Aether Low-Cost Sensor Device for Air Pollution Measurements in Urban Environments. Accuracy Evaluation Applying the Air Quality Index (AQI). Atmosphere 2021, 12, 1246. [Google Scholar] [CrossRef]
- Spyropoulos, G.; Nastos, P.; Moustris, K.; Katopodis, T.; Ntourou, K. The use of low-cost sensing for air pollution measurements in urban outdoor environments. In Proceedings of the 14th International Conference on Meteorology, Climatology and Atmospheric Physics (COMECAP), Alexandroupolis, Greece, 15–17 October 2018. [Google Scholar]
- Novak, R.; Kocman, D.; Robinson, J.A.; Kanduč, T.; Sarigiannis, D.; Horvat, M. Comparing Airborne Particulate Matter Intake Dose Assessment Models Using Low-Cost Portable Sensor Data. Sensors 2020, 20, 1406. [Google Scholar] [CrossRef] [PubMed]
- Collado, J.T.; Abalos, J.G.; De Los Reyes, I.; Cruz, M.T.; Leung, G.F.; Abenojar, K.; Manalo, C.R.; Go, B.; Chan, C.L.; Gonzales, C.K.G.; et al. Spatiotemporal Assessment of PM2.5 Exposure of a High-risk Occupational Group in a Southeast Asian Megacity. AQQR 2023, 23, 220134. [Google Scholar] [CrossRef]
- Bussard, D. Exposure Factors Handbook. 2011. Available online: https://cfpub.epa.gov/ncea/risk/recordisplay.cfm?deid=236252 (accessed on 1 September 2011).
- Barmparesos, N.; Assimakopoulos, V.D.; Niki Assimakopoulos, M.; Tsairidi, E. Particulate matter levels and comfort conditions in the trains and platforms of the Athens underground metro. AIMS Environ. Sci. 2016, 3, 199–219. [Google Scholar] [CrossRef]
Disclaimer/Publisher’s Note: The statements, opinions and data contained in all publications are solely those of the individual author(s) and contributor(s) and not of MDPI and/or the editor(s). MDPI and/or the editor(s) disclaim responsibility for any injury to people or property resulting from any ideas, methods, instructions or products referred to in the content. |
© 2023 by the authors. Licensee MDPI, Basel, Switzerland. This article is an open access article distributed under the terms and conditions of the Creative Commons Attribution (CC BY) license (https://creativecommons.org/licenses/by/4.0/).