Abstract
The aerosol species separation algorithm (ASSA) is a method designed to retrieve vertical concentration profiles of individual aerosol species by combining measurements from lidar systems and spectrophotometers. The ASSA operates as a forward model, simulating as the first step the attenuated backscatter and volume depolarization ratios at various wavelengths initially measured by lidar systems. Subsequently, it extends these simulations to reproduce radiance spectra obtained from co-located spectrophotometers by integrating a radiative transfer model. Currently, the ASSA relies on a lookup table (LUT) of intensive aerosol properties that correspond to mixtures generated from up to eight pure aerosol species as these are defined in the OPAC database. In this study we are focusing on the first step and investigating the performance of the algorithm when solely fitting nighttime data from the Thessaloniki lidar system are used. The algorithm identifies the ensemble of mixture/mass concentration combinations that best fit the elastic and Raman 4 primary species attenuated backscatter and depolarization ratio profiles.
1. Introduction
In this study, we expand the aerosol species separation algorithm (ASSA) to night-time Raman lidar measurement, using vertical profiles from the multiwavelength depolarization Raman system operated in Thessaloniki (THELISYS). Measurements were performed during the period 2021–2023 at the Laboratory of Atmospheric Physics of Thessaloniki urban station (LAP; 40.6° N, 22.9° W, 680 m a.s.l.) in order to check the ASSA’s performance and stability. LAP combines state-of-the-art active and passive remote sensing and in situ measurements [1]. In this scope, quality assured lidar measurements in cloud-free conditions were selected, aiming to reveal the vertical distribution of aerosol properties over Thessaloniki regarding different aerosol sources. The input of the ASSA includes the total elastic attenuated backscatter profiles at 355, 532, and 1064 nm, the Raman attenuated backscatter profiles at 387, 607 nm, and the calibrated corrected volume depolarization ratio at 532 nm. Our preliminary findings show very good quantitative and qualitative agreement among the measured and the simulated profiles and the result to concentration profiles per species.
2. Data and Methodology
2.1. Lidar Measurements from Thesslaoniki Lidar System (THELISYS)
A detailed view of the Laboratory of Atmospheric Physics (LAP) and the surrounding area of Thessaloniki is shown in Figure 1. Thessaloniki is a coastal metropolitan area, with urban aerosols affecting the lower layers and being present during both the summer and winter season [1]. The Thessaloniki station is equipped with a depolarization Raman-lidar system (THELISYS; LR321-D400, Raymetrics S.A., Athens, Greece), able to provide extensive aerosol properties, namely, three βaer (355, 532, 1064 nm) and two αaer (355, 532 nm) as well as aerosol intensive properties, namely, the backscatter and extinction related Ångström exponents (AEα-355/532, AEβ-355/532, AEβ-532/1064 nm), the lidar ratio (LR), and additionally the linear volume (δv532) and particle depolarization ratio (δp532). The necessary pre-prepossessing procedures for all signals had been performed using the in-house semi-automated universal lidar algorithm (SULA).
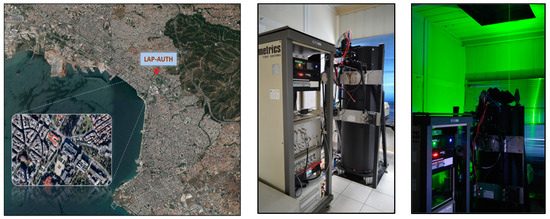
Figure 1.
The Thessaloniki lidar system (THELISYS) located in LAP.
2.2. Optical Properties of Aerosols and Clouds (OPAC)
The software package OPAC [2] consists of data sets of optical properties (extinction, scattering, and absorption coefficients, single-scattering albedo, asymmetry factor, and the phase function) of cloud and aerosol components in the solar and terrestrial spectral range or different humidity conditions. Moreover, derived optical parameters like mass extinction coefficients and Ångström exponents can be determined. In the case of aerosols, calculations are based on microphysical data (particle size distribution and spectral refractive index) under the assumption of spherical particles. Aerosols originate from different sources and processes, and thus a mixture of particles is often present in the atmosphere. The aerosol components may be externally mixed to form aerosol types (continental (clean, average, polluted), urban, desert, maritime (clean, polluted, tropical), Arctic, Antarctic, mineral transported, free troposphere, stratosphere). The application of more realistic shapes for mineral particles can improve the modeling of optical properties.
2.3. Aerosol Species Separation Algorithm (ASSA) Description
The aerosol species separation algorithm (ASSA) relies on a lookup table (LUT) of mixtures generated from pure aerosol species modeled by the OPAC database [2,3]. A large number of external mixtures can be produced for up to eight aerosol modes: water solubles, insolubles, soot, accumulation and coarse mode sea salt, nucleation, accumulation, and coarse mode mineral dust. Mineral dust species are modeled as spheroids [3] and depolarize the backscattered light accordingly. The other species are assumed to be spherical. A depolarization ratio value of 0.01 at 532 nm is used instead of 0 (perfect spheres) similar to [4] in order to obtain more realistic retrievals. Hygroscopic growth calculations are included in OPAC for 8 relative humidity classes (0–99%) for the water soluble and sea salt species. The algorithmic procedure is summarized in Figure 2. The flowchart demonstrates the input and output of the ASSA. The aerosol species separation algorithm (ASSA) operates in two steps. The algorithm first tries to reconstruct the lidar attenuated backscatter profiles by iterating over the LUT and over a number of predefined mass concentration levels per LUT entry (step 1). Reconstruction begins from the end of the profile (reference height) and proceeds downwards by forward-modeling the elastic lidar equation). The attenuated backscatter profiles are normalized by the corresponding value at reference height. Then, through a radiative transfer model (libRadtran, [5]), it simulates radiance spectra similar to the ones measured by passive remote sensing sensors (e.g., MAX-DOAS spectrometer). Finally, the mixture profiles with the best general agreement given the instrumental uncertainties are selected as the final solution. In this study we are focusing on the first step and investigating the performance of the algorithm when solely fitting nighttime lidar data. The fundamentals of the technique are given in [6].
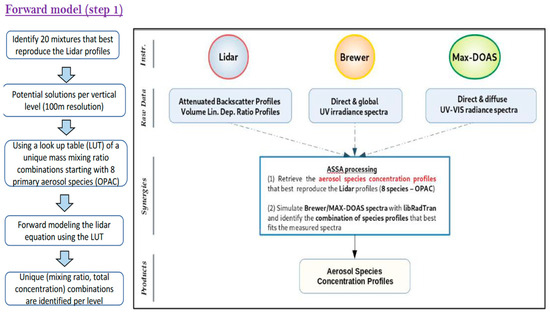
Figure 2.
This flowchart demonstrates the input and output of ASSA.
3. Results
Case Study on 30 June 2022
In the context of the study, we investigated and discussed a case study of aerosol mixed layers that were detected over Thessaloniki by lidar measurements on 30 June 2022. The color map in Figure 3a shows the time-height cross section of the 1064 nm range corrected signal (RCS) from 18:30 to 19:30 UTC. The figure clearly reveals a well-defined aerosol layer extending up to ∼4.5 km. The optical properties were determined through the application of the Raman [7] and Klett [8] lidar inversion techniques shown in Figure 4. The profiles of the particle depolarization ratio at 532 nm (δp), the lidar ratio at 355, 532 nm (LR), and backscatter angstrom coefficients (BAE) are also provided. The profile of the depolarization ratio is characterized by small values (<0.08 or 8%) throughout the vertical scene. These values point to the mixture of the continental type with the pollution through the detected layer. The LR are relatively similar for both wavelengths and they present low variability with the height (mean LR355: 60 ± 8 sr and LR532: 47 ± 11 sr). The BAE values are almost equal to one across the layer (mean BAE355/1064: 1.07 ± 0.12 and BAE355/532: 1.14 ± 0.11). These values are compatible with spherical particles from combustion processes, which underwent long-range transport from their sources to the Thessaloniki site.
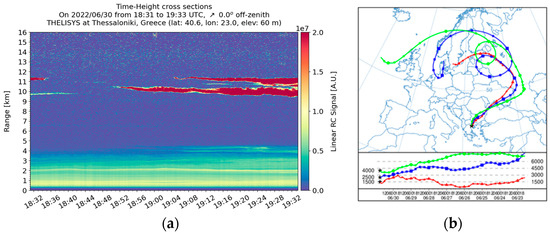
Figure 3.
(a) Temporal evolution of the range-corrected lidar signal (RCS) in arbitrary units (AU) obtained over Thessaloniki at 1064 nm, between 18:30 and 19:30 UTC on 30 June 2022. (b) The 7 d HYSPLIT backward trajectories ending at the position of Thessaloniki at 19:00 UTC.
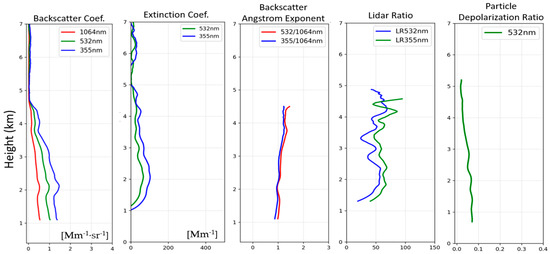
Figure 4.
Average lidar vertical profiles of the backscattering coefficients (355, 532, 1064 nm), the extinction coefficients (355 and 532), the particle linear depolarization ratio (532 nm), backscatter-Ångström coefficients (355/1064, 532/1064 nm) and lidar ratios (355, 532 nm).
The air mass backward trajectories of the NOAA hybrid single particle Lagrangian integrated trajectory (HYSPLIT) model [9] were also used to assess the air mass transport pathways and possible sources. Figure 3b depicts 7-day backward trajectories arriving over Thessaloniki at 19:00 UTC at altitudes of 1.5, 2.5 and 4 km. Simulations confirmed that the trajectories of the air masses originating from Northern and Eastern Europe reveal the possible presence of mixed continental and polluted aerosol components.
Figure 5 depicts the constructed attenuated backscatter and volume depolarization profiles of the ASSA that correspond to the potential solves of mixtures per vertical level that show the best agreement with the measured profiles. The ASSA volume concentration profiles, obtained by taking into account all the retrieved profiles with all possible variations, are shown in Figure 6. For our case, we ran the ASSA for 4 species using OPAC, indicating mixing among accumulation mode dust, soot, coarse mode sea salt, water soluble. The ASSA outputs reveal the presence of low concentrations in a range of 0.1–20 μgr/m3 within the vertical profile. The presence of these species can be related to the advection of anthropogenic pollutants coming from industrial activity in Europe mixed with the coastal particles. Generally, pollution particles are relatively small, spherical, and highly absorbing, so that they produce low depolarization and large lidar ratios. Given that Thessaloniki is a coastal city, it is also important to consider the influence of marine aerosols. These marine aerosols can interact with urban aerosols, further influencing the overall aerosol load and composition in the lower layers of the atmosphere. The total particle backscatter coefficient is illustrated in Figure 7, as the output of the ASSA procedures in contrast to retrieved optical products by the Thessaloniki operational processing algorithm (SULA).
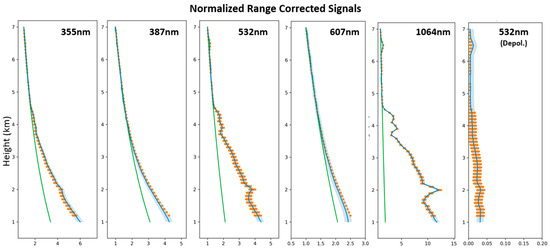
Figure 5.
Measured (blue) and fitted (orange) attenuated backscatter and depolarization values. The respective molecular attenuated backscatter profiles are also included in green.
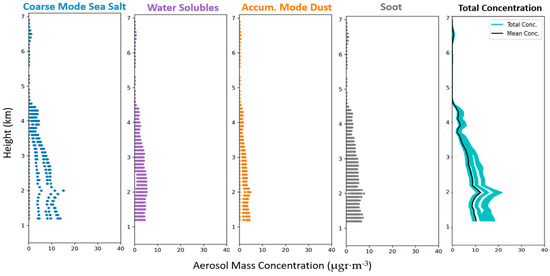
Figure 6.
Ensemble potential mass concentration solutions per aerosol species and per vertical level for 4 aerosol species (coarse sea salt, water soluble, acc. dust, soot). The total concentration is also provided. The potential solutions within error bars that best reproduced the measured profiles are displayed.
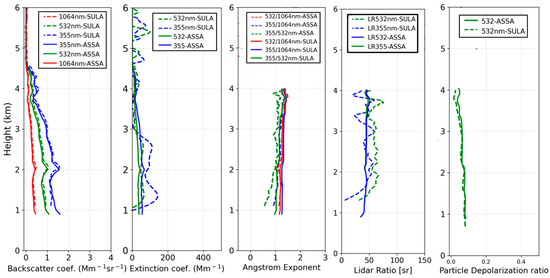
Figure 7.
Optical product profiles of the backscattering coefficients produced by the ASSA in correspondence with the lidar retrievals in Figure 4.
4. Discussion and Conclusions
The aim of the study was to check the ASSA’s performance and stability. Attention was focused on a case study on 30 June 2022, with lidar measurements corresponding to the Thessaloniki station indicating the presence of a well-defined aerosol layer. The multiwavelength Raman lidar technique was applied to obtain vertically resolved particle optical properties and further inversion of those properties with the ASSA allowed for retrieval of microphysical information on the studied particles. Our preliminary findings show good quantitative and qualitative agreement among the measured and simulated profiles and result to concentration profiles per species. Introducing new or more look-up tables (LUTs) to account for different aerosol types is a potential future strategy to improve the ASSA.
Author Contributions
Conceptualization, N.S.; methodology, N.S.; software, N.S.; evaluation, K.M.; formal analysis, K.M.; investigation, N.S. and K.M.; resources, K.M.; data curation, K.M.; writing—original draft preparation, K.M.; supervision, D.B. All authors have read and agreed to the published version of the manuscript.
Funding
This research has been supported by the PANhellenic infrastructure for Atmospheric Composition and climatE chAnge project (MIS 5021516) which is implemented under the Reinforcement of the Research and Innovation Infrastructure action, funded by the Competitiveness, Entrepreneurship and Innovation operational program (NSRF 2014–2020) and co-financed by Greece and the European Union (European Regional Development Fund).
Institutional Review Board Statement
Not applicable.
Informed Consent Statement
Informed consent was obtained from all subjects involved in the study.
Data Availability Statement
THELISYS lidar observations (level 0 data, measured signals) are in the EARLINET data base (https://data.earlinet.org/earlinet/login.zul; Last access: 20 April 2023).
Acknowledgments
The authors acknowledge support through the ACTRIS project—European Union’s Horizon 2020 research and innovation program.
Conflicts of Interest
The authors declare no conflict of interest.
References
- Siomos, N.; Balis, D.S.; Voudouri, K.A.; Giannakaki, E.; Filioglou, M.; Amiridis, V.; Papayannis, A.; Fragkos, K. Are EARLINET and AERONET climatologies consistent? The case of Thessaloniki, Greece. Atmos. Chem. Phys. 2018, 18, 11885–11903. [Google Scholar] [CrossRef]
- Hess, M.; Koepke, P.; Schult, I. Optical Properties of Aerosols and Clouds: The Software Package OPAC. Bull. Am. Meteorol. Soc. 1998, 79, 831–844. [Google Scholar] [CrossRef]
- Koepke, P.; Gasteiger, J.; Hess, M. Technical Note: Optical properties of desert aerosol with non-spherical mineral particles: Data incorporated to OPAC. Atmos. Chem. Phys. 2015, 15, 5947–5956. [Google Scholar] [CrossRef]
- Hara, Y.; Nishizawa, T.; Sugimoto, N.; Osada, K.; Yumimoto, K.; Uno, I.; Ishimoto, H. Retrieval of Aerosol Components Using Multi-Wavelength Mie-Raman Lidar and Comparison with Ground Aerosol Sampling. Remote Sens. 2018, 10, 937. [Google Scholar] [CrossRef]
- Emde, C.; Buras-Schnell, R.; Kylling, A.; Mayer, B.; Gasteiger, J.; Hamann, U.; Kylling, J.; Richter, B.; Pause, C.; Dowling, T.; et al. The libRadtran software package for radiative transfer calculations (version 2.0.1). Geosci. Model Dev. 2016, 9, 1647–1672. [Google Scholar] [CrossRef]
- Siomos, N.; Balis, D.; Bais, A.; Koukouli, M.E.; Garane, K.; Voudouri, K.A.; Gkertsi, F.; Natsis, A.; Karagkiozidis, D.; Fountoulakis, I. Towards an Algorithm for Near Real Time Profiling of Aerosol Species, Trace Gases, and Clouds Based on the Synergy of Remote Sensing Instruments. EPJ Web Conf. 2020, 237, 08023. [Google Scholar] [CrossRef]
- Ansmann, A.; Wandinger, U.; Riebesell, M.; Weitkamp, C.; Michaelis, W. Independent measurement of extinction and backscatter profiles in cirrus clouds by using a combined Raman elastic-backscatter lidar. Appl. Opt. 1992, 31, 7113–7131. [Google Scholar] [CrossRef] [PubMed]
- Klett, J.D. Stable analytical inversion solution for processing lidar returns. Appl. Opt. 1981, 20, 211–220. [Google Scholar] [CrossRef] [PubMed]
- Draxler, R.; Hess, G. An overview of the HYSPLIT_4 modeling system for trajectories, dispersion, and deposition. Aust. Meteorol. Mag. 1998, 47, 295–308. [Google Scholar]
Disclaimer/Publisher’s Note: The statements, opinions and data contained in all publications are solely those of the individual author(s) and contributor(s) and not of MDPI and/or the editor(s). MDPI and/or the editor(s) disclaim responsibility for any injury to people or property resulting from any ideas, methods, instructions or products referred to in the content. |
© 2023 by the authors. Licensee MDPI, Basel, Switzerland. This article is an open access article distributed under the terms and conditions of the Creative Commons Attribution (CC BY) license (https://creativecommons.org/licenses/by/4.0/).