Abstract
Atmospheric water vapor is an important greenhouse gas, mainly distributed in the lower tropospheric levels where its concentration varies significantly in space and time; consequently, so does precipitable water. This work uses information from thermal infrared images to model precipitable water (PW) under clear skies. PW is measured using a portable sun-photometer and thermal images obtained through a high-cost thermal infrared camera. PW depends on the zenith-point temperature (Tb) exhibiting a non-linear positive exponential relationship, with systematic and dispersion errors of 0.04 mm and 1.9 mm.
1. Introduction
The spatiotemporal variability of atmospheric water vapor affects all components of the hydrological cycle, also modifying the radiative budget of the atmosphere. Hence, detailed information on the column-integrated water vapor and its vertical distribution is necessary at relatively high spatiotemporal resolution. Precipitable water (PW) is defined as the height of liquid water per unit area formed if the vapor within a vertical column extending from Earth’s surface to the top of the atmosphere was condensed. Increases in water vapor concentrations are reflected in the natural greenhouse effect, leading to further surface warming, especially at regional scales [1].
Historically, PW has been determined through radiosondes by integrating the water vapor vertical profile in terms of temperature, humidity, and pressure. Although various radiosonde networks exist around the globe, PW is typically reported twice a day. Therefore, this process is unable to capture possible rapid PW fluctuations. In recent years, PW has been derived from ground-based meteorological global positioning system (GPS) antennas, multiwavelength sun-photometers or satellite-based observations of atmospheric absorption bands [2,3,4,5,6,7]. Additionally, alternative approaches have been applied using infrared thermometers by connecting PW with zenith-sky infrared temperature measurements [8,9].
This study examines the link between PW and zenith-point temperatures retrieved via thermal images from a high-cost thermal camera under clear sky conditions.
2. Materials and Methods
In this study, precipitable water (PW) was measured with a portable Microtops II (MII) sun-photometer. MII retrieves the total column PW based on measurements at the 936 nm and 1020 nm channels. Water vapor strongly absorbs solar irradiance in the (near-) infrared band of the solar spectrum (~936 nm), while at 1020 nm, water vapor absorption is absent. The methodology for transforming the radiation values to water vapor content is based on the Bouguer–Lambert–Beer law and is described in detail in the instrument’s manual. All the MII data are acquired under cloud-free conditions at ~30 min intervals.
Thermal infrared images are obtained through a high-cost MOBOTIX #73 thermal infrared camera (M73), sensitive in the far-infrared (7.5 to 13.5 μm) range. The camera has a field-of-view (FoV) of ~70°, providing images with a 640 × 480 spatial resolution at ~10 min intervals. Instead of images, temperature data (°C) are stored in the .csv format. Only the point at the middle of each thermal image was extracted since its radiosity value is proportional to the zenith-point temperature (Tb). Due to the different acquisition times between the thermal images and MII measurements, a temporal synchronization process (Equation (1)) was applied to create (PW, Tb) pairs considering only M73 images within a ±60 min window centered around the MII measurement times.
where Δtij is the time difference between the MII and M73 measurement times, and tMII and tM73 denoting the timestamps of MII and M47, respectively. This approach is considered as valid since clear-sky PW changes slightly within the pre-described temporal window. Cloud contamination was absent since MII measurements were only collected under clear sky conditions. Basic quality control was also applied to avoid the erroneous recording of PW and possible corrupted image files. The measurement campaign (February 2022–September 2022) took place at the Laboratory of Atmospheric Physics, University of Patras, Greece (38.291° N, 21.789° E). The final dataset includes 188 (PW, Tb) pairs.
Δtij = |tMII,i–tM73,j|, i = 1, …, tMII and j = 1, …, tM73
3. Results
3.1. Temporal Variability of PW and Tb
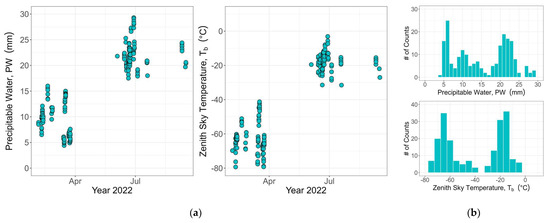
This sub-section of the results discusses the temporal variability of PW and Tb under cloud-free conditions. The measured PW ranges from 4.4 to 29.1 mm, with a mean value of 14.9 mm and a standard deviation of 7 mm (Figure 1a). Although PW data are not available for the winter period of 2022, PW may vary seasonally, with higher values during the summer months driven by the seasonal fluctuations in air temperature. For example, before April 2022, the average PW was 9 mm, while during summer, the corresponding PW average was 22 mm (Figure 1a). The right panel of Figure 1a shows the temporal variation of the zenith-sky temperature, Tb, as extracted from the thermal infrared images. According to Figure 1a, PW and Tb exhibited similar temporal patterns, thus implying a possible significant correlation. Tb was within the range from −79.3 to −3.1 °C with an average of −42 °C.

Figure 1.
(a) Time series and (b) frequency histograms for PW and Tb under clear-sky conditions.
PW and Tb exhibited bimodal statistical distributions during the measurement campaign (Figure 1b). The frequency histograms provide a near-normal behavior for PW > 17 mm and Tb > −40 °C while rightly skewed distributions are observed for lower values.
3.2. PW Modeling Using Tb
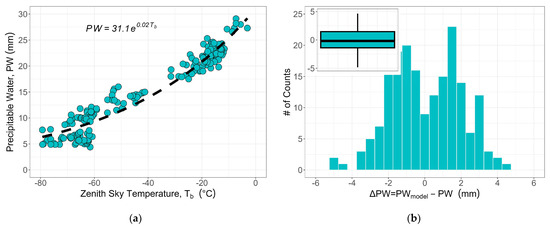
The scatter plot in Figure 2a displays a significant relationship between PW and Tb. An exponential model was fitted to describe this pattern, and the best-fit curve results are represented by the dashed black line in Figure 1b. The non-linear least squares method with the Levenberg–Marquardt minimization technique was employed to design the exponential model, and the best-fit line is defined as PW = 31.1exp(0.02Tb).

Figure 2.
(a) PW vs. Tb. The dashed exponential curve describes the non-linear relationship between PW and Tb. (b) Frequency histogram and boxplot (inset) of the PW differences (ΔPW = PWmodel − PW).
In order to examine the robustness of the PW model, the mean bias error, root mean square and Pearson’s R correlation coefficient were calculated. The systematic bias is negligible (MBE = 0.04 mm or 0.25% in its normalized form with respect to the PW observations), while the (normalized) dispersion error was 1.91 mm (12.8%). The predictions and the observations were highly and significantly correlated (Pearson’s R = 0.96, p value < 0.05). Figure 2b shows the histogram of the PW differences (ΔPW = PWmodel − PW) between the modeled and observed values. ΔPW ranges between −4.8 and 4.7 mm, with average and median differences close to zero. According to Figure 2b, the shape of ΔPW is described by a combination of two near-normal statistical distributions with central tendencies at ~−1 cm and 1.5 cm, respectively. Several sources are responsible for obtaining such PW differences, including uncertainties in the (a) precision of the instruments, (b) temperature extraction process, and (c) modeling of PW vs. Tb.
4. Conclusions
The accurate description of PW is important for meteorological, atmospheric and solar applications. This study examines the relationship between water vapor measurements against zenith-point temperatures retrieved from thermal infrared images under cloud-free conditions. Both parameters exhibited similar seasonal patterns with higher values in summer. PW was exponentially correlated to Tb. Negligible systematic bias and low dispersion error existed between the predicted and observed PW values. This methodology can be applied to generate high-resolution clear-sky PW measurements, especially when sun-photometer observations are missing.
Author Contributions
Conceptualization, V.S. and A.K.; methodology, V.S. and A.A.A.; software, V.S.; validation, V.S.; formal analysis, V.S.; investigation, V.S.; data curation, P.T.; writing—original draft preparation, V.S. and P.T.; writing—review and editing, V.S., P.T., A.A.A. and A.K.; visualization, V.S.; supervision, A.K.; funding acquisition, A.K. All authors have read and agreed to the published version of the manuscript.
Funding
The publication of this article has been co-financed by the European Union and Greek national funds through the Operational Program Competitiveness, Entrepreneurship and Innovation, under the call RESEARCH–CREATE-INNOVATE (project code: Τ2EDK-00681).
Institutional Review Board Statement
Not applicable.
Informed Consent Statement
Not applicable.
Data Availability Statement
The data presented in this study are available upon request from the corresponding author.
Acknowledgments
We acknowledge the support of this work by the project DeepSky co-financed by the European Union and Greek national funds through the Operational Program Competitiveness, Entrepreneurship and Innovation, under the call RESEARCH–CREATE-INNOVATE (project code: Τ2EDK-00681).
Conflicts of Interest
The authors declare no conflict of interest.
References
- IPCC. Climate Change 2013: The Physical Science Basis. Contribution of Working Group I to the Fifth Assessment Report of the Intergovernmental Panel on Climate Change; Stocker, T.F., Qin, D., Plattner, G.-K., Tignor, M., Allen, S.K., Boschung, J., Nauels, A., Xia, Y., Bex, V., Midgley, P.M., Eds.; Cambridge University Press: Cambridge, UK; New York, NY, USA, 2013; 1535p. [Google Scholar] [CrossRef]
- Borbás, E. Derivation of precipitable water from GPS data: An application to meteorology. Phys. Chem. Earth 1998, 23, 87–90. [Google Scholar] [CrossRef]
- Guerova, G.; Jones, J.; Douša, J.; Dick, G.; de Haan, S.; Pottiaux, E.; Bock, O.; Pacione, R.; Elgered, G.; Vedel, H.; et al. Review of the state of the art and future prospects of the ground-based GNSS meteorology in Europe. Atmos. Meas. Tech. 2016, 9, 5385–5406. [Google Scholar] [CrossRef]
- Michalsky, J.J.; Min, Q.; Kiedron, P.W.; Slater, D.W.; Barnard, J.C. A differential technique to retrieve column water vapor using sun radiometry. J. Geophys. Res. 2001, 106, 17433–17442. [Google Scholar] [CrossRef][Green Version]
- Giles, D.M.; Sinyuk, A.; Sorokin, M.G.; Schafer, J.S.; Smirnov, A.; Slutsker, I.; Eck, T.F.; Holben, B.N.; Lewis, J.R.; Campbell, J.R.; et al. Advancements in the Aerosol Robotic Network (AERONET) Version 3 database–automated near-real-time quality control algorithm with improved cloud screening for Sun photometer aerosol optical depth (AOD) measurements. Atmos. Meas. Tech. 2019, 12, 169–209. [Google Scholar] [CrossRef]
- Gao, B.-C.; Kaufman, Y.J. Water vapour retrievals using Moderate Resolution Imaging Spectroradiometer (MODIS) near-infrared channels. J. Geophys. Res. 2003, 108, 4389. [Google Scholar] [CrossRef]
- Sobrino, J.A.; El Kharraz, J.; Li, Z.-L. Surface temperature and water vapour retrieval from MODIS data. Int. J. Remote Sens. 2003, 24, 5161–5182. [Google Scholar] [CrossRef]
- Mims, F.M.; Chambers, L.H.; Brooks, D.R. Measuring Total Column Water Vapor by Pointing an Infrared Thermometer at the Sky. Bull. Am. Meteorol. Soc. 2011, 92, 1311–1320. [Google Scholar] [CrossRef]
- Kelsey, V.; Riley, S.; Minschwaner, K. Atmospheric precipitable water vapor and its correlation with clear-sky infrared temperature observations. Atmos. Meas. Tech. 2022, 15, 1563–1576. [Google Scholar] [CrossRef]
Disclaimer/Publisher’s Note: The statements, opinions and data contained in all publications are solely those of the individual author(s) and contributor(s) and not of MDPI and/or the editor(s). MDPI and/or the editor(s) disclaim responsibility for any injury to people or property resulting from any ideas, methods, instructions or products referred to in the content. |
© 2023 by the authors. Licensee MDPI, Basel, Switzerland. This article is an open access article distributed under the terms and conditions of the Creative Commons Attribution (CC BY) license (https://creativecommons.org/licenses/by/4.0/).