Abstract
We present climatology and trends of the UTCI obtained from the ERA5 reanalysis between 1941 and 2018 for the Czech Republic. Long-term average of the UTCI exposes regions with approximately similar stress levels given by weather on humans, and it also forms the basis for the first bioclimatological mapping of the Czech Republic. Furthermore, positive long-term trends of UTCI indicate gradually increasing thermal stress on humans in all seasons but winter, in which, on the contrary, the cold stress decreases. Nevertheless, inhomogeneities in our results are expected because of flattened orography due to the coarse resolution of ERA5.
1. Introduction
Within the PERUN (Prediction, Evaluation and Research for Understanding National sensitivity and impacts of drought and climate change for Czechia) project, one of the most challenging objectives is the comprehensive bioclimatological mapping of the Czech Republic. This task cannot be completed without the inclusion of a part dedicated to the thermal comfort or discomfort of humans. Therefore, it was necessary to choose a suitable indicator of the degree of heat stress.
An important criterion was the required length of the time series, which must be at least 30 years long (normal period). At the same time, however, in times of global climate change, the study of trends should also be a part of the work. Therefore, it would be appropriate to report time series longer than the aforementioned 30 years.
Two possibilities addressing the rate of thermal stress on humans are possible: utilizing direct observations of meteorological variables, or analyzing an index from reanalyses. The latter option is more appropriate, holding several advantages, such as data organized in a regular grid, the same length of gridded time series, etc. Hence, one of such indexes is the Universal Thermal Climate Index [1] (UTCI), currently available within the ERA5-HEAT [2] (ERA5 in the further text). UTCI is a comprehensive index including the simultaneous effects of air temperature, humidity, wind speed, and short- and long-wave radiative balance (represented by mean radiant temperature).
For our purposes, the use of UTCI holds an additional advantage: a reanalysis from the ALADIN-CLIMATE/CZ model with higher resolution is also available for the most recent normal climate period of 1991–2020. Our team has already performed goodness-of-fit tests between both reanalyses in the last two years. Results indicate a large similarity between both datasets, hence it is appropriate to use UTCI from ERA5 for long-term analyses, although one has to bear in mind the limits associated with the coarser resolution of ERA5. For detailed mapping, however, the reanalysis from ALADIN-CLIMATE/CZ will be used in the future due to a higher resolution (2.325 km grid step) [3].
2. Materials and Methods
We analyze the UTCI for the Czech Republic between 1940 and 2018. The UTCI is obtained from the ERA5 reanalysis in the hourly step in the original spatial resolution, that is, about 30 km. Interpolation of the index, with the use of spline interpolation in the R environment, leads to the finer resolution of about 7 km. The average UTCI is then calculated in monthly, seasonal, and annual step at every gridpoint. Trends are calculated over all gridpoints and evaluated by linear regression. Statistical significance at the 5% statistical significance level is evaluated with a Student’s t-test.
3. Results and Discussion
3.1. Climatology of UTCI
The spatial distribution of the long-term annual average of UTCI is shown in Figure 1a. Values of UTCI vary between 0.78 °C and 5.17 °C, and they are mostly dependent on the altitude (Figure 1b): as is evident, lower values of UTCI are mostly located in higher altitudes above 500 masl. Yet, the smallest value of UTCI is not located in the highest altitudes of the Czech Republic, but just close to 520 masl (blue circle in Figure 1b), probably due to the larger average wind speed there. This mid-latitude region (the Bohemian-Moravian Highlands) is prone to larger average wind speeds [4], mainly from the northwest and southeast, which lower the long-term value of UTCI. In contrast, the areas with the largest thermal stress are located in the lowlands in southeastern and northwestern Czechia; the gridpoint with the largest value of UTCI is denoted by the red circle in Figure 1b.
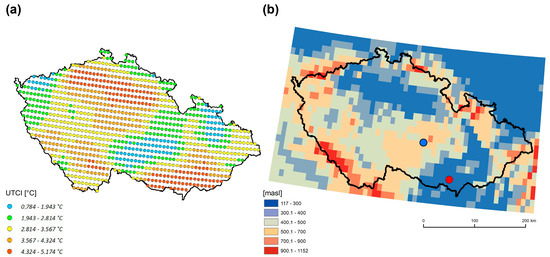
Figure 1.
(a) Long-term (1940–2018) average annual values of UTCI and (b) corresponding orography of the Czech Republic.
3.2. Trends of UTCI
Trends of the UTCI are calculated for the whole Czech Republic in the annual, seasonal, and monthly step. Figure 2a reveals the strongest increase of UTCI over mostly low elevated areas of northern Bohemia, where UTCI increases by about 0.26–0.27 °C/10 years. On the contrary, a slower increase is observed in higher elevated areas close to the borderlines of the Czech Republic. The average trend over all gridpoints in the whole period is 0.26 °C/10 years.
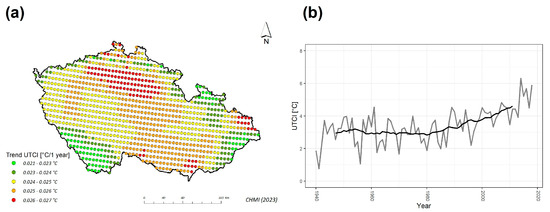
Figure 2.
(a) Long-term (1940–2018) trends of annual UTCI and (b) temporal evolution of average annual UTCI (in gray) over all gridpoints with 15-year running average (in black).
Figure 2b shows the temporal evolution of the average UTCI over the whole country. The 15-year running average exhibits increasing values of UTCI mainly after 1990, with the largest average value of UTCI recorded at the end of the studied period. Such behavior of UTCI corresponds to growing temperature, the rate of which has been accelerating since approximately 1990, with the largest average temperature recorded at the end of the studied period [5]. Although the average wind speed has decreased, it seems to have an almost negligible impact on the trend of the UTCI.
The trend of UTCI is positive in all seasons (Table 1) and corresponds to increasing temperature [5,6]. The largest increase is revealed in winter (0.45 °C/10 years; Table 1, Figure 3d,f), meaning that long-term cold stress is gradually decreasing (Figure 3f). Another reason behind such rapid growth is the very low values of UTCI recorded in the 1940s: the month holding the lowest recorded value is January 1942. From the spatial perspective, UTCI in winter increased the most in southeastern parts of the country.

Table 1.
The trend of UTCI for the Czech Republic, 1940–2018. Asterisks denote statistical significance at the 5% level.
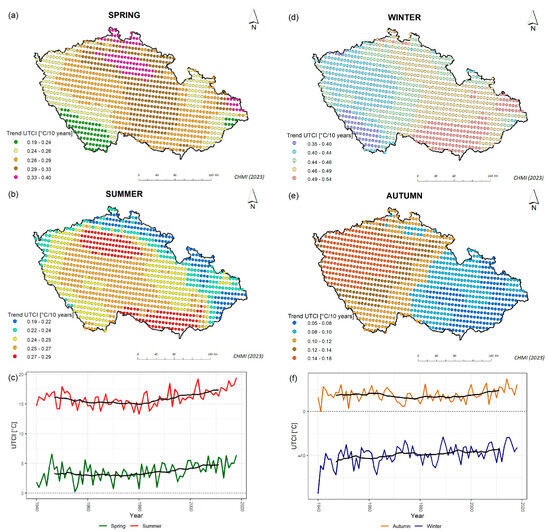
Figure 3.
Spatial distribution of trends of UTCI (in °C/10 years; 1940–2018) in (a) spring, (b) summer, (d) winter, and (e) autumn. (c,f) Temporal evolution of average UTCI over all gridpoints for seasons with 15-year moving average.
The trends of UTCI in spring and summer (Figure 3c) share similar characteristics: the rate of increase is similar (Table 1), which means larger thermal stress on humans, and positive trends are most pronounced in the lowland areas, particularly in the northern parts of the country (Figure 3a,b). Yet, in summer, of interest is the large contrast in the spatial distribution of trends in the northernmost parts of the country (Figure 3b), where the rapid growth of thermal stress towards the south is evident. This characteristic will be the subject of deeper research in the future, however, one factor contributing to this specific spatial distribution may be a temperature advection: warm air from the south does not often penetrate so north and the northernmost parts of the country thus remain in somehow colder air, which translates into slower trends of UTCI there.
Stress level on humans is not rising so sharply in autumn (Figure 3e,f), probably due to a slower rate of warming, which is often called as “warming hole” in literature [5,6,7]. Yet, the increase after 2000 is detected in autumn as well (Figure 3f), mainly in the western half of the country.
In accordance with seasonal results, trends in winter months hold the largest UTCI increase (0.59 and 0.45 °C/10 years for January and February, respectively). On the contrary, September and October are months with no significant trend, with the former even exhibiting an insignificant decrease in UTCI (Table 1).
4. Conclusions
We analyze climatology and temporal behavior of the UTCI for the Czech Republic between 1941 and 2018. The climatology of UTCI seems to be dependent on altitude—generally, the lower values are found in mountain areas close to the borderline. In contrast, the largest values are found in the northern and southeastern parts of the country in the warmest low elevated regions.
Temporal evolution shows a significant increase in the annual UTCI value (0.26 °C/10 years), which also applies to separate seasons. The largest increase of UTCI is found in winter (0.45 °C/10 years), which means a decrease in cold stress. On the contrary, the average increase in spring and summer (0.28 and 0.25 °C/10 years, respectively) is associated with an increase of thermal stress on humans. The index rises slower in autumn (0.12 °C/10 years). The trend of UTCI seems to be strongly tied to increasing temperature, which is mainly evident in summer, in which the UTCI began to increase after 1990 when temperature started to increase rapidly.
This work points out the general characteristics of UTCI in ERA5 in the Czech Republic. Since the ERA5 reanalysis is a global product, its resolution is rather coarse, which brings about inhomogeneities in our analysis. The finer resolution is present in the newly calculated ALADIN-CLIMATE/CZ reanalysis with a resolution of about 2.3 km and better orography, which will be the subject of our future research.
Author Contributions
Conceptualization, M.H., M.N. and S.P.; methodology, M.H. and M.N.; software, M.H., M.N. and S.P.; formal analysis, M.H. and M.N.; investigation, M.H., M.N. and S.P.; resources, M.H. and M.N.; data curation, M.H. and M.N.; writing—original draft preparation, M.H. and M.N.; writing—review and editing, M.H.; visualization, M.H. and S.P.; project administration, M.N.; funding acquisition, M.N. All authors have read and agreed to the published version of the manuscript.
Funding
The authors would like to thank the Technology Agency of the Czech Republic for its financial support under the grant no. SS02030040 (Prediction, Evaluation and Research for Understanding National sensitivity and impacts of drought and climate change for Czechia, PERUN).
Institutional Review Board Statement
Not applicable.
Informed Consent Statement
Not applicable.
Data Availability Statement
The ERA5 reanalysis is publicly available on https://cds.climate.copernicus.eu/cdsapp#!/dataset/reanalysis-era5-land?tab=overview (accessed on 3 April 2023).
Conflicts of Interest
The authors declare no conflict of interest.
References
- Bröde, P.; Fiala, D.; Błażejczyk, K.; Holmér, I.; Jendritzky, G.; Kampmann, B.; Tinz, B.; Havenith, G. Deriving the operational procedure for the Universal Thermal Climate Index (UTCI). Int. J. Biometeorol. 2012, 56, 481–494. [Google Scholar] [CrossRef] [PubMed]
- Di Napoli, C.; Barnard, C.; Prudhomme, C.; Cloke, H.L.; Pappenberger, F. ERA5-HEAT: A global gridded historical dataset of human thermal comfort indices from climate reanalysis. Geosci. Data J. 2021, 8, 2–10. [Google Scholar] [CrossRef]
- Pokorná, L.; Sokol, Z.; Belda, M.; Brožková, R.; Trojáková, A.; Bobotová, G. PERUN/Reanalys—The high resolution reanalysis for central Europe driven by ERA 5. In Proceedings of the EMS Annual Meeting 2022, Bonn, Germany, 5–9 September 2022. [Google Scholar]
- Tolasz, R.; Brázdil, R.; Bulíř, O.; Dobrovolný, P.; Dubrovský, M.; Hájková, L.; Halásová, O.; Hostýnek, J.; Janouch, M.; Kohut, M.; et al. Climate Atlas of Czechia; Czech Hydrometeorological Institute, Palacký University: Olomouc, Czech Republic, 2007; p. 255. [Google Scholar]
- Brázdil, R.; Zahradníček, P.; Dobrovolný, P.; Řehoř, J.; Trnka, M.; Lhotka, O.; Štěpánek, P. Circulation and climate variability in the Czech Republic between 1961 and 2020: A comparison of changes for two “normal” periods. Atmosphere 2022, 13, 137. [Google Scholar] [CrossRef]
- Brázdil, R.; Chromá, K.; Dobrovolný, P.; Tolasz, R. Climate fluctuations in the Czech Republic during the period 1961–2005. Int. J. Clim. 2009, 29, 223–242. [Google Scholar] [CrossRef]
- Pokorná, L.; Kučerová, M.; Huth, R. Annual cycle of temperature trends in Europe, 1961–2000. Glob. Planet Chang. 2018, 170, 14. [Google Scholar] [CrossRef]
Disclaimer/Publisher’s Note: The statements, opinions and data contained in all publications are solely those of the individual author(s) and contributor(s) and not of MDPI and/or the editor(s). MDPI and/or the editor(s) disclaim responsibility for any injury to people or property resulting from any ideas, methods, instructions or products referred to in the content. |
© 2023 by the authors. Licensee MDPI, Basel, Switzerland. This article is an open access article distributed under the terms and conditions of the Creative Commons Attribution (CC BY) license (https://creativecommons.org/licenses/by/4.0/).