Article

Land Use Change Detection and Prediction Around Lenggong UNESCO World Heritage Site Using ANN–CA Modelling


by
Muhammad Wafiy Adli Ramli
1,*,
Wan Mohd Muhiyuddin Wan Ibrahim
1,*,
Alagappan Ramanthan
2,
Azizul Ahmad
3,
Yusrin Faiz Abdul Wahab
4,5 and
Mohd Amirul Mahamud
1
1
Geography Section, School of Humanities, Universiti Sains Malaysia, Minden 11800, Malaysia
2
Centre for Global Archaeological Research, Universiti Sains Malaysia, Minden 11800, Malaysia
3
Centre for Spatially Integrated Digital Humanities (CSIDH), Faculty of Social Sciences and Humanities, Universiti Malaysia Sarawak, Kota Samarahan 94300, Malaysia
4
Construction Research Institute of Malaysia (CREAM), CIDB Malaysia, Kuala Lumpur 50480, Malaysia
5
Malaysia-Japan International Institute of Technology, Universiti Teknologi Malaysia, Kuala Lumpur 54100, Malaysia
*
Authors to whom correspondence should be addressed.
Earth 2026, 7(5), 144; https://doi.org/10.3390/earth7050144
Submission received: 27 June 2026 / Revised: 31 July 2026 / Accepted: 7 August 2026 / Published: 27 August 2026
(This article belongs to the Topic Land Cover and Ecological Change)

Abstract

Lenggong Valley is an important heritage landscape in Malaysia commonly recognized for its outstanding archaeological, cultural, and environmental significance. However, increasing land use pressure around heritage areas may affect landscape authenticity, environmental quality, and long-term conservation planning. This study aims to analyze historical land use change and predict future land use patterns within the Lenggong catchment, a sub-catchment of the Sungai Perak catchment. Land use data for 2000, 2010, and 2020 were obtained from PlanMalaysia and reclassified into five major classes: water bodies, agriculture, forest, built-up areas, and vacant land. The ANN model was calibrated using the 2000 and 2010 land use maps, while the simulated 2020 map was validated against the observed 2020 map using Kappa statistics. Following validation, the 2010–2020 transition pattern and cellular-automata neighborhood effects were used to predict land use for 2040 through two consecutive 10-year simulation iterations. The results showed that forest and agriculture remained the dominant land use classes in the catchment. However, forest decreased from 58.9% in 2000 to 54.4% in 2020, while agriculture increased from 33.3% to 35.5%. Built-up areas also increased from 1.8% to 3.5% and were predicted to reach 3.8%. The model also denoted acceptable performance, with an overall Kappa value of 0.71 and validation accuracy of 83.1%. Within the 1 km heritage buffer, built-up areas increased from 3.6% in 2000 to 10.5% in 2020, with a projected increase to 13.2%. Overall, the findings highlight increasing development pressure around the Lenggong heritage landscape and provide useful spatial evidence for heritage-sensitive planning and long-term conservation management.

1. Introduction

Land use refers to the human utilization and management of land for various purposes, including agriculture, residential, industry, transportation, conservation, and recreation [1]. It reflects the interaction between human activities and the physical environment and therefore serves as an important indicator of landscape transformation. Land use changes occur when one land use category is converted into another, such as when forest or agricultural land is transformed into built-up areas. These transformations are particularly pronounced in regions experiencing significant climate change and population expansion and necessitate robust monitoring and predictive modelling for sustainable development and resource management [2]. While land use changes can facilitate socioeconomic development, unregulated conversions may precipitate environmental degradation, habitat fragmentation, elevated surface runoff, soil erosion, water quality impairment, and the diminution of ecosystem services [3]. Therefore, monitoring land use changes is important for understanding past landscape dynamics and supporting sustainable land management.
In recent years, land use change studies have increasingly moved beyond historical change detection toward spatial prediction and simulation. Conventional land use change analysis identifies historical changes, whereas predictive modeling offers information about potential future land use changes. This prospective analytical capability is crucial for proactive urban planning and environmental policy formulation, especially in areas subject to rapid demographic shifts and developmental pressures [4]. While several advanced methodologies, including ANN, CA, Markov Chain analysis, and logistic regression, have been utilized for land use predictions, hybrid models have emerged as particularly effective by allowing the simulation of complex land use transitions [5]. ANN is useful because it can model complex and non-linear relationships between land use change and spatial driving factors. When integrated with CA, ANN further incorporates spatial neighborhood effects and iterative transition rules to simulate realistic spatiotemporal land use dynamics, achieving high predictive accuracies such as kappa indices above 0.80 in regional applications [6]. This integrated approach offers a robust framework for assessing the environmental implications of various land use scenarios and informing policy decisions regarding future land management [7]. While land use changes can facilitate socioeconomic development, uncontrolled conversion may cause environmental degradation, habitat fragmentation, increased surface runoff, soil erosion, water-quality deterioration, and the loss of ecosystem services. The expansion of built-up areas, particularly transportation networks, alters surface permeability, infiltration, and post-rainfall moisture dynamics. Consequently, long-term performance data are important for quantifying infrastructure-driven changes in surface and subsurface hydrological conditions [8]. Therefore, monitoring land use changes is essential for understanding historical landscape dynamics and supporting sustainable land management.
Among predictive modelling approaches, ANN is particularly useful because it can learn complex, nonlinear, and multidimensional relationships between observed land use transitions and their spatial characteristics without requiring these relationships to be represented by a predetermined linear function. Advanced neural-network architectures have demonstrated the capacity to solve complex multidimensional earth-science problems, including the simultaneous prediction of subsurface properties and layered thickness under physical constraints [9]. Within land use modelling, ANN estimates the transition potential of each location based on historical land use patterns. When integrated with cellular automata, these transition potentials are combined with spatial neighborhood effects and iterative allocation rules to simulate the location and configuration of future land use changes. Therefore, the ANN–CA integration combines the nonlinear learning capability of ANN with the spatial and temporal simulation capability of CA.
Land use change analysis is crucial in heritage landscapes because the surrounding land use context can influence the environmental, cultural, and visual integrity of heritage sites. Protecting heritage sites entails not only their core archaeological, historical, or cultural values but also their wider landscape setting. Consequently, understanding and modelling these changes are vital for preserving the ecological functions, aesthetic value, and historical context that define these invaluable areas. The dynamic nature of these landscapes is usually influenced by anthropogenic activities such as urbanization and agricultural expansion, which highlights the requirement for advanced modelling methodologies to predict future land use patterns and encourage conservation efforts [10]. In this study, heritage-sensitive catchment planning refers to the integration of land use and development management across the hydrologically connected catchment while ensuring that proposed changes do not adversely affect the archaeological significance, landscape setting, environmental integrity, or Outstanding Universal Value (OUV) of the Lenggong UNESCO World Heritage Site. Within the Malaysian regulatory context, this approach supports heritage conservation under the National Heritage Act 2005 [11] and informs development control through structure plans, local plans, and special area plans prepared under the Town and Country Planning Act 1976 (Act 172) [12]. It also complements the protection and management requirements for the World Heritage property and its buffer zones. The catchment boundary is therefore used as an analytical planning unit to identify development pressures beyond the designated heritage boundary, rather than as a replacement for existing statutory heritage and planning zones. Insights from land use change and prediction studies can provide spatial evidence for heritage-sensitive planning, allowing authorities to identify areas that may require stricter development control or conservation attention.
Previous studies on land use change have typically concentrated on urban sprawl, agricultural changes, deforestation, and impacts on the environment within administrative or metropolitan boundaries. However, fewer studies have specifically addressed the intricate dynamics of land use transformation in areas surrounding UNESCO World Heritage Sites, where the interplay between conservation mandates and socioeconomic development pressures presents unique challenges for spatial planning [13]. Multiple studies used GIS-based modelling approaches to project future land use scenarios using historical satellite imagery, land use maps, and spatial variables. However, research on land use prediction in heritage settings is rather limited, especially in Malaysia. This literature gap highlights the necessity for advanced geospatial methodologies to monitor and predict land use transformations in such ecologically and culturally sensitive regions [14]. Furthermore, current heritage-related research frequently focuses on archaeological value, tourism, conservation management, or historical landscape analysis, with limited studies examining future land use pressures using predictive spatial modelling. This gap is particularly evident in Malaysia, where rapid urbanization, agricultural expansion, and economic growth exert considerable pressure on historically significant landscapes, such as the Chini Lake catchment and Penang Island [15]. It highlights the necessity for effective approaches that can predict land use changes to improve strategic conservation and development policies in Malaysia’s historically significant areas [16]. Therefore, there is a need to integrate ANN–CA modelling for land use change detection and prediction within heritage catchment contexts.
This study aims to analyze historical land use change and predict future land use patterns around the Lenggong UNESCO World Heritage Site, Malaysia. The study area is defined based on the Lenggong catchment boundary, which forms part of the Sungai Perak catchment. Land use data for 2000 and 2020 obtained from PlanMalaysia were reclassified into five major classes: water bodies, agriculture, forest, built-up areas, and vacant land. This reclassification facilitates a comprehensive analysis of spatiotemporal land use dynamics within this critical heritage landscape, enabling the application of advanced predictive models for future scenario planning. The significance of this study lies in its contribution to heritage-sensitive catchment planning by identifying past and potential future land use changes around the Lenggong UNESCO landscape. Another contribution is the use of a hybrid ANN–CA model to predict future land use changes and identify key findings for the sustainable management of this significant location [17]. These findings can support decision-makers, local authorities, planners and heritage managers in balancing development needs with environmental protection and long-term conservation.

2. Study Area

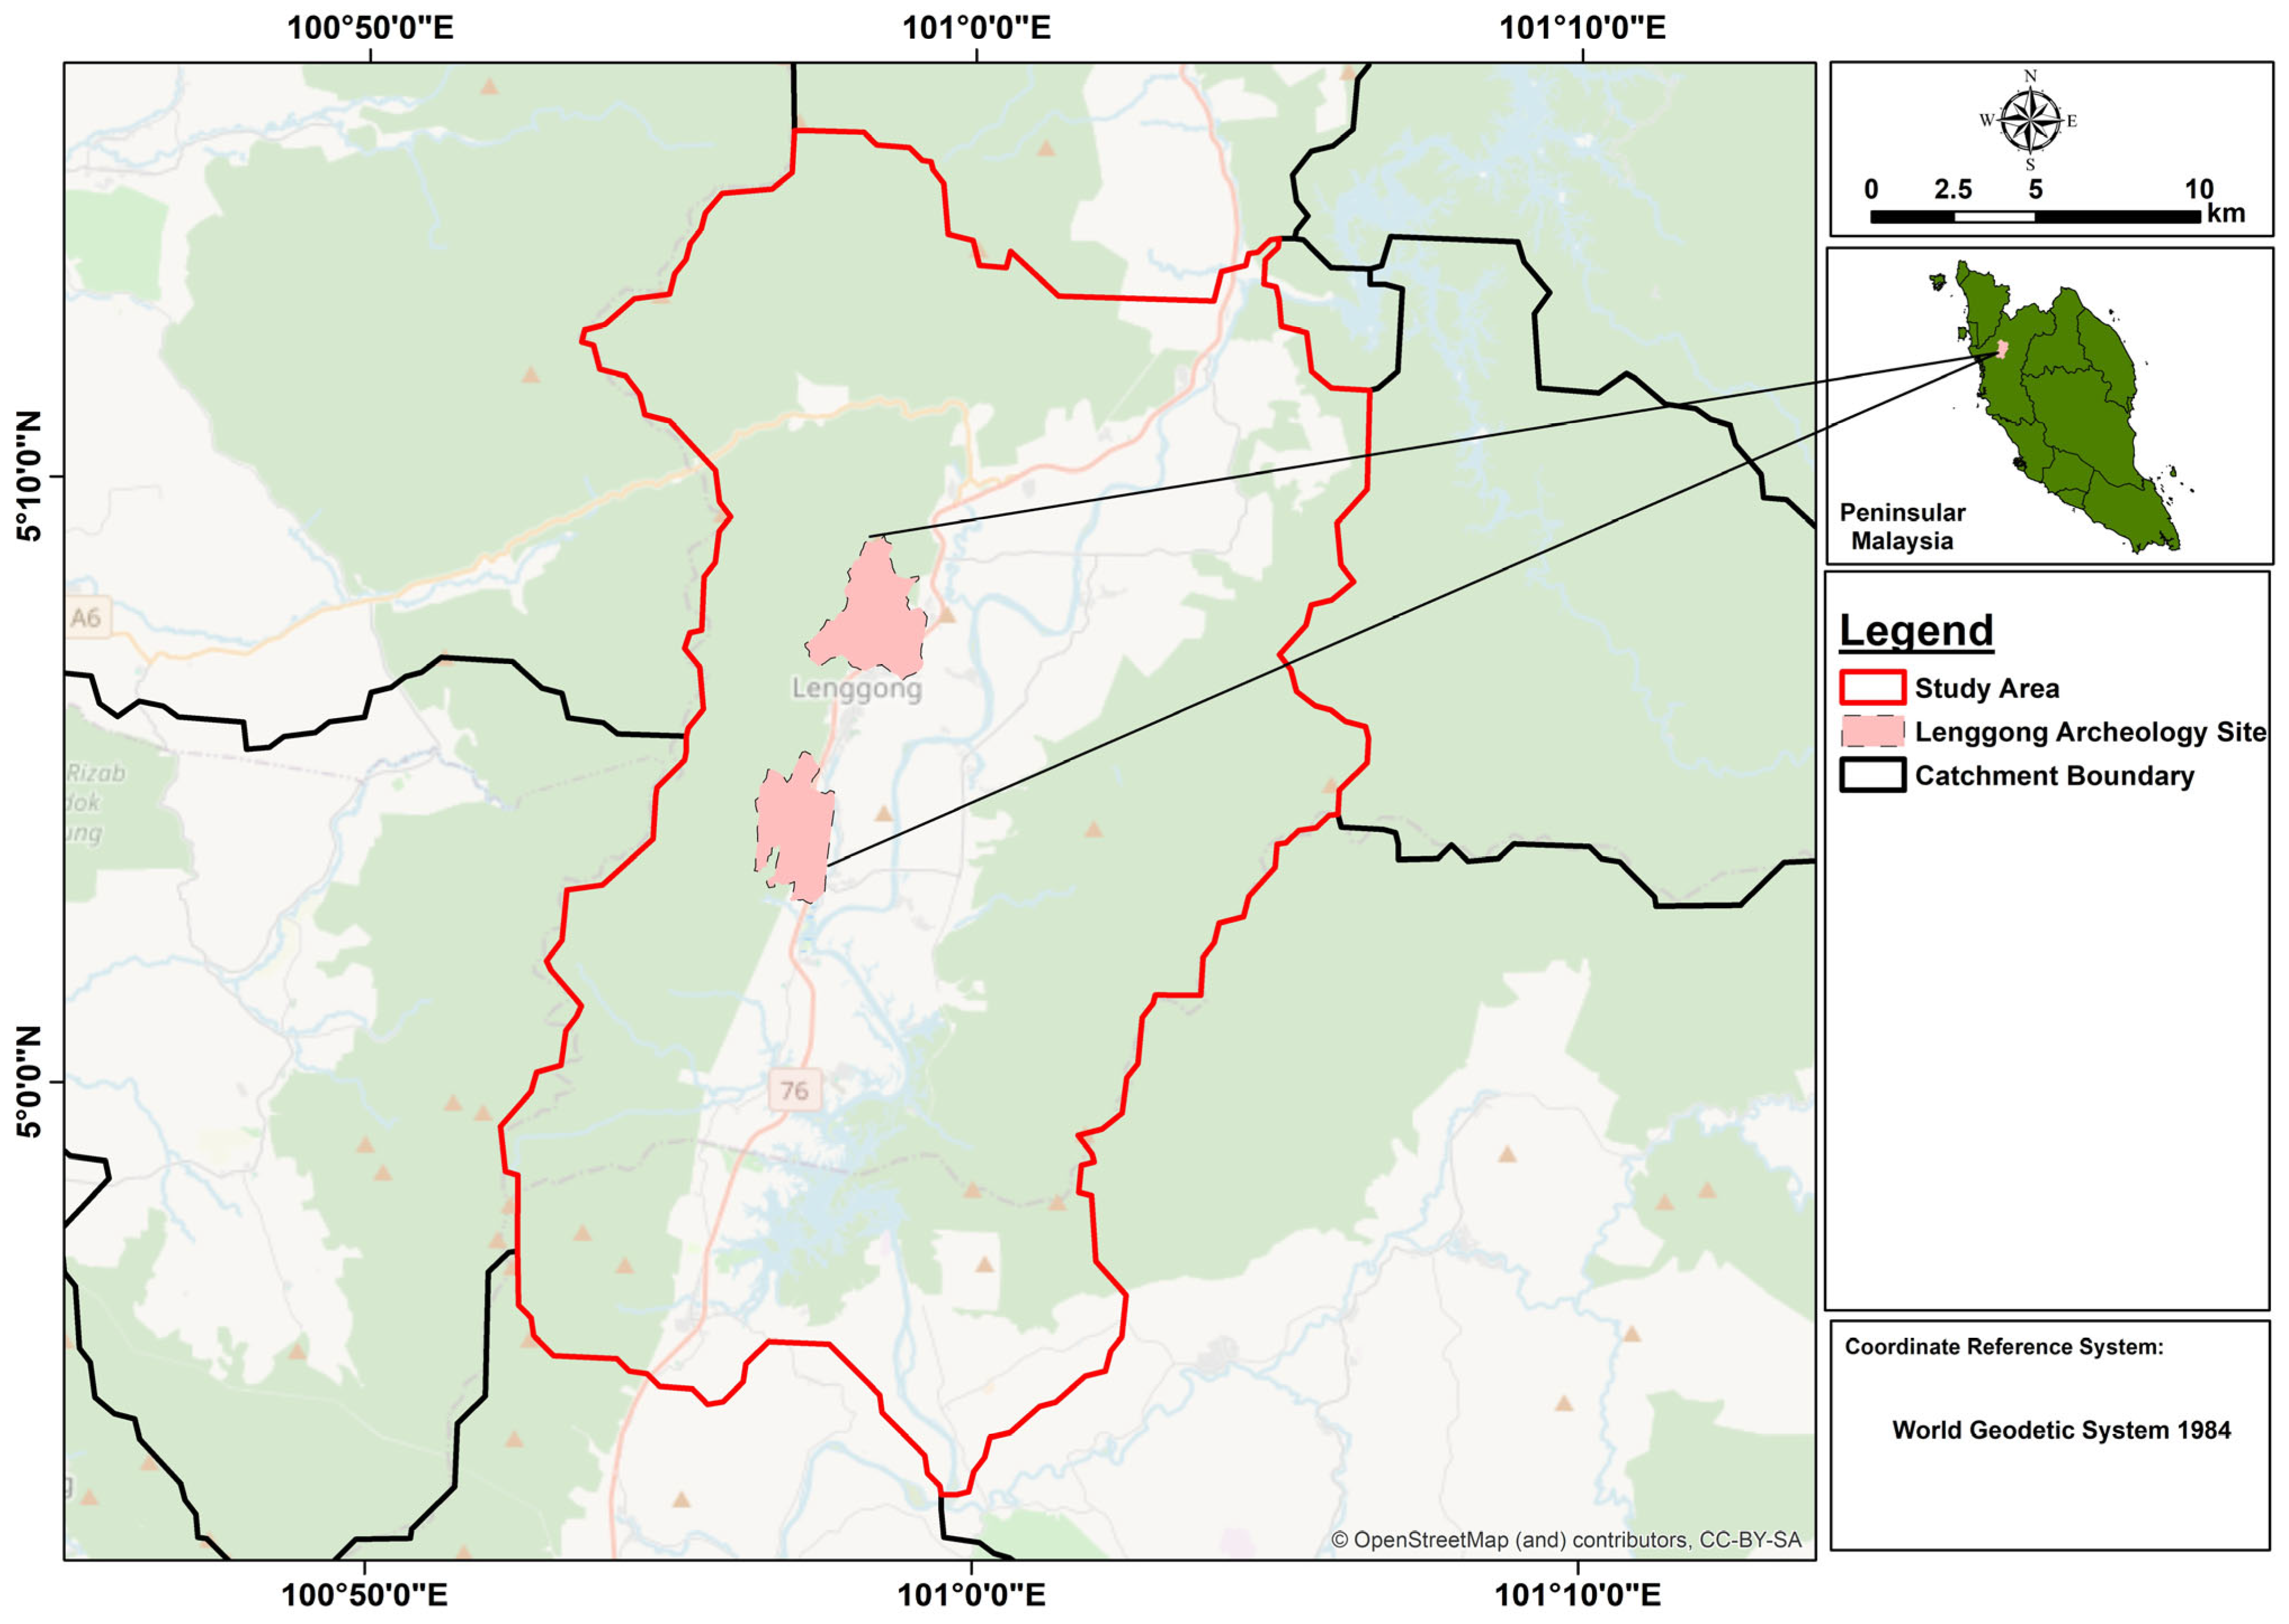
The study area of this research was the Lenggong Valley located within the upper part of the Sungai Perak catchment in the Hulu Perak District, Perak, Malaysia. The boundary was defined based on the Lenggong catchment, which is a sub-catchment of Sungai Perak. This hydrological delineation is crucial for understanding the interconnectedness of land use activities and water resource management within the heritage landscape, especially given the site’s unique geological and archaeological significance. The region’s rich paleontological record and the presence of significant archaeological finds, such as the Perak Man, underscore the necessity of a holistic approach to land use planning that accounts for both natural and cultural heritage [18]. Lenggong Valley is characterized by a combination of forested areas, agricultural land, settlements, limestone hills, caves, river systems, and rural landscapes. The complex interplay of these geographical features and human activities makes the Lenggong Valley a microcosm for studying the effects of development on a UNESCO World Heritage site, which requires a nuanced understanding of its ecological and cultural systems. Figure 1 shows the map of the study area.
The official recognition of Lenggong as a UNESCO Global Geopark in 2026 further strengthens its international status as an area with outstanding geological significance, biodiversity, and cultural heritage. Situated in the northern part of Perak State, Peninsular Malaysia [19], Lenggong Valley is one of the important prehistoric and archaeological landscapes in Malaysia. It was inscribed as an Archaeological Heritage on the UNESCO World Heritage List in 2012 due to its outstanding archaeological evidence, including open-air and cave sites along the Perak River that record a long sequence of human history from 1.83 million to 1700 years ago [20]. The valley is renowned for housing the oldest documented prehistoric human skeleton in Southeast Asia, reinforcing its global significance in understanding early human habitation and evolution [21]. The recognition as a UNESCO Global Geopark and a UNESCO World Heritage Site makes Lenggong Valley a highly sensitive landscape where land use change must be carefully monitored to support sustainable development, catchment management, and long-term protection of its archaeological, geological, and cultural values.

3. Methodology

3.1. Research Design

The methodological framework of this study was developed based on the 2000, 2010, and 2020 land use maps obtained from PlanMalaysia. All datasets were first clipped according to the Lenggong catchment boundary and reclassified into five major land use classes: water bodies, agriculture, forest, built-up areas, and vacant land. The built-up area class was produced by combining several developed land use categories, including industrial, commercial, residential, road and transportation, utilities, and public facilities. After reclassification, land use change detection was conducted for two periods (2000–2010 and 2010–2020) to identify areas that remained unchanged and those converted from one land use class to another. Subsequently, a transition matrix was generated to quantify the percentage of land use persistence and conversion for each period. It served as a foundational input for the subsequent modelling phases, particularly in calibrating transition potentials within the ANN–CA model.
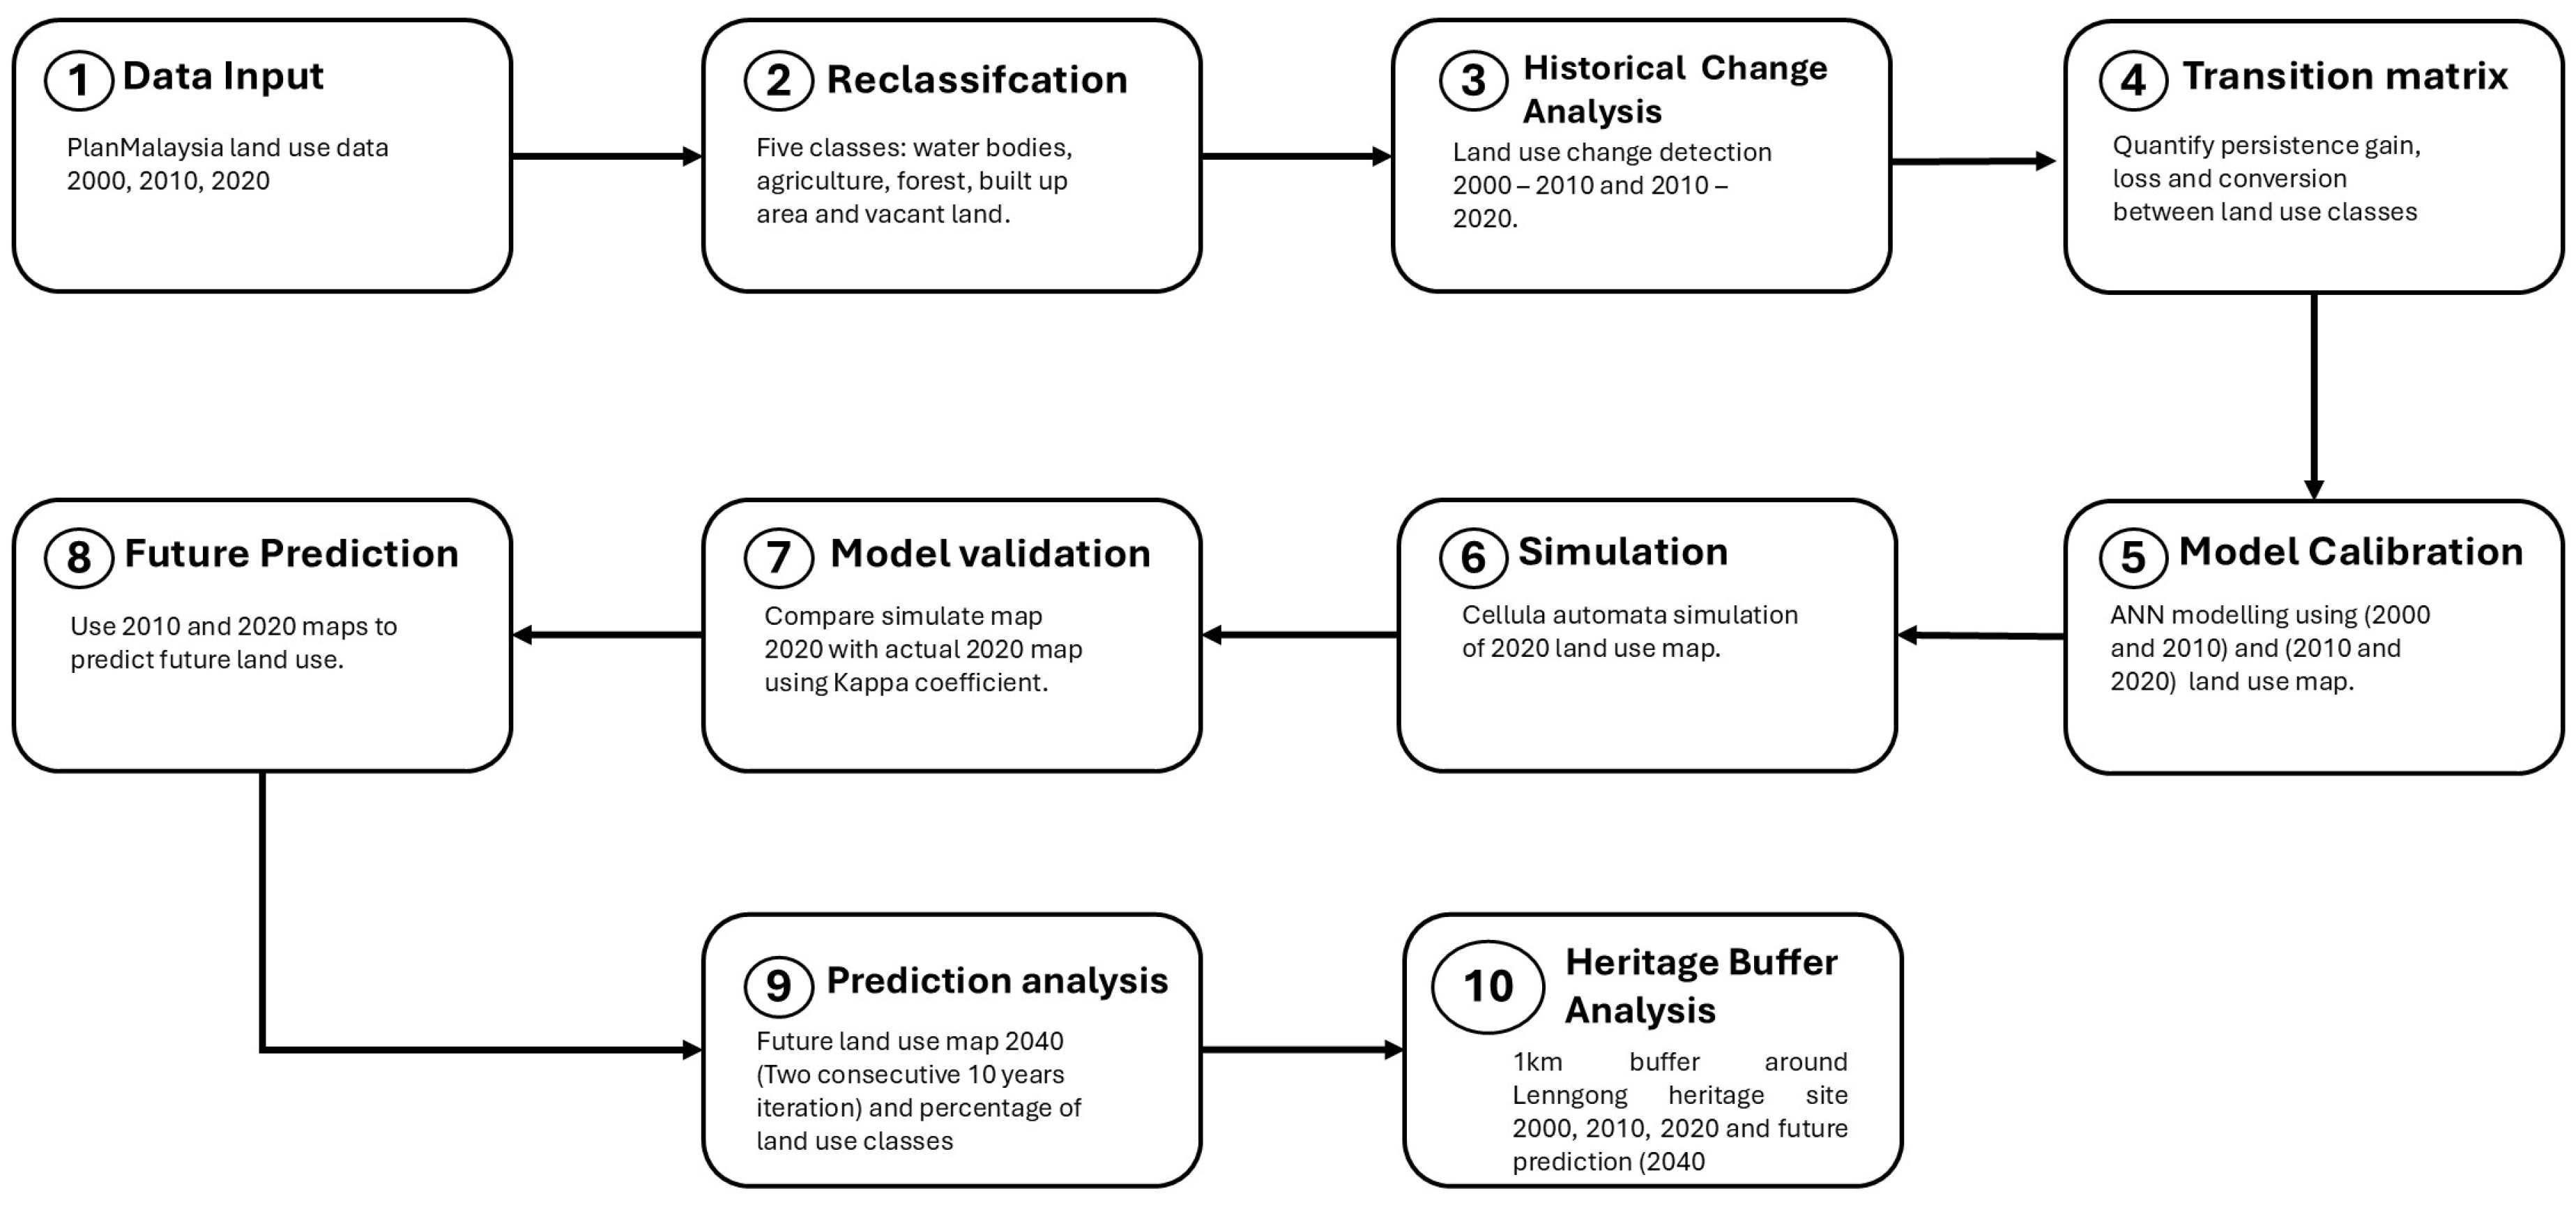
This land use prediction study used the MOLUSCE plugin 2.18.2 to model land use transition and simulate future land use patterns. It began by calibrating the ANN model using the 2000 and 2010 land use maps to generate transition potential and simulate the 2020 land use map. The simulated 2020 map was then compared with the actual 2020 PlanMalaysia land use map using the Kappa coefficient to evaluate model performance. After validation, the 2010 and 2020 land use maps were used to predict future land use patterns, as this period represents the most recent observed land use transition trend within the Lenggong catchment. Next, the predicted land use map was analyzed to calculate the percentage of each land use class and identify possible future land use trends. Finally, a 1 km buffer was generated around the Lenggong heritage site to compare land use patterns in 2000, 2010, 2020, and the predicted 2040 future scenario. This buffer analysis was conducted to assess land use pressure near the heritage area and support heritage-sensitive planning and conservation management. Figure 2 shows the overall methodological framework and flow of this study.

3.2. Data Sources and Land Use Classification

The primary datasets used in this study were the 2000, 2010, and 2020 land use maps obtained from PlanMalaysia. The datasets were originally provided in vector shapefile format and had no inherent raster spatial resolution. Before the ANN–CA analysis, the reclassified vector datasets were converted into raster format using a spatial resolution of 10 m × 10 m. All rasterized land use maps were standardized to the same coordinate reference system, spatial extent, cell size, and grid alignment to ensure spatial consistency during change detection, model calibration, validation, and future land use simulation. These datasets were selected because they provide official land use information suitable for analyzing historical land use change, model validation, and future land use prediction. The 2000 land use map served as the baseline dataset; the 2010 land use map represented the intermediate land use condition and supported model calibration; while the 2020 land use map was used as the latest observed land use condition and a reference dataset for model validation. All datasets were clipped based on the Lenggong catchment boundary, which is located within the Sungai Perak catchment. This catchment-based boundary ensured that land use changes were analyzed within a hydrologically meaningful spatial unit rather than merely administrative boundaries.
The 1 km distance was adopted as an analytical screening zone to assess land use pressure within the immediate surrounding landscape. Similar distance-based analysis has been applied at the Angkor UNESCO World Heritage Site, where 200 m, 500 m and 1000 m buffers were used to evaluate development encroachment around archaeological monuments, with the 1000 m zone capturing broader patterns of built-up expansion [22]. At the 10 m raster resolution, the selected distance encompasses 100 cells outward from the heritage boundary, providing an appropriate local landscape scale for comparing land use trajectories. The 1 km buffer was used only for spatial analysis and did not represent or modify the officially designated UNESCO or statutory buffer zone.
Prior to the land use change analysis, the original PlanMalaysia land use categories for 2000, 2010, and 2020 were reclassified into five major classes: water bodies, agriculture, forest, built-up areas, and vacant land. This reclassification was conducted to simplify the land use categories and to ensure consistency across the three datasets. The water bodies classes included rivers, lakes, reservoirs, and other surface water features. The agriculture class represented cultivated land, plantations, and other farming-related areas. The forest class entailed natural forest and forested land, while the vacant land class referred to open, unused, idle, or undeveloped land. Meanwhile, the built-up areas class was aggregated from several developed land use categories, including industrial, commercial, residential, road and transportation infrastructure, utilities, and public facilities. This aggregation enabled a more generalized assessment of built-up expansion and its potential impact on the surrounding environment and heritage landscape within the Lenggong catchment. Table 1 shows the land use classification scheme used in this study.

3.3. Land Use Change Analysis

Land use change analysis was conducted to identify spatial and percentage changes across the 2000, 2010, and 2020 land use maps. Following the reclassification of the datasets into five major land use classes (water bodies, agriculture, forest, built-up areas, and vacant land), the maps were overlaid to detect areas of persistence and conversion. In this study, the land use change analysis was done using the MOLUSCE plugin in QGIS 2.18.20. The analysis was conducted for two intervals: 2000–2010 and 2010–2020. The 2000 land use map was used as the initial land use condition for the first period, while the 2010 land use map represented the final condition. For the second period, the 2010 land use map was used as the initial condition, while the 2020 land use map represented the latest observed land use condition. This process allowed the examination of land use transformation across two consecutive decades.
Subsequently, a transition matrix was generated for each period to quantify the percentage of land use change. In the matrix, diagonal values represented land use persistence (e.g., forests remaining as forests or agriculture remaining as agriculture), while off-diagonal values indicated land use conversion (e.g., agriculture to built-up areas or forest to built-up areas). The transition matrix was used to identify the dominant land use changes and determine which land use classes experienced the most gain or loss during each period. Results from the 2000–2010 analysis were utilized for model calibration and simulation of the 2020 land use map, while the 2010–2020 transition was later used as the basis for future land use prediction using the ANN–CA model. This approach enabled the validation of the model before generating future land use scenarios around the Lenggong UNESCO heritage landscape.

3.4. ANN-CA Land Use Prediction

Land use prediction was conducted using the ANN–CA approach in the MOLUSCE plugin. The ANN model was first calibrated using land use changes observed between 2000 and 2010. The 2000 land use map was used as the initial land use condition, while the 2010 land use map served as the final land use condition for model training. The ANN calibration employed the spatially corresponding cells from the 2000 and 2010 land use raster maps that constituted five categorical land use classes: water bodies, agriculture, forest, built-up areas, and vacant land. The observed land use class in 2000 represented the initial state, whereas the corresponding class in 2010 denoted the transition outcome used for model training. No additional external spatial driving variables (e.g., elevation, slope, population density, or proximity to roads and rivers) were included in the present model. Since the spatial allocation of the predicted transitions was influenced by cellular automata neighborhood effects, the transition potential output served as a critical input for the CA model that dynamically simulated future land use configurations by applying spatial rules derived from ANN [23]. The transition-potential model was implemented using the multilayer perceptron ANN available in MOLUSCE. The network architecture consisted of an input layer representing the land use transition inputs, one hidden layer containing 10 neurons, and an output layer illustrating the estimated transition potentials among the five land use classes. A neighborhood size of 1 pixel, equivalent to 10 m based on the raster resolution, was applied to account for the immediate spatial context of each cell. The learning rate, momentum coefficient, and maximum number of training iterations were set to 1.0, 0.050, and 1000, respectively. These parameters were maintained during model calibration and validation. The output from this process was a transition potential map that indicated areas with a higher probability of future land use conversion. This approach is particularly robust for simulating future land use changes due to its ability to incorporate multiple driving factors and accurately depict nonlinear spatial stochastic processes [24].
After the ANN transition potential was generated, CA was applied to simulate the 2020 land use map based on the 2000–2010 transition. The simulated 2020 map was then compared with the actual 2020 PlanMalaysia land use map during the validation stage. Once the model performance was considered acceptable, the 2010 and 2020 land use maps were used to predict future land use patterns. This period was selected for future prediction because it represents the most recent observed land use transition trend within the Lenggong catchment. The ANN transition potential map was combined with CA simulation to produce the future land use prediction map, which was particularly useful for calculating the percentage of each land use class and assessing possible future land use pressure around the Lenggong UNESCO heritage landscape.

3.5. Model Validation

The ANN–CA land use prediction model was validated to determine its reliability. Both the simulated land use map and the observed reference land use map were compared as part of the validation procedure to evaluate the model’s efficacy in replicating real land use patterns. The validation involved quantitative statistical methods, specifically the Kappa coefficient, to assess the agreement between the simulated and observed land use maps [25], with good agreement indicating that the model is suitable for generating future land use predictions for the Lenggong catchment.
Meanwhile, the model’s accuracy was assessed using the Kappa coefficient. Such a method is widely used in land use modeling as it quantifies the degree of agreement between two maps while taking into consideration any agreement that might occur due to unforeseen circumstances. A higher Kappa value signifies improved model performance and more consistency between the simulated and reference maps. Once the model achieved an acceptable validation result, the ANN–CA methodology was incorporated to produce the expected land use prediction map. A Kappa coefficient value exceeding 0.6 is generally considered to represent good or strong agreement, affirming the model’s robustness for projecting future land cover changes [26].

4. Result and Discussion

4.1. Land Use Distribution 2000, 2010 and 2020

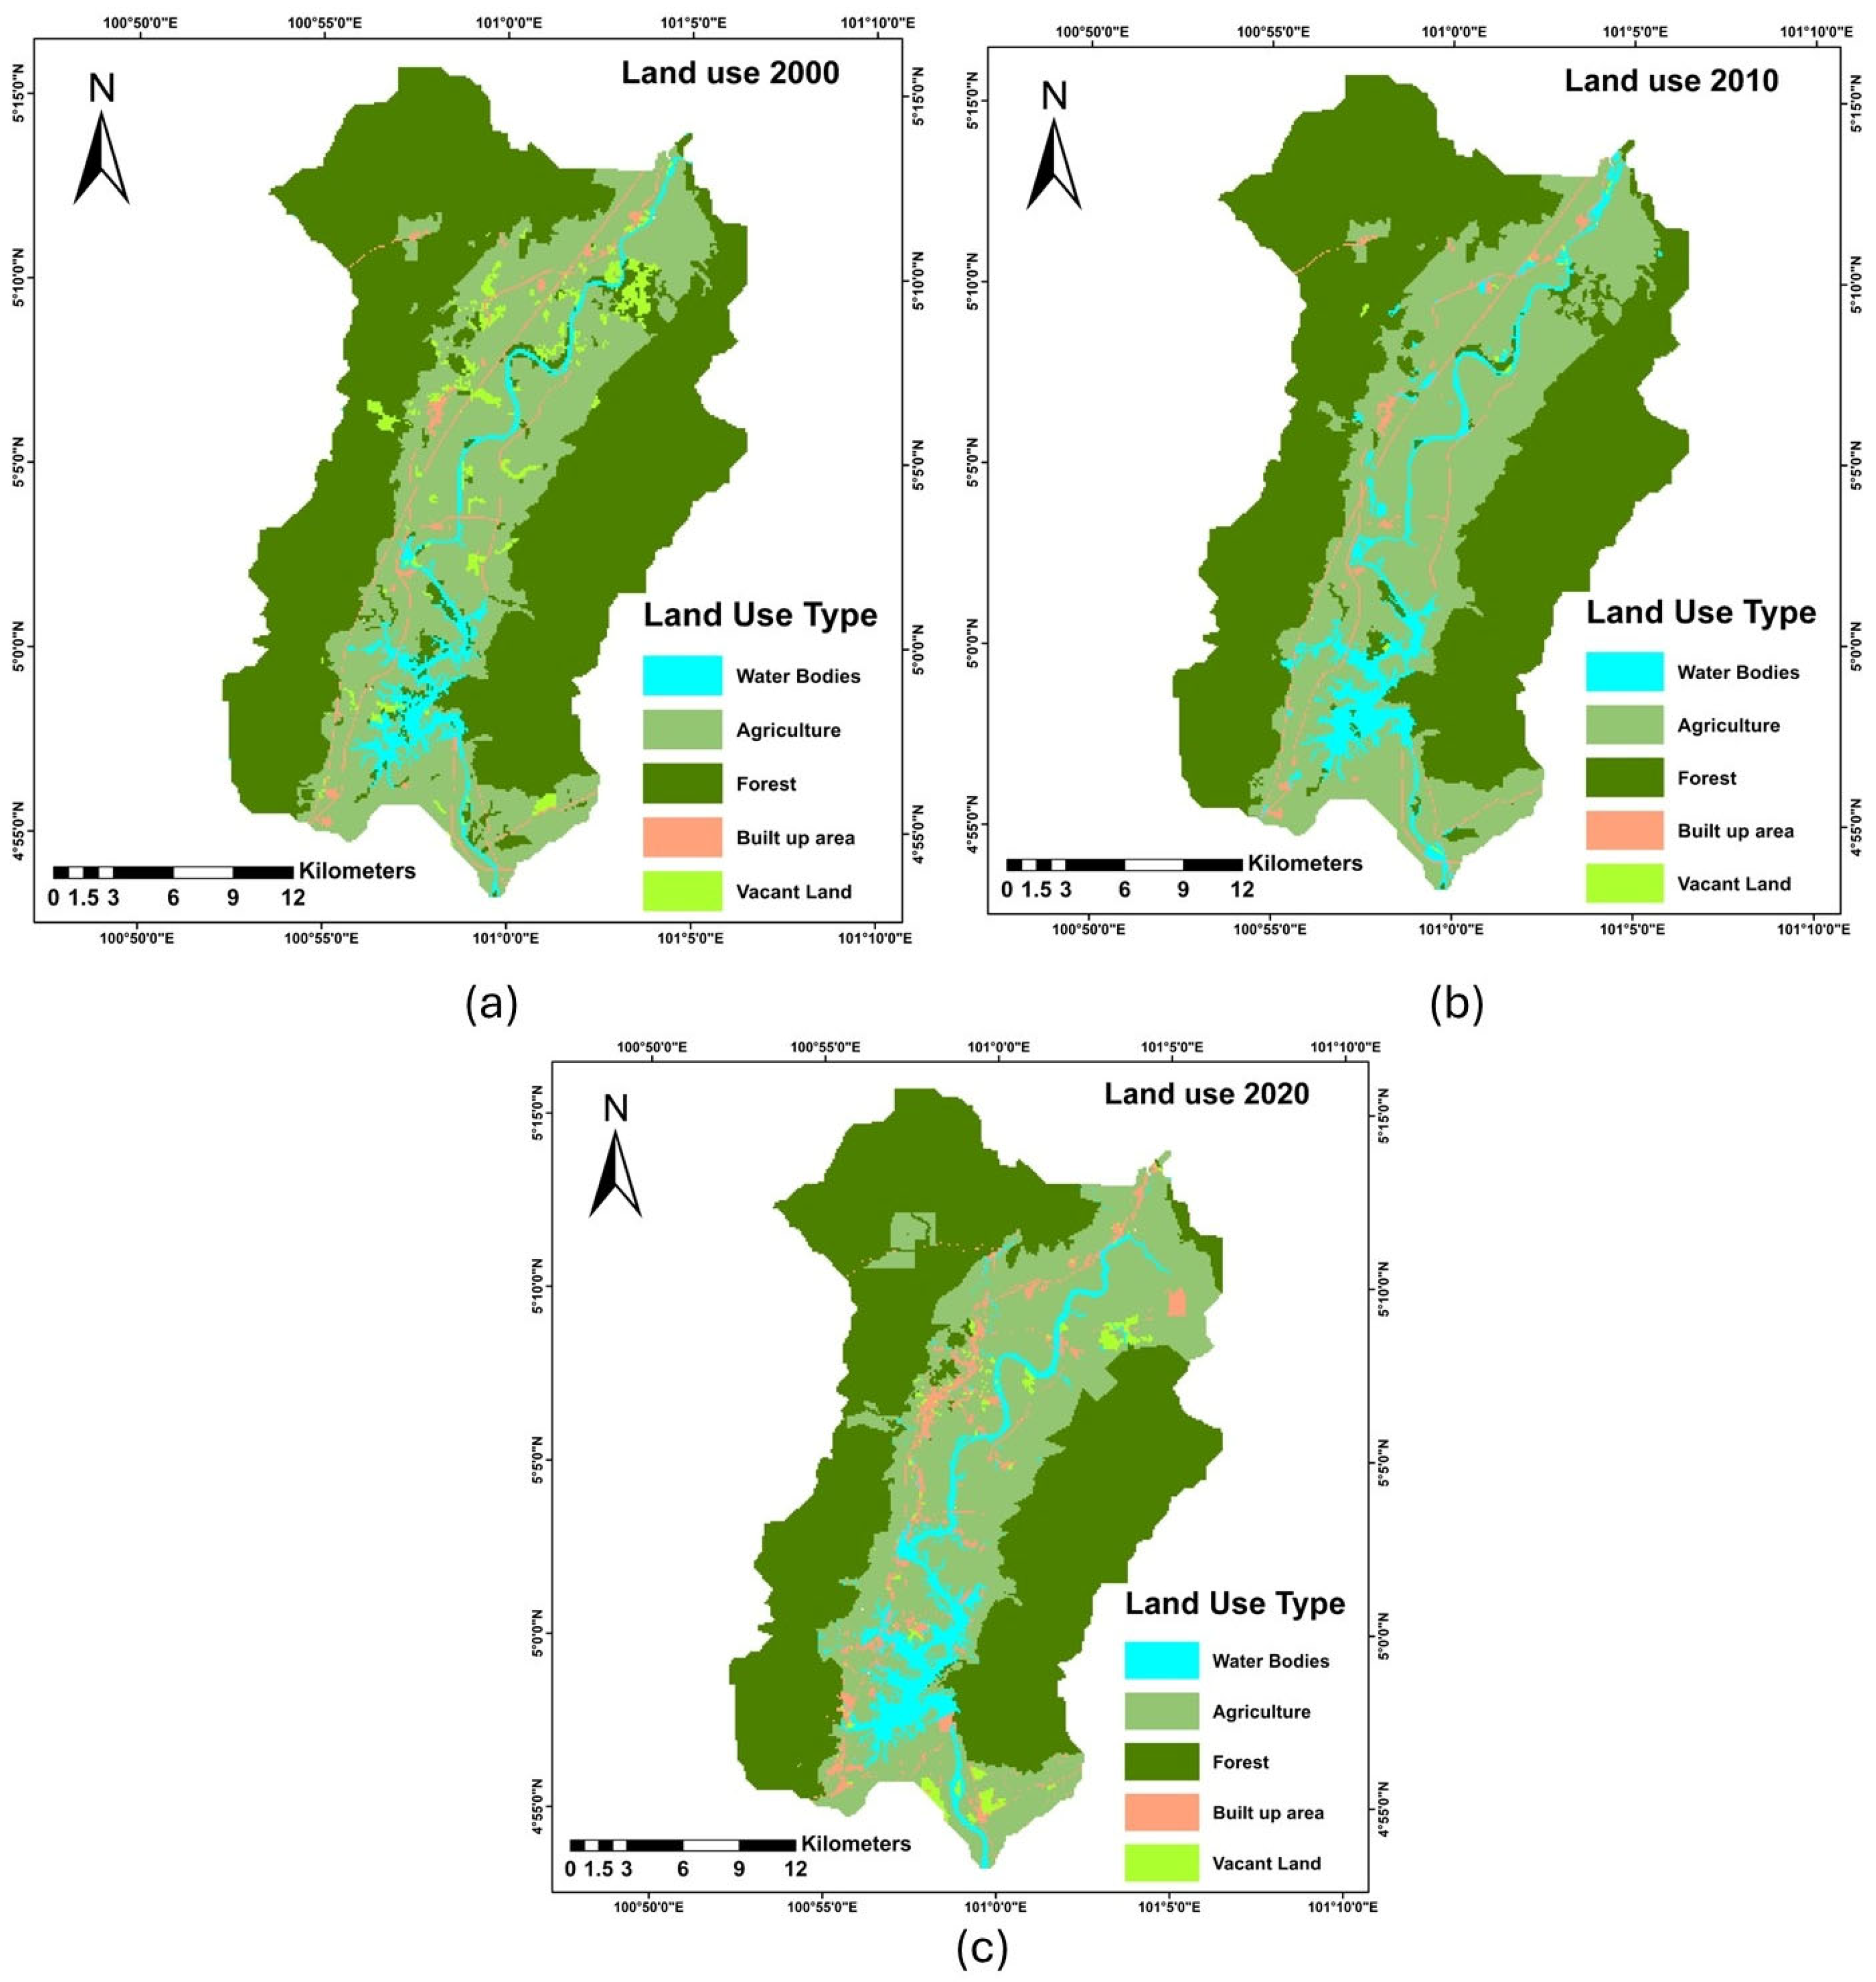
The land use distribution showed that forest was the dominant land use class throughout the study period, although its total area gradually decreased from 395,718,400 m2 (58.9%) in 2000 to 389,958,800 m2 (58.1%) in 2010 and 365,311,100 m2 (54.4%) in 2020. This indicates a continuous reduction in forested areas in the Lenggong catchment over the two decades. Agriculture was the second largest land use class with a gradual increase from 223,487,000 m2 (33.3%) in 2000 to 236,216,200 m2 (35.2%) in 2010 and 238,382,100 m2 (35.5%) in 2020. The spatial maps also demonstrated that agricultural areas were mainly concentrated in the central valley and lowland areas of the catchment, while forest areas remained dominant along the surrounding upland and hilly regions. Figure 3 illustrates the land use map distribution with (a) land use in 2000, (b) land use in 2010, and (c) land use in 2020.
Other land use classes showed smaller but important changes. Water bodies increased from 24,284,700 m2 in 2000 to 32,766,800 m2 in 2010 and 36,941,300 m2 in 2020, representing an increase from 3.6% to 5.5% of the total catchment area. Built-up areas remained relatively stable between 2000 and 2010, decreasing slightly from 12,233,100 m2 to 12,051,600 m2, before increasing substantially to 23,268,300 m2 in 2020. It indicates that built-up expansion became more evident during the 2010–2020 period, increasing from 1.8% to 3.5% of the catchment area. Meanwhile, vacant land had a steep reduction from 16,032,500 m2 in 2000 to only 762,300 m2 in 2010, before increasing to 7,852,900 m2 in 2020. Overall, the results suggest that the Lenggong catchment experienced gradual landscape transformation mainly characterized by forest reduction, agricultural expansion, growing water bodies, and notable built-up growth after 2010. These changes are important because they reflect increasing land use pressure within a heritage-sensitive catchment surrounding the Lenggong UNESCO landscape. Such land use transitions often reflect the competing pressures of agricultural intensification and rapid urbanization on the region’s natural ecosystems [27]. Table 2 shows the distribution and percentage of land use classification across 2000, 2010, and 2020.

4.2. Land Use Change Transition

The transition matrix for 2000–2010 shows that forest and agriculture were the most persistent land use classes in the Lenggong catchment. Forest recorded the highest persistence, with 56.4% of the catchment remaining as forest in 2010, followed by agriculture with 29.4%. This indicates that the overall landscape during this period remained largely dominated by forest and agricultural land. However, several important land use conversions were observed. The largest conversion from water bodies was to agriculture, accounting for 1.0%, while agriculture experienced conversions to water bodies, forest, and built-up areas. Conversion to agriculture also encompassed forest (1.9%) and vacant land (1.9%), indicating that some forested and open or unused areas were brought into agricultural use. Overall, the 2000–2010 period was mainly characterized by relatively stable forest and agriculture, with moderate conversion between natural, agricultural, and developed land uses. It suggests that the 2010–2020 interval exhibited a more aggressive shift in landscape dynamics, with forest persistence dropping markedly while conversions to agriculture and built-up areas accelerated. This mirrors trends in other Malaysian catchments, such as the Perak River catchment, where dense forests declined substantially amid rapid barren and urban expansion from 2000 to 2020 [2], and the Selangor state, which saw built-up land increase by 7.5% from 1999 to 2017 alongside natural vegetation loss [28]. Table 3 shows the transition matrix of land use changes between 2000 and 2010.
However, the 2010–2020 transition matrix indicates stronger land use transformation, especially involving agriculture and built-up areas. While agriculture remained an important class that constituted 28.2% of the catchment in 2020, it also recorded the greatest total change at 7.2%, with conversions to water bodies, forest, built-up areas, and vacant land. The 2.3% increase in agriculture’s conversion into built-up areas further suggests greater pressure to develop during this period. Moreover, forest remained the largest persistent class at 52.4%, but it also experienced conversion to agriculture, built-up areas, and vacant land. Compared with the earlier period, built-up expansion became more visible after 2010, reflecting increased development within the catchment. Overall, the land use change results show that the Lenggong catchment experienced gradual but clear landscape transformation from 2000 to 2020, mainly involving forest reduction, agricultural adjustment, and expansion of built-up areas. This pattern is important because land use change around the Lenggong UNESCO heritage landscape may influence environmental quality, catchment condition, and heritage-sensitive planning. Specifically, the intensification of built-up areas and the systematic conversion of agricultural land highlight a critical shift toward urban-induced landscape modification [29]. To further quantify these spatial dynamics, a transition matrix can highlight the specific class-to-class trajectories, where the non-diagonal entries reveal the precise area diverted from one land use system to another [30]. Table 3 illustrates the transition matrix of land use for 2000–2010 and 2010–2020.

4.3. Model Validation Using Kappa

The ANN–CA simulation generated a high degree of agreement for both calibration periods. The Kappa validation value for 2000–2010 was 0.94, with a minimal validation error of 0.01. This suggests a significant degree of agreement between the model and the observed land use shift. Meanwhile, the Kappa validation value for 2010–2020 was 0.902, while the lowest validation error was 0.01289. It denotes a very strong agreement between the simulated and observed land use patterns, although being somewhat lower than the 2000–2010 timeframe. These findings show that the ANN model was successful in capturing the transition behavior of the main land use classifications, especially the persistence of agriculture and forests. This high level of accuracy underscores the reliability of the ANN–CA framework to effectively model complex spatiotemporal LULC transitions, even as development pressures intensify within the region [31].
Further validation using the simulated 2020 land use map also revealed an overall validation accuracy of 83.1%. The Kappa overall score of 0.71 indicated a significant degree of agreement between the simulated and real 2020 land use maps. The model was also proven effective in estimating the number or percentage of land use classes, as evidenced by the Kappa histogram value of 0.93. The Kappa location value of 0.75 further demonstrated the model’s satisfactory agreement in the spatial distribution of land use classes.
Additionally, the multiple-resolution budget obtained increasing agreement values throughout resolution levels. It suggests that model performance increases when spatial comparison is evaluated at larger neighborhood sizes. Overall, these validation results show that the ANN–CA model is capable of accurately predicting future patterns of land use in the Lenggong catchment. These metrics also surpass the minimum threshold of 0.80 generally required for robust land use prediction, confirming the model’s suitability for simulating future landscape trajectories under various developmental scenarios [32]. Building upon this validation, the transition potential matrix derived from these calibrated parameters provides the foundation for forecasting future land-cover states, ensuring that simulations remain consistent with historical conversion trends [33]. Table 4 shows the Kappa validation results from the land use prediction model.

4.4. Future Land Use Prediction

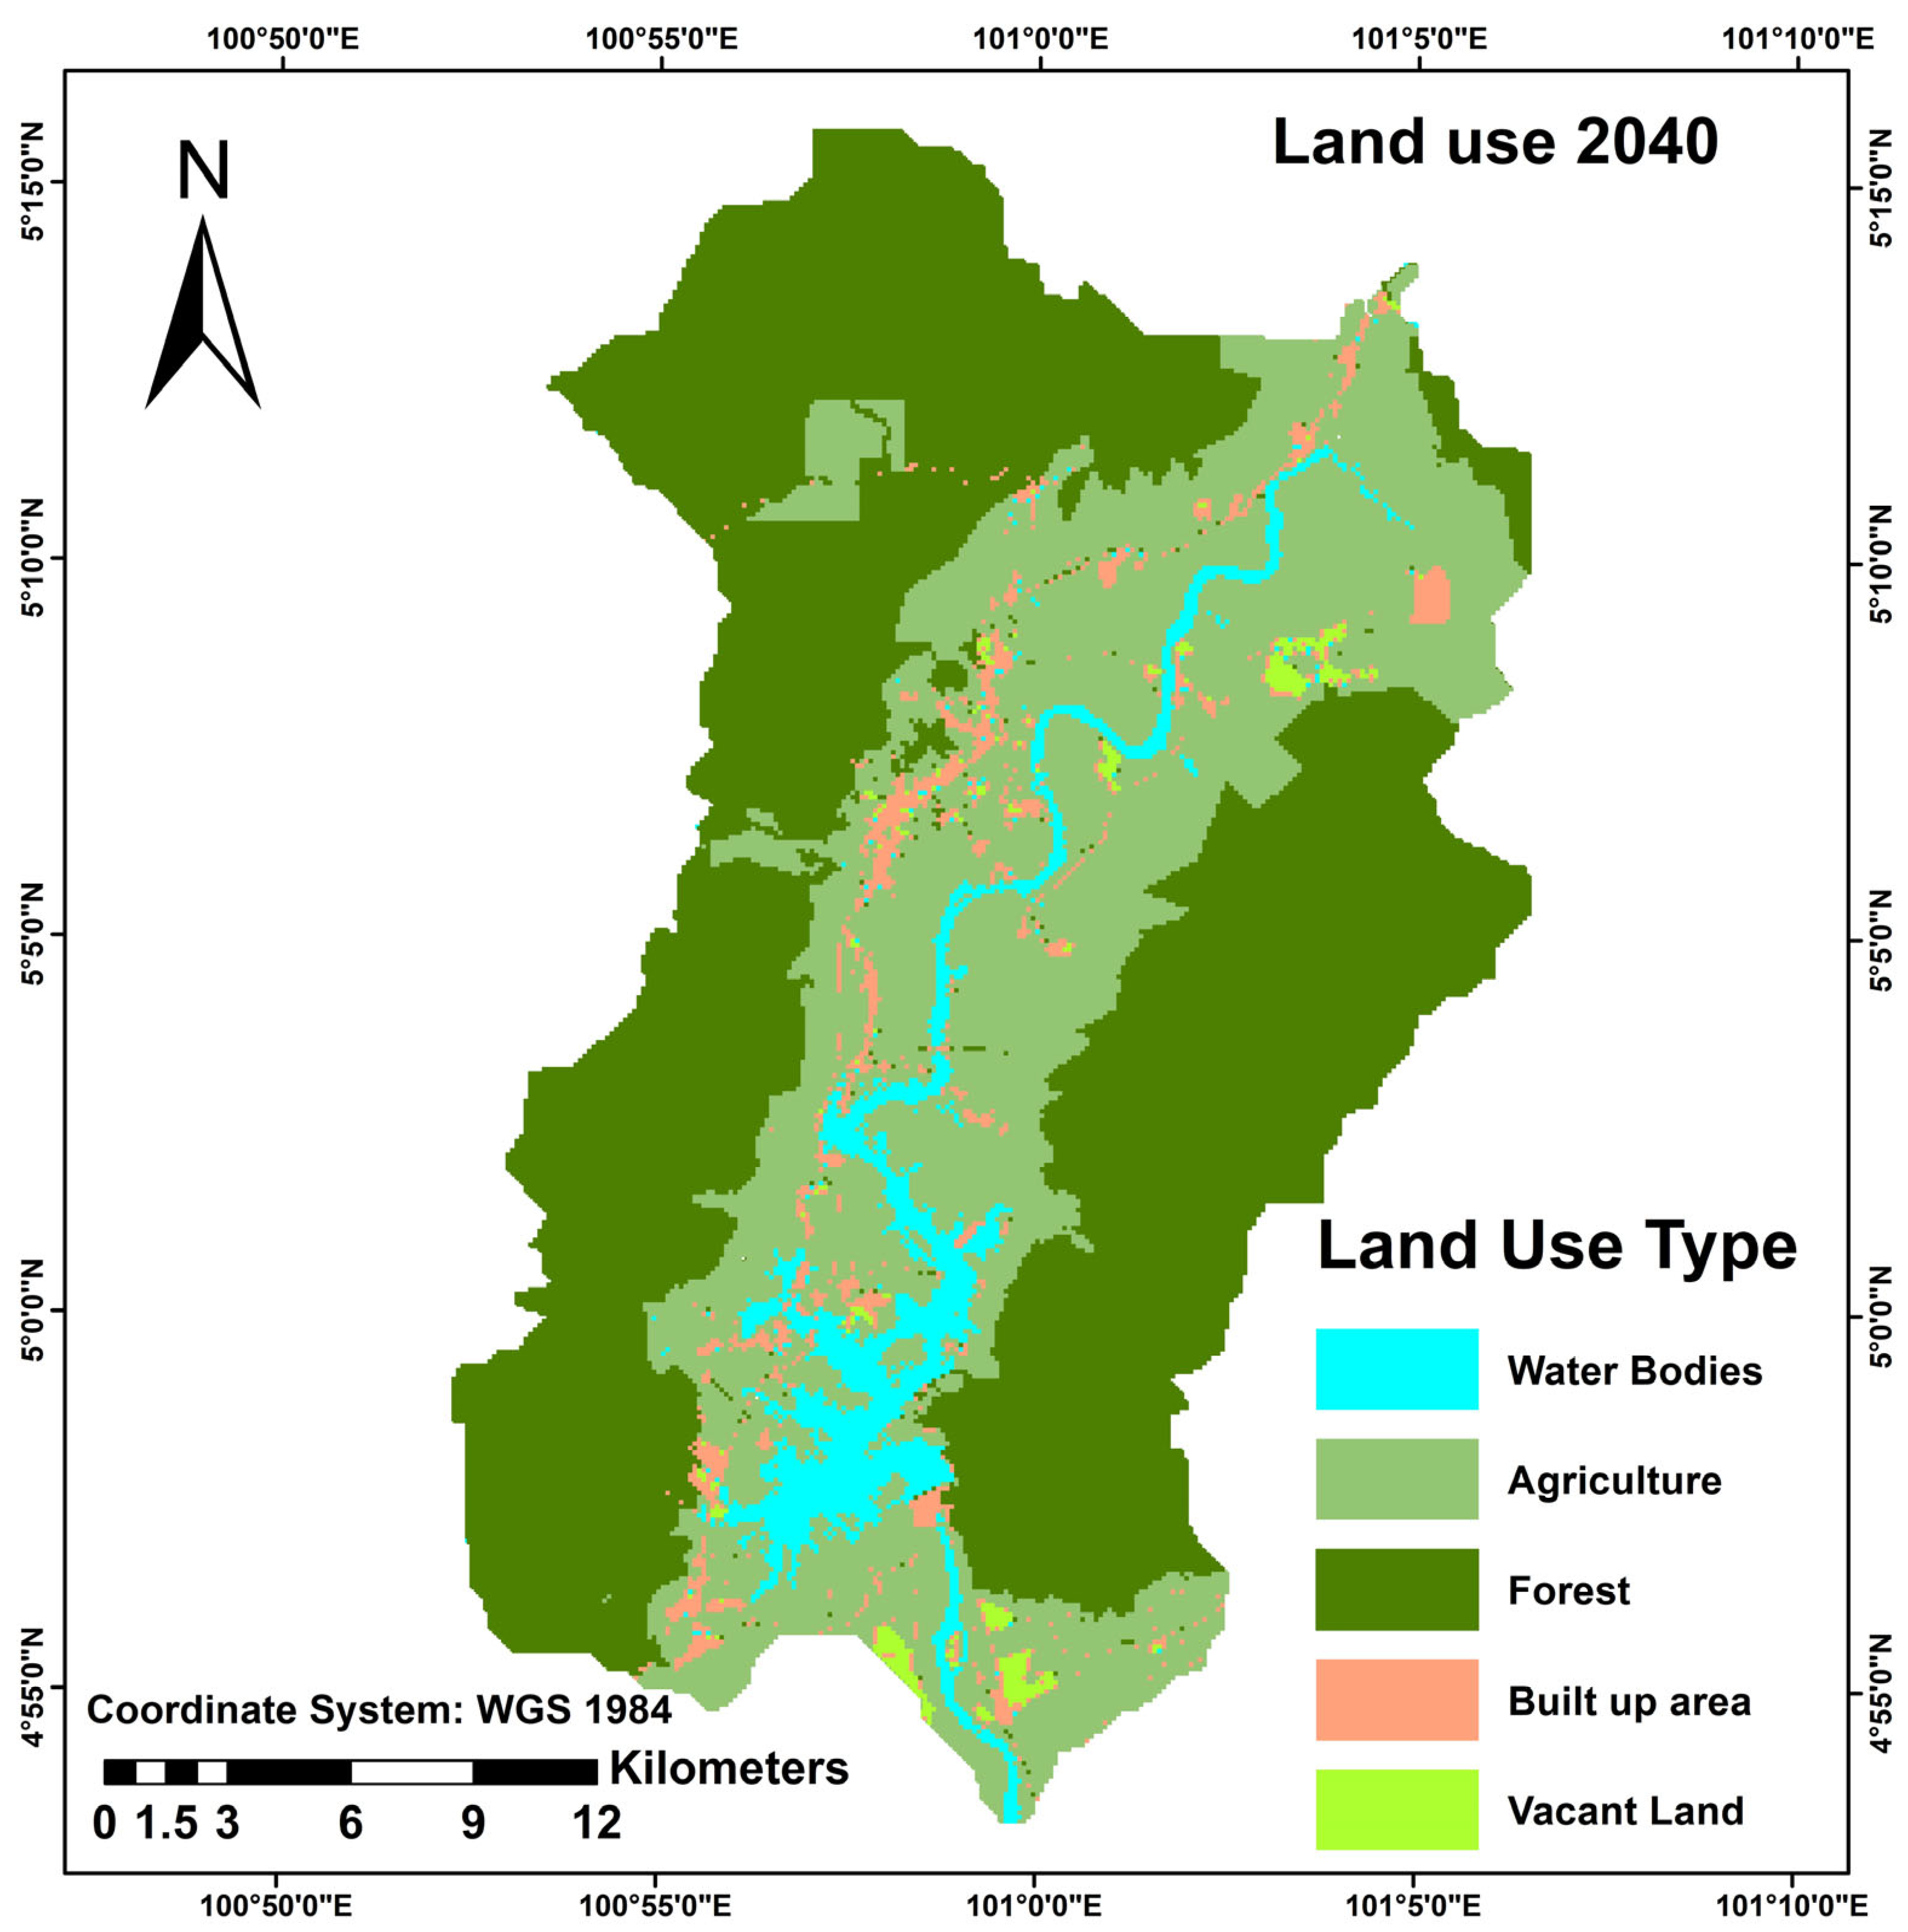
The land use prediction map for 2040 shows that the Lenggong catchment is expected to remain dominated by forest and agricultural areas. Forest is projected to cover the largest proportion of the catchment, accounting for 54.1% of the total area. This is slightly lower than the forest area in 2020 (54.4%), indicating a small, continued reduction in forest cover. Agriculture is predicted to become the second dominant land use class, increasing to 36.1% from 35.5% in 2020. The observed and predicted trajectories can be interpreted in relation to the spatial characteristics of the Lenggong catchment. Agricultural land is concentrated mainly in the central valley and accessible lowland areas, where gentler terrain and proximity to existing cultivated land may facilitate the continuation or expansion of agricultural activities. The projected increase in agriculture reflects the persistence of established rural land use practices and incremental conversion at the margins of existing agricultural areas. Similarly, built-up expansion is spatially associated with existing settlements and previously developed land, suggesting an outward extension of established development rather than an entirely isolated pattern of growth. However, these findings should be interpreted with caution since the current model does not account for socioeconomic drivers, infrastructure investments, land ownership, or planning approvals as explanatory variables. Furthermore, the available PlanMalaysia data do not allow the increase in built-up land to be attributed reliably to individual residential, commercial, industrial, or transportation subcategories. The spatial distribution shown in the prediction map suggests that agricultural land remains concentrated mainly in the central valley and lowland areas, while forest continues to dominate the surrounding upland and hilly areas of the catchment. Figure 4 shows the land use prediction map for 2040 generated using ANN–CA.
Table 5 shows the predicted land use distribution for 2040 in the Lenggong catchment. Built-up areas are predicted to increase from 3.5% in 2020 to 3.8% in the future scenario. The increase, although small, indicates significant development pressure in the Lenggong catchment, especially near settlements, roads, and areas adjacent to built-up areas. Water bodies are also predicted to cover 5.2%, denoting a slight reduction compared to 5.5% in 2020, while vacant land is expected to decrease from 1.2% in 2020 to 0.9%. Overall, the prediction results suggest that future land use change in the Lenggong catchment will likely be characterized by gradual agricultural and built-up expansion, minor forest reduction, and decreasing vacant land. It aligns with established long-term trends, where the escalation of human-triggered landscape change frequently requires strict scenario-based planning for balancing heritage preservation with regional economic development [34]. This pattern is important for heritage-sensitive planning because even small increases in built-up areas near the Lenggong UNESCO heritage landscape may influence environmental quality, landscape character, and long-term conservation management. The findings also support previous studies advocating the significance of landscape predictions for identifying areas vulnerable to fragmentation from ongoing conversion pressures [35].

4.5. Implications for Heritage Landscape Management

The 1 km buffer analysis surrounding the Lenggong heritage area shows significant changes in land use within the surrounding environment. Agriculture remained a dominant land use within the buffer area, but its proportion declined from 48.7% in 2000 to 47.8% in 2010 and 45.3% in 2020 and is projected to decrease to 44.8% in the future scenario. The forest area exhibited a decreasing trend from 41.6% in 2000 to 39.7% in 2020, with an anticipated further reduction to 38.6% in the projected scenario. The proportion of vacant land also dropped from 4.9% in 2000 to 1.9% in 2020, with predictions indicating a further reduction to 1.1% in the future. These changes indicate that the land surrounding the heritage site is increasingly utilized, which may result in reduced vacant land over time.
The most significant change within the 1 km buffer is the expansion of developed areas. Developed land increased from 3.6% in 2000 to 4.2% in 2010 and 10.5% in 2020. Future predictions show that developed areas may expand to 13.2%. This pattern indicates increasing developmental pressure in the Lenggong heritage region, which can be attributed to community expansion, road construction, tourism facilities, utilities, public infrastructure, and other services. From the heritage landscape management perspective, urban expansion is not necessarily negative since infrastructure is essential for enhancing accessibility, visitor facilities, tourism attractions, safety, and local economic advantages. However, such development must be carefully managed to avoid adverse impact on the archaeological context, visual landscape character, environmental integrity, or long-term conservation significance of the Lenggong cultural landscape. In this context, integrating archaeological impact assessments into local planning frameworks can ensure that future development does not compromise the preservation of the landscape’s unique heritage assets [36]. Furthermore, adopting an integrated management model that accounts for the “spread–integrate–connect” patterns typical of urban fringe development can provide a framework to reconcile these protection mandates with regional economic requirements [37]. Table 6 shows the land use distribution within the 1 km buffer zone surrounding the Lenggong heritage area for 2000, 2010, 2020, and the future projected scenario 2040.
Previous land use prediction studies at other UNESCO World Heritage Sites have identified similar pressures. In the Angkor region of Cambodia, CA–Markov modelling projected continued built-up expansion associated with tourism and road-oriented development, with increasing encroachment around monuments and protected buffer zones [38]. At the Kaziranga World Heritage Site in India, CA–Markov predictions demonstrated continued transitions in built-up land, agricultural areas, grassland, forest and water bodies within the surrounding eco-sensitive zone [38]. Similarly, the modelling of the Ngorongoro World Heritage Site in Tanzania projected increases in cultivated and built-up land accompanied by reductions in forest and woodland under a business-as-usual scenario [22]. These international findings are consistent with the predicted agricultural and built-up expansion in Lenggong and demonstrate the value of land use modelling as an early-warning tool for protecting sensitive heritage landscapes.
Recent advances in spatial land use planning demonstrate that predictive mapping can be extended into more transparent and operational decision-support frameworks. Adiguzel et al. integrated fuzzy multi-criteria evaluation, CatBoost, SHapley Additive exPlanations (SHAP), and the Non-dominated Sorting Genetic Algorithm II (NSGA-II) to identify the environmental and anthropogenic factors influencing zoning decisions and to optimize trade-offs among conservation, controlled use, and development priorities [39]. Similarly, Esen et al. developed a hybrid framework combining expert-derived rules and explainable machine learning to translate socio-ecological indicators into operational zones for strict conservation, managed use, development guidance, and restoration [40]. Compared with these decision-oriented approaches, the ANN–CA model applied in the present study primarily identifies the probable spatial trajectories of land use change by 2040 but does not explain the relative contribution of individual driving variables or optimize land allocation among competing planning objectives. Therefore, future research should integrate SHAP-based interpretation, expert-defined planning constraints, and multi-objective optimization with ANN–CA predictions to convert projected land use pressure into transparent and heritage-sensitive zoning recommendations for the Lenggong catchment.
The buffer analysis highlights the significance of heritage-sensitive planning within the surrounding 1 km area. The expansion of agriculture and built-up land may have implications for the OUV of the Archaeological Heritage of the Lenggong Valley. The property is recognized under Criteria (iii) and (iv) for its exceptional evidence of human occupation from the Palaeolithic to later prehistoric periods and undisturbed in situ stone-tool workshops associated with ancient river gravel beds and palaeolake environments. Further agricultural expansion, particularly intensive plantation development, may alter the traditional and visual landscape setting, increase soil disturbance and erosion, and affect areas with potential undiscovered archaeological deposits. UNESCO has already recognized the influence of industrial agricultural plantations on the visual integrity of the property [41]. Increasing built-up land may create additional pressure through land clearing, excavation, ground levelling, infrastructure construction, and landscape fragmentation. These processes could weaken the physical and visual relationships among the archaeological sites, ancient river systems, palaeolake setting, and surrounding landscape that contribute to the integrity and authenticity of the property.
Although controlled infrastructure development can improve access, visitor management, and local economic opportunities, new development should be subject to appropriate heritage-impact assessment and planning controls to avoid potential adverse impact on the attributes supporting the property’s OUV. Subsequently, future urban development must comply with appropriate zoning, sustainable design, landscape preservation, and regulatory control mechanisms. Infrastructure, including access roads, tourist centers, signs, parking facilities, public facilities, and tourism-related businesses, must be strategically located to avoid disrupting sensitive archeological sites and natural landscape characteristics. Moreover, the decline of forest and agricultural land should be regulated since these land uses contribute to the rural character, ecological stability, and cultural landscape identity of Lenggong. The predicted expansion of built-up regions highlights the importance of balancing heritage conservation with sustainable tourism and local development. In this context, a 1 km zoning buffer functions as a critical mechanism to decouple detrimental human activities from sensitive heritage assets, effectively guiding land use compatibility in the peri-urban fringe [42]. Adopting dynamic governance models, such as Adaptive Resource Management, can further support this balance by facilitating social planning that reconciles tourism demands with the preservation of cultural integrity [43]. Despite its satisfactory validation performance, the ANN–CA model assumes that the historical land use transition patterns observed during the calibration period will persist in the future. Therefore, the 2040 prediction should be interpreted as a trend-based scenario rather than a deterministic forecast. Future policy changes, tourism growth, infrastructure projects, socioeconomic conditions, and climate-related factors may change the land use trajectories; however, they were not explicitly represented in the present model. These uncertainties should be considered when using the prediction to support planning and conservation decisions.

5. Conclusions

This study analyzed historical land use changes and predicted future land use patterns in the Lenggong catchment, which surrounds the Lenggong UNESCO heritage landscape and forms part of the Sungai Perak catchment. PlanMalaysia land use data from 2000, 2010, and 2020 were used to categorize land use into five primary classifications: water bodies, agricultural, forest, built-up areas, and unoccupied land. The findings show that forestry and agriculture consistently remained primary land use categories during the study period. However, forest cover had a decreasing pattern, whilst agricultural and urban regions showed progressive development. The transition matrix further demonstrated that land use transformation mainly involved the transfer of forest, agricultural, and unoccupied land into more dynamic land uses, particularly developed regions. The ANN–CA model also produced acceptable validation results, indicating its suitability for forecasting future land use changes within the catchment area. The combination of various machine learning methodologies provides important insights for decision-makers to develop resilient spatial planning and zoning rules that protect cultural heritage.
Future land use predictions predict that the Lenggong watershed will remain dominated by forest and agricultural land, but built-up areas are anticipated to expand further. This growth is especially significant within the 1 km buffer surrounding the Lenggong cultural heritage site, where developed areas escalated from 3.6% in 2000 to 10.5% in 2020 and are projected to attain 13.2% in the future. It signifies escalating developmental pressure next to the heritage zone. While urban growth can enhance heritage tourism by improving infrastructure, accessibility, visitor facilities, public services, and local economic activities, it requires careful management. Uncontrolled expansion may affect the archaeological context, rural landscape preservation, environmental quality, and long-term conservation significance of the Lenggong cultural landscape. Additionally, land use prediction offers valuable geographical data for heritage-sensitive planning, buffer zone management, and sustainable catchment development. Planners can implement this simulation approach to effectively balance necessary infrastructure growth with the imperative to maintain ecological stability and cultural heritage. Future research can further refine these models by incorporating multi-temporal variables to enhance the accuracy of spatial trajectory predictions, ensuring that local development policies remain responsive to changing environmental and socioeconomic dynamics.
Future studies can enhance this approach by applying more specific land use subclasses rather than solely focusing on five broad categories. The built-up class can be categorized into residential, commercial, industrial, transportation, utilities, and public facilities to enhance comprehension of the specific development types surrounding the heritage site. Agriculture can be categorized as paddy, plantation, orchard, and other varieties, whereas forests can be classified as forest reserve, secondary forest, or disturbed forest. Incorporating supplementary spatial driving elements, such as proximity to highways and rivers, elevation, slope, population density, tourism facilities, and protected areas, will improve the predictive model. The novelty of this study lies in integrating catchment-scale ANN–CA land use prediction with a focused assessment of development pressure within a 1 km buffer surrounding a UNESCO archaeological landscape. By linking historical land use transitions and the 2040 prediction with the wider hydrological and landscape setting of Lenggong, the study extends conventional land use modelling beyond general change detection toward heritage-sensitive spatial planning. This approach provides a transferable framework for identifying emerging land use pressure, guiding development control, and supporting long-term conservation planning in other heritage landscapes where environmental protection, local development, and tourism must be carefully balanced.

Author Contributions

All authors contributed to the conceptualization and design of the research. Material preparation, literature search, and data analysis were performed by M.W.A.R., W.M.M.W.I., A.R., A.A., Y.F.A.W. and M.A.M.; Data Curation: M.W.A.R.; Formal Analysis: M.W.A.R.; Funding Acquisition: W.M.M.W.I.; Investigation: M.W.A.R., W.M.M.W.I., A.A. and M.A.M.; Methodology: M.W.A.R., A.A. and M.A.M.; Project Administration: W.M.M.W.I.; Resources: W.M.M.W.I. and A.R.; Software: A.R. and Y.F.A.W.; Supervision: W.M.M.W.I.; Validation: A.R. and Y.F.A.W.; Visualization: M.W.A.R. and A.R.; Writing—Original Draft: M.W.A.R.; Writing—Review and Editing: M.W.A.R. All authors have read and agreed to the published version of the manuscript.

Funding

Universiti Sains Malaysia Short Term Grant R501-LR-RND002-0000001185-0000.

Data Availability Statement

Data will be made available on request.

Acknowledgments

Special thanks to the editors and reviewers for their time and valuable comments in improving this manuscript.

Conflicts of Interest

The authors declare that they have no known competing financial interests.

References

  1. Saputra, M.H.; Lee, H.S. Prediction of Land Use and Land Cover Changes for North Sumatra, Indonesia, Using an Artificial-Neural-Network-Based Cellular Automaton. Sustainability 2019, 11, 3024. [Google Scholar] [CrossRef] [Scilit]
  2. Zeshan, M.T.; Mustafa, M.R.U.; Baig, M.F. Monitoring Land Use Changes and Their Future Prospects Using GIS and ANN-CA for Perak River Basin, Malaysia. Water 2021, 13, 2286. [Google Scholar] [CrossRef] [Scilit]
  3. Salem, M.; Ravetz, J.; Sareen, S.; Dong, T.; Haque, M.; Bayoumi, W.N.; Tsurusaki, N.; Xu, G. Managing the Urban-Rural Transition: A Review of Approaches and Policies for Peri-Urban Land Use. J. Urban Manag. 2025, 14, 1115–1129. [Google Scholar] [CrossRef] [Scilit]
  4. Mehra, N.; Swain, J.B. Assessment of Land Use Land Cover Change and Its Effects Using Artificial Neural Network-Based Cellular Automation. J. Eng. Appl. Sci. 2024, 71, 70. [Google Scholar] [CrossRef] [Scilit]
  5. Nabila, D.A. Pemodelan Prediksi Dan Kesesuaian Perubahan Penggunaan Lahan Menggunakan Cellular Automata-Artificial Neural Network (CA-ANN). Tunas Agrar. 2023, 6, 41–55. [Google Scholar] [CrossRef] [Scilit]
  6. Toledo, M.V.L.; de Oliveira, J.R.; Arenas, L.A.D.O.; Filho, L.A.D.L.; Santos, A.P.d.; da Costa, R.d.V.F.; Lourenço, R.W.; Silva, D.C.d.C.e. Machine Learning for Land Use Change Analysis in Environmental Protection Areas. Environ. Monit. Assess. 2026, 198, 481. [Google Scholar] [CrossRef] [Scilit] [PubMed]
  7. Atef, I.; Ahmed, W.; Abdel-Maguid, R.H. Future Land Use Land Cover Changes in El-Fayoum Governorate: A Simulation Study Using Satellite Data and CA-Markov Model. Stoch. Environ. Res. Risk Assess. 2023, 38, 651–664. [Google Scholar] [CrossRef] [Scilit]
  8. Li, R.; Prozzi, J.A.; Hong, F. Quantification of Post-Rainfall Moisture Content in Pavement Unbound Layers Using Long-Term Pavement Performance Data. Transp. Res. Rec. J. Transp. Res. Board 2025, 2680, 660–672. [Google Scholar] [CrossRef] [Scilit]
  9. Zhan, W.; Chen, Y.; Liu, Q.Q.; Liu, Q.; Li, J.; Sacchi, M.D.; Zhuang, M.; Liu, Q.; Liu, Q. Simultaneous Prediction of Petrophysical Properties and Formation Layered Thickness from Acoustic Logging Data Using a Modular Cascading Residual Neural Network (MCARNN) with Physical Constraints. J. Appl. Geophys. 2024, 224, 105362. [Google Scholar] [CrossRef] [Scilit]
  10. Bendechou, H.; Akakba, A.; Issam, K.; Salem, H.A.B. Monitoring and Predicting Land Use/Land Cover Dynamics in Djelfa City, Algeria, Using Google Earth Engine and a Multi Layer Perceptron Markov Chain Model. Geogr. Pannonica 2024, 28, 1–20. [Google Scholar] [CrossRef] [Scilit]
  11. National Heritage Act 2005; The Commissioner of Law Revision: Putrajaya, Malaysia, 2006.
  12. Town and Country Planning Act 1976; The Commissioner of Law Revision: Putrajaya, Malaysia, 1976.
  13. González-Albornoz, P.; Rubio-Manzano, C.; Meza, M.I.L. Explaining Urban Transformation in Heritage Areas: A Comparative Analysis of Predictive and Interpretive Machine Learning Models for Land-Use Change. Mathematics 2025, 13, 3971. [Google Scholar] [CrossRef] [Scilit]
  14. Widaningrum, D.L.; Surjandari, I.; Sudiana, D. Analyzing Land-Use Changes in Tourism Development Area: A Case Study of Cultural World Heritage Sites in Java Island, Indonesia. Int. J. Technol. 2020, 11, 688. [Google Scholar] [CrossRef] [Scilit]
  15. Hua, A.K. Spatial-temporal analysis of pattern changes and prediction in Penang island, Malaysia using LULC and CA-Markov model. Appl. Ecol. Environ. Res. 2018, 16, 4619–4635. [Google Scholar] [CrossRef] [Scilit]
  16. Raffay, M.R.M.; Bagheri, M.; Marzuki, A.; Gholami, I.; Anuar, M.A.K. Monitoring and Analyzing Land Use Changes for Sustainable Development in Teluk Bahang, Penang, Malaysia: A GIS-Based Approach. J. Eng. Appl. Sci. 2025, 72, 36. [Google Scholar] [CrossRef] [Scilit]
  17. Lukas, P.; Melesse, A.M.; Kenea, T.T. Prediction of Future Land Use/Land Cover Changes Using a Coupled CA-ANN Model in the Upper Omo–Gibe River Basin, Ethiopia. Remote Sens. 2023, 15, 1148. [Google Scholar] [CrossRef] [Scilit]
  18. Tan, J.P.-C.; Kiew, R.; Darbyshire, I. Prioritising Important Plant Areas (IPAs) among the Limestone Karsts of Perak, Malaysia. Kew Bull. 2024, 79, 409–427. [Google Scholar] [CrossRef] [Scilit]
  19. Stafa, R.M.; Roslan, M.K.; Aziz, A.C.; Shafeea, L.M.; Saidin, M. The application of market appeal-robusticity matrix: A case study of the archaeological heritage of Lenggong valley, Perak, Malaysia. Geoj. Tour. Geosites 2018, 23, 702. [Google Scholar] [CrossRef] [Scilit]
  20. Goh, H.M.; Bakry, N.; Saidin, M.; Shahidan, S.; Curnoe, D.; Saw, C.Y.; Ariffin, Z.B.; Kiew, Y.M. The Palaeolithic Stone Assemblage of Kota Tampan, West Malaysia. Antiquity 2020, 94, e25. [Google Scholar] [CrossRef] [Scilit]
  21. Fazlin, S.N.; Affizzah, A.M.D.; Bakar, N.A.A. Willingness to Pay for Conservation and Sustainability of Lenggong Valley as World Heritage Site (WHS). Int. J. Acad. Res. Econ. Manag. Sci. 2024, 13, 1–16. [Google Scholar] [CrossRef] [Scilit] [PubMed]
  22. Liu, J.; Ren, H.; Wang, X.; Shirazi, Z.; Quan, B. Measuring and Predicting Urban Expansion in the Angkor Region of Cambodia. Remote Sens. 2019, 11, 2064. [Google Scholar] [CrossRef] [Scilit]
  23. Eshetie, A.A.; Wubneh, M.A.; Kifelew, M.S.; Alemu, M.G. Application of Artificial Neural Network (ANN) for Investigation of the Impact of Past and Future Land Use–Land Cover Change on Streamflow in the Upper Gilgel Abay Watershed, Abay Basin, Ethiopia. Appl. Water Sci. 2023, 13, 209. [Google Scholar] [CrossRef] [Scilit]
  24. Osman, M.A.A.; Abdel-Rahman, E.M.; Onono, J.O.; Olaka, L.; Elhag, M.M.; Adan, M.; Tonnang, H.E.Z. Mapping, Intensities and Future Prediction of Land Use/Land Cover Dynamics Using Google Earth Engine and CA- Artificial Neural Network Model. PLoS ONE 2023, 18, e0288694. [Google Scholar] [CrossRef] [Scilit] [PubMed]
  25. Somantri, L.; Somantri, L. The Utilization of Sentinel Imagery and Geographic Information Systems for Monitoring Urban Sprawl in Bandung. J. Southwest Jiaotong Univ. 2023, 58, 473–492. [Google Scholar] [CrossRef] [Scilit]
  26. Iskandar, B.; Saidah; Kurnia, A.A.; Jauhari, A.; Zannah, F. Modeling Land Cover Change Using MOLUSCE in Kahayan Tengah Forest Management Unit, Kalimantan Tengah. J. Sylva Lestari 2024, 12, 242–257. [Google Scholar] [CrossRef] [Scilit]
  27. Kukuntod, N.; Wijitkosum, S. Escalating Drought Vulnerability Driven by Land Use Change: Insights from a GIS-Based CA-Markov and Multi-Criteria Assessment of Future Scenarios in the Lam Ta Kong Watershed. Earth Syst. Environ. 2025, 10, 4637–4654. [Google Scholar] [CrossRef] [Scilit]
  28. Azari, M.; Billa, L.; Chan, A. Multi-Temporal Analysis of Past and Future Land Cover Change in the Highly Urbanized State of Selangor, Malaysia. Ecol. Process. 2022, 11, 2. [Google Scholar] [CrossRef] [Scilit]
  29. Hasani, M.; Salmanmahiny, A.; Tabrizi, A.M. An Integrative Modelling Approach to Analyse Landscape Dynamics Through Intensity Analysis and Cellular Automata-Markov Chain Model. Eur. Spat. Res. Policy 2020, 27, 243–261. [Google Scholar] [CrossRef] [Scilit]
  30. Ratnayake, S.S.; Reid, M.; Larder, N.; Hunter, D.; Ranagalage, M.; Kogo, B.K.; Dharmasena, P.B.; Kariyawasam, C.S. Knowing the Lay of the Land: Changes to Land Use and Cover and Landscape Pattern in Village Tank Cascade Systems of Sri Lanka. Front. Environ. Sci. 2024, 12, 1353459. [Google Scholar] [CrossRef] [Scilit]
  31. Fontana, A.G.; Nascimento, V.F.; Ometto, J.P.; do Amaral, F.H.F. Analysis of Past and Future Urban Growth on a Regional Scale Using Remote Sensing and Machine Learning. Front. Remote Sens. 2023, 4, 1123254. [Google Scholar] [CrossRef] [Scilit]
  32. Dede, M.; Asdak, C.; Setiawan, I. Spatial Dynamics Model of Land Use and Land Cover Changes: A Comparison of CA, ANN, and ANN-CA. Regist. J. Ilm. Teknol. Sist. Inf. 2021, 8, 38. [Google Scholar] [CrossRef] [Scilit]
  33. Mallick, J.; Mesfer, M.K.A.; Alsubih, M.; Ahmed, M.; Kahla, N.B. Estimating Carbon Stocks and Sequestration with Their Valuation Under a Changing Land Use Scenario: A Multi-Temporal Research in Abha City, Saudi Arabia. Front. Ecol. Evol. 2022, 10, 905799. [Google Scholar] [CrossRef] [Scilit]
  34. Vongvassana, S.; Pattanakiat, S.; Tabucanon, A.S.; Chiyanon, T.; Nakmuenwai, P.; Lawawirojwong, S.; Boonriam, W.; Chinsawadphan, P.; Phutthai, T. Scenario-Based Land Cover and Land Use Change Modeling in Mae Chang Watershed, Lampang Province, Thailand. Environ. Nat. Resour. J. 2025, 24, 42–57. [Google Scholar] [CrossRef] [Scilit]
  35. Nguyen, C.; Nguyen, C.V.; Nguyen, T.M.N. Monitoring and Modeling of Spatio-Temporal Urban Expansion and Land Use/Land-Cover Change in Mountain Landscape: A Case Study of Dalat City, Vietnam. Environ. Nat. Resour. J. 2023, 21, 428–442. [Google Scholar] [CrossRef] [Scilit]
  36. Kariuki, R.; Munishi, L.K.; Mustaphi, C.J.C.; Capitani, C.; Shoemaker, A.; Lane, P.; Marchant, R. Integrating Stakeholders’ Perspectives and Spatial Modelling to Develop Scenarios of Future Land Use and Land Cover Change in Northern Tanzania. PLoS ONE 2021, 16, e0245516. [Google Scholar] [CrossRef] [Scilit] [PubMed]
  37. Liu, H.; Zhao, B.; Liu, J.; Shen, Y. Land-Use Evolution and Driving Forces in Urban Fringe Archaeological Sites: A Case Study of the Western Han Imperial Mausoleums. Land 2025, 14, 1554. [Google Scholar] [CrossRef] [Scilit]
  38. Nath, N.; Sahariah, D.; Meraj, G.; Debnath, J.; Kumar, P.; Lahon, D.; Chand, K.; Farooq, M.; Chandan, P.; Singh, S.K.; et al. Land Use and Land Cover Change Monitoring and Prediction of a UNESCO World Heritage Site: Kaziranga Eco-Sensitive Zone Using Cellular Automata-Markov Model. Land 2023, 12, 151. [Google Scholar] [CrossRef] [Scilit]
  39. Adiguzel, F.; Karadeniz, E.; Emir, T.; Arslan, F.; Ozel, H.B. Balancing Conservation and Development Through Explainable Machine Learning and NSGA-II: A Case Study of Osmaniye. Land 2026, 15, 881. [Google Scholar] [CrossRef] [Scilit]
  40. Esen, F.; Karadeniz, E.; Sünbül, F.; Adigüzel, A.D.; Sajjad, M. From Mapping to Decision Making: A Hybrid Rule-Based and Machine Learning Framework for Spatial Land-Use Zoning. Front. Environ. Sci. 2026, 14, 1791582. [Google Scholar] [CrossRef] [Scilit]
  41. UNESCO World Heritage Centre. Archaeological Heritage of the Lenggong Valley; UNESCO World Heritage Centre: Paris, France, 2012. [Google Scholar]
  42. Sam, A.A.S.A.; Nor, A.N.M.; Rafaai, N.H.; Jamil, R.M.; Nawawi, S.A.; Hassin, N.H.; Abas, M.A.; Hambali, K.; Subki, N.S.; Hamzah, A.S.M.A.; et al. Habitat Quality Assessment in the Royal Belum Rainforest, Malaysia Using Spatial Analysis. BIO Web Conf. 2023, 73, 5020. [Google Scholar] [CrossRef] [Scilit]
  43. Sánchez, M.L.; Cabrera, A.T.; Pulgar, M.L.G. del Guidelines from the Heritage Field for the Integration of Landscape and Heritage Planning: A Systematic Literature Review. BURJC Digit. 2020, 204, 103931. [Google Scholar] [CrossRef] [Scilit]
Figure 1. Location of the Lenggong catchment and Archaeological Heritage of the Lenggong Valley.
Earth 07 00144 g001
Figure 2. Methodological framework for land use change detection and ANN–CA modelling.
Earth 07 00144 g002
Figure 3. Land use distribution within the Lenggong catchment: (a) land use in 2000, (b) land use in 2010, and (c) land use in 2020.
Earth 07 00144 g003
Figure 4. ANN–CA-predicted land use distribution within the Lenggong catchment for 2040.
Earth 07 00144 g004
Table 1. Land use classification used in this study.
Major Land Use ClassDescription
Water bodiesRivers, lakes, reservoirs, ponds, and other surface water areas
AgricultureAgricultural land, cultivated areas, plantations, and other farming-related land uses
ForestNatural forest, forested land, and areas dominated by tree cover
Built-up areasIndustrial, commercial, residential, road and transportation, utilities, and public facilities
Vacant landOpen, unused, idle, or undeveloped land
Table 2. Land use distribution and percentage change in the Lenggong catchment from 2000 to 2020.
Land Use ClassArea 2000 (m2)Area 2010 (m2)Area 2020 (m2)2000 (%)2010 (%)2020 (%)Change 2000–2010 (%)Change 2010–2020 (%)
Water bodies24,284,70032,766,80036,941,3003.64.95.5+1.3+0.6
Agriculture223,487,000236,216,200238,382,10033.335.235.5+1.9+0.3
Forest395,718,400389,958,800365,311,10058.958.154.4−0.8−3.7
Built-up area12,233,10012,051,60023,268,3001.81.83.50.0+1.7
Vacant land16,032,500762,3007,852,9002.40.11.2−2.3+1.1
Table 3. Land use transition matrix for 2000–2010 and 2010–2020 in the Lenggong catchment.
PeriodInitial Land UseWater Bodies (%)Agriculture (%)Forest (%)Built-Up Area (%)Vacant Land (%)Total Change (%)
2000–2010Water bodies2.41.00.20.020.041.26
2000–2010Agriculture1.829.41.11.10.14.10
2000–2010Forest0.41.956.40.10.012.41
2000–2010Built-up area0.11.10.10.50.0051.31
2000–2010Vacant land0.11.90.20.10.0042.30
2010–2020Water bodies2.91.60.10.30.042.00
2010–2020Agriculture2.128.21.82.31.07.20
2010–2020Forest0.31.952.40.30.12.60
2010–2020Built-up area0.11.00.10.50.051.30
2010–2020Vacant land0.040.040.020.0040.00.20
Table 4. Validation results of the ANN–CA land use prediction model.
Validation ComponentValueInterpretation
Kappa validation, 2000–20100.940Very strong agreement
Minimum validation error, 2000–20100.010Low error
Overall deviation, 2000–2010−0.003Very small deviation
Kappa validation, 2010–20200.902Very strong agreement
Minimum validation error, 2010–20200.013Low error
Overall deviation, 2010–2020−0.005Very small deviation
Validation accuracy83.1%Good model accuracy
Kappa overall0.710Substantial agreement
Kappa histogram0.930Very strong quantity agreement
Kappa location0.750Substantial spatial agreement
Table 5. Predicted future land use distribution in the Lenggong catchment.
No.Land Use ClassPredicted Land Use (%)
1Water bodies5.2
2Agriculture36.1
3Forest54.1
4Built-up areas3.8
5Vacant land0.9
Table 6. Land use distribution within the 1 km buffer of the Lenggong heritage area.
Land Use Class2000 (%)2010 (%)2020 (%)Future Prediction (%)
Water bodies1.12.32.72.3
Agriculture48.747.845.344.8
Forest41.643.639.738.6
Built-up areas3.64.210.513.2
Vacant land4.92.11.91.1
Disclaimer/Publisher’s Note: The statements, opinions and data contained in all publications are solely those of the individual author(s) and contributor(s) and not of MDPI and/or the editor(s). MDPI and/or the editor(s) disclaim responsibility for any injury to people or property resulting from any ideas, methods, instructions or products referred to in the content.