Article

Regional-Scale Flash-Flood Susceptibility Assessment Using a Modified FFPI for Hydrological Hazard Planning in the Western Balkans


1
Institute of Geography, Faculty of Natural Sciences and Mathematics, Ss. Cyril and Methodius University in Skopje, Arhimedova 3, 1000 Skopje, North Macedonia
2
Department of Geography, Tourism and Hotel Management, Faculty of Sciences, University of Novi Sad, Trg Dositeja Obradovića 3, 21000 Novi Sad, Serbia
3
School of Earth, Environment and Society, Bowling Green State University, 190 Overman Hall, Bowling Green, OH 43403, USA
*
Author to whom correspondence should be addressed.
Earth 2026, 7(5), 141; https://doi.org/10.3390/earth7050141
Submission received: 23 July 2026 / Revised: 19 August 2026 / Accepted: 20 August 2026 / Published: 22 August 2026

Abstract

Flash floods are among the most damaging hydrometeorological hazards in the Western Balkans (WB), yet regionally consistent, cross-border susceptibility assessments remain scarce because of fragmented national datasets and differing methodological standards. This study develops a harmonized, cloud-based flash-flood susceptibility framework for the WB (208,052 km2) by implementing a physiography-based modified Flash-Flood Potential Index (FFPI) in Google Earth Engine (GEE) at 30 m resolution. The modified FFPI integrates slope, land cover, soil texture, vegetation exposure (Bare-Soil Index), and soil erodibility, and is aggregated across 9524 EU-Hydro sub-basins to produce an operational catchment-level ranking. Additionally, CHIRPS-derived maximum daily precipitation is used to derive a rainfall-triggered hotspot layer that highlights sub-basins where terrain-controlled susceptibility coincides with strong observed rainfall extremes over the 2001–2025 period. Enhanced susceptibility is concentrated in Adriatic and Aegean-facing mountain basins of Albania, Montenegro, and North Macedonia, with 44.2% of sub-basins classified as high or very-high susceptibility. Multi-source validation against inventoried torrential catchments, published GIS-based susceptibility maps, and flood records yielded moderate to very strong agreement (68.6–92.0%), together with an AUC-ROC of 0.79 and F1-score of 0.77 for the pooled orthophoto-based validation dataset (n = 336 sub-basins). The framework provides a reproducible transboundary tool for regional flood-risk screening and demonstrates the potential of cloud-based geospatial platforms to overcome cross-border data fragmentation in hazard assessment. Its main limitations are the static physiographic nature of the FFPI, the coarser resolution of CHIRPS and SoilGrids relative to small sub-basins, and possible overestimation in karst terrains where subsurface drainage reduces surface runoff.

1. Introduction

Flash floods are brief, high-intensity inundation events driven by short-duration convective or orographic rainfall and amplified by steep topography, thin or crusted soils, and sparse vegetation cover. They typically develop within minutes to a few hours and cause disproportionate human and economic losses relative to their limited spatial extent [1,2]. Globally, flash floods have been responsible for approximately 150,000 fatalities between 1996 and 2015 [3], and across Europe they account for around 40% of all flood-related casualties recorded since the mid-twentieth century [4]. Climate change, particularly the increasing frequency and intensity of extreme rainfall events, together with land-use intensification and urbanization-related increases in impervious surfaces, is expected to increase the frequency and severity of these natural disasters [5,6,7].
The Western Balkans (WB), comprising Albania, Bosnia and Herzegovina, Kosovo, Montenegro, North Macedonia, and Serbia, is one of the most flash-flood-prone regions in Europe. The area is dominated by steep, dissected relief associated with the Dinaric and Balkan mountain systems and experiences a transitional climate with the overlap of Mediterranean, moderately continental, and alpine influences, which produces strong spatial contrasts in rainfall seasonality, convective storm frequency, snowmelt contribution, and runoff response. These characteristics, combined with long-term deforestation and land-use change in rural areas, generate highly variable and rapid runoff responses across mountain catchments [8,9,10]. Numerous destructive torrential floods have been recorded in the region, including the catastrophic May 2014 event, recurrent summer flash-flood events in the Vardar and South Morava basins, and frequent localized events in small mountainous catchments [11,12,13,14].
Despite the significance of flash floods in the WB, susceptibility assessments remain fragmented and methodologically inconsistent. Most existing studies have been conducted independently at local, municipal, or national scales using non-harmonized datasets and differing analytical frameworks [10,15,16,17,18]. These include combinations of DEM, land-cover, soil, lithological, rainfall, and flood-inventory data, analyzed through FFPI, weighted-overlay, morphometric, and statistical approaches. As a result, there is presently no equivalent regional assessment capable of systematically analyzing flash-flood susceptibility across transboundary catchments draining into the Adriatic, Aegean, and Black Sea basins.
Among the available susceptibility frameworks, the Flash-Flood Potential Index (FFPI) has emerged as a particularly suitable approach for first-order regional screening. Originally proposed by Smith [19], the method integrates key physiographic controls, namely slope, land cover, soil properties, vegetation, and erodibility, into a composite index of a catchment’s inherent propensity to generate flash floods. Data-driven approaches such as random forest, gradient boosting, support-vector machines, and neural networks can achieve high predictive performance when sufficiently representative flood and non-flood inventories are available [20,21,22,23,24]. However, their training and independent validation require spatially consistent event datasets, which are not available at comparable quality across all six Western Balkan countries. The FFPI was therefore selected not as an alternative expected to outperform machine-learning models, but as a transparent, inventory-light regional screening framework that can be applied consistently across national boundaries. Event-based hydrological models provide a more detailed representation of rainfall–runoff processes but require extensive hydrometeorological observations and catchment-specific parameterization that are not consistently available across the WB. The FFPI was therefore selected as a transparent and computationally efficient approach for harmonized regional screening across large transboundary areas. The method has been adapted, recalibrated, and extended in numerous regional studies [25,26,27,28,29,30,31,32,33]. In southeastern Europe, the FFPI has been applied at municipal to national scales in Romania [31,33], Serbia [17], Croatia [18], Bosnia and Herzegovina [14], and most recently in North Macedonia [10]. However, all of these applications remain confined to national or sub-national extents, including municipal, local, or individual catchment-scale studies, which limits direct comparison across transboundary basins because of differences in datasets, spatial resolution, and methodological settings.
Recent advances in cloud-computing platforms have created new opportunities for regional and transboundary geospatial analysis. Google Earth Engine (GEE) provides access to extensive harmonized Earth-observation datasets, including Sentinel and Landsat archives, the Copernicus DEM, ESA WorldCover, SoilGrids, and CHIRPS, together with the computational capacity required for environmental modelling over large spatial extents, such as the entire WB at 30 m spatial resolution [34,35]. Recent studies have demonstrated the effectiveness of GEE for flood and flash-flood susceptibility mapping in different geographical settings [10,36,37], supporting its application to large, data-scarce, and transboundary regions.
Building on this methodological basis, the study implements a regionally adapted, modified FFPI in GEE for the entire WB. The main objectives are (i) to generate a harmonized flash-flood susceptibility map at 30 m spatial resolution; (ii) to aggregate FFPI values across 9524 sub-basins delineated from the EU-Hydro database in order to establish a comparable regional ranking framework; (iii) to derive a complementary rainfall-triggered hotspot layer from CHIRPS-based maximum daily precipitation that refines the terrain-controlled susceptibility pattern; and (iv) to evaluate whether the static, physiography-based FFPI susceptibility pattern is consistent with independent reference datasets, rather than to predict the occurrence or timing of individual flash-flood events. This includes a torrential-catchment inventory for the Vrbas–Ukrina basins, reference data for the Kolubara basin [38], and historical flood inventories from the Pčinja and Bregalnica basins. The final goal of the study is to provide a transparent and repeatable framework for transboundary water management applications, spatial planning, and regional flood-risk screening in the WB, with potential transferability to other regions and climatic settings where comparable harmonized datasets are available. The rainfall-triggered hotspot analysis is intended as a complementary prioritization step that refines the physiography-based FFPI assessment by incorporating spatial patterns of extreme daily precipitation.

2. Materials and Methods

2.1. Study Area

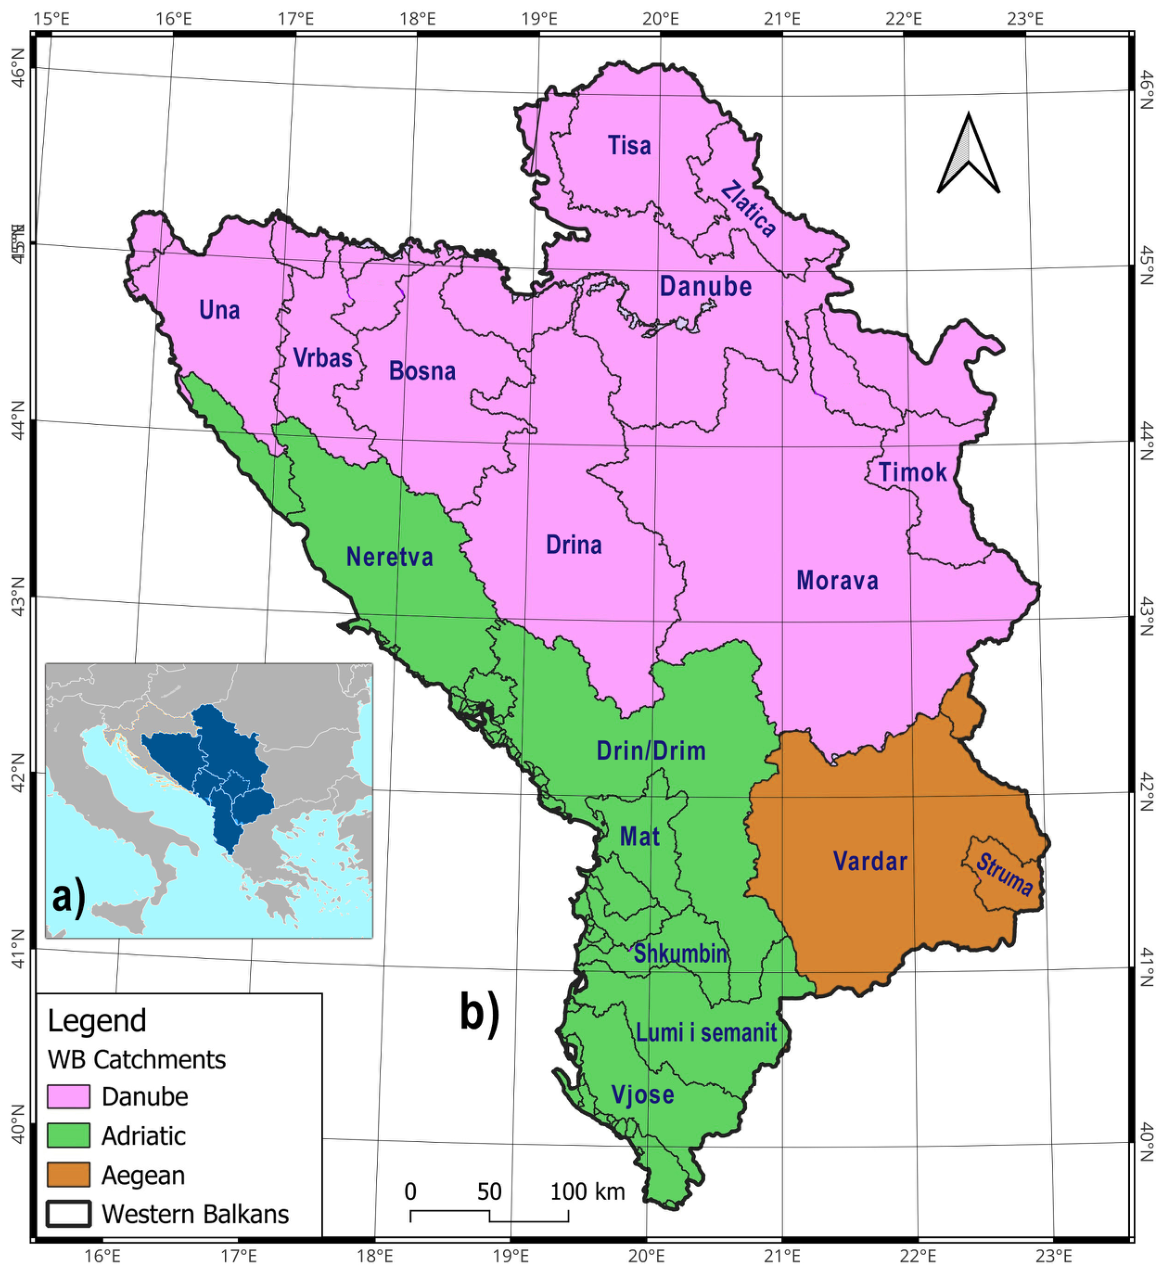
The WB cover 208,052 km2 of southeastern Europe (Figure 1) and are inhabited by about 18 million people. The region also includes a relatively narrow Adriatic coastal zone, characterized by low-relief coastal plains and short, steep catchments draining directly toward the Adriatic Sea. The landscape is dominated by NW–SE mountain chains, including the Dinarides bordering the Adriatic, the Pindus and Šar–Korab massifs to the south, and the Balkan ranges along the eastern border, separated by intermontane basins, karst poljes, and the lowland known as the Pannonian Basin in the north. Approximately 70% of the area is mountainous, with a mean elevation of 633 m a.s.l. and a mean slope of 12.2°, based on the Copernicus GLO-30 DEM. Slopes steeper than 20° cover 23% of the regional surface. The highest summit, Golem Korab (2753 m), is shared between Albania and North Macedonia. Along the Adriatic and Ionian margins of Albania, Montenegro, and southwestern Bosnia and Herzegovina, the coastal fringe comprises steep coastal mountains descending abruptly toward the sea, together with narrow karst plains and short, high-gradient catchments. This coastal setting is characterized by intense Mediterranean rainfall regimes, orographic precipitation enhancement, and rapid concentration times, which together favour intense flash-flood generation despite the modest catchment size.
Climatically, the WB represent a major transition zone between Mediterranean, continental, and alpine climatic regimes, resulting in pronounced spatial contrasts in precipitation intensity and runoff generation. A Mediterranean regime prevails along the Adriatic coast of Albania, southern Montenegro, and coastal Bosnia and Herzegovina, with mild, wet winters and hot, dry summers. The interior transitions to a moderately continental climate in the Pannonian Basin of northern Serbia, while alpine conditions dominate the high mountains [39]. Precipitation patterns are strongly orographic: the southern Dinarides record some of the highest annual totals in Europe, exceeding 4600 mm at Crkvice in Montenegro, while annual precipitation drops to 600–700 mm in the Pannonian Plain and to 350–400 mm along parts of the Albanian coast [40]. Recent analyses of rainfall erosivity showed that the mean R-factor for the WB is estimated at 790 MJ mm ha−1 h−1 yr−1, with a 14% increase observed during the 2010s [41]. These rainfall gradients are a central control on flash-flood generation because the highest precipitation maxima often coincide with steep and highly dissected mountain regions.
Hydrographically, the WB drain into three marine basins. The Danube basin is by far the largest (127,418.7 km2, or 61.2% of the WB), represented mainly by the Sava, Morava, and Tisa watersheds. The Adriatic basin covers 56,709.5 km2 (27.3%) and includes the Neretva, Drim, and Vjosa systems, while the Aegean basin covers 23,923.8 km2 (11.5%) and is dominated by the Vardar (388 km), flowing through North Macedonia, together with the Strumica catchment as the tributary of the Struma river [42]. The karst hydrology of the Dinarides produces a distinctive regime of sinking rivers, large springs, and underground drainage networks [43], which strongly modulate the flash-flood response in carbonate terrains and constitute one of the principal sources of methodological uncertainty for physiography-based susceptibility indices in this region. These complex subsurface flow pathways represent an additional challenge for regional susceptibility assessments because karst permeability is not explicitly represented in conventional physiography-based FFPI formulations.
Land cover follows both climatic and altitudinal gradients. According to ESA WorldCover 2021 [44], tree cover dominates (52.3%), followed by grassland (25.7%) and cropland (16.9%); shrubland (2.6%), built-up areas (2.0%), water bodies (0.9%), and bare or sparsely vegetated surfaces (<0.5%) together account for less than 6% of the area. Although the built-up class covers only around 2% of the region, its local influence on runoff can be substantial in urban and peri-urban catchments, where high imperviousness sharply shortens concentration times and increases peak discharges. Despite the predominance of relatively protective vegetation cover at the regional scale, marked local contrasts remain in cultivated, urbanized, and sparsely vegetated headwaters, which are typically the most flash-flood-prone units. The combination of steep slopes, erodible substrates, heavy rainfall, extensive karst, and locally degraded vegetation makes the WB a demanding and informative regional environment for testing transboundary, cloud-based flash-flood susceptibility modelling.

2.2. Data Sources

All input layers were assembled, harmonized, and processed within GEE. Dataset selection was based on three criteria: (i) open accessibility and long-term availability; (ii) consistent spatial coverage across all WB countries; and (iii) sufficient spatial resolution to capture the small-catchment dynamics characteristic of flash floods while remaining suitable for regional-scale analysis. Five principal datasets were incorporated:
  • Topography: Copernicus GLO-30 Digital Elevation Model (DEM) at 30 m resolution [45], used to derive the slope factor (M).
  • Land cover: ESA WorldCover 2021 v200 at 10 m resolution [44], used to derive the land-cover factor (L).
  • Soil texture: SoilGrids 2.0 at 250 m resolution [46,47], used to derive the soil factor (S; clay-content layer) and the erodibility factor (E; K-factor).
  • Vegetation/soil exposure: Sentinel-2 multispectral imagery at 10 m resolution, used to compute the Bare-Soil Index (BSI) and hence the vegetation factor (V) [48,49,50].
  • Hydrography: EU-Hydro v1.3 river-network database [51], providing 9524 sub-basins and their boundaries across the WB.
To ensure spatial consistency, all continuous raster datasets were resampled to the 30 m working grid using bilinear interpolation, whereas categorical land-cover layers were resampled using nearest-neighbour interpolation to preserve class integrity. It should be emphasized that resampling of the SoilGrids layers from 250 m to 30 m harmonizes grid geometry with the other input datasets but does not increase the original information content of the soil data. Local soil variability below the 250 m grid is therefore smoothed, particularly in small headwater catchments, and this constitutes an intrinsic limitation of the input soil information rather than an artefact of the resampling procedure. All resampling, reclassification, band selection, cloud masking, and raster operations were performed within GEE; a detailed step-by-step workflow is provided in Supplementary File S1.

2.3. FFPI Methodology in GEE

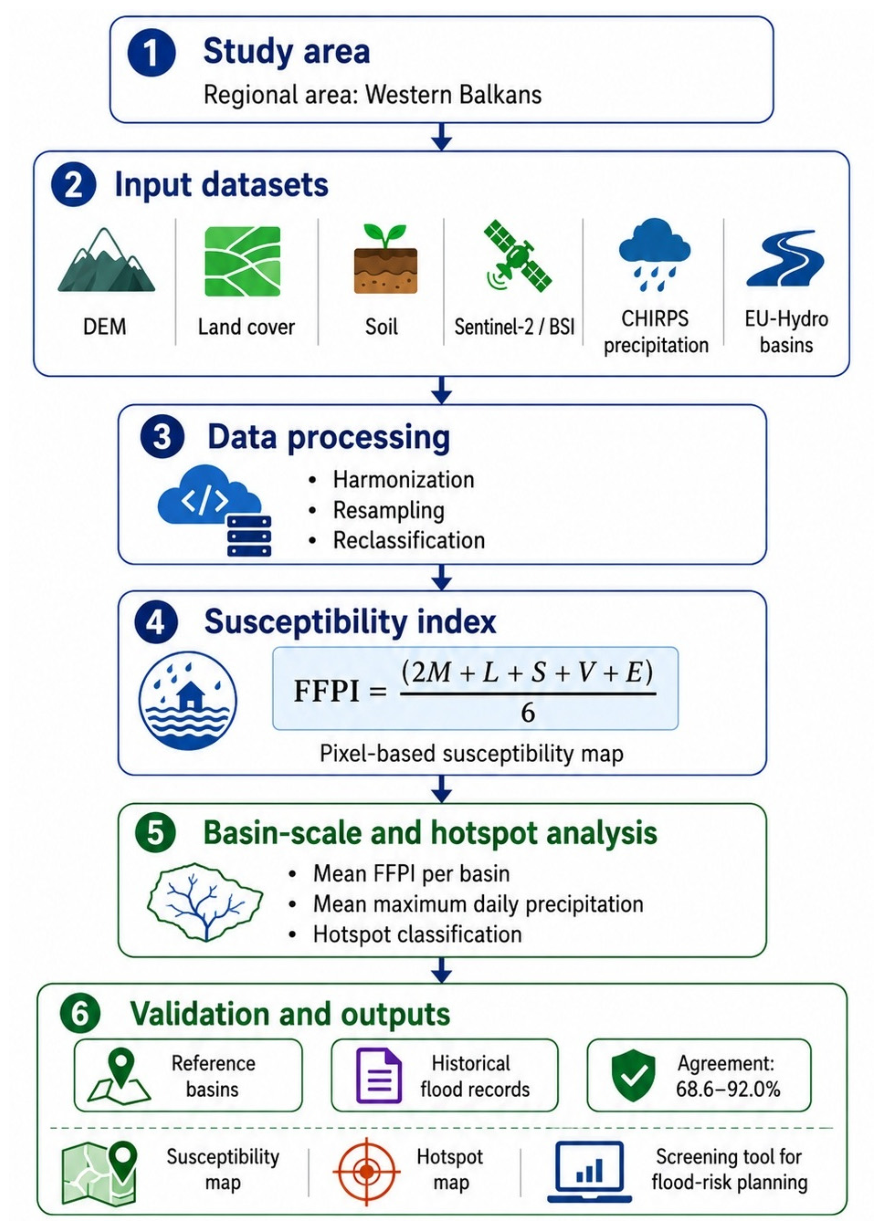
Flash-flood susceptibility was assessed using the modified FFPI [25,26,27,28,29,30,31,33], which combines multiple static physiographic factors into a composite indicator of the intrinsic susceptibility of a catchment to flash flooding. Individual factors are normalized to a common 1–10 scale and integrated through weighted averaging. This method was adopted here for three main reasons. First, it relies exclusively on static physiographic variables that are consistently available across the entire WB. Second, it has been successfully applied and validated in several studies in Southeastern Europe [10,16,17,18,31,33]. Third, its raster-based structure is well-suited for implementation within GEE, enabling all input layers to be processed and integrated within a unified cloud-computing framework (Figure 2). The normalization was performed through factor-specific reclassification, whereby each class was assigned a score from one to 10 according to its relative influence on flash-flood susceptibility. As noted in the Introduction, machine-learning and hydrological–hydraulic alternatives require inventory and gauge data that are not consistently available across all six WB countries.
In this study, the FFPI is implemented as a regionally adapted formulation in which slope is assigned a coefficient of two, while land cover, soil texture, vegetation exposure, and erodibility are each assigned a coefficient of one, following Milevski et al. [10] and comparable FFPI applications in southeastern Europe [16,17,18,32,33]:
FFPI = (2·M + L + S + V + E)/6
where M is the slope factor, L the land-cover factor, S the soil factor, V the vegetation factor, and E the erodibility factor. The denominator 6 corresponds to the sum of the assigned weights (2 for slope + 1 for each of the four remaining factors), so that the resulting FFPI remains on the same 1–10 scale as the individual input variables. The weighting scheme (Table 1) was defined on the basis of expert judgement, previous FFPI applications [10,16,17,31], and the geomorphological characteristics of the region.
Slope was assigned the highest weight because it is the most direct and unambiguous terrain control on runoff velocity, concentration time, and flow accumulation in small mountainous catchments [1,10,16]. This treatment is consistent with previous FFPI adaptations in which slope is multiplied by 1.5 or 2.0. Land cover and vegetation/soil exposure partly overlap conceptually, particularly in agricultural or sparsely vegetated areas where high land-cover scores may coincide with high BSI-derived values, so assigning equal or excessive weight to these surface-cover variables could overestimate flash-flood susceptibility in flat lowland areas where runoff concentration and torrential response remain limited. The modified formulation, therefore, gives slope a dominant but not exclusive role, while retaining the contribution of land cover, soil texture, vegetation exposure, and erodibility as secondary controls. This regional weighting scheme is treated as an expert-based adaptation of the FFPI rather than a strict reproduction of any single published formulation, and its suitability is evaluated through the multi-source validation presented below.
The slope factor M was derived from the Copernicus GLO-30 DEM [45] as M = 10n/30, where n is the average terrain slope in percent, and M is capped at 10 for slopes ≥ 30%. The regional mean slope is 21.6%, corresponding to a mean M of 7.2. The land-cover factor L was derived from ESA WorldCover 2021 [44] and reclassified on a 1–10 scale according to runoff potential, following the rankings used by Panagos et al. [52] and Zaharia et al. [31]: forests were assigned the lowest values (1–2), shrubland and grassland intermediate values (3–5), cropland moderate values (5–6), and built-up, bare, or sparsely vegetated surfaces the highest values (8–10). The soil factor S was derived from the SoilGrids clay-content layer at 250 m [47] and normalized from one (very low clay content, high infiltration) to 10 (very high clay content, low infiltration). The vegetation factor V was computed from the Sentinel-2 Bare-Soil Index (BSI):
BSI = ((SWIR + RED) − (NIR + BLUE))/((SWIR + RED) + (NIR + BLUE))
and rescaled to the 1–10 range, with low values denoting dense vegetation and high values denoting bare or sparsely vegetated surfaces. BSI was preferred over direct vegetation indices such as NDVI because the objective was not to map vegetation vigour alone, but to capture bare-soil and sparsely vegetated surface exposure, which is more directly linked to rapid runoff generation, reduced interception, and sediment-rich flash-flood response [48,49,50]. To reduce seasonal bias, the BSI layer was produced from a cloud-filtered Sentinel-2 median composite over the vegetation growing season (May–September) for 2020–2025, so that the resulting factor represents a relative surface-exposure indicator rather than an event-specific vegetation condition. The erodibility factor E was represented by the K-factor of the (Revised) Universal Soil Loss Equation [53,54], computed from SoilGrids inputs (sand, silt, clay, organic matter, structure, and permeability) and rescaled to the 1–10 range. The use of an erodibility term follows the rationale that soils prone to surface sealing and crust formation generate higher and faster runoff during intense rainfall events [10,20,55].
All continuous factors were normalized to the 1–10 range using min–max scaling:
Xnorm = 1 + 9⋯(X − Xmin)/(Xmax − Xmin)
while categorical variables (land cover) were reclassified according to the literature-based runoff-potential rankings summarized above. The complete methodological workflow is shown in Figure 2.
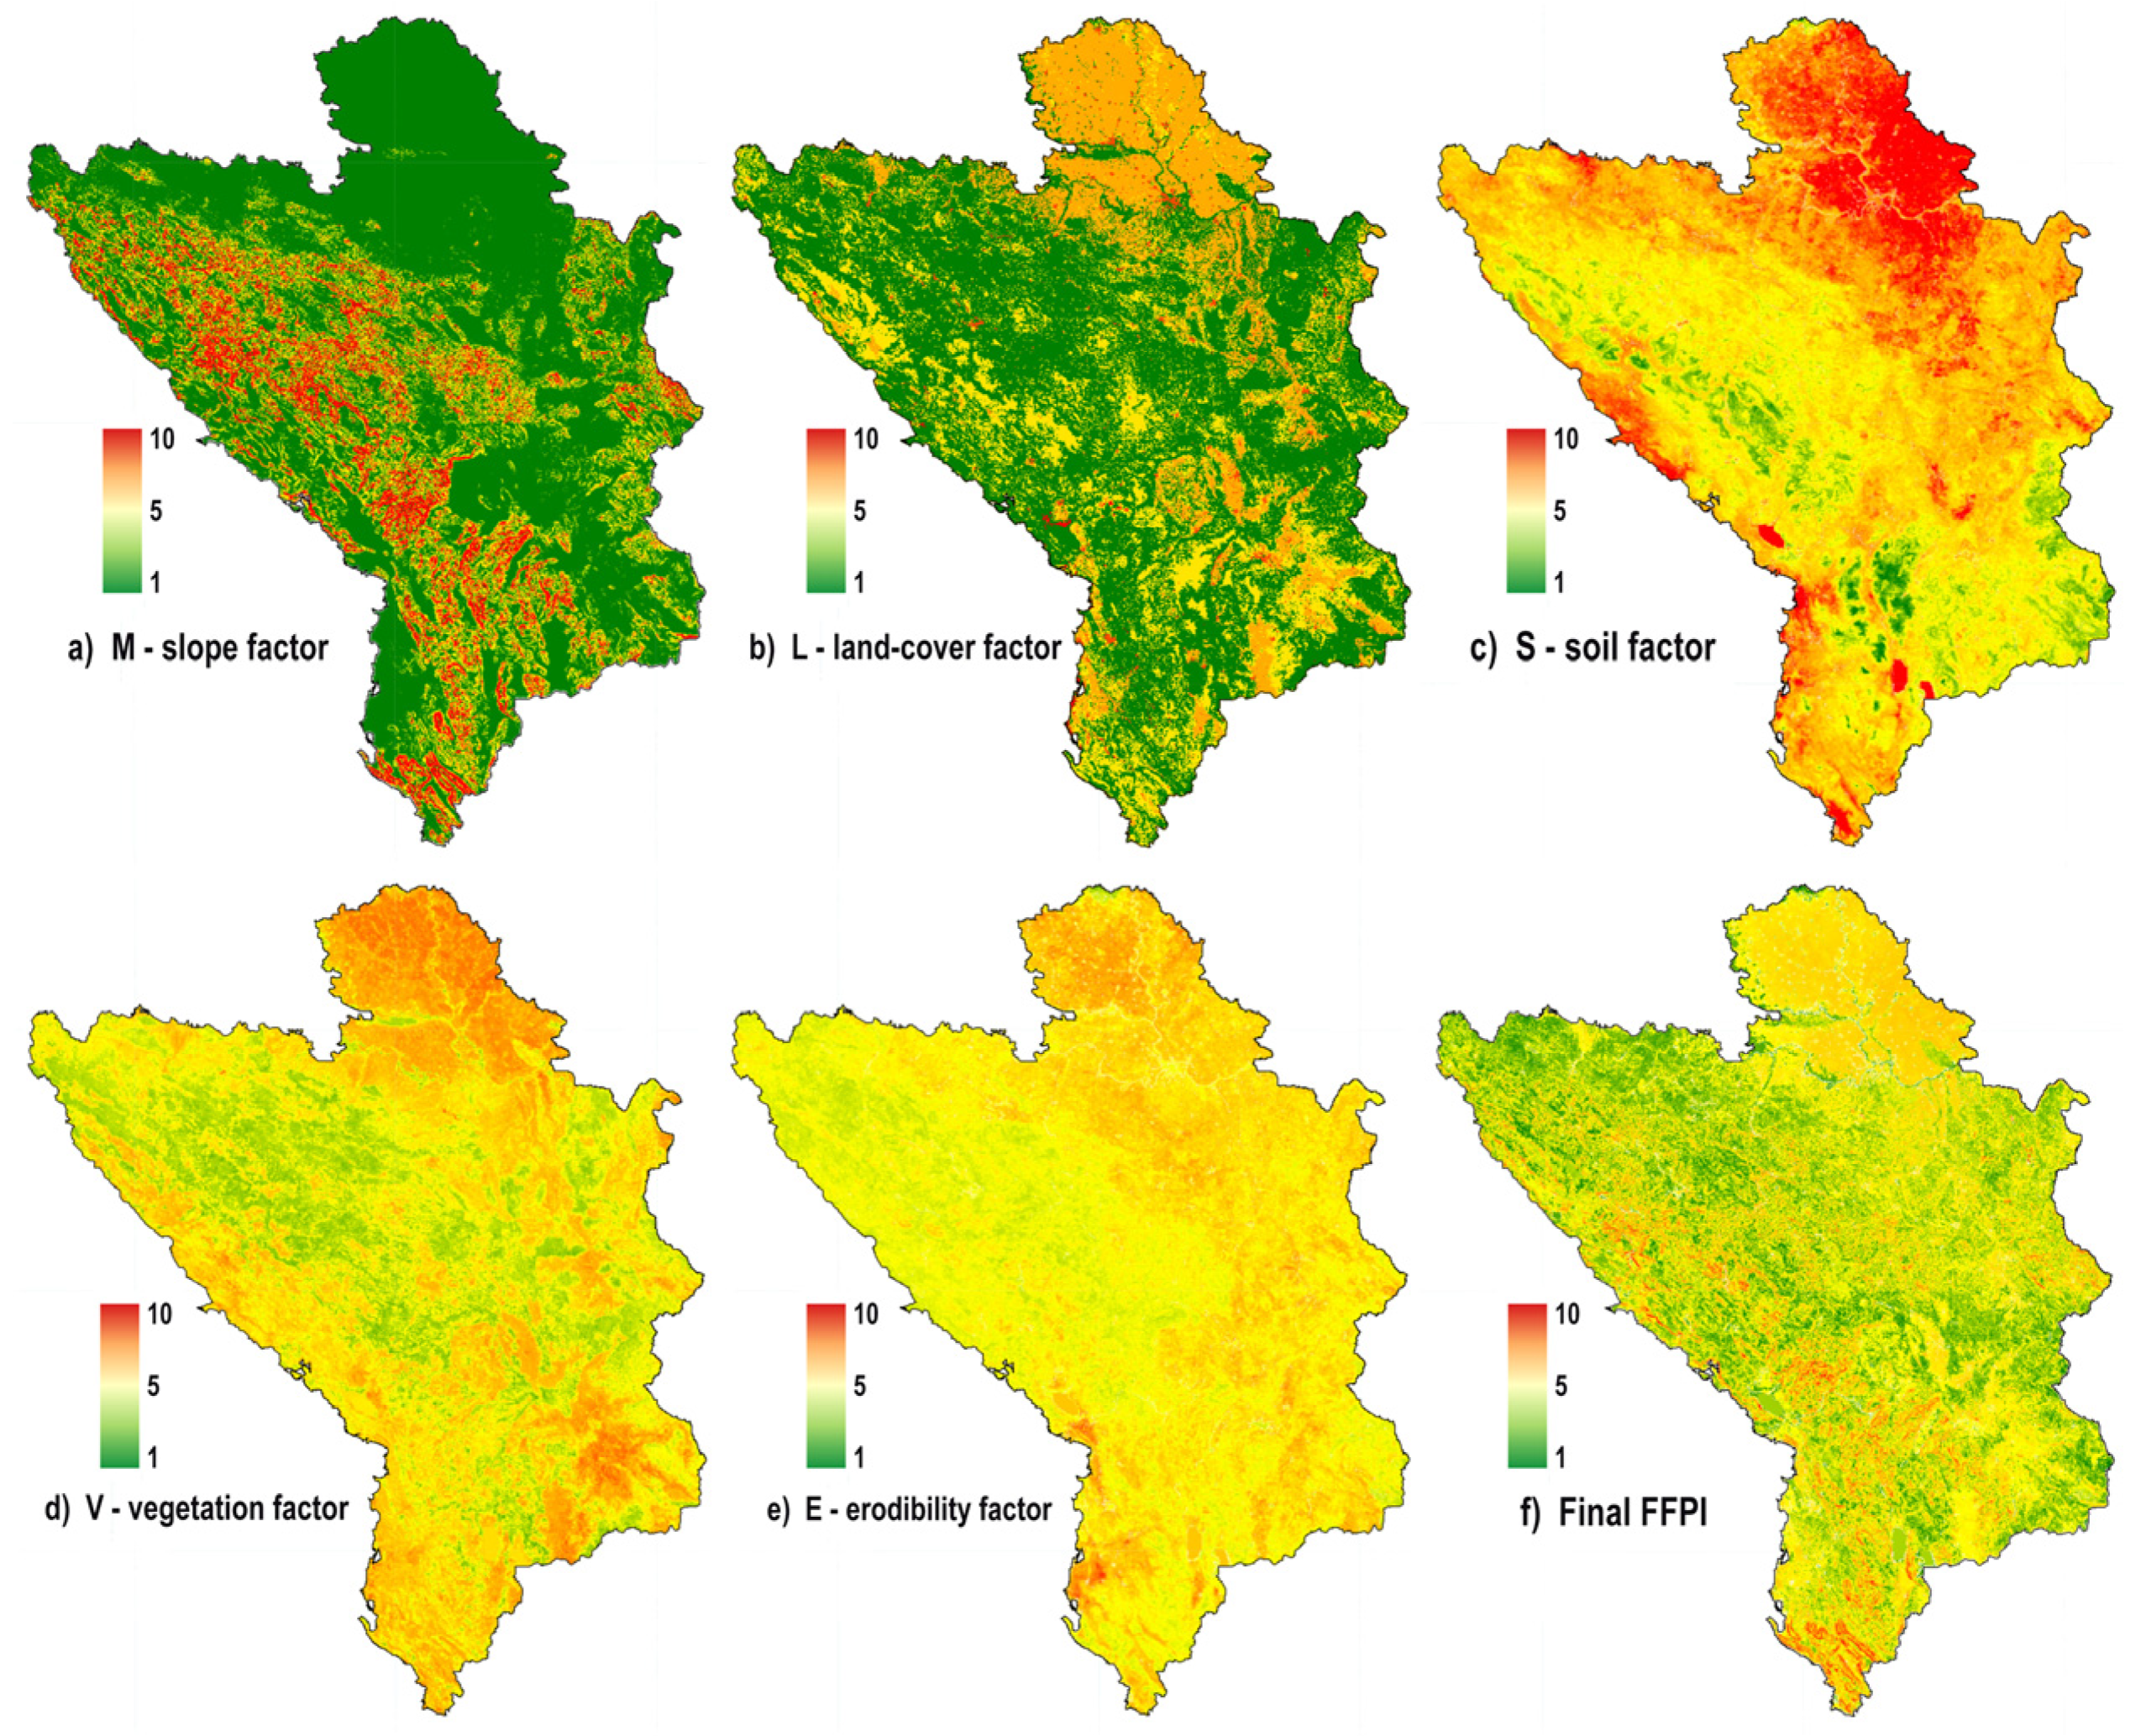
The full FFPI computation was performed in a single GEE script (described in Supplementary File S1) that integrates the five harmonized input layers and applies Equation (1) at the 30 m grid level (Figure 3). The principal advantages of this cloud-based implementation are (i) harmonization of input datasets across borders, which would otherwise be difficult to achieve with heterogeneous national geological, pedological, or topographic maps; (ii) reproducibility, since the script can be re-executed or extended by other research groups; and (iii) regional-scale processing capacity, which would be impractical on local infrastructure for an area exceeding 200,000 km2.

2.4. Sub-Basin-Scale Aggregation

For management and planning applications, pixel-level susceptibility maps are primarily useful as background patterns; operational decisions are almost always made at the sub-basin level. The 30 m modified FFPI was therefore aggregated using zonal statistics in QGIS (v. 4.0) across 9524 sub-basins delineated from the EU-Hydro v1.3 hydrographic database [51]. For each catchment, the mean FFPI was computed and used to classify sub-basins into five susceptibility classes (very low, low, moderate, high, and very high) using the natural breaks (Jenks) algorithm. Natural breaks were preferred because the regional FFPI distribution is internally heterogeneous, and fixed thresholds would obscure the relative ranking that is most relevant for sub-basin prioritization.

2.5. CHIRPS Rainfall-Triggered Hotspot Layer

The CHIRPS-derived maximum daily precipitation was used as a complementary triggering-potential layer designed to refine the prioritization of catchments where high physiographic susceptibility coincides with high observed rainfall extremes. The procedure was implemented in GEE using a dedicated script that processes CHIRPS daily precipitation data for 2001–2025 (25 years). First, the pixel-based maximum daily precipitation for the period was computed. This raster was aggregated to the sub-basin level using zonal statistics, and the mean maximum daily precipitation was assigned to each sub-basin. In parallel, the FFPI raster was averaged within the same sub-basin units. Both sub-basin-level variables—mean FFPI and mean maximum daily precipitation—were then classified into five ordinal classes, ranging from one (very low) to five (very high) using the Natural Breaks (Jenks) scheme. The FFPI susceptibility class and the CHIRPS maximum-daily-precipitation class were then combined using an equal-weight arithmetic mean:
Hotspot score = (FFPI class + CHIRPS class)/2
Because both inputs consisted of integer class values from one to five, the resulting hotspot score ranged from 1.0 to 5.0 in increments of 0.5. Scores below 2.0 were classified as very low; a score of 2.0 as low; scores from 2.5 to 3.0 as moderate; scores from 3.5 to 4.0 as high; and scores equal to or greater than 4.5 as very high. The procedure represents a transparent, equal-weight class-overlay approach intended for regional prioritization rather than a probabilistic or spatial–statistical hotspot analysis.
The term “hotspot” is used here descriptively and does not refer to Getis–Ord Gi* or any other spatial–statistical hotspot analysis. It denotes catchments where high-FFPI values coincide with high CHIRPS-derived maximum daily precipitation. Because CHIRPS has a coarser spatial resolution (~5 km) than many small EU-Hydro sub-basins, the rainfall-triggered hotspot layer is interpreted as a regional prioritization product rather than a catchment-scale rainfall–runoff simulation. Aggregation errors may occur for very small catchments (below ~10–25 km2), especially in the complex mountain terrain where CHIRPS is known to underestimate rare heavy-rainfall events [56]. Analytical processing was completed in QGIS v. 4.0, which was also used for the final cartographic layout, symbolization, and preparation of the exported figures.

2.6. Validation Methodology

Independent validation of regional flash-flood susceptibility models remains challenging in the WB owing to the absence of a harmonized transboundary flash-flood inventory and the limited number of gauged sub-basins available for statistical evaluation at the regional scale [55,57]. Following recent practice in regional susceptibility studies [14,20,21], a multi-source validation framework was adopted, and structured in four complementary components. All validation procedures are conducted in QGIS v. 4.0.

2.6.1. Spatial Overlap with Inventoried Torrential Catchments

Inventoried torrential catchments in the Vrbas–Ukrina basins of Bosnia and Herzegovina [13,15] were overlaid on the GEE-derived modified FFPI to test whether the high- and very-high-susceptibility classes coincide spatially with previously delineated torrential units. Agreement is expressed as the percentage of the reference torrential area that falls within the high-to-very-high-FFPI classes.

2.6.2. Comparison with a Published Susceptibility Map

The GIS-based torrential-flood susceptibility map of the Kolubara basin in Serbia [38], produced through an established conventional procedure, was compared class-by-class with the GEE-derived modified FFPI, focusing on the extent and spatial concentration of the highest susceptibility classes.

2.6.3. Event-Based Validation

Because a harmonized transboundary flash-flood event inventory is not available for the Western Balkans, an independent, physically based validation was performed for the Pčinja (in North Macedonia and Serbia) and Bregalnica (in North Macedonia) basins, two representative Vardar tributaries with contrasting relief, land cover, and flash-flood history. Each of the 336 EU-Hydro sub-basins in the combined study area was visually inspected in the field and by ~0.5 m Google Earth imagery (2020–2024). Following the procedure, a binary flood-evidence label was assigned: one when clear geomorphological signatures of past torrential activity were identified within the sub-basin, including fresh alluvial fan or debris-cone deposits, coarse boulder accumulations along channel margins, freshly incised channels, torrential levees, or streambed armouring atypical of the local baseflow regime, and zero when no such evidence could be observed. The field and orthophoto-based interpretation were cross-checked against media reports of documented flash-flood events for 1960–2025 to reduce interpretive bias. In total, 178 of the 336 sub-basins (53.0%) were flagged as flood-positive.
This procedure differs from conventional event-inventory validation in that it captures the cumulative geomorphological imprint of torrential activity rather than individual dated events. It therefore provides a spatially exhaustive reference dataset well-suited for evaluating a physiography-based susceptibility index, while remaining independent of the FFPI conditioning factors.

2.6.4. Threshold-Independent and Threshold-Dependent Statistical Metrics

For the 336 validated sub-basins in the pooled Pčinja–Bregalnica test area, threshold-independent and threshold-dependent classification metrics were computed. The mean FFPI value per sub-basin was used as a continuous predictor to derive the Receiver Operating Characteristic (ROC) curve and the corresponding Area Under the Curve (AUC-ROC). Youden’s J statistic (J = TPR − FPR) was then applied to identify the optimal decision threshold on the FFPI scale. At that threshold, a confusion matrix was constructed and used to compute accuracy, precision, recall, the F1-score, and Cohen’s Kappa. This combination of continuous and thresholded metrics is consistent with current practice in GIS- and ML-based flash-flood susceptibility studies, where AUC-ROC is used for overall discrimination and F1/Kappa are used to evaluate operational classification performance at a chosen decision boundary [21,22]. All statistical computations were performed in Python 3.11 using the scikit-learn library.

3. Results

3.1. Regional Spatial Pattern of FFPI

The pixel-based FFPI (Figure 3f) ranges from 2.53 to 9.10 across the WB, with a regional mean of 5.28, indicating an overall predominance of moderate-to-elevated flash-flood susceptibility. Country-level differences are clear and geomorphologically meaningful. The highest country-mean FFPI is found in Albania (5.73), followed by North Macedonia (5.34), Montenegro (5.30), Bosnia and Herzegovina (5.08), and Serbia (5.05). This ranking reflects the combined influence of relief energy, vegetation cover, and soil characteristics: the steeper, more dissected, and partly deforested Adriatic-facing mountains generate consistently higher FFPI values than the broader, gentler interior basins. Spatially, a wide belt of enhanced flash-flood susceptibility extends across Albania, Montenegro, much of North Macedonia, and several mountainous and hilly sectors of central and southern Serbia, with additional clusters in eastern Bosnia and Herzegovina. In the context of the major drainage systems, higher FFPI values are particularly characteristic of catchments draining toward the Adriatic and Aegean basins and of the smaller, steeper tributary systems within the southern part of the Danube basin. By contrast, low FFPI classes are concentrated in the flatter northern parts of the region, particularly in the broader Danube lowlands of northern Serbia, including parts of the Tisa, lower Sava, and lower Morava drainage areas, and along the lower Sava in Bosnia and Herzegovina, where slope and relief energy are limited despite locally unfavourable land-cover or soil conditions.

3.2. Sub-Basin-Scale Ranking

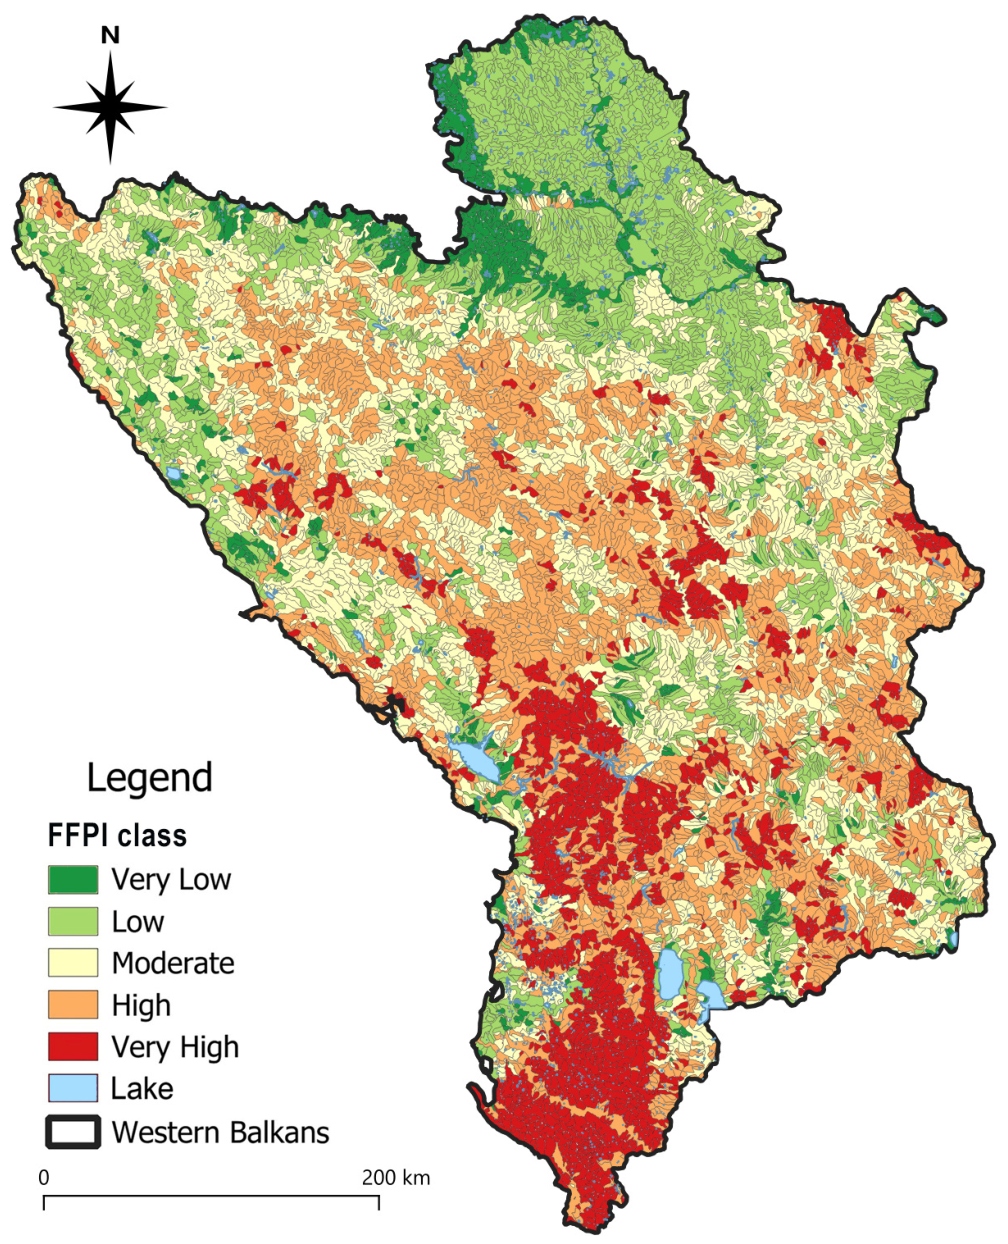
At the sub-basin scale, aggregation of the FFPI across the 9524 EU-Hydro sub-basins produces a distribution skewed toward the central and upper part of the susceptibility spectrum (Figure 4). High susceptibility is the most frequent class, accounting for 28.5% of sub-basins (29.4% of the regional area), while the combined high and very-high classes encompass 44.2% of sub-basins and 42.5% of the area (Table 2). Only 8.6% of sub-basins, covering 5.6% of the area, fall into the very low class. The sub-basin-based ranking translates the continuous susceptibility surface into a discrete list of operational units. Very-high-susceptibility sub-basins are concentrated in the headwaters of the Drini, Vjosa, and Semani in Albania; the Tara, Lim, and Morača in Montenegro; the Vardar tributaries (Treska, Crna Reka, Pčinja, Bregalnica) in North Macedonia; the Ibar and South Morava in Serbia; and the Neretva and Vrbas in Bosnia and Herzegovina. The 42.5% of the WB area classified as high or very high is thus organized into a comparatively large number of compact, mostly mountainous catchments—precisely the scale at which torrent-control works, soil-conservation measures, and early-warning systems can realistically be designed.

3.3. Rainfall-Triggered FFPI Hotspots

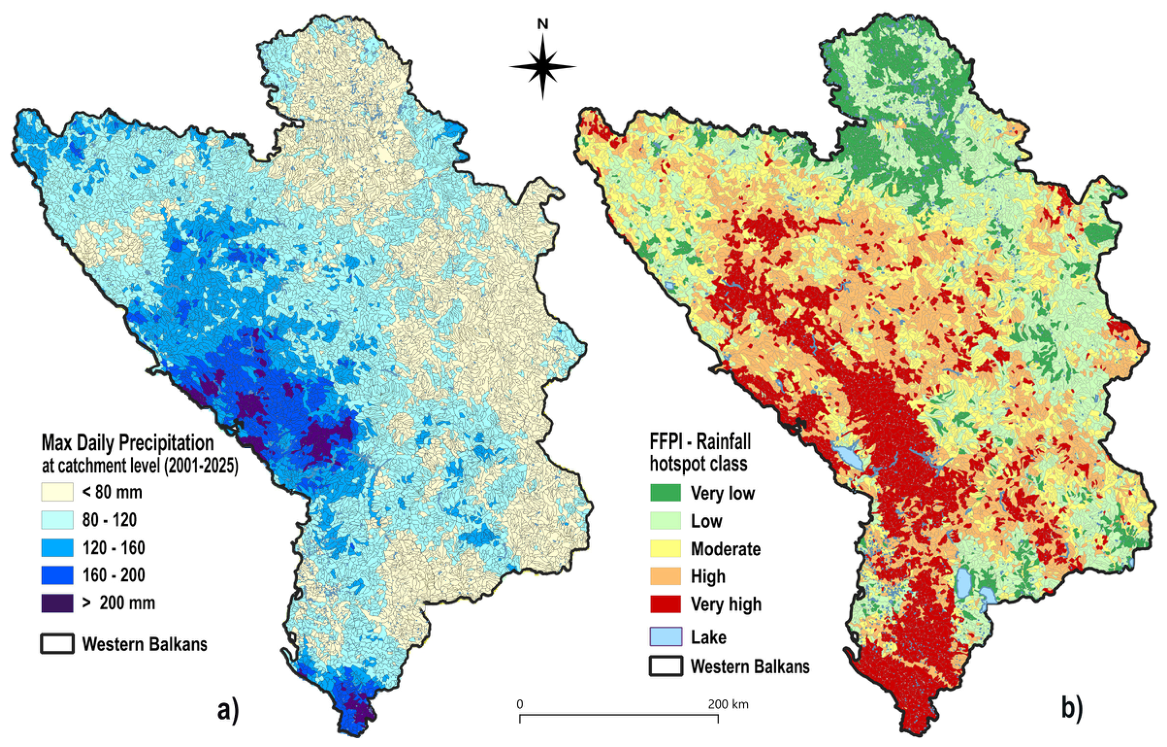
Integration of sub-basin-scale FFPI with CHIRPS-derived maximum daily precipitation provides an additional perspective on where intrinsic flash-flood susceptibility coincides with strong rainfall-trigger potential (Figure 5). The highest combined values are concentrated along the Adriatic-facing mountain belt, particularly in Albania, Montenegro, and parts of Bosnia and Herzegovina, where high maximum daily precipitation overlaps with steep and highly dissected sub-basins. Additional high and very-high-hotspot classes occur across North Macedonia and in several mountainous tributary basins of Serbia. Compared to the FFPI-only classification, the combined FFPI–rainfall hotspot index produces a similar overall extent of priority sub-basins but with a clearer emphasis on catchments where high susceptibility coincides with high rainfall-trigger potential. The FFPI-only map classifies 4207 sub-basins (44.2% of the total), covering 42.5% of the WB area, as high or very-high susceptibility. The rainfall-triggered hotspot map identifies 4138 sub-basins (43.4%), covering 43.9% of the area, within the same two classes. Although the total share is similar, the combined index redistributes more sub-basins into the very-high class (2027, or 21.3%, versus 1493, or 15.7%, in the FFPI-only classification), indicating that the combined index does not simply reproduce the terrain-controlled FFPI pattern but also highlights sub-basins where physiographic susceptibility is reinforced by high observed maximum daily precipitation.

3.4. Validation Results

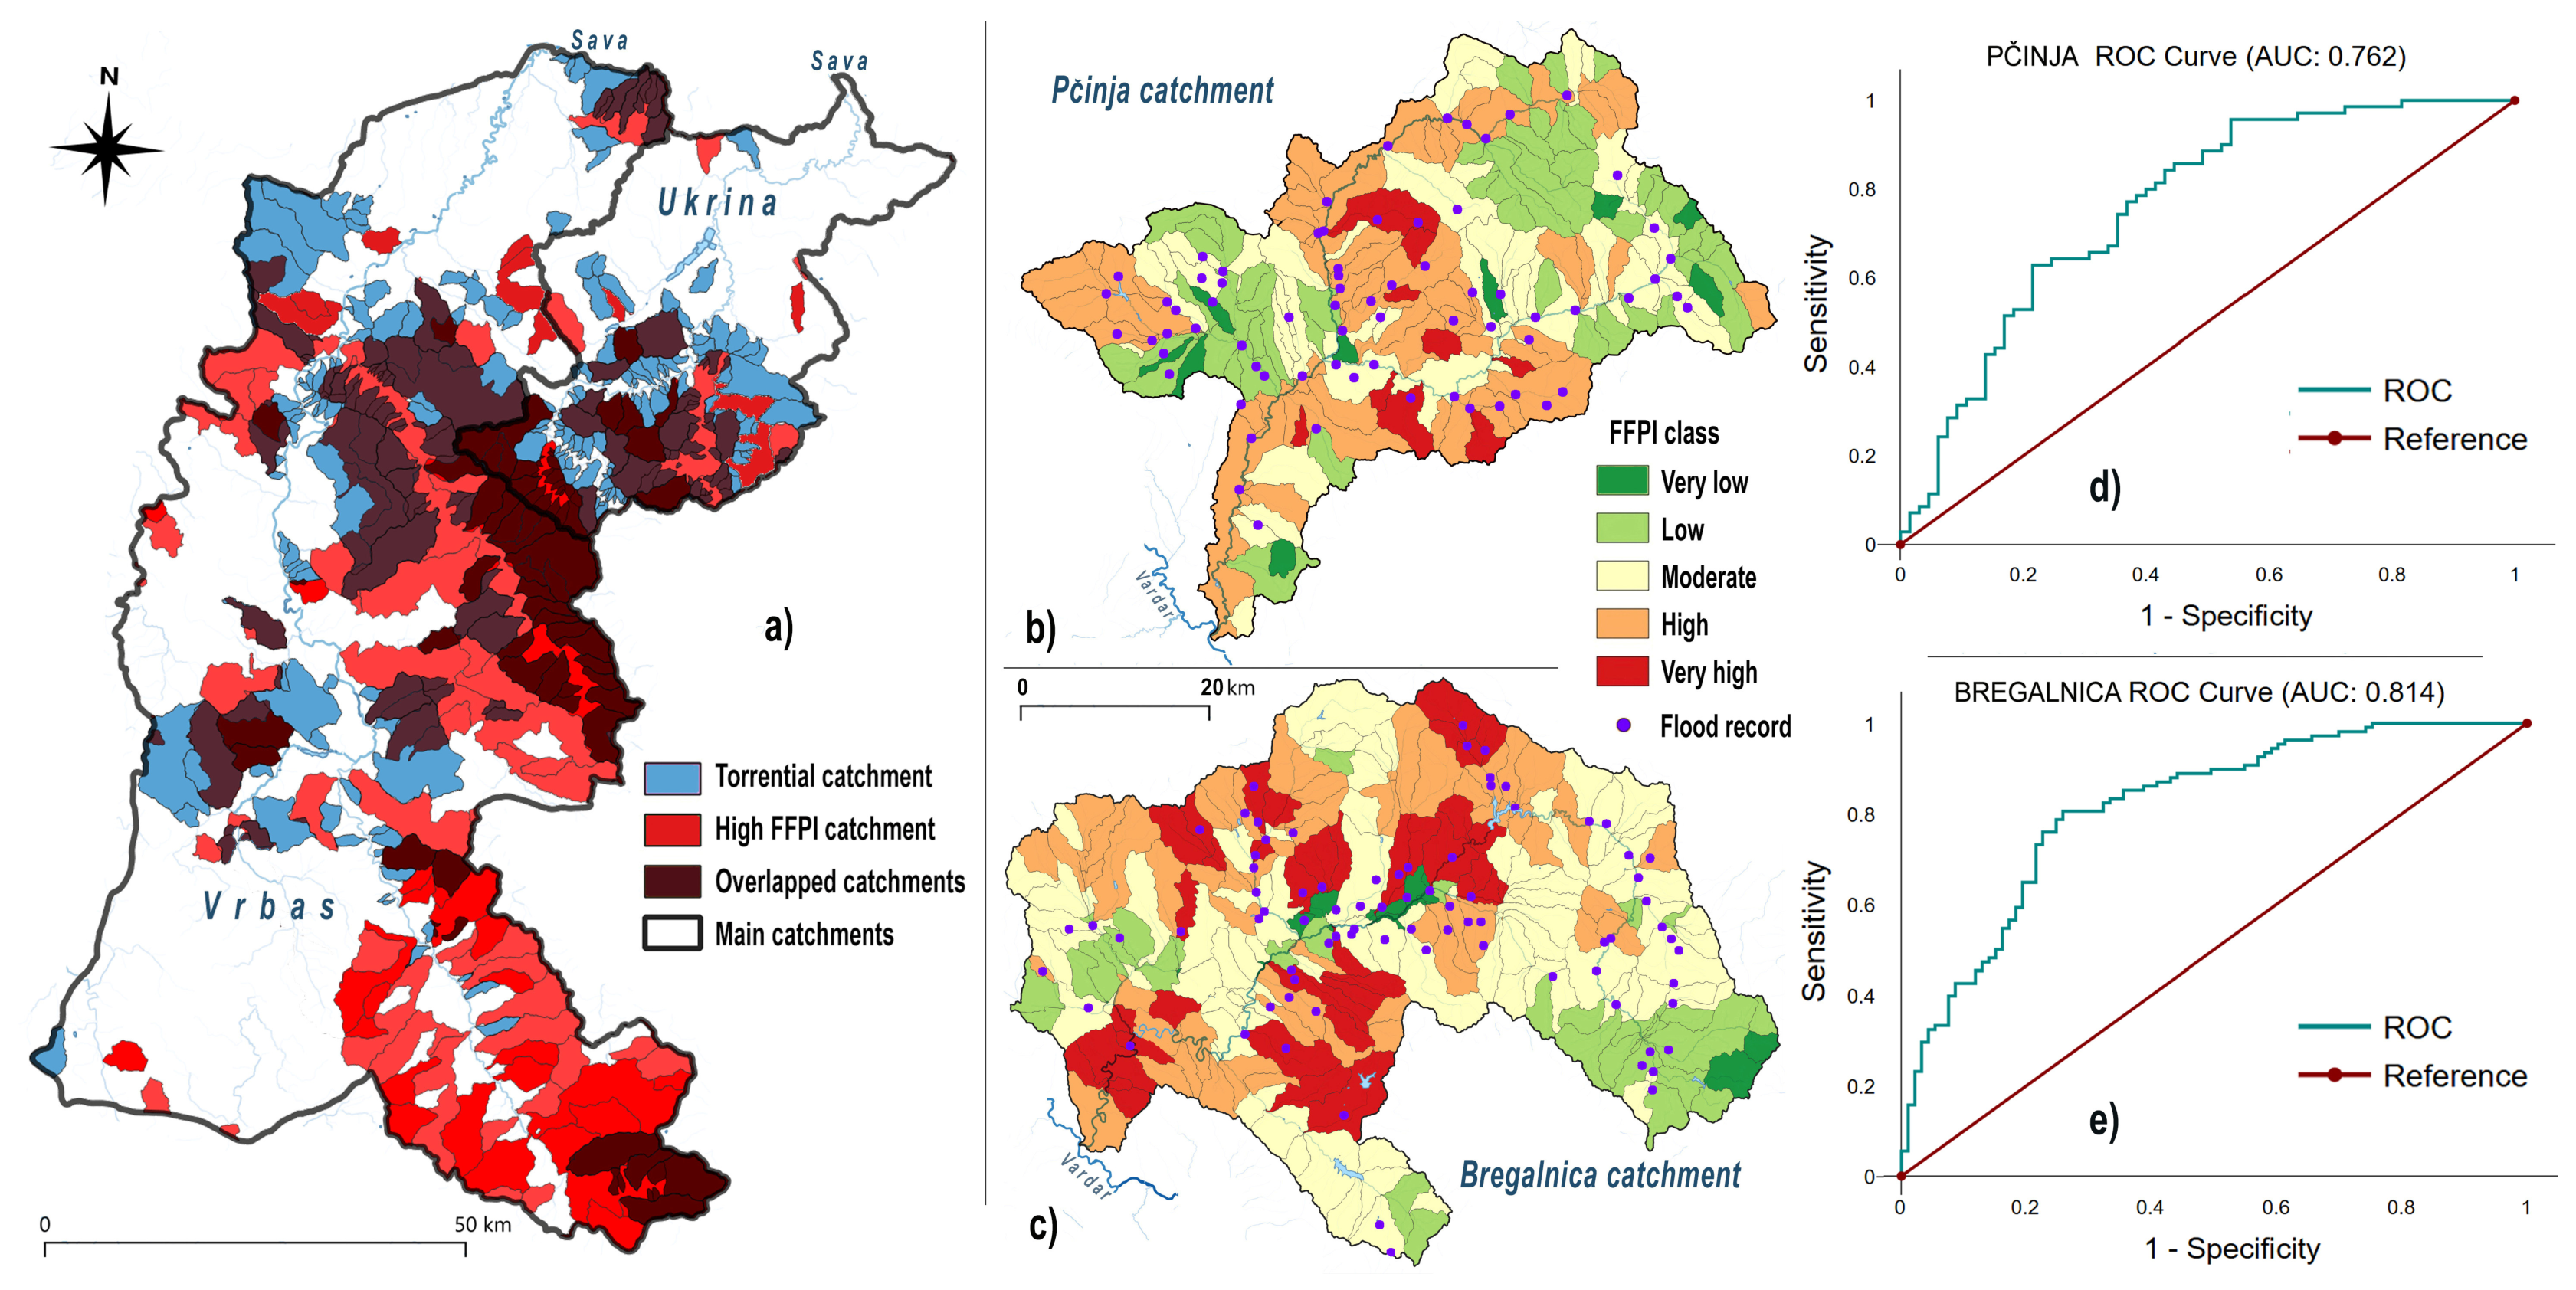
The independent validation tests confirm that the GEE-based FFPI captures the main features of flash-flood-prone terrain in the WB (Table 3, Figure 6). In the Vrbas (6288.6 km2) and Ukrina (1506.0 km2) basins, previously inventoried torrential catchments [13,15] cover 2304.7 km2 (29.5% of the total area), while the GEE model identifies 3183.1 km2 (40.7%) as belonging to the high and very-high-FFPI classes. The spatial overlap between the inventoried torrential sub-basins and the GEE-derived high-to-very-high-FFPI area amounts to 1512.5 km2, i.e., 68.6% of the reference torrential area (Figure 6a). The differences between the FFPI results and the reference torrential catchments can have several reasons. Some torrential catchments may be affected by local channel conditions, past land degradation, or specific rainfall events that are not included in the regional FFPI factors. On the other hand, some areas with high or very-high-FFPI values may not have recorded torrential events in the available inventory. This does not necessarily mean that these areas are false positives, since the inventory is based on documented or previously mapped events and may not include all susceptible areas. Differences in mapping scale and inventory completeness may also contribute to the observed differences. Therefore, the 68.6% agreement should be considered as a good spatial correspondence between the two datasets, rather than as a conventional accuracy measure. In the Kolubara basin, one of the most flash-flood-prone basins in Serbia, the GEE model classifies 14.2% of the basin area as high or very-high FFPI, against 17.8% in the reference GIS- and field-based map of Kostadinov et al. [38], with a difference of only 3.6%. The spatial distribution of high-susceptibility units is also broadly consistent between the two approaches, with comparable concentration in the upper, mountainous parts of the basin.
For the pooled Pčinja–Bregalnica test area (7190.7 km2; n = 336 sub-basins; 178 flood-positive, 158 negative), the mean sub-basin FFPI provides good discrimination between flood-positive and flood-negative sub-basins (AUC-ROC = 0.79; Figure 6b–e). At the Youden-optimal threshold (FFPI ≥ 5.31), the confusion matrix yields TP = 145, FP = 52, FN = 33, TN = 106, corresponding to F1 = 0.77, Cohen’s Kappa = 0.49 (moderate agreement), and an overall accuracy of 0.75. Per-basin analyses confirm that the discrimination is stable across the two independent test areas (AUC-ROC = 0.81 for Bregalnica and 0.76 for Pčinja), and the mean FFPI in flood-positive sub-basins is significantly higher than in flood-negative sub-basins in both catchments (Mann–Whitney U-test, p < 10−7). These results are comparable to those reported for FFPI at the national scale in North Macedonia (AUC-ROC = 0.78 [10]) and higher than several published GIS-based flash-flood susceptibility studies in Romania [31], Morocco [37], and Egypt [21]. These threshold-independent metrics are reported only for subsets in which the reference events can be reliably attributed to flash-flood processes, to avoid overreliance on inventories that mix riverine and torrential events, following the recommendations of Rahmati et al. [57] and Costache et al. [55].
Taken together, the four validation components indicate that the GEE-based FFPI is not only geomorphologically plausible but also broadly consistent with expert-based torrent inventories, an independent reference map, and observed flood occurrence in two independent basins. The framework can therefore be considered suitable for first-order regional screening, while detailed local applications should continue to rely on higher-resolution hydrological, hydraulic, and field-based assessment. Although the rainfall-triggered hotspot layer was not validated as an independent event-based rainfall–runoff model, its spatial pattern is consistent with the validated FFPI results and provides a more targeted interpretation of sub-basins where both physiographic predisposition and rainfall-trigger potential are elevated.

4. Discussion

4.1. Regional Patterns and Methodological Evaluation

The regional FFPI derived from the GEE-based framework reveals a clear and coherent spatial structure of flash-flood susceptibility across the WB. Susceptibility is strongly organized along a combined north–south and lowland–mountain gradient, with the highest values consistently concentrated in the southwestern and southern sectors of the region (see Figure 4). These include Albania, Montenegro, southern and central North Macedonia, the upper Ibar and South Morava in Serbia, and the eastern Dinarides in Bosnia and Herzegovina. This pattern reflects the well-established coupling between high rainfall energy, steep and dissected relief, and locally degraded vegetation that characterizes Mediterranean and sub-Mediterranean mountain hydrology. It is also consistent with the rainfall erosivity maps recently produced for the WB [41], which identify the highest R-factor values along precisely the same Adriatic-facing mountain front.
A key methodological outcome of this study is the demonstration that sub-basin-scale aggregation substantially enhances the operational relevance of physiography-based susceptibility modelling. While pixel-level results help understand the underlying structure of susceptibility, management measures such as torrent control, retention basins, afforestation, land-use regulation, and early-warning systems are designed and implemented at the catchment level. The ranking of over 9500 EU-Hydro sub-basins based on mean FFPI transforms a continuous regional surface into a defined, operational list of basins that can be used directly in flood-risk planning. Similar sub-basin-based prioritization has been adopted in flash-flood applications across Romania [31,33], Greece, Slovenia, and other Mediterranean countries [1,37], but no previous study has applied this logic uniformly across the entire WB at 30 m resolution. In Romania, the recently developed RO-FED database contains 1084 documented flood events covering the period 1234–2024, confirming the long-term and widespread occurrence of flooding under diverse physiographic conditions [58]. FFPI studies in the Bâsca Chiojdului, Prahova, and Vărbilău catchments identify Carpathian and Subcarpathian headwaters as the main hotspots, with high-FFPI classes typically covering 30–45% of the catchment areas [30,31,33,59]. Comparable proportions were reported by Zaharia et al. [31] for the Prahova basin (about 40% high to very high), which is in the same range as the 44.2% of high-to-very-high sub-basins found here for the WB.
In Croatia, approximately 16.0% of the national territory is exposed to flood risk, and illustrates the importance of intense rainfall, terrain configuration, and urban surface characteristics in pluvial flash-flood assessment [18]. Similarly, extensive flood exposure in Slovenia within the Danube River Basin further emphasizes the importance of catchment-based assessment and effective warning systems [60]. FFPI and related indices applied in Slovenia and Croatia to Alpine–Dinaric transition catchments similarly emphasize steep, small headwaters as flash-flood hotspots [18,20,61], while Mediterranean applications in Greece and southern Italy [1,37] report FFPI-driven susceptibility patterns dominated by short, high-gradient basins with low soil storage capacity. In Serbia, North Macedonia, and Bosnia and Herzegovina, national- and basin-scale studies [10,11,12,13,14,15,16,17,38] have documented very high flash-flood susceptibility in mountainous headwaters draining toward the Adriatic and the Aegean, matching the sub-basin-level pattern derived here.
However, the similarity of high-to-very high-FFPI-class distributions should not be interpreted as evidence that the different regions have identical absolute flash-flood susceptibility. Two mechanisms probably contribute to this convergence. First, many of the compared study areas share broadly similar mountain physiography, including steep headwaters, strong relief dissection, relatively thin soils, and Mediterranean to continental rainfall regimes, which naturally produces comparable FFPI responses. Second, part of the similarity may arise from the structure of the FFPI methodology itself and from the use of relative five-class classification schemes, particularly Natural Breaks (Jenks), which partition continuous susceptibility distributions according to internal data structure rather than fixed physical thresholds. Consequently, the proportion assigned to high and very-high classes is partly dataset- and classification-dependent. The 44.2% obtained for the Western Balkans should therefore be interpreted primarily as a relative regional prioritization measure, rather than as an absolute hazard threshold directly transferable between studies.
Furthermore, Popa et al. (2019) [62] noted that flash-flood activity is generally more pronounced in Mediterranean environments, which is particularly relevant to the WB because of the combined influence of steep relief and transitional climatic conditions. Although these studies differ in spatial scale, methodological design, conditioning factors, and classification thresholds, they support the use of a harmonized regional framework for comparing flash-flood susceptibility across the contrasting environments of the WB.
The novel contribution of the present study is that it provides, for the first time, a harmonized cross-country FFPI implementation for the entire WB at 30 m resolution and 9524 EU-Hydro sub-basins, using a single reproducible GEE workflow. Compared to national and sub-national studies, the framework enables direct sub-basin-level comparison across administrative borders, which is important because many flash-flood-prone basins in the region are transboundary. Compared to global susceptibility products [3,20], the 30 m grid and the sub-basin aggregation preserve the terrain heterogeneity that is essential for identifying operationally relevant flash-flood catchments.
Relative to data-driven susceptibility approaches such as random forest, XGBoost, and neural networks—now widely used in Mediterranean and Middle-Eastern settings [21,23,24,37]—the FFPI approach is transparent, does not require ground-truth event samples, and can be replicated in regions with sparse inventories. Reported AUC-ROC values for machine-learning flash-flood models in Mediterranean basins typically range from 0.85 to 0.98 [21,23,24], generally higher than the 0.76–0.81 obtained here, but at the cost of stronger dependence on high-quality inventory data. The FFPI is therefore complementary rather than competing: it is best interpreted as a first-order regional screening tool that can guide the deployment of more data-hungry local models in the sub-basins it flags as high or very-high susceptibility.
The integration of CHIRPS-derived maximum daily precipitation with the FFPI provides an additional layer of interpretive value by distinguishing areas where intrinsic susceptibility coincides with strong rainfall forcing. It should be emphasized that CHIRPS precipitation was not incorporated into the FFPI computation itself, but was applied as a complementary layer to distinguish susceptible sub-basins that are additionally exposed to high rainfall-trigger potential. The resulting combined hotspot pattern is more selective than the FFPI-only classification and emphasizes a subset of sub-basins where physiographic predisposition is reinforced by observed precipitation extremes (see Figure 5). This is particularly evident along the Adriatic mountain chain, where steep terrain and high rainfall maxima overlap. The reduction in the number of high-priority sub-basins relative to the FFPI-only map suggests that rainfall constraints refine, rather than simply replicate, the physiography-driven susceptibility structure, improving the discrimination of areas most exposed to compound flash-flood triggering conditions.
The principal methodological strength of the approach lies in its methodological consistency across national boundaries. By relying on globally harmonized datasets (Copernicus DEM, ESA WorldCover, SoilGrids, Sentinel-2, CHIRPS, and EU-Hydro) and implementing a single processing workflow within GEE, the analysis avoids inconsistencies associated with heterogeneous national geospatial products. These inconsistencies include differences in spatial resolution, thematic classification, data availability, mapping standards, and preprocessing procedures among national geospatial datasets, all of which are minimized through the use of harmonized continental and global datasets within a single GEE workflow. This uniformity is particularly important in the WB, where many flash-flood-prone basins are transboundary and where differences in mapping standards have historically limited regional comparability. The resulting framework therefore provides a consistent regional baseline for susceptibility assessment that is directly transferable across administrative borders. Unlike previous national- and catchment-scale FFPI studies in the WB, the proposed framework applies a single harmonized methodology across the entire region, enabling the direct comparison of flash-flood susceptibility among transboundary basins.
Validation against independent reference datasets indicates overall good correspondence between model outputs and observed or previously mapped flood-prone areas. Spatial agreement with inventoried torrential catchments in the Vrbas–Ukrina basins, consistency with the Kolubara basin susceptibility map, and concordance with historical flood records in the Pčinja and Bregalnica basins collectively support the reliability of the FFPI for regional screening purposes (see Figure 6). Nevertheless, differences between modelled susceptibility and historical event distributions suggest that the FFPI should be interpreted primarily as a measure of intrinsic predisposition rather than event-specific flood occurrence. This is consistent with its conceptual design and with findings from comparable large-scale susceptibility studies. A related methodological framework has previously been applied at the national scale in North Macedonia, where ROC–AUC validation yielded a value of 78.2% [63].

4.2. Limitations and Future Research

Several limitations should be acknowledged. First, the FFPI component applied here is, by design, a predominantly static physiography-based susceptibility index. It captures the intrinsic predisposition of a sub-basin to generate flash floods, but it does not explicitly incorporate dynamic controls such as antecedent soil moisture, rainfall sequencing, snowmelt, or storm clustering. In the present study, this limitation is partly reduced by the complementary rainfall-triggered hotspot layer derived from CHIRPS daily precipitation, although that layer should still be interpreted as a prioritization product rather than as a fully dynamic hydrological model. A logical next step toward dynamic regional flood-risk assessment is to combine the GEE-based FFPI with near-real-time precipitation products (CHIRPS, ERA5, NASA GPM), as Milevski et al. [10] demonstrated at the national level. In addition, several input variables are derived from proxy datasets, including soil erodibility, vegetation cover, and soil properties, which may not fully capture local heterogeneity, particularly in complex karst environments. In karst-dominated catchments, subsurface drainage, sinkholes, losing streams, and rapid conduit flow may substantially modify runoff generation and flow routing, processes that are not explicitly represented by the current FFPI formulation. This limitation is particularly relevant along the Dinaric belt, where dolinas, poljes, karst conduits, and highly variable infiltration capacity further complicate the hydrological response [43,64,65]. High-gradient carbonate slopes with large internal drainage networks may divert a substantial share of rainfall into rapid underground flow, so that surface runoff remains below what is inferred from slope, land-cover, and BSI signatures alone. Conversely, intense rainfall over thin soils, steep karst slopes, or hydraulically constrained poljes can still generate rapid surface runoff where infiltration capacity is exceeded or where underground drainage becomes saturated, occasionally producing characteristic “karst flash floods” [64].
Consequently, susceptibility may be locally overestimated where infiltration into karst systems reduces surface runoff, or underestimated where rapid underground flow re-emerges through karst springs and contributes to downstream flooding. For these reasons, FFPI values in carbonate terrains should be interpreted as physiographic susceptibility under conditions of intense rainfall and limited infiltration, rather than as a fully coupled hydrological simulation. Some overestimation is therefore expected in parts of the Dinaric karst identified here as having very high susceptibility, particularly in dry-season conditions when karst storage is not saturated. This limitation is common to all physiography-based indices and cannot be resolved without explicit karst hydrological modelling [65,66], which lies beyond the scope of regional screening work. The results for extensive carbonate terrains should therefore be interpreted with additional caution.
Further uncertainty arises from differences in resolution among input datasets and from the weighting structure of the FFPI, which may influence absolute susceptibility values. SoilGrids, originally available at 250 m resolution, was resampled to 30 m to ensure consistency with the other layers. Although this procedure does not increase the actual level of spatial detail, its influence is expected to be mainly local, affecting the representation of soil and erodibility variability rather than the overall regional pattern of flash-flood susceptibility. The absence of a fully harmonized transboundary flash-flood inventory limits wider statistical validation and remains a key research gap for the region.
Data-driven techniques (random forest, XGBoost, graph neural networks) could then be nested within the FFPI framework so that the WB benefits from both the transparency of a physiography-based index and the predictive performance of modern machine-learning classifiers.
From a practical perspective, the sub-basins identified here as highly susceptible should be considered priority units for integrated water management and disaster risk reduction measures. These include the maintenance and restoration of headwater vegetation, the construction or upgrading of torrent-control structures, the controlled regulation of grazing and land-use change in steep terrain, and the protection of floodplains and riparian buffers downstream. Nature-based solutions (NBS) appear particularly well-suited to the WB, where steep, deforested mountain catchments and torrential regimes make conventional hard-engineering responses both costly and ecologically disruptive [67,68,69]. Prioritizing NBS measures in the catchments flagged by the GEE-based FFPI as high or very-high susceptibility would align directly with the EU Green Agenda for the WB and with the Sendai Framework for Disaster Risk Reduction 2015–2030, providing a concrete pathway from regional susceptibility mapping to coordinated transboundary action.

5. Conclusions

This study presents a regionally consistent, cloud-based evaluation of flash-flood susceptibility for the WB using a GEE-implemented FFPI. The findings show a coherent spatial pattern, with elevated susceptibility concentrated in steep, dissected mountain environments along the Adriatic-facing Dinarides and in key headwater systems, and lower values across the Pannonian lowlands and inner basins. This contrast reflects the combined influence of relief, land cover, and climatic forcing that governs flash-flood generation in the region.
At the sub-basin scale, the aggregation of FFPI values across 9524 EU-Hydro sub-basins shows that approximately 44% of the region falls within the high- or very-high-susceptibility classes. This transformation of a continuous surface into discrete hydrological units provides an operationally relevant basis for prioritizing sub-basins for soil conservation, torrent control, land-use planning, and early-warning development, particularly in rapidly responding mountain headwaters.
The four-component validation—spatial overlap with inventoried torrential catchments, comparison with a published GIS-based susceptibility map, event concordance with historical flood records, and threshold-based statistical metrics on 336 orthophoto-validated sub-basins—indicates moderate-to-very-strong agreement (68.6–92.0%; AUC-ROC = 0.79; F1 = 0.77; Cohen’s Kappa = 0.49) between modelled susceptibility and independent reference data. The framework should thus be considered suitable for first-order regional screening, while local engineering applications require higher-resolution hydrological, hydraulic, and field-based assessment.
The inclusion of a rainfall-enhanced FFPI layer further illustrates how static physiographic susceptibility can be refined by incorporating precipitation extremes, thereby improving the identification of catchments where terrain predisposition and rainfall forcing coincide. Future developments should focus on integrating near-real-time hydrometeorological products, developing karst-aware and dynamic modelling components, and building a harmonized transboundary flood-event inventory. Together, these advances would support the transition from static susceptibility mapping toward fully dynamic, operational flash-flood forecasting frameworks for the WB, and consolidate cloud-based, harmonized geospatial approaches as a viable strategy to overcome cross-border data fragmentation in hazard assessment.

Supplementary Materials

The following supporting information can be downloaded at https://www.mdpi.com/article/10.3390/earth7050141/s1, Supplementary File S1: Detailed Google Earth Engine Workflow for the Regional Modified Flash Flood Potential Index (FFPI) Assessment; Table S1: Principal datasets and imported objects. The nominal 30 m output grid harmonizes raster geometry but does not increase the original information content of SoilGrids or CHIRPS; Table S2: Revised handling of no-data and non-terrestrial pixels. Fallback values prevent mask propagation but do not create new local information; Table S3: Factor scoring and revised no-data treatment implemented in the reproducible workflow; Table S4: Diagnostic guide for the most common implementation and interpretation problems; Table S5: Recommended components of the supplementary reproducibility archive.

Author Contributions

Conceptualization, I.M.; methodology, I.M.; software, I.M.; validation, I.M. and B.A.; formal analysis, I.M. and B.A.; investigation, I.M. and B.A.; resources, I.M.; data curation, I.M. and B.A.; writing—original draft preparation, I.M. and B.A.; writing—review and editing, I.M., B.A. and P.G.; visualization, I.M. and B.A.; supervision, I.M. and P.G.; project administration, I.M. All authors have read and agreed to the published version of the manuscript.

Funding

This research received no external funding.

Institutional Review Board Statement

Not applicable.

Informed Consent Statement

Not applicable.

Data Availability Statement

The input datasets used in this study are publicly available through their respective providers: Copernicus GLO-30 DEM [45] (European Space Agency), ESA WorldCover 2021 [44] (ESA WorldCover Consortium), SoilGrids 2.0 (ISRIC), Sentinel-2 imagery (European Space Agency/Copernicus), CHIRPS daily precipitation (Climate Hazards Centre, UC Santa Barbara), and EU-Hydro v1.3 (European Environment Agency/Copernicus Land Monitoring Service). The Google Earth Engine scripts developed for the FFPI implementation, along with the derived sub-basin-level outputs, are available from the corresponding author upon reasonable request.

Acknowledgments

The authors acknowledge the open-data policies of the Copernicus Programme, the European Space Agency, and ISRIC, which enabled this regional analysis. The authors also thank the State Hydrometeorological Service of North Macedonia. The authors also sincerely thank the three anonymous reviewers for their constructive comments and suggestions, which helped improve the quality and clarity of the manuscript. Generative AI tools were used solely to assist with the graphical layout of the conceptual figure. All textual content, scientific workflow design, data processing, analyses, and interpretations were developed and verified exclusively by the authors. During the preparation of this manuscript, the authors used Grammarly Premium to improve the clarity and style of the English language. The authors have reviewed and edited the output and take full responsibility for the content of the publication.

Conflicts of Interest

The authors declare no conflicts of interest.

References

  1. Marchi, L.; Borga, M.; Preciso, E.; Gaume, E. Characterisation of selected extreme flash floods in Europe and implications for flood risk management. J. Hydrol. 2010, 394, 118–133. [Google Scholar] [CrossRef] [Scilit]
  2. Borga, M.; Boscolo, P.; Zanon, F.; Sangati, M. Hydrometeorological analysis of the 29 August 2003 flash flood in the eastern Italian Alps. J. Hydrometeorol. 2007, 8, 1049–1067. [Google Scholar] [CrossRef] [Scilit]
  3. Termeh, S.V.R.; Kornejady, A.; Pourghasemi, H.R.; Keesstra, S. Flood susceptibility mapping using novel ensembles of adaptive neuro fuzzy inference system and metaheuristic algorithms. Sci. Total Environ. 2018, 615, 438–451. [Google Scholar] [CrossRef] [Scilit] [PubMed]
  4. Barredo, J.I. Major flood disasters in Europe: 1950–2005. Nat. Hazards 2007, 42, 125–148. [Google Scholar] [CrossRef] [Scilit]
  5. Blöschl, G.; Hall, J.; Viglione, A.; Perdigão, R.A.; Parajka, J.; Merz, B.; Lun, D.; Arheimer, B.; Aronica, G.T.; Bilibashi, A.; et al. Changing climate both increases and decreases European river floods. Nature 2019, 573, 108–111. [Google Scholar] [CrossRef] [Scilit] [PubMed]
  6. Didovets, I.; Krysanova, V.; Bürger, G.; Snizhko, S.; Balabukh, V.; Bronstert, A. Climate change impact on regional floods in the Carpathian region. J. Hydrol. Reg. Stud. 2019, 22, 100590. [Google Scholar] [CrossRef] [Scilit]
  7. Moragoda, N.; Cohen, S. Climate-induced trends in global riverine water discharge and suspended sediment dynamics in the 21st century. Glob. Planet. Change 2020, 191, 103199. [Google Scholar] [CrossRef] [Scilit]
  8. Stadtherr, L.; Coumou, D.; Petoukhov, V.; Petri, S.; Rahmstorf, S. Record Balkan floods of 2014 linked to planetary wave resonance. Sci. Adv. 2016, 2, e1501428. [Google Scholar] [CrossRef] [Scilit] [PubMed]
  9. Aleksova, B.; Milevski, I.; Dragićević, S.; Lukić, T. GIS-based integrated multi-hazard vulnerability assessment in Makedonska Kamenica Municipality, North Macedonia. Atmosphere 2024, 15, 774. [Google Scholar] [CrossRef] [Scilit]
  10. Milevski, I.; Aleksova, B.; Valjarević, A.; Gorsevski, P. Cloud-based assessment of flash flood susceptibility, peak runoff, and peak discharge on a national scale with Google Earth Engine (GEE). Atmosphere 2025, 16, 945. [Google Scholar] [CrossRef] [Scilit]
  11. Petrović, A.; Kostadinov, S.; Dragićević, S. The inventory and characterization of torrential flood phenomenon in Serbia. Pol. J. Environ. Stud. 2014, 23, 823–830. [Google Scholar]
  12. Dragićević, S.; Živković, N.; Novković, I.; Petrović, A.; Tošić, R.; Milevski, I. Hydrological and suspended sediment regime in the Kolubara River during the extreme year of 2014. Rev. Geomorfol. 2016, 18, 32–46. [Google Scholar] [CrossRef] [Scilit]
  13. Lovrić, N.; Tošić, R.; Dragićević, S.; Novković, I. Assessment of torrential flood susceptibility: Case study—Ukrina River basin (B&H). Glas. Srp. Geogr. Drus. 2019, 99, 1–16. [Google Scholar] [CrossRef] [Scilit]
  14. Sabljić, L.; Lukić, T.; Bajić, D.; Marković, S.B.; Spalevic, V.; Cvetković, V.M.; Delić, D.; Adžić, D.; Aleksova, B.; Milevski, I.; et al. Spatio-temporal analysis of flood events using GIS and remote sensing-based approach in the Ukrina River basin, Bosnia and Herzegovina. Open Geosci. 2025, 17, 20250856. [Google Scholar] [CrossRef] [Scilit]
  15. Tošić, R.; Lovrić, N.; Dragićević, S.; Manojlović, S. Assessment of torrential flood susceptibility using GIS Matrix Method: Case study—Vrbas River basin (B&H). Carpathian J. Earth Environ. Sci. 2018, 13, 369–382. [Google Scholar] [CrossRef] [Scilit]
  16. Aleksova, B.; Milevski, I.; Dursun, I.; Vujačić, D.; Youssef, Y.M. Multi-model integration and parametric geohazard models for multi-hazard susceptibility assessment in a fan-shaped catchment (Crnička Reka, North Macedonia). Carpathian J. Earth Environ. Sci. 2026, 21, 295–308. [Google Scholar] [CrossRef] [Scilit] [PubMed]
  17. Lazarević, K.; Todosijević, M.; Vulević, T.; Polovina, S.; Momirović, N.; Caković, M. Determination of flash flood hazard areas in the Likodra watershed. Water 2023, 15, 2698. [Google Scholar] [CrossRef] [Scilit]
  18. Krvavica, N.; Šiljeg, A.; Horvat, B.; Panđa, L. Pluvial flash flood hazard and risk mapping in Croatia: Case study in the Gospić catchment. Sustainability 2023, 15, 1197. [Google Scholar] [CrossRef] [Scilit]
  19. Smith, G. Flash Flood Potential: Determining the Hydrologic Response of FFMP Basins to Heavy Rain by Analyzing Their Physiographic Characteristics; NOAA/NWS, Colorado Basin River Forecast Center: Salt Lake City, UT, USA, 2003.
  20. Gorsevski, P.; Milevski, I. Multilevel flood susceptibility mapping by fuzzy sets, analytical hierarchy process, weighted linear combination and random forest. ISPRS Int. J. Geo-Inf. 2026, 15, 148. [Google Scholar] [CrossRef] [Scilit]
  21. Saber, M.; Boulmaiz, T.; Guermoui, M.; Abdrabo, K.I.; Kantoush, S.A.; Sumi, T.; Boutaghane, H.; Nohara, D.; Mabrouk, E. Examining LightGBM and CatBoost models for wadi flash flood susceptibility prediction. Geocarto Int. 2022, 37, 7462–7487. [Google Scholar] [CrossRef] [Scilit]
  22. Costache, R.; Bui, D.T. Identification of areas prone to flash-flood phenomena using multiple-criteria decision-making, bivariate statistics, machine learning and their ensembles. Sci. Total Environ. 2019, 712, 136492. [Google Scholar] [CrossRef] [Scilit] [PubMed]
  23. Ali, S.A.; Parvin, F.; Vojteková, J.; Costache, R.; Linh, N.T.T.; Pham, Q.B.; Vojtek, M.; Gigović, L.; Ahmad, A.; Ghorbani, M.A. GIS-based comparative assessment of flood susceptibility mapping using hybrid multi-criteria decision-making approach, naïve Bayes tree, bivariate statistics and logistic regression: A case of Topľa basin, Slovakia. Ecol. Indic. 2021, 117, 106620. [Google Scholar] [CrossRef] [Scilit]
  24. Youssef, A.M.; Pradhan, B.; Dikshit, A.; Mahdi, A.M. Comparative study of convolutional neural network (CNN) and support vector machine (SVM) for flood susceptibility mapping: A case study at Ras Gharib, Red Sea, Egypt. Geocarto Int. 2022, 37, 12362–12385. [Google Scholar] [CrossRef] [Scilit]
  25. Brewster, J. Development of the Flash Flood Potential Index; NOAA, NWS Eastern Region Headquarters: Bohemia, NY, USA, 2009.
  26. Milevski, I.; Dragićević, S.; Radevski, I. GIS and Remote Sensing based natural hazard modelling of Kriva River catchment, Republic of Macedonia. Z. Geomorphol. 2017, 61, 213–228. [Google Scholar] [CrossRef] [Scilit]
  27. Ceru, J. Flash Flood Potential Index (FFPI) for Pennsylvania. In Proceedings of the ESRI Federal GIS Conference, Washington, DC, USA, 22–24 February 2012. [Google Scholar]
  28. Zogg, J.; Deitsch, K. The Flash Flood Potential Index at WFO Des Moines, Iowa; NOAA, NWS: Des Moines, IA, USA, 2013.
  29. Milevski, I.; Ivanova, E. GIS- and RS-Based Modelling of Potential Natural Hazard Areas in Mountains. Case Study: Vlahina Mountain. In Sustainable Mountain Regions: Challenges and Perspectives in Southeastern Europe; Koulov, B., Zhelezov, G., Eds.; Springer: Cham, Switzerland, 2016; pp. 273–290. [Google Scholar] [CrossRef] [Scilit]
  30. Prăvălie, R.; Costache, R. The analysis of the susceptibility of the flash-floods’ genesis in the area of the hydrographical basin of Bâsca Chiojdului River. Forum Geogr. 2014, 13, 39–49. [Google Scholar] [CrossRef] [Scilit]
  31. Zaharia, L.; Costache, R.; Prăvălie, R.; Niţu, R.; Patriche, C.V.; Dobre, R. Mapping flood and flooding potential indices: A methodological approach to identifying areas susceptible to flood and flooding risk. Case study: The Prahova catchment (Romania). Front. Earth Sci. 2017, 11, 229–247. [Google Scholar] [CrossRef] [Scilit]
  32. Shawaqfah, M.; Almomani, F.; Khatatbeh, A.A. Mapping flash flood potential and risk level using GIS techniques and the FFPI in the Amman–Zarqa basin of Jordan. Jordanian J. Eng. Chem. Ind. 2020, 3, 81–90. [Google Scholar] [CrossRef] [Scilit]
  33. Popescu, N.-C.; Bărbulescu, A. Flood hazard evaluation using a flood potential index. Water 2023, 15, 3533. [Google Scholar] [CrossRef] [Scilit]
  34. Gorelick, N.; Hancher, M.; Dixon, M.; Ilyushchenko, S.; Thau, D.; Moore, R. Google Earth Engine: Planetary-scale geospatial analysis for everyone. Remote Sens. Environ. 2017, 202, 18–27. [Google Scholar] [CrossRef] [Scilit]
  35. Tamiminia, H.; Salehi, B.; Mahdianpari, M.; Quackenbush, L.; Adeli, S.; Brisco, B. Google Earth Engine for geo-big data applications: A meta-analysis and systematic review. ISPRS J. Photogramm. Remote Sens. 2020, 164, 152–170. [Google Scholar] [CrossRef] [Scilit]
  36. Halder, S.; Bose, S. Sustainable flood hazard mapping with GLOF: A Google Earth Engine approach. Nat. Hazards Res. 2024, 4, 573–578. [Google Scholar] [CrossRef] [Scilit]
  37. Sellami, E.M.; Rhinane, H. Google Earth Engine and machine learning for flash flood exposure mapping—Case study: Tetouan, Morocco. Geosciences 2024, 14, 152. [Google Scholar] [CrossRef] [Scilit]
  38. Kostadinov, S.; Dragićević, S.; Stefanović, T.; Novković, I.; Petrović, A.M. Torrential flood prevention in the Kolubara River basin. J. Mt. Sci. 2017, 14, 2230–2245. [Google Scholar] [CrossRef] [Scilit]
  39. Vuković, A.; Mandić, M.V. Study on Climate Change in the Western Balkans Region; Regional Cooperation Council Secretariat: Sarajevo, Bosnia and Herzegovina, 2018. [Google Scholar]
  40. Reed, J.M.; Kryštufek, B.; Eastwood, W.J. The physical geography of the Balkans and nomenclature of place names. In Balkan Biodiversity; Griffiths, H.I., Kryštufek, B., Reed, J.M., Eds.; Springer: Dordrecht, The Netherlands, 2004; pp. 9–22. [Google Scholar] [CrossRef] [Scilit]
  41. Micić Ponjiger, T.; Lukić, T.; Wilby, R.L.; Marković, S.B.; Valjarević, A.; Dragićević, S.; Gavrilov, M.B.; Ponjiger, I.; Durlević, U.; Milanović, M.M.; et al. Evaluation of rainfall erosivity in the Western Balkans by mapping and clustering ERA5 reanalysis data. Atmosphere 2023, 14, 104. [Google Scholar] [CrossRef] [Scilit]
  42. Aleksova, B.; Milevski, I.; Lukić, T.; Marković, S.; Perić, Z. Preliminary assessment of hydrological heritage in North Macedonia: A novel contribution to geodiversity protection. Geoheritage 2025, 17, 47. [Google Scholar] [CrossRef] [Scilit]
  43. Mihevc, A.; Prelovšek, M.; Zupan Hajna, N. Introduction to the Dinaric Karst; Karst Research Institute: Postojna, Slovenia, 2010. [Google Scholar]
  44. European Space Agency. ESA WorldCover 10 m 2021 v200; ESA WorldCover Consortium: Frascati, Italy, 2021. [Google Scholar]
  45. European Space Agency; Airbus. Copernicus DEM—Global and European Digital Elevation Model (COP-DEM): Product Handbook, Version 5.0; ESA: Paris, France, 2022. [Google Scholar]
  46. Hengl, T.; Mendes de Jesus, J.; Heuvelink, G.B.; Ruiperez Gonzalez, M.; Kilibarda, M.; Blagotić, A.; Shangguan, W.; Wright, M.N.; Geng, X.; Bauer-Marschallinger, B.; et al. SoilGrids250m: Global gridded soil information based on machine learning. PLoS ONE 2017, 12, e0169748. [Google Scholar] [CrossRef] [Scilit] [PubMed]
  47. Poggio, L.; de Sousa, L.M.; Batjes, N.H.; Heuvelink, G.B.M.; Kempen, B.; Ribeiro, E.; Rossiter, D. SoilGrids 2.0: Producing soil information for the globe with quantified spatial uncertainty. Soil 2021, 7, 217–240. [Google Scholar] [CrossRef] [Scilit]
  48. Vaudour, E.; Gomez, C.; Loiseau, T.; Baghdadi, N.; Loubet, B.; Arrouays, D.; Ali, L.; Lagacherie, P. The impact of acquisition date on the prediction performance of topsoil organic carbon from Sentinel-2 for croplands. Remote Sens. 2019, 11, 2143. [Google Scholar] [CrossRef] [Scilit]
  49. Mzid, N.; Pignatti, S.; Huang, W.; Casa, R. An analysis of bare soil occurrence in arable croplands for remote sensing topsoil applications. Remote Sens. 2021, 13, 474. [Google Scholar] [CrossRef] [Scilit]
  50. Zhao, J.; Du, D.; Chen, L.; Liang, X.; Chen, H.; Jin, Y. HA-Net for bare soil extraction using optical remote sensing images. Remote Sens. 2024, 16, 3088. [Google Scholar] [CrossRef] [Scilit]
  51. European Environment Agency; European Union Copernicus Land Monitoring Service. EU-Hydro—River Network Database, Version 1.3 [Dataset]; Copernicus Land Monitoring Service: Copenhagen, Denmark, 2020. [Google Scholar]
  52. Panagos, P.; Borrelli, P.; Meusburger, K.; van der Zanden, E.H.; Poesen, J.; Alewell, C. Modelling the effect of support practices (P-factor) on the reduction of soil erosion by water at European scale. Environ. Sci. Policy 2015, 51, 23–34. [Google Scholar] [CrossRef] [Scilit]
  53. Wischmeier, W.H.; Smith, D.D. Predicting Rainfall Erosion Losses, A Guide to Conservation Planning; USDA Agricultural Handbook No. 537; USDA: Washington, DC, USA, 1978.
  54. Renard, K.G.; Foster, G.R.; Weesies, G.A.; McCool, D.K.; Yoder, D.C. Predicting Soil Erosion by Water: A Guide to Conservation Planning with the Revised Universal Soil Loss Equation (RUSLE); Agriculture Handbook No. 703; USDA: Washington, DC, USA, 1997.
  55. Rahmati, O.; Pourghasemi, H.R.; Zeinivand, H. Flood susceptibility mapping using frequency ratio and weights-of-evidence models in the Golastan Province, Iran. Geocarto Int. 2016, 31, 42–70. [Google Scholar] [CrossRef] [Scilit]
  56. Costache, R.; Zaharia, L. Flash-flood potential assessment and mapping by integrating the weights-of-evidence and frequency ratio statistical methods in GIS environment—Case study: Bâsca Chiojdului River catchment (Romania). J. Earth Syst. Sci. 2017, 126, 59. [Google Scholar] [CrossRef] [Scilit]
  57. Dinku, T.; Funk, C.; Peterson, P.; Maidment, R.; Tadesse, T.; Gadain, H.; Ceccato, P. Validation of the CHIRPS satellite rainfall estimates over eastern Africa. Q. J. R. Meteorol. Soc. 2018, 144, 292–312. [Google Scholar] [CrossRef] [Scilit]
  58. Stoleriu, C.C.; Urzică, A.; Mihu-Pintilie, A.; Lesenciuc, D.C.; Ursu, A. A national overview of historical floods in Romania over the past 800 years. J. Hydrol. Reg. Stud. 2026, 66, 103672. [Google Scholar] [CrossRef] [Scilit]
  59. Tîncu, R.; Zêzere, J.L.; Lazar, G. Identification of potential flash flood hotspots using the flash flood potential index (FFPI) in the Trotuș River basin, Romania. Sensors 2022, 22, 3573. [Google Scholar] [CrossRef] [Scilit] [PubMed]
  60. International Commission for the Protection of the Danube River (ICPDR). Slovenia’s Flood Forecasting Success: Minimizing Casualties Through Effective Warning Systems. Available online: https://www.icpdr.org (accessed on 10 July 2026).
  61. Papaioannou, G.; Vasiliades, L.; Loukas, A. Multi-criteria analysis framework for potential flood prone areas mapping. Water Resour. Manag. 2015, 29, 399–418. [Google Scholar] [CrossRef] [Scilit]
  62. Popa, M.C.; Peptenatu, D.; Drăghici, C.C.; Diaconu, D.C. Flood hazard mapping using the Flood and Flash-Flood Potential Index in the Buzău River Catchment, Romania. Water 2019, 11, 2116. [Google Scholar] [CrossRef] [Scilit]
  63. Aleksova, B.; Milevski, I.; Stefanidis, S. Flash flood potential index at national scale: Susceptibility assessment within catchments. Open Geosci. 2025, 17, 20250891. [Google Scholar] [CrossRef] [Scilit]
  64. Bonacci, O.; Ljubenkov, I.; Roje-Bonacci, T. Karst flash floods: An example from the Dinaric karst (Croatia). Nat. Hazards Earth Syst. Sci. 2006, 6, 195–203. [Google Scholar] [CrossRef] [Scilit]
  65. Hartmann, A.; Goldscheider, N.; Wagener, T.; Lange, J.; Weiler, M. Karst water resources in a changing world: Review of hydrological modeling approaches. Rev. Geophys. 2014, 52, 218–242. [Google Scholar] [CrossRef] [Scilit]
  66. Ravbar, N.; Petrič, M.; Blatnik, M.; Švara, A. A multi-methodological approach to create improved indicators of extreme karst-water level for flood-warning systems. Sci. Rep. 2021, 11, 23632. [Google Scholar] [CrossRef] [Scilit] [PubMed]
  67. Keesstra, S.; Nunes, J.; Novara, A.; Finger, D.; Avelar, D.; Kalantari, Z.; Cerdà, A. The superior effect of nature-based solutions in land management for enhancing ecosystem services. Sci. Total Environ. 2018, 610–611, 997–1009. [Google Scholar] [CrossRef] [Scilit] [PubMed]
  68. Cerdà, A.; Rodrigo-Comino, J.; Giménez-Morera, A.; Novara, A.; Pulido, M.; Kapović-Solomun, M.; Keesstra, S.D. Policies can help to apply successful strategies to control soil and water losses. The case of chipped pruned branches (CPB) in Mediterranean citrus plantations. Land Use Policy 2021, 103, 104896. [Google Scholar] [CrossRef] [Scilit]
  69. Kumar, P.; Debele, S.E.; Sahani, J.; Rawat, N.; Marti-Cardona, B.; Alfieri, S.M.; Basu, B.; Basu, A.S.; Bowyer, P.; Charizopoulos, N.; et al. Nature-based solutions efficiency evaluation against natural hazards: Modelling methods, advantages and limitations. Sci. Total Environ. 2021, 784, 147058. [Google Scholar] [CrossRef] [Scilit] [PubMed]
Figure 1. Location on the Balkan Peninsula (a) and major river basins of the Western Balkans (b).
Earth 07 00141 g001
Figure 2. Methodological workflow of the GEE-based modified-FFPI assessment for the WB.
Earth 07 00141 g002
Figure 3. Spatial distribution of the five normalized FFPI conditioning factors and the resulting pixel-based index: (a) slope factor M; (b) land-cover factor L; (c) soil-texture factor S; (d) vegetation-exposure/BSI factor V; (e) soil-erodibility/K-factor E; and (f) final modified FFPI.
Earth 07 00141 g003
Figure 4. Sub-basins of the Western Balkans ranked by mean FFPI (9524 EU-Hydro sub-basins).
Earth 07 00141 g004
Figure 5. Catchment-level maximum daily precipitation (a) and rainfall-triggered FFPI hotspot classes (b) across the Western Balkans.
Earth 07 00141 g005
Figure 6. Validation of the FFPI in the Vrbas and Ukrina basins according to Tošić et al. [15] and Lovrić et al. [13] (a), and in the Pčinja (b) and Bregalnica (c) basins based on the flood inventory as well as their ROC with AUC in (d,e).
Earth 07 00141 g006
Table 1. FFPI factor weights adopted in this study with their conceptual rationale.
FactorWeightRationale
Slope (M)2.0Direct control on runoff velocity, concentration time, flow accumulation, and torrential response of small mountain catchments.
Land cover (L)1.0Controls interception, infiltration, and surface roughness; distinguishes forested from cultivated, urbanized, and bare surfaces.
Soil texture (S)1.0Controls infiltration capacity and runoff generation; higher clay content favours saturation-excess runoff.
Vegetation/BSI (V)1.0Bare-soil exposure indicator; captures reduced protective cover and increased rainsplash erosion and overland-flow response.
Erodibility (E; K-factor)1.0Proxy for surface sealing/crust formation and sediment-rich runoff enhancing flash-flood impacts.
Table 2. Number and area share of EU-Hydro basin units by FFPI susceptibility class and rainfall-triggered FFPI hotspot class in the WB.
FFPIRainfall-Triggered FFPI Hotspot
ClassNo. of CatchmentsCatchments (%)Area (%)No. of CatchmentsCatchments (%)Area (%)
Very low8218.65.61841.91.2
Low220323.123.7163417.215.5
Moderate229324.128.3356837.539.3
High271428.529.4211122.223.8
Very high149315.713.1202721.320.1
Total9524100.0100.09524100.0100.0
In contrast, low and very-low susceptibility is concentrated mainly in the broad low-gradient landscapes of the northern Pannonian sector, particularly within the Tisa–Danube lowlands of northern Serbia, as well as in wider valley floors and intermontane basins characterized by gentler slopes, more continuous vegetation cover, and lower terrain dissection. Smaller low-susceptibility clusters also occur along broad sections of the Sava and major intramontane valley systems (Morava, Una, Bosna, Neretva, Drin, Vardar). These areas generally lack the combination of steep relief and short concentration times that characterizes the high-susceptibility mountain headwaters.
Table 3. Summary of independent validation metrics for the GEE-based FFPI across the four reference datasets used in this study.
Validation AreaReference DataMetricResult
Vrbas–UkrinaTorrential-catchment inventory [13,15]Spatial overlap68.6% of the reference area within high/very-high FFPI
KolubaraFlash-flood susceptibility map [38]Area–class agreement14.2% (FFPI) vs. 17.8% (reference); difference 3.6%
Pčinja + Bregalnica (n = 336 sub-basins)Orthophoto-based geomorphological signatures cross-checked with media reportsEvent concordance88.6% (Pčinja) and 92.0% (Bregalnica) within moderate–very-high FFPI
Pčinja + Bregalnica (pooled, n = 336; 178 positive/158 negative)Same, binary flood-evidence labelAUC-ROC/F1/Kappa/Accuracy0.79/0.77/0.49/0.75 (Youden-optimal threshold FFPI ≥ 5.31; TP = 145, FP = 52, FN = 33, TN = 106)
Disclaimer/Publisher’s Note: The statements, opinions and data contained in all publications are solely those of the individual author(s) and contributor(s) and not of MDPI and/or the editor(s). MDPI and/or the editor(s) disclaim responsibility for any injury to people or property resulting from any ideas, methods, instructions or products referred to in the content.