1. Introduction and Theoretical Background
Sustainable development increasingly relies on continuous, spatially explicit, and comparable environmental information. In this context, Earth Observation (EO) functions not only as a technical data source, but as a key infrastructure shaping the development of contemporary environmental research across disciplines and regions [
1]. Satellite-based EO is essential for monitoring climate change and land-use dynamics. It also plays a key role in assessing ecosystem degradation, water resources and urban expansion relevant to sustainability. Without long-term and globally consistent EO data, many sustainability indicators—particularly those linked to climate action, sustainable cities, and terrestrial ecosystems—cannot be reliably assessed [
2,
3].
Satellite EO itself has become a basic component of geographic and environmental research. Long-term missions, such as Landsat, MODIS and the Sentinel constellation, provide continuous and standardised records that support monitoring of ecological processes, land-use change, water systems and urban growth [
4,
5,
6]. Additionally, bibliometric mapping of literature on Geographic Information Systems (GIS) has identified the integration of GIS with remote sensing as a significant theme, reflecting its support for interdisciplinary environmental analysis and spatial modelling [
7]. The quality of EO-based classification models depends more on the availability of good ground-truth data, which increases the reliability of remote-sensing products and supports machine-learning applications in vegetation and land-cover monitoring [
8]. Progress in machine-learning algorithms, including Random Forests, support vector machines and deep neural networks, has enabled more advanced modelling of environmental hazards, such as wildfire risk and vegetation dynamics [
9].
Advances in satellite technology have significantly expanded the range of applications and analytical possibilities in EO research. Hyperspectral and radar missions, such as EnMAP, together with spaceborne radar systems, provide detailed spectral and structural information that is very useful for ecological, geological and land-surface studies [
10]. At the same time, the growing availability of free EO archives has improved global access, especially in regions with limited computational and institutional capacity, where international collaborations are often essential for taking part in EO science [
11]. Alongside these advances, EO research also faces a range of methodological challenges related to increasing data complexity, sensor diversity and data integration techniques. For example, some studies show that pan-sharpening, as a data fusion method combining multispectral and high-resolution panchromatic information, can change spectral properties and influence indices, such as NDVI [
12]. In addition, very high spatial resolution data introduce practical constraints related to data volume, storage requirements and computational demands. Even with these limits, modern high-resolution sensors are key to monitoring global problems, such as climate change, biodiversity loss, agricultural sustainability and deforestation [
5,
13]. They also support advanced modelling frameworks, including maximum-entropy approaches for species distribution or fire-risk assessment [
4,
14].
The historical development of EO research shows a clear technological and methodological evolution. Bibliometric studies point to two main phases. The first phase, roughly from 1978 to 2011, was dominated by sensor-oriented work, calibration studies, reflectance modelling and the use of early missions, such as Landsat and later MODIS. In this period, improvements in data availability, such as the consolidation of the Landsat archive and the launch of Landsat 8, increased the radiometric quality and practical usability of EO data. Research also started to demonstrate the value of combining different sensors. For example, the fusion of Landsat and Sentinel-2 data has been shown to be very effective for vegetation monitoring, crop yield estimation and water-quality assessment [
15,
16,
17,
18].
The second phase, starting after 2011, is a period of rapid expansion linked to open-data policies and the launch of the Sentinel constellation [
19]. The open release of Landsat data and the operational Sentinel-1, Sentinel-2 and Sentinel-3 missions significantly increased global access to high-quality EO imagery. In parallel, Google Earth Engine (GEE) changed remote-sensing practice by providing cloud-based access to petabyte-scale archives of Landsat, MODIS and Sentinel data. GEE made it possible to run large-scale, long time-series and near-real-time analyses that were previously difficult or impossible due to limited computing power [
4,
20,
21,
22,
23,
24,
25]. New work in GeoAI and machine learning further supports complex studies of land cover, ecological processes and environmental change [
26,
27,
28]. Comparative studies also show that Landsat-8 and Sentinel-2 have complementary strengths for many mapping tasks [
29,
30,
31].
Even with this technological progress, strong geographical differences in EO scientific production remain. Existing literature highlights persistent geographical inequalities in EO scientific production, with research output predominantly concentrated in the United States, China and Western Europe, and comparatively limited representation of many regions in the Global South [
32,
33,
34,
35]. These patterns have been associated with structural differences in funding, infrastructure, computational capacity and training opportunities [
36,
37]. Because of this, many countries rely on multi-country collaborations to be part of EO research. Such collaborations provide access to data and expertise but may limit the development of independent local research agendas [
11,
32]. Understanding these spatial inequalities is important for interpreting global EO publication trends and for assessing how new technologies interact with uneven research capacity.
The thematic evolution of EO research also reflects these technological and geographical changes. Early studies mainly focused on sensors, radiometric calibration and basic image processing [
38,
39,
40,
41]. In contrast, recent work pays more attention to machine-learning classification, long-term time series, urbanisation monitoring, fire dynamics and integrated environmental modelling [
42,
43,
44,
45]. These changes reflect both technological advances and new scientific and societal priorities. The increasing role of EO data is not only confined to single thematic applications, but also increasingly provides the basis for integrated, data-driven research frameworks in spatial analysis, planning, and environmental management. Recent studies demonstrate how parameters derived from EO data (such as a vegetation index from freely available satellite missions) are increasingly being used as operational indicators to support planning and decision-making at local and municipal levels, especially where systematic field inventories are expensive or incomplete [
46]. Understanding the global distribution of EO research capacities, infrastructure, and networks of collaboration forms an important basis for a wide range of further studies, including advanced spatial analyses, modelling and decision support approaches. The challenges include, among others, approaches that range from long-term environmental monitoring and urban studies to integrative concepts like digital twins, which depend on a well-established, continuous flow of EO data, as well as computational capacity [
47].
Bibliometrics has become an important approach for quantitatively analysing scientific production. It helps researchers to see how knowledge systems change over time and to identify main themes, key works and inequalities inside research fields. Using publication and citation counts, collaboration networks and keyword co-occurrence, bibliometric methods give insight into disciplinary development, global research geographies and differences in scholarly capacity between regions [
45,
48,
49,
50]. These tools are especially useful in fields where technology and data availability have a direct impact on scientific output. EO is one such field, because new satellite missions, open-data policies, machine learning and cloud platforms strongly shape publication trends, access to research, and the global distribution of scientific contributions [
51,
52].
Because EO applications are expanding so fast and research capacity remains very uneven, a comprehensive bibliometric analysis is needed to understand long-term publication trends, global inequalities in EO research and the changing role of main satellite missions. Given this objective, the analysis deliberately focuses on widely adopted and long-term operational satellite missions that structure the core of EO scientific production, rather than attempting exhaustive coverage of all existing sensors. Such an analysis offers a common framework to study how technological innovation and geographical disparities together shape the global landscape of EO scientific production. For this reason, the present study carries out a spatially explicit bibliometric analysis of EO research from 1978 to 2024, with the aim of identifying global patterns in scientific production, collaboration and thematic development in this field. The analysis is guided by four research questions that focus on the changing influence of satellite missions, the spatial distribution of research output, the structure of international collaboration networks and the main thematic and methodological shifts in EO science. Analysing EO science therefore provides insight into the broader structure and evolution of global environmental research systems.
To address these objectives, the study is guided by the following research questions:
RQ1: How has the development of major EO missions (e.g., Landsat, MODIS, Sentinel, EnMAP) influenced publication dynamics in EO research from 1978 to 2024?
RQ2: How is EO research productivity spatially distributed across countries, regions and institutions, and how have these global patterns changed over time?
RQ3: What spatial and structural patterns of international collaboration in EO publications exist, and how have cross-national collaboration networks evolved across the study period?
RQ4: What are the major thematic and methodological shifts in EO research (particularly the transition from sensor- and processing-oriented studies to open-data platforms, time-series analyses and machine-learning methods), and how are these shifts related to broader geographical differences in research capacity and infrastructure?
2. Materials and Methods
2.1. Data Collection and Processing
Bibliographic data were collected from the Web of Science Core Collection on 20 October 2025, covering the period from 1978 to the date of search and limited to publications written in English, in line with common practice in large-scale bibliometric studies.
The search strategy was designed to broadly capture research related to satellite-based Earth observation activities by combining environmental and spatial descriptors (e.g., “environment”, “spatial”, “geo”, “research”) with the names of major satellite missions and analytical platforms (e.g., Sentinel, MODIS, Landsat, ASTER, Google Earth Engine and EnMAP). The resulting operational search query applied in the Web of Science Core Collection was:
(“Environment*” OR “spatial*” OR “geo*” OR “research*”) AND (“Sentinel” OR “MODIS” OR “Landsat” OR “ASTER” OR “Google Earth Engine” OR “EnMAP”)
This query was designed to be broad at the keyword level to capture a comprehensive corpus of satellite-related research, while thematic specificity and analytical coherence were ensured through subsequent filtering by Web of Science subject categories.
The aim of the study was not to compile an exhaustive inventory of all existing Earth observation sensors, but to analyse robust and comparable bibliometric trends within a coherent subset of the EO research domain. Although the analysis is not formally restricted to open Earth observation data, the selected missions and platforms represent widely used and broadly accessible data sources, thereby ensuring a high level of availability, reproducibility, and comparability of the analysed bibliometric corpus. The applied AND operator therefore represents a deliberate operational definition of the EO research domain, rather than an attempt to exhaustively retrieve all publications related to individual satellite sensors. The resulting dataset enabled the bibliometric analysis to reliably identify long-term trends in EO research over the period from 1978 to 2024.
Using this search strategy, we identified 79,752 publications in the Web of Science Core Collection, distributed across 90 WoS subject categories. To ensure thematic coherence, we focused on four categories most relevant to satellite-based analysis, spatial analytics, and geographic EO applications: Remote Sensing, Environmental Sciences, Physical Geography, and Geography. To ensure comprehensive coverage of Earth Observation research within the geographic domain, both “Geography” and “Geography Physical” subject categories from the Web of Science Core Collection were included in the thematic filtering. Although physical geography is conceptually a component of the broader discipline of geography, the Web of Science assigns these as distinct indexed categories. “Geography” captures general geographic scholarship, including spatial analysis and human–environment interactions, while “Geography Physical” emphasises physical and environmental geographic processes relevant to Earth Observation applications. Including both categories therefore provides a more complete representation of geographic research contributions to EO science, consistent with the interdisciplinary focus of this study (e.g., spatial patterns, environmental monitoring and geographic analysis). These categories represent the core of the interdisciplinary EO scientific domain. Publications in other categories often refer to satellite mission data only marginally, for example, medical studies using MODIS temperature data—which would introduce methodological noise and reduce analytical coherence. Filtering by these categories reduced the dataset to 31,687 publications, which constitute a focused and bibliometrically suitable sample.
To capture long-term dynamics, the dataset was divided into two developmental phases of the EO domain, defined by key technological milestones and shifts in satellite data access policies in the history of EO.
Publications from 2025 were not included because, at the time of data extraction (20 October 2025), the year was still in progress, which would yield incomplete and non-representative statistics. Publications assigned to the year 2026 were also excluded, as these records correspond to Early Access items indexed in the WoS prior to formal publication and year assignment, and therefore do not represent completed bibliographic records.
After removing publications from 2025 and 2026, 29,072 publications remained, and only scientific works—research articles, review papers, and conference proceedings—were considered. The final dataset used for analysis thus comprises 28,871 publications. In the Web of Science Core Collection, the document type “Correction” is indexed as a separate bibliographic record and does not represent a duplicate of the original article. Records classified as “Correction” have their own entries and unique identifiers; hence, no documents are counted twice in the final dataset. At this stage the dataset contained various publication types, including articles, reviews, book chapters, retracted publications, letters, proceedings papers, etc. (
Table 1). For further analysis, publication types of Article, Article; Data Paper, Article; Early Access, Article; Proceedings Paper, Correction, Proceedings Paper, Review and Review; Early Access were considered in making the final dataset with 28,871 publications in total (
Table S1).
From the historical trajectory of satellite EO shown in
Figure 1, it can be observed that open data policy, improved radiometric calibration, and the increasing availability of analysis-ready datasets had a significant impact on the development of EO-based environmental research and its application across environmental and spatial domains. In line with these developments, the dataset was divided into two major periods, one representing the early stage and first leap period of the satellite EO development, and another representing the new era of open data and vast remote sensing data application and research.
The Landsat program has continuously acquired multispectral observations of Earth’s land surface since its first launch in 1972, forming the longest uninterrupted global EO data archive for environmental and spatial research. During the 1980s, the launches of Landsat 4 (1982) and Landsat 5 (1984) with improved sensors, such as the Thematic Mapper, significantly enhanced data quality and enabled the transition from analyses based on individual images to systematic long-term temporal studies. Together with institutional developments promoting wider use of EO data, including the
Land Remote-Sensing Commercialization Act (1984) [
53], these advances established Landsat data as a methodological reference for environmental research. When Landsat adopted an open data policy in 2008 [
54], this decision initiated a paradigm shift in satellite data usage, although the full effect—manifested through marked growth in user activity and publication output—became visible only several years later. The next critical milestone occurred with the launch of Sentinel-1 in 2014, the first operational satellite of the Copernicus programme, which provided global, systematic, fully open-access data. Together, these developments signalled the beginning of a new era of large-scale, data-intensive remote sensing research. Considering these milestones and the publication patterns visible in the bibliographic dataset, the year 2012 was selected as the onset of the second period. This choice is supported by the first substantial and sustained increase in publication volume observed in
Figure 1. Accordingly, the first period was defined as 1978–2011, representing the foundational phase of satellite EO development, while the second period, 2012–2024, reflects the accelerated era shaped by open-data policies, expanded satellite constellations, and cloud-based analytical platforms.
2.2. Data Analysis
Data processing, analysis and the majority of data visualisations were conducted using the R programming language [
55], R version 4.3.3 (29 February 2024). These analyses focus on the evolution of EO research in relation to environmental monitoring, spatial analysis, and global environmental change. Bibliographic analysis was conducted using the Biblioshiny application (version 5.11.) from the bibliomertix package [
56]. All results exported from the Biblioshiny application, except cluster and network results, were processed and visualised using the ggplot2 package [
57] in R. Additionally, for heatmap visualisations, the seaborn package [
58] and matplotlib [
59] from Python 3 [
60] were used.
To identify rankings of authors, sources, affiliations, countries, and keywords, the dataset was divided into two periods: 1978–2011 and 2012–2024.
A fractionalised article number was used for the author-level analysis. It is defined as the reciprocal of the number of authors on a publication—for example, if a paper lists four authors, each receives a fractional contribution of 0.25. In this study, fractionalised authorship was applied to avoid inflating productivity metrics for publications with large author teams. Full counting assigns each co-author a weight of one for every shared publication, which disproportionately increases the apparent productivity of researchers who frequently publish within large consortia, regardless of their individual contribution. Fractional counting reduces this bias by apportioning authorship credit among all co-authors and represents a more even and comparable indicator of scientific output. This approach provides the opportunity for more valid comparisons between authors working in small, stable research groups and those involved in large, multi-institutional collaborations, which have grown increasingly common in EO research since 2012 onward. Fractionalised authorship therefore offers a more equitable metric of individual contribution in a field characterised by growing collaboration intensity.
In this analysis, the top 10 authors by total publication count were visualised together with their fractionalised publication numbers to compare absolute productivity with productivity adjusted for co-authorship. Because fractionalised article counts are difficult to interpret in isolation, they were expressed as the ratio of the total number of articles to the fractionalised count. A smaller ratio indicates publications with fewer co-authors (with a value of one meaning that the author appears as the sole author on all publications), whereas a larger ratio reflects publications with many co-authors. These metrics were combined in a heatmap where both the ratio categories and the publication-count categories were jointly represented. For the country-level analysis, a heatmap was created to identify countries with a higher share of multi-country publications. In this heatmap, both the total number of publications and the percentage of multi-country papers were grouped into classes and shown together. This makes it easier to compare the intensity of international collaboration between different countries and regions.
Following the recommendations of Aria and Cuccurullo (2017) [
56], the affiliation data were checked and manually corrected, because the same institution often appeared in Web of Science with several different name forms. For the keyword analysis, two synonym tables were created and imported into Biblioshiny. In the first table, words were grouped when they were different only in form, for example singular and plural, use of hyphen (land-cover/land cover), special characters or capital letters. In the second table, terms were grouped when they referred to the same idea or topic, such as different expressions for land cover (e.g., land-cover mapping, LULC, land use/land cover) or for MODIS-related terms.
This two-level keyword standardisation helped to reduce the typical term variation found in bibliographic databases and made the keyword-based analyses more reliable. After the synonym tables were imported into Biblioshiny, all related terms were replaced by one standard form. This reduced the number of separate keywords that described the same concept, improved the formation of clusters in the co-occurrence networks, and allowed more consistent trend analysis across the two main phases (1978–2011 and 2012–2024). Such a procedure follows the bibliometric workflow proposed by Aria and Cuccurullo (2017) [
56] and supports a clearer interpretation of the thematic development of EO research.
Although the main publication trends were analysed for two broad periods (1978–2011 and 2012–2024), the more recent phase (2012–2024) was further divided into three shorter intervals: 2012–2018 (8806 publications), 2019–2021 (4651 publications) and 2022–2024 (9305 publications). This finer subdivision was needed because, after 2012, the field showed a strong increase in publication output, a fast expansion of research topics, and clear changes in international collaboration patterns and the use of cloud-based platforms, especially Google Earth Engine.
When the entire 2012–2024 period is analysed as a single time span, many of the finer changes in themes and collaboration patterns are not clearly visible. Therefore, separate analyses were performed for each subperiod to capture the dynamics of this accelerated phase more accurately.
Dividing the period into three shorter intervals enabled:
more precise tracking of the emergence and disappearance of thematic clusters,
detection of the transition toward machine learning, time-series approaches, and Sentinel-related topics,
identification of the acceleration of international collaboration after 2018,
reduction in statistical distortions caused by the sharp increase in publication numbers after 2020.
Therefore, the analysis was conducted across four temporal segments: the first two reflect the historical phases of EO research development, while the three more recent intervals allow for a finer interpretation of contemporary thematic and collaboration dynamics.
From 2019 to 2024, the number of publications per year was highest. Therefore, three-year subperiods were adopted to capture changes in the most recent phase of high scientific production. For the longer periods (1978–2011 and 2012–2018), 20 publications were used for the historiographic map analysis, whereas for the three-year subperiods 2019–2021 and 2022–2024, the number of publications included in the analysis was increased to 40.
3. Results and Discussion
3.1. Main Data Description and Trends
The Section presents the main publication trends and structural characteristics of EO research as they relate to the development of environmental and geographic sciences. The analysis focuses on the spatial patterns of scientific production, international collaboration, and geographical inequalities in access to EO infrastructure, which influence the capacity of different regions to contribute to and benefit from EO-based environmental research. From the total of 28,871 publications in the dataset, only 13.8% (3501) of publications were published in the 1978–2011 period, leaving the remaining 25,370 publications in the 2012–2024 period. Although the total publication number is higher in the 2012–2024 period, the annual growth rate is smaller. As mentioned earlier, 2012 marks the first major publication leap and is the first year in the dataset to include proceedings papers (
Figure 1). The division into 1978–2011 and 2012–2024 was made due to three key geopolitical and technical transitions: (1) the Landsat open-data policy (2008 → with effects visible around 2011–2012), (2) the launch of the Sentinel constellation (2014), and (3) the rapid growth of cloud-based EO analytics (2015+). These transitions are associated with broader shifts in the observation and analysis of environmental processes, as reflected in publication growth and changing research themes. The Web of Science database introduced the proceedings paper document type in 2008; earlier, these publications were categorised as articles. Articles were the most abundant document type throughout the entire research period, followed by proceedings papers in the 2012–2024 period, whereas other document types accounted for only 8.3% and 2.3% in the 1978–2011 and 2012–2024 periods, respectively (
Table 1). The number of sources, references, keywords, authors, single-authored publications, and co-authors per document all increased during the 2012–2024 period. Although the absolute number of single-authored publications increased in the later period, their relative share declined, from 3% in the 1978–2011 period to 1.1% in the 2012–2024 period, reflecting a shift toward more collaborative research structures in EO-driven environmental and geographic studies. As the total number of publications increased, the average number of citations per document decreased.
Figure 2A shows that the mean total number of citations per article is higher in the 1978–2011 period than in the 2012–2024 period. This result is expected, as older publications have had more time to accumulate citations. To account for this difference, the mean total citations per year (mean total citation per article divided by years since published) were calculated (
Figure 2B) and the results indicated that relevant articles are published in both periods. In this context, highly cited publications from the 1978–2011 period represent foundational knowledge for satellite-based environmental monitoring. Highly cited publications from the 2012–2024 period reflect methodological advances and the emergence of application-oriented research addressing contemporary environmental challenges.
A closer look at the early phase of EO research (1978–2011) suggests that publication output and citation impact followed different temporal patterns. When publication and citation trends are considered together (
Figure 1 and
Figure 2), citation impact is observed to increase earlier than overall publication output. Average citations per article already rise in the late 1980s (around 1989;
Figure 2), whereas a more pronounced increase in the total number of publications becomes apparent only in the early 1990s (
Figure 1). This temporal offset reflects differences in the dynamics of the two metrics. Citation levels are not determined solely by the number of articles published in a particular year, but also by the role individual studies occupy within the developing citation network. In the early stages of the field, a relatively small number of methodologically influential papers—such as studies based on consistent Landsat time series or those demonstrating the analytical value of satellite data—can attract a high number of citations by serving as reference points for later work. A sustained increase in publication output typically follows once conceptual and methodological approaches are consolidated, data and tools become more widely available, and research practices stabilise. Seen in this light, the rise in citation impact prior to publication growth reflects a normal transition from an early formative phase of EO research to a period of broader scientific production and application.
3.2. Research Landscape and Publication Patterns
3.2.1. Publication Venues and Research Outlets
The journals
International Journal of Remote Sensing,
Remote Sensing of Environment,
International Journal of Applied EO and Geoinformation, and
IEEE Transactions on Geoscience and Remote Sensing were in the top 10 journals by publication number and citations in both periods (
Figure 3A,B). These journals represent the main publication venues through which EO research is integrated into environmental and geographic sciences, including environmental monitoring, land-surface analysis and global change research. In contrast,
Photogrammetric Engineering and Remote Sensing and the
Canadian Journal of Remote Sensing, which ranked among the top 10 journals by publication number in the 1978–2011 period, dropped below the top 50 in the 2012–2024 period.
The journal Remote Sensing stands out with the highest publication number in the 2012–2024 period. Although Remote Sensing was founded in 2009 and adopted a monthly publication schedule in 2010, it ranked 11th in the 1978–2011 period. This indicates the journal’s rapid development and great popularity from the very beginning. Although the journal was not among the top 100 by citation count in the 1978–2011 period, it became the most cited journal in the 2012–2024 period. The journal Sustainability ranked among the top 10 journals by publication number in the 2012–2024 period but did not appear in the journal list in the 1978–2011 period, as it was founded in 2009 and initially did not cover many EO and remote sensing topics. Remote Sensing Applications-Society and Environment journal, ranked among the top 10 journals by citation number in the 2012–2024 period was founded in 2015, which is why it was not on the journal list from 1978–2011 period. Journals such as Science, Nature, and Agricultural and Forest Meteorology ranked among the top 10 journals by citation count in the 1978–2011 period. However, they were not among the top 10 by publication number in that period and dropped below the top 10 by citation count in 2012–2024, although they remained within the top 20. This indicates that, while these journals published fewer EO-related articles, those publications were highly influential and often linked EO data with broader environmental processes and global change research.
The source impact indices show that in both periods, across all three indices,
Remote Sensing of Environment stands out as the most influential and impactful journal. In the 1978–2011 period, it is followed by
International Journal of Remote Sensing and
IEEE Transactions on Geoscience and Remote Sensing, while in the 2012–2024 period the leading group expands to include
Remote Sensing and
ISPRS Journal of Photogrammetry and Remote Sensing. In the 1978–2011 period, no major differences in h-index were observed among other journals; however, differences were evident in the m-index, where the
International Journal of Applied Earth Observation and Geoinformation,
Remote Sensing, and
Atmospheric Chemistry and Physics stood out, indicating that these were influential but relatively young journals. This reflects the central role of journals that explicitly integrate EO methods with environmental science questions, rather than focusing solely on technical or sensor-oriented aspects. The journals
Photogrammetric Engineering and Remote Sensing,
Journal of Applied Remote Sensing,
Geomorphology,
Environmental Monitoring and Assessment,
Ecological Applications,
Canadian Journal of Remote Sensing and
Atmospheric Environment, which were in the top 10 according to one of the indices in the 1978–2011 period, were no longer in that position in the 2012–2024 period. They were replaced by
Science of the Total Environment,
Remote Sensing Applications-Society and Environment,
IEEE Journal of Selected Topics in Applied Earth Observations and Remote Sensing and
Ecological Indicators (
Figure 4). The distribution of journals reflects the close integration of EO research with environmental and geographic fields.
3.2.2. Evolution of Authorship and Collaboration
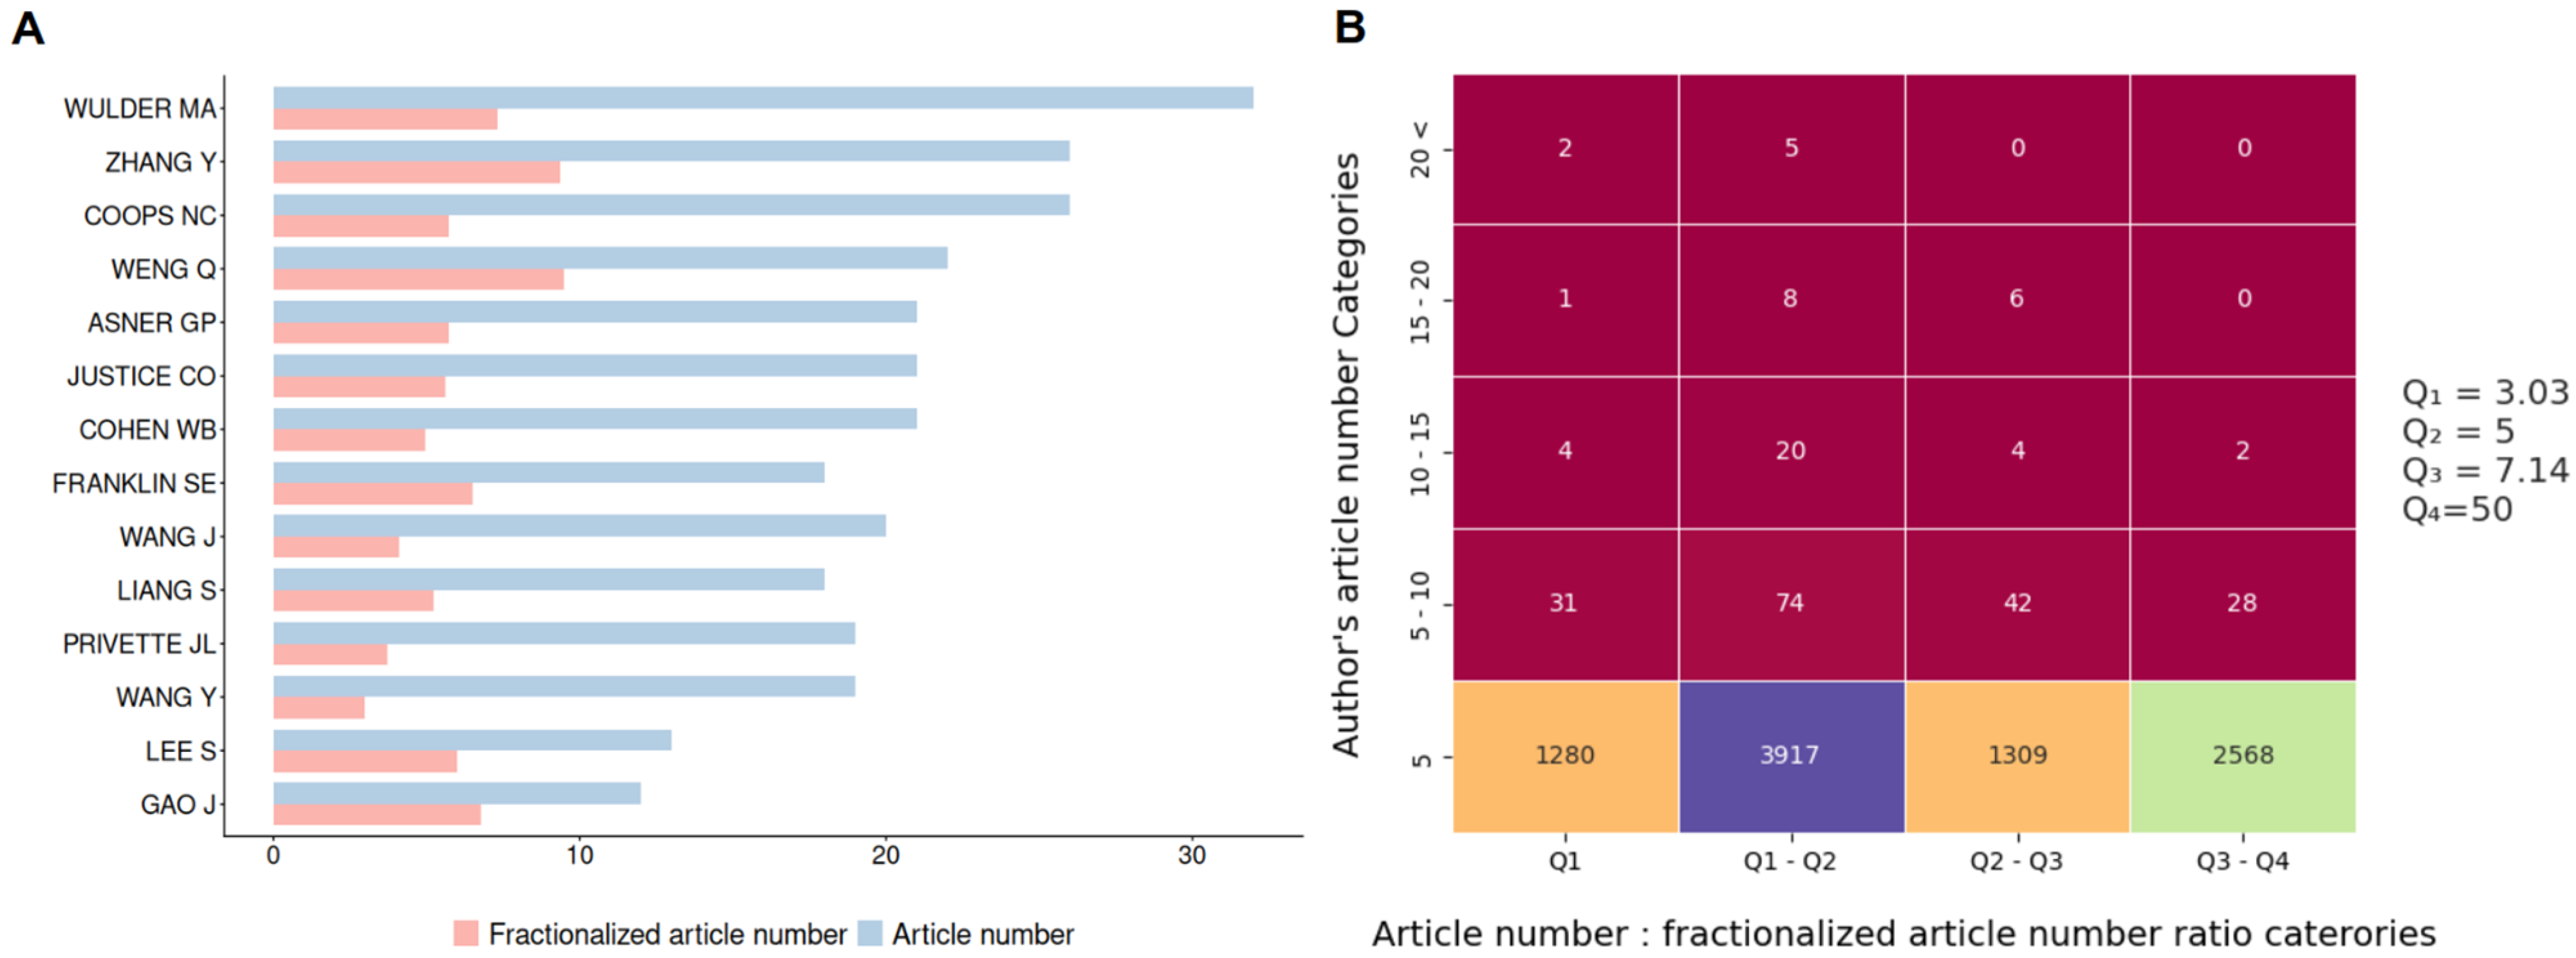
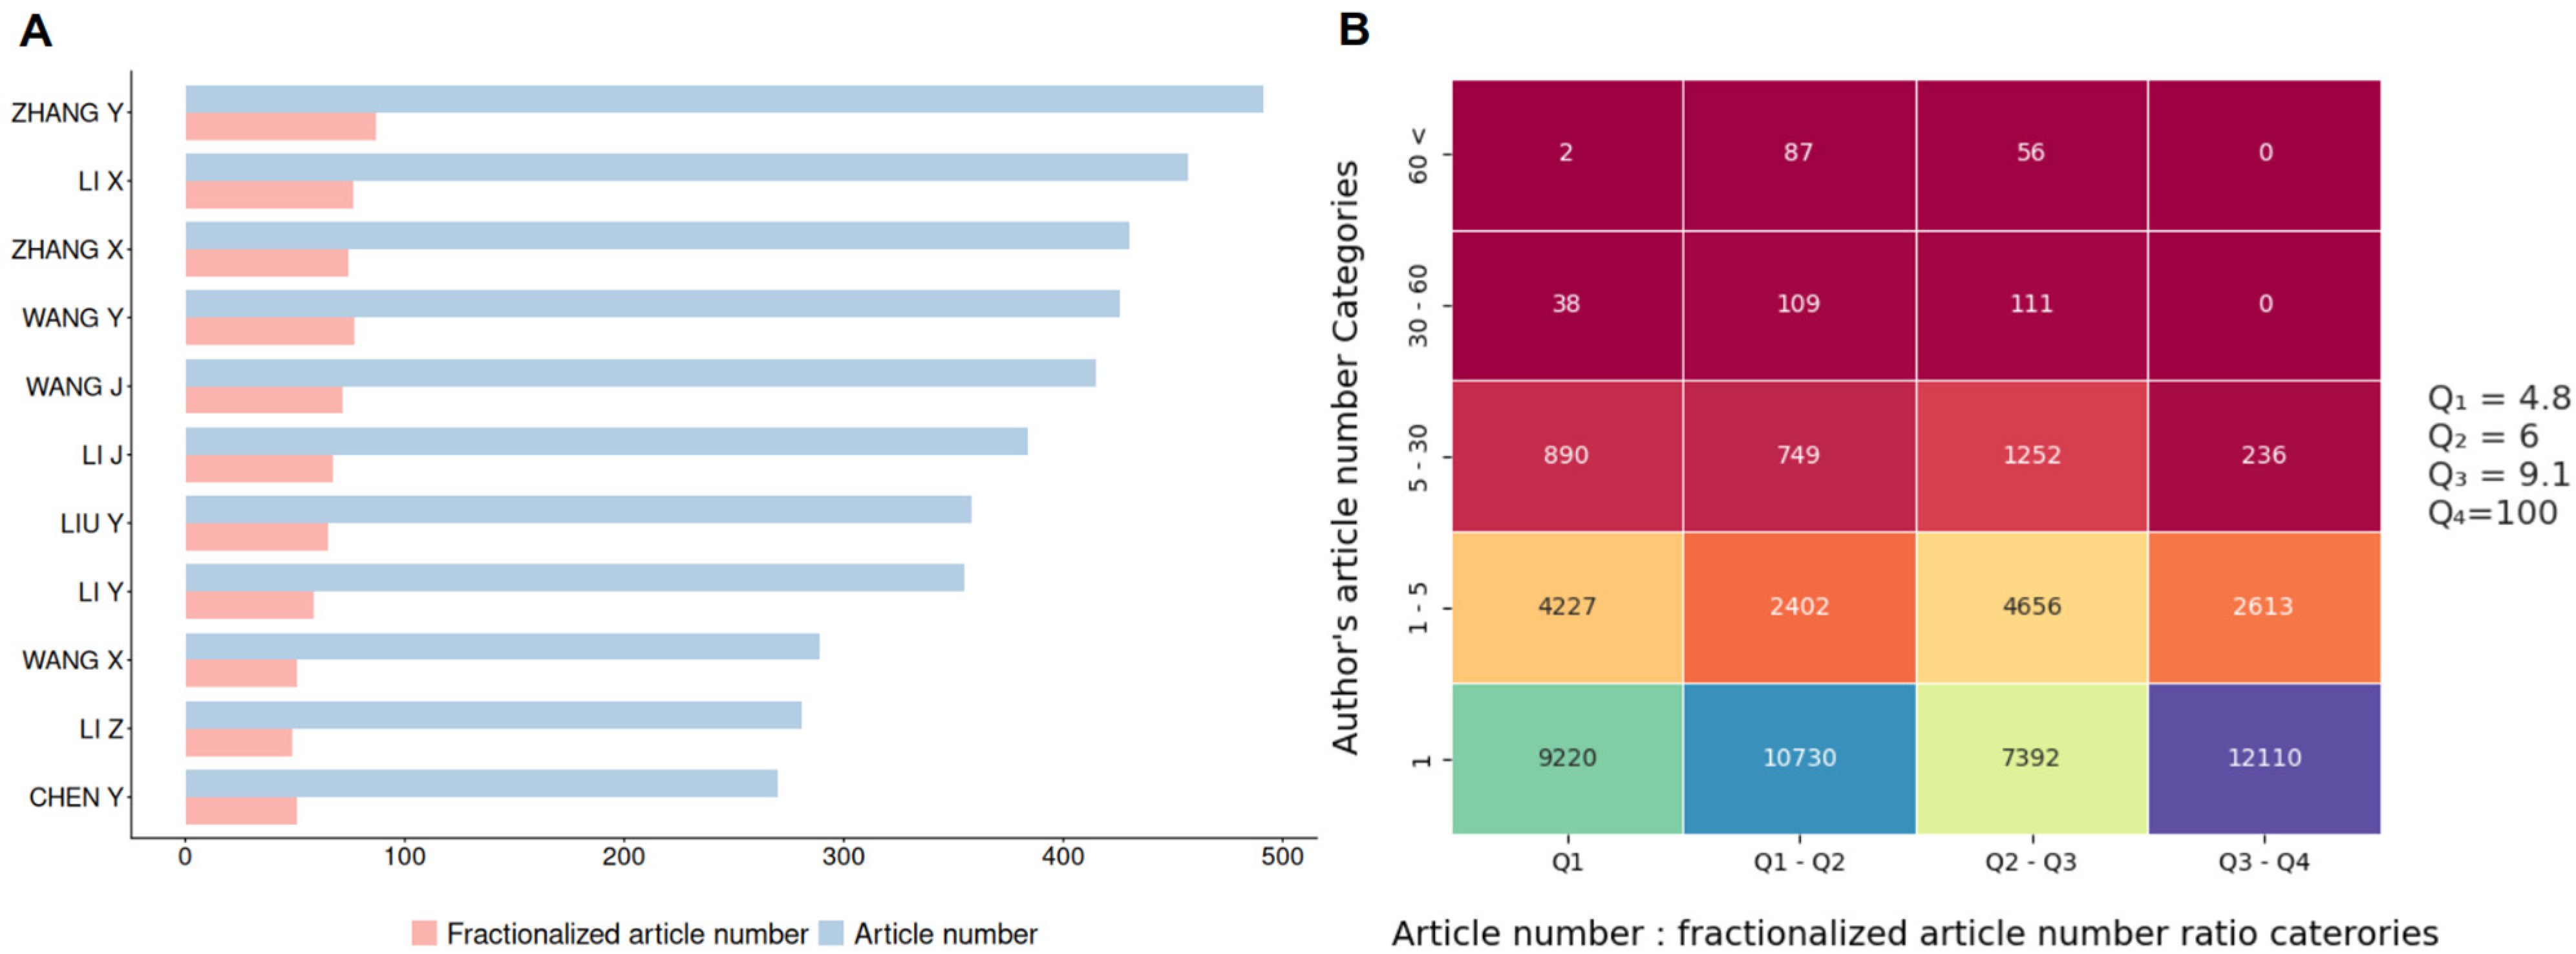
The number of publications and citations greatly increased from the 1978–2011 period, where the author with the highest article number had 32 publications, to the 2012–2024 period, where the author had 491 publications. Zhang Y., Wang J. and Wang Y. were the authors who remained among the top 10 authors by publication number in both periods (
Figure 5A and
Figure 6A). Zhang Y. was second by publication number in the 1978–2011 period and in the 2012–2024 period became an author with the most publications. Wulder M. A. dropped from the first place by publication number in the 1978–2011 period below the top 100 in the 2012–2024 period and although he was not on the top 10 most cited authors in the 1978–2011 period, he was among them in the 2012–2024 period. By both publication and citation numbers Justice C. O. was in the top 10 authors in the 1978–2011 period indicating a very important author for that period. All other authors from the top 10 by publication number from 1978–2011 period were not in the top 10 by citation number for the same period. Townshend J. R. G., Strahler A. H., Gao F., Hansen M. C., Woodcock C. E. and Roy D. P. are the authors who were in the top 10 authors by citation number in the 1978–2011 period, although not among the top 10 by publication number but were in top 30. All the top 10 authors by citation number from the 2012–2024 period were below the top 100 authors by publication number. Wulder M. A., Woodcock C. E., and Zhu Z. were among the authors appearing in the publication-number list for the 1978–2011 period, indicating that these authors were more active in the previous period and published impactful articles that remain relevant today (
Figure 6A). This trend is also visible when comparing total citation impact across periods (
Figure S2). The figure shows the top 10 authors by total citation number for both periods. In the 1978–2011 period, citation impact is concentrated among authors, such as Townshend, Strahler and Justice, who shaped early remote sensing methodology. In contrast, the 2012–2024 period is dominated by highly cited authors, such as Gorelick, Thau and Moore, reflecting the shift toward cloud computing, large-scale EO data processing and Google Earth Engine–driven research. Such patterns are consistent with broader shifts toward large-scale, data-intensive EO applications, often associated with environmental monitoring, long-term time-series analyses and global assessments that increasingly rely on shared infrastructures, cloud-based platforms and international research teams.
Considering the number of publications and the ratio between total and fractionalised article counts, several types of authors can be identified. One type includes authors with both a low number of articles and a low article-to-fractionalised-article ratio, indicating that they have published few articles with a small number of co-authors. The second type consists of authors with a high number of articles and a low ratio value, meaning that they have many publications with relatively few authors per article. The third type comprises authors with a low number of articles but a high ratio value, indicating few publications with a high number of co-authors per article. The fourth type includes authors with many publications and high ratio values, indicating that these authors have co-authored many articles with numerous other authors.
During the 1978–2011 period, authors with a low number of publications dominated, accounting for approximately 97.6% of all authors, of whom 14.1% also had low ratio values, indicating fewer co-authors per document (
Figure 5A). Although seven authors recorded more than 20 publications in absolute terms (
Figure 5A), only two authors, Zhang Y. and Weng Q., fall into the category of authors with more than 20 publications when publication counts are considered together with fractionalised authorship (
Figure 5B).
In the 2012–2024 period, authors with five or fewer publications also dominated, accounting for approximately 93.8% of all authors, of whom about 74% had only one publication, while 22.7% co-authored papers with nine or more other authors (
Figure 6B). Only two authors had more than 60 publications and low ratio values, indicating a large number of publications with relatively few co-authors, and these authors are not ranked among the top ten by either publication count or citation count (
Figure 6).
3.2.3. Institutional Patterns in Scientific Production
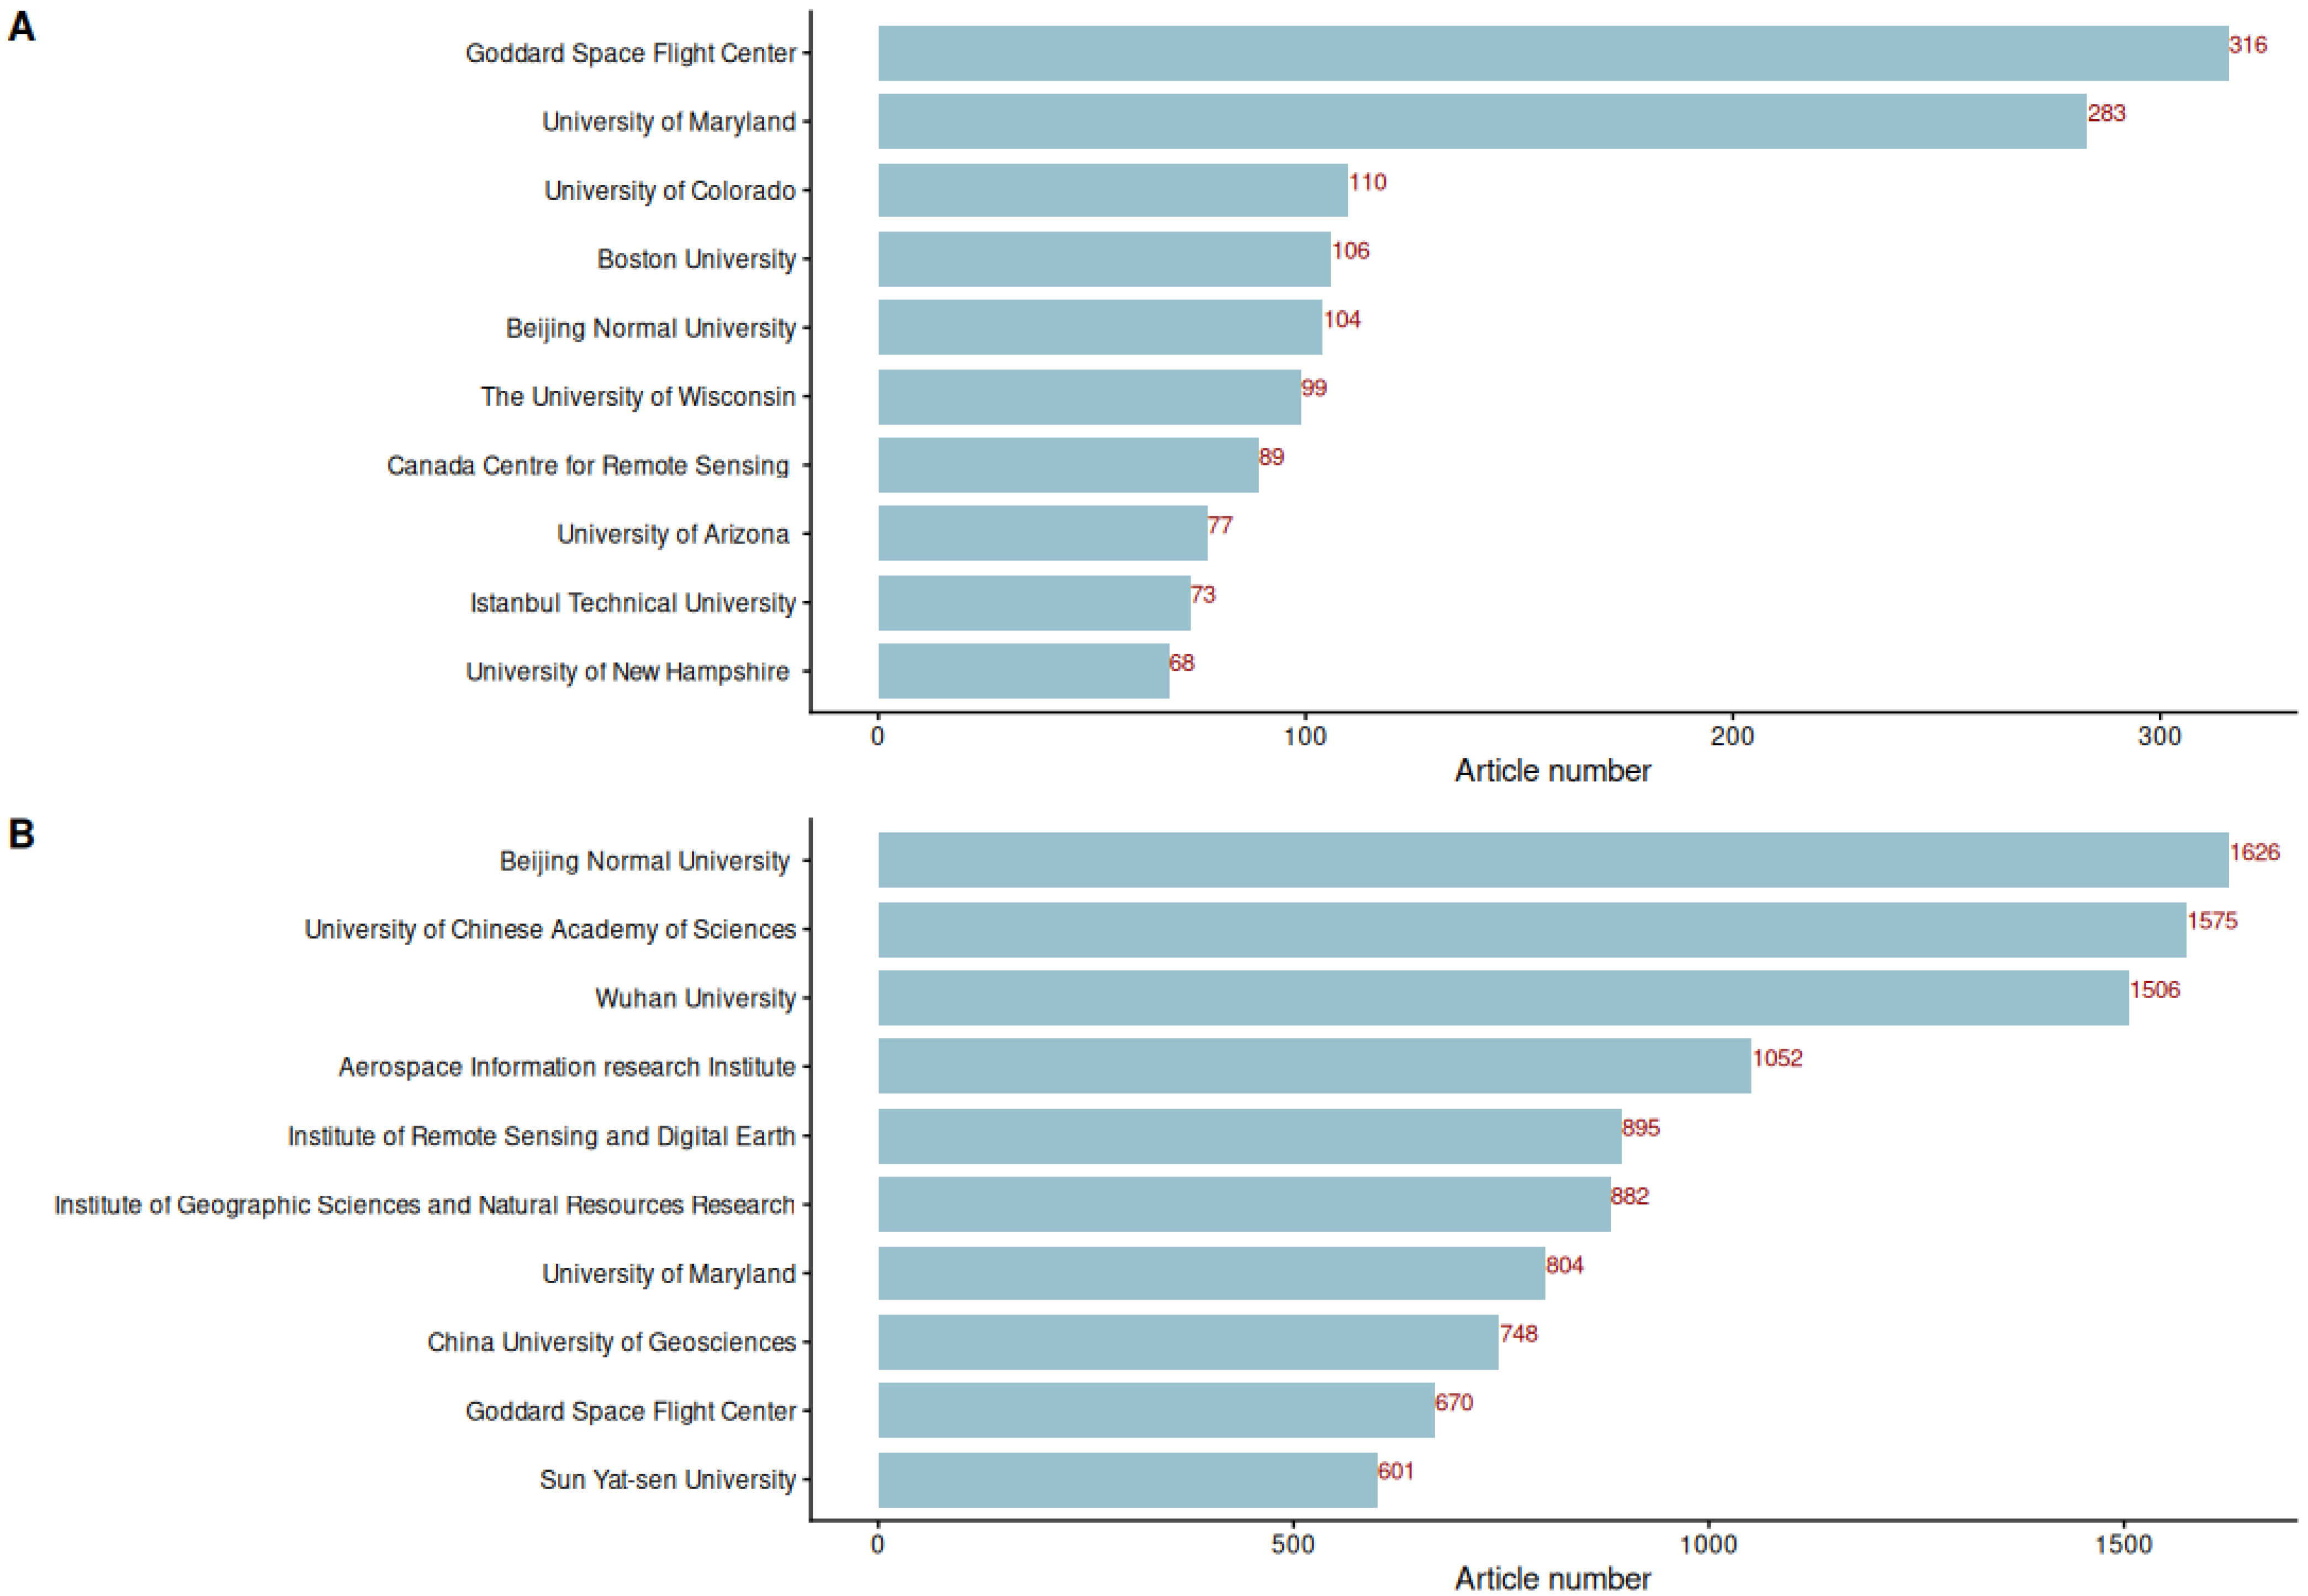
According to the publication numbers, institution rankings greatly changed from 1978–2011 to the 2012–2024 period. Only Goddard Space Flight Center, University of Maryland and Beijing Normal University remained among the top 10 institutions by publication number in both periods, while Beijing Normal University rose to first place in the 2012–2024 period, and the University of Maryland and Goddard Space Flight Center dropped to seventh and ninth place, respectively. University of Colorado, Boston University, University of Wisconsin, Canada Centre for Remote Sensing, University of Arizona, Istanbul Technical University and University of New Hampshire were replaced in the top 10 list in the 2012–2024 period with University of Chinese Academy of Sciences, Wuhan University, Aerospace Information Research Institute, Institute of Remote Sensing and Digital Earth, Institute of Geographic Sciences and Natural Resources Research, China University of Geosciences and Sun Yat-sen University (
Figure 7). This shift reflects a broader reconfiguration of the institutional landscape of EO research, with increasing prominence of institutions that combine large-scale EO infrastructures with environmental monitoring, natural resource assessment and long-term spatial analysis.
3.2.4. Geographical Patterns of National Research Activity
In the 1978–2011 period the country with the highest publication number based on the corresponding author was the USA, followed by China with a much smaller value, but they changed places in the 2012–2024 period (
Figure 8A and
Figure 9A) reflecting USA’s developmental leadership. Canada, Italy, Germany and India have also retained their positions among the top 10 by publication number in the 2012–2024 period, while the rankings of United Kingdom, Turkey, Japan and Australia declined but remained in the top 20. France, Brazil, Spain and Iran moved from the top 30 in the 1978–2011 period into the top 10 by publication number in the 2012–2024 period. All countries from the top 10 lists from both periods, except France in the 2012–2024 period, have a greater single-country publication number in relation to the multiple-countries publication number.
Inspecting the countries publication and publication number heat map, a few types could be recognised:
- (a)
countries with a high publication number, of which a large percentage belongs to multiple-countries publications,
- (b)
countries with a high publication number, of which a small percentage belongs to multiple-countries publications,
- (c)
countries with a small publication number, of which a large percentage belongs to multiple-countries publications, and
- (d)
countries with a small publication number, of which a small percentage belongs to multiple-countries publications (
Figure 8B and
Figure 9B).
This pattern suggests that smaller research systems often contribute to high-impact EO studies through international collaboration, particularly in environmental monitoring and global-scale analyses. To improve robustness and comparability, country publication numbers were divided into four categories that corresponded to quartiles, where the Q3–Q4 category represents the most productive EO research systems, the Q1–Q2 and Q2–Q3 categories include countries with moderate output, and the lower, 0–Q1 category captures emerging or low-activity systems. This approach reduces the subjectivity of “high/low” labels and makes cross-country contrasts more transparent.
Within this structure, several countries stand out as notable exceptions relative to their size. The Netherlands, for example, remains consistently positioned in the upper, Q3–Q4 category despite its small population, reflecting strong institutional capacity and high rates of international collaboration. Similarly, Switzerland, Denmark and Austria exhibit disproportionately high average citation impact and collaboration intensity, indicating the role of targeted national investment and integration into European research networks. China, Canada, the United Kingdom, Italy, Germany, Japan and Australia in both periods belonged to the group with high article number and with 25–50% multiple-countries publication, except the United Kingdom whose multiple-countries publication percentage rose from 36% to 58%. The USA, as the leading country in the 1978–2011 period, belonged to the group with a high publication number, although only 21% (271 publications) belonged to multiple-countries publications; this value exceeds China’s total publication number (267 publications).
There were 12 countries with multiple-countries publication between 75 and 100% but had up to seven publications in the 1978–2011 period (Kenya, Algeria, Ethiopia, Morocco, Nepal, Sri Lanka, Zimbabwe, Ecuador, Mongolia, Namibia, Niger and Senegal). Compared with the last period, in 2012–2024, only Namibia remained in the same status, Kenya and Ecuador rose in total publication number but remained in the high multiple-countries publication group while others’ multiple-countries publication percentage decreased and total publication number increased.
The Netherlands was the only country with high article number and multiple-countries publication between 50 and 75% and remained at that group in the 2012–2024 period. In the 2012–2024 period, countries with high article number and multiple-countries publication between 25 and 50% formed the most abundant group, followed by countries with multiple-countries publication between 50 and 75% and with article number values from 3.5 to 22 and from 22 to 113.
The number of countries with low article number and high multiple-countries publication rose from 9 in the 1978–2011 period to 15 in the 2012–2024 period with 13 countries new to the list. The number of countries with low article number and low multiple-countries publication decreased from 13 to 10 with only Azerbaijan remaining in its status, Zambia and Jamaica increased multiple-countries publication percentage but remained in the group with low article number, Croatia remained in the low multiple-countries publication group while increasing total article number and all other countries increased both multiple-countries publication percentage and total article number.
All the top 10 countries by citation number from the 1978–2011 period (except the Netherlands and France), were not in the top 10 by publication number list but were among the top 15 countries. USA, China, Canada, the United Kingdom, Germany, Australia, the Netherlands, France and Italy are countries that remained in both periods among the top 10 most cited countries, only Spain from the 1978–2011 period was replaced by India in the 2012–2024 period, but both were among the top 15 (
Figure 8A and
Figure 9A).
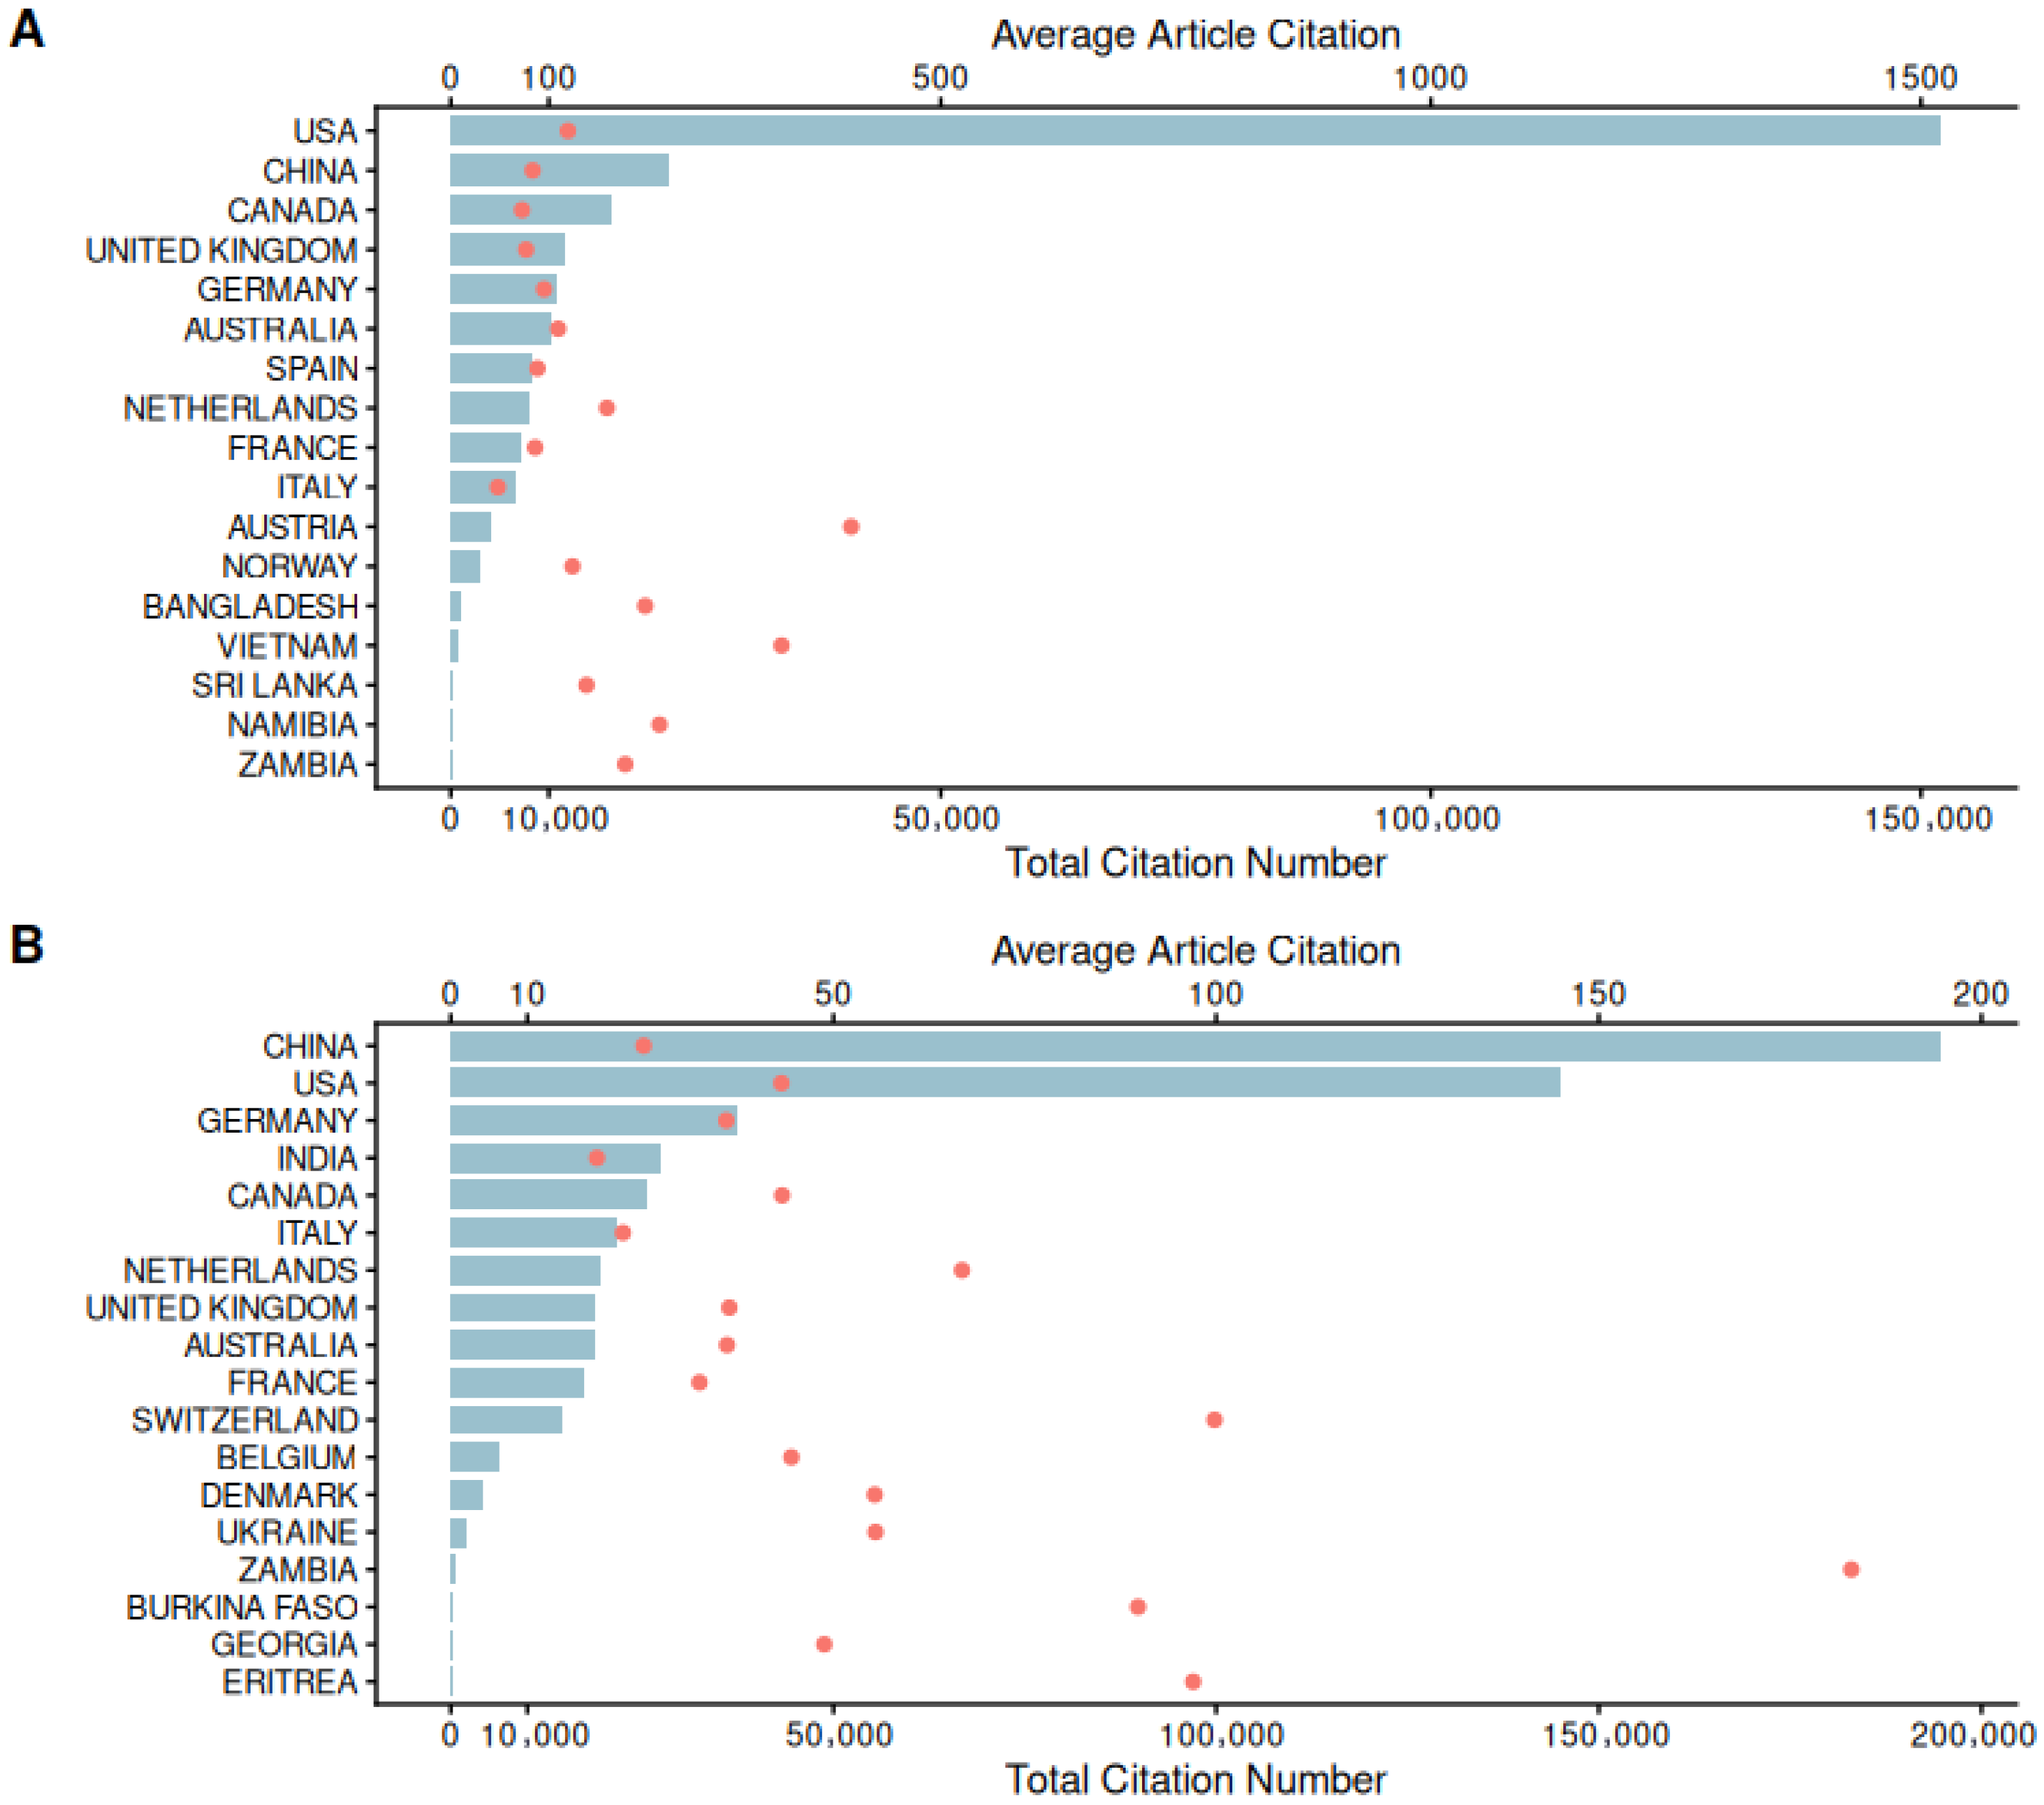
Figure 10 combines two complementary citation indicators at the country level: red dots show the average number of citations per article (top
x-axis), representing per-publication impact, whereas blue horizontal bars indicate the total citation number (bottom
x-axis), capturing cumulative citation volume. Separate x-axes are used because these metrics differ substantially in scale and interpretation, while countries are aligned along a shared
y-axis to enable direct comparison between citation efficiency (average) and citation volume (total). From the previous list of countries only the USA, Australia and the Netherlands were among the top 10 countries by average article citation. On the other hand, countries that are not among the top 10 by total citation but are by average article citation in the 1978–2011 period are Austria and Vietnam with the highest values followed by Namibia, Bangladesh, Zambia, Sri Lanka and Norway (
Figure 9A). Only Austria and Norway had 10 and 25 articles with 50 and 52% of multiple-countries publication, respectively, while other countries had five or less articles. Two had 100% of multiple-countries publication (Sri Lanka and Namibia), two had around 50% (Bangladesh and Vietnam) and only Zambia did not have any multiple-countries publication (
Figure 10).
In the 2012–2024 period Canada was the only country on the top 10 list by citation, average article citation and total publication number. The Netherlands, Switzerland, Belgium, and Denmark were also among the top 10 countries by average article citation number for the 2012–2024 period. In the same period, these countries recorded more than 50 total publications, and a multi-country publication share equal to or exceeding 50% (
Figure 8B and
Figure 9B). Zambia had the highest average article citation value but had a low publication number and multiple-countries publication percentage greater than 50%. Burkina Faso, Georgia and Eritrea also had low publication numbers and high multiple-countries publication percentages.
While the analysis is carried out at the country level, the results nonetheless point to broader regional disparities, especially between established research regions and countries of the Global South, which are further explored through collaboration networks and spatial analyses in the following sections.
3.2.5. Citation Patterns of Highly Cited Documents
Documents’ global citation scores are provided by the Web of Science database, which measure a document’s impact across the whole bibliographic database, and a large proportion of citations may come from other research areas. Blaschke, T. 2010 [
61] had the highest global citation score in the 1978–2011 period, followed by Friedl M. A., 2002 [
38], Schaaf C. B., 2002 [
40], Hansen M. C., 2000 [
39] and Weng Q. H., 2004 [
41], which are also among the top 10 documents by local citation score, indicating that these articles were important across other research areas. Many of these highly cited documents provide methodological or data foundations that underpin a wide range of environmental and Earth system studies. The same applies to Gorelick N., 2017 [
62], Drusch M., 2012 [
63], Zhu Z., 2012 [
64], Torres R., 2012 [
65], Feyisa G. L., 2014 [
66] and Vermote E., 2016 [
67] in the 2012–2024 period (
Figure 11A,B).
Although a large proportion of publications in Earth observation research are application-oriented, the citation structure suggests that many of the most influential contributions are methodological and technological in nature. This is reflected in the top-cited documents across both analysed periods (
Figure 11A,B), which are largely linked to data-processing frameworks, sensor calibration standards, satellite missions, and analytical platforms that underpin a wide range of subsequent applied studies.
3.2.6. Keyword Frequencies and Trends
Among the most frequent keywords in both researched periods, were keywords “remote sensing”, “MODIS” and “Landsat”, which is expected considering that these were the words used in the search query. In addition, there were also keywords “model”, “vegetation”, “classification”, “forest”, “NDVI”, “land use and land cover” indicating that in both periods satellite data were used for research on similar topics. In the 1978–2011 period, keywords such as “reflectance”, “accuracy”, “calibration” and “imagery” were also found to be frequent indicating that this period was the initial and fundamental period of new ideas and technology development. Whereas frequent keywords such as “machine learning”, “time-series” and “climate change” in the 2012–2024 period indicated this as the new period where themes from the previous period were upgraded (
Figure 12 and
Figure S1). This shift is also reflected in significantly higher keyword frequencies in the later period, especially for terms such as machine learning, Sentinel, and land surface temperature, reflecting the growing role of EO in environmental and climate-related research.
3.3. Thematic Evolution and Research Clusters
With thematic analysis in the 1978–2011 period, three different clusters were identified. The smallest cluster oriented around “retrieval”, “products”, and “aerosols”, represents niche themes that were highly specialised and isolated from other topics but at the same time well developed. The second, larger cluster, with “Landsat”, “classification”, and “imagery”, represents themes that began to emerge as fundamental and important during this period. The largest cluster, centred on the keywords “remote sensing”, “MODIS”, and “model”, includes themes that are both important and well developed (
Figure 13A).
Niche themes from the 1978–2011 period, such as “retrieval” and “products,” became less developed and remained marginal in the 2012–2018 period, while themes related to aerosols and air quality remained niche themes. This period is characterised by two additional clusters: one comprising core and fundamental topics around “MODIS” and “remote sensing”, and another, larger cluster centred on “Landsat”, “land use and land cover”, and “classification”, representing both important and better developed themes (
Figure 13B).
Less developed niche themes, such as “retrieval” and “products”, from the 2012–2018 period disappeared in the 2019–2021 period, while air quality and air pollution remained niche themes. A new, well-developed niche cluster emerged in this period around the themes “InSAR”, “deformation”, and “interferometry”. Three clusters representing basic and fundamental knowledge were present: one covering topics such as “land use and land cover” and “dynamics” at the border of marginal themes, a second cluster comprising themes related to the use of machine learning techniques for satellite data processing, which had become basic and fundamental during this period, and a third cluster, including both fundamental and well-developed themes centred on Sentinel and Landsat satellites (
Figure 13C).
As in the first period, the 2022–2024 interval is characterised by two large clusters, covering both fundamental, core research areas around “remote sensing”, “Landsat”, and “classification”, and better-developed, important topics around “MODIS”, “machine learning”, and “Sentinel”. The themes “InSAR”, “deformation”, and “interferometry” can be interpreted as declining themes, as they shifted from well-developed niche themes in the 2019–2021 period to marginal themes in the 2022–2024 period (
Figure 13D).
Overall, thematic maps suggest that methodological topics—such as machine learning, time-series analysis, Sentinel-based processing and cloud-based platforms—tend to occupy more central and better developed positions in the recent period, while application-oriented themes remain more dispersed across peripheral or application-oriented clusters (
Figure 13). Taken together, this pattern points to the continued importance of methodological and technological work for the field, mainly through the foundational role it plays in enabling diverse applied Earth observation studies.
Document co-citation network analysis was conducted using the reference lists of all publications in the bibliographic dataset. Four document co-citation clusters were identified in the 1978–2011 period: one smaller cluster centred on Kaufman Y. J., 1997 [
68], and three larger clusters centred on Congalton R. G., 1991 [
69], Huete A., 2002 [
70], and Tucker C. J., 1979 [
71]. Mutual citation links were observed among all clusters, but Huete A., 2002 [
70] stood out due to the highest number of links and co-citations. In most cases, documents from the same cluster were cited together within a given publication, with only a few co-citations occurring between documents from the Tucker C. J., 1979 [
71] and Huete A., 2002 [
70] clusters (
Figure S3A).
The cluster centred on Congalton R. G., 1991 [
66] merged with the cluster centred on Tucker C. J., 1979 [
71] in the 2012–2018 period, while the smaller Kaufman Y. J., 1997 [
68] cluster persisted during this period. Two additional clusters emerged in this period. In the 2012–2018 period, most of the documents belonged to the previous period, indicating that these represented important knowledge sources, some of which remained present through all subsequent periods up to 2024 (
Figure S3B).
In the 2019–2021 period, numerous smaller clusters appeared, along with two medium-sized and two larger clusters, containing documents from all previous periods, with the largest cluster centred on Gorelick N., 2017 [
62]. Finally, in the 2022–2024 period, one large cluster dominated, centred on Gorelick N., 2017 [
62] and Breiman L., 2001 [
72], and, as in the previous period, documents from all analysed temporal ranges were intermixed (
Figure S3D).
Historiographic mapping identified three distinct citation lines. The first, in which Schaaf C. B., 2002 [
43] had the most citation links, comprised mostly publications from 2002. The second was centred on Nemani R., 1993 [
73] and included publications from different years, and the third, centred on DeFries R. S., 1998 [
74], included publications from 1998 to 2002. In the 2012–2018 period, three co-citation lines were identified, with the most documents originating from 2012. The 2019–2021 period exhibited four distinct lines, two of which were very short and contained documents from the same year. Finally, in the 2022–2024 period, only one co-citation line was identified, with the most documents belonging to the year 2022 (
Figure S4).
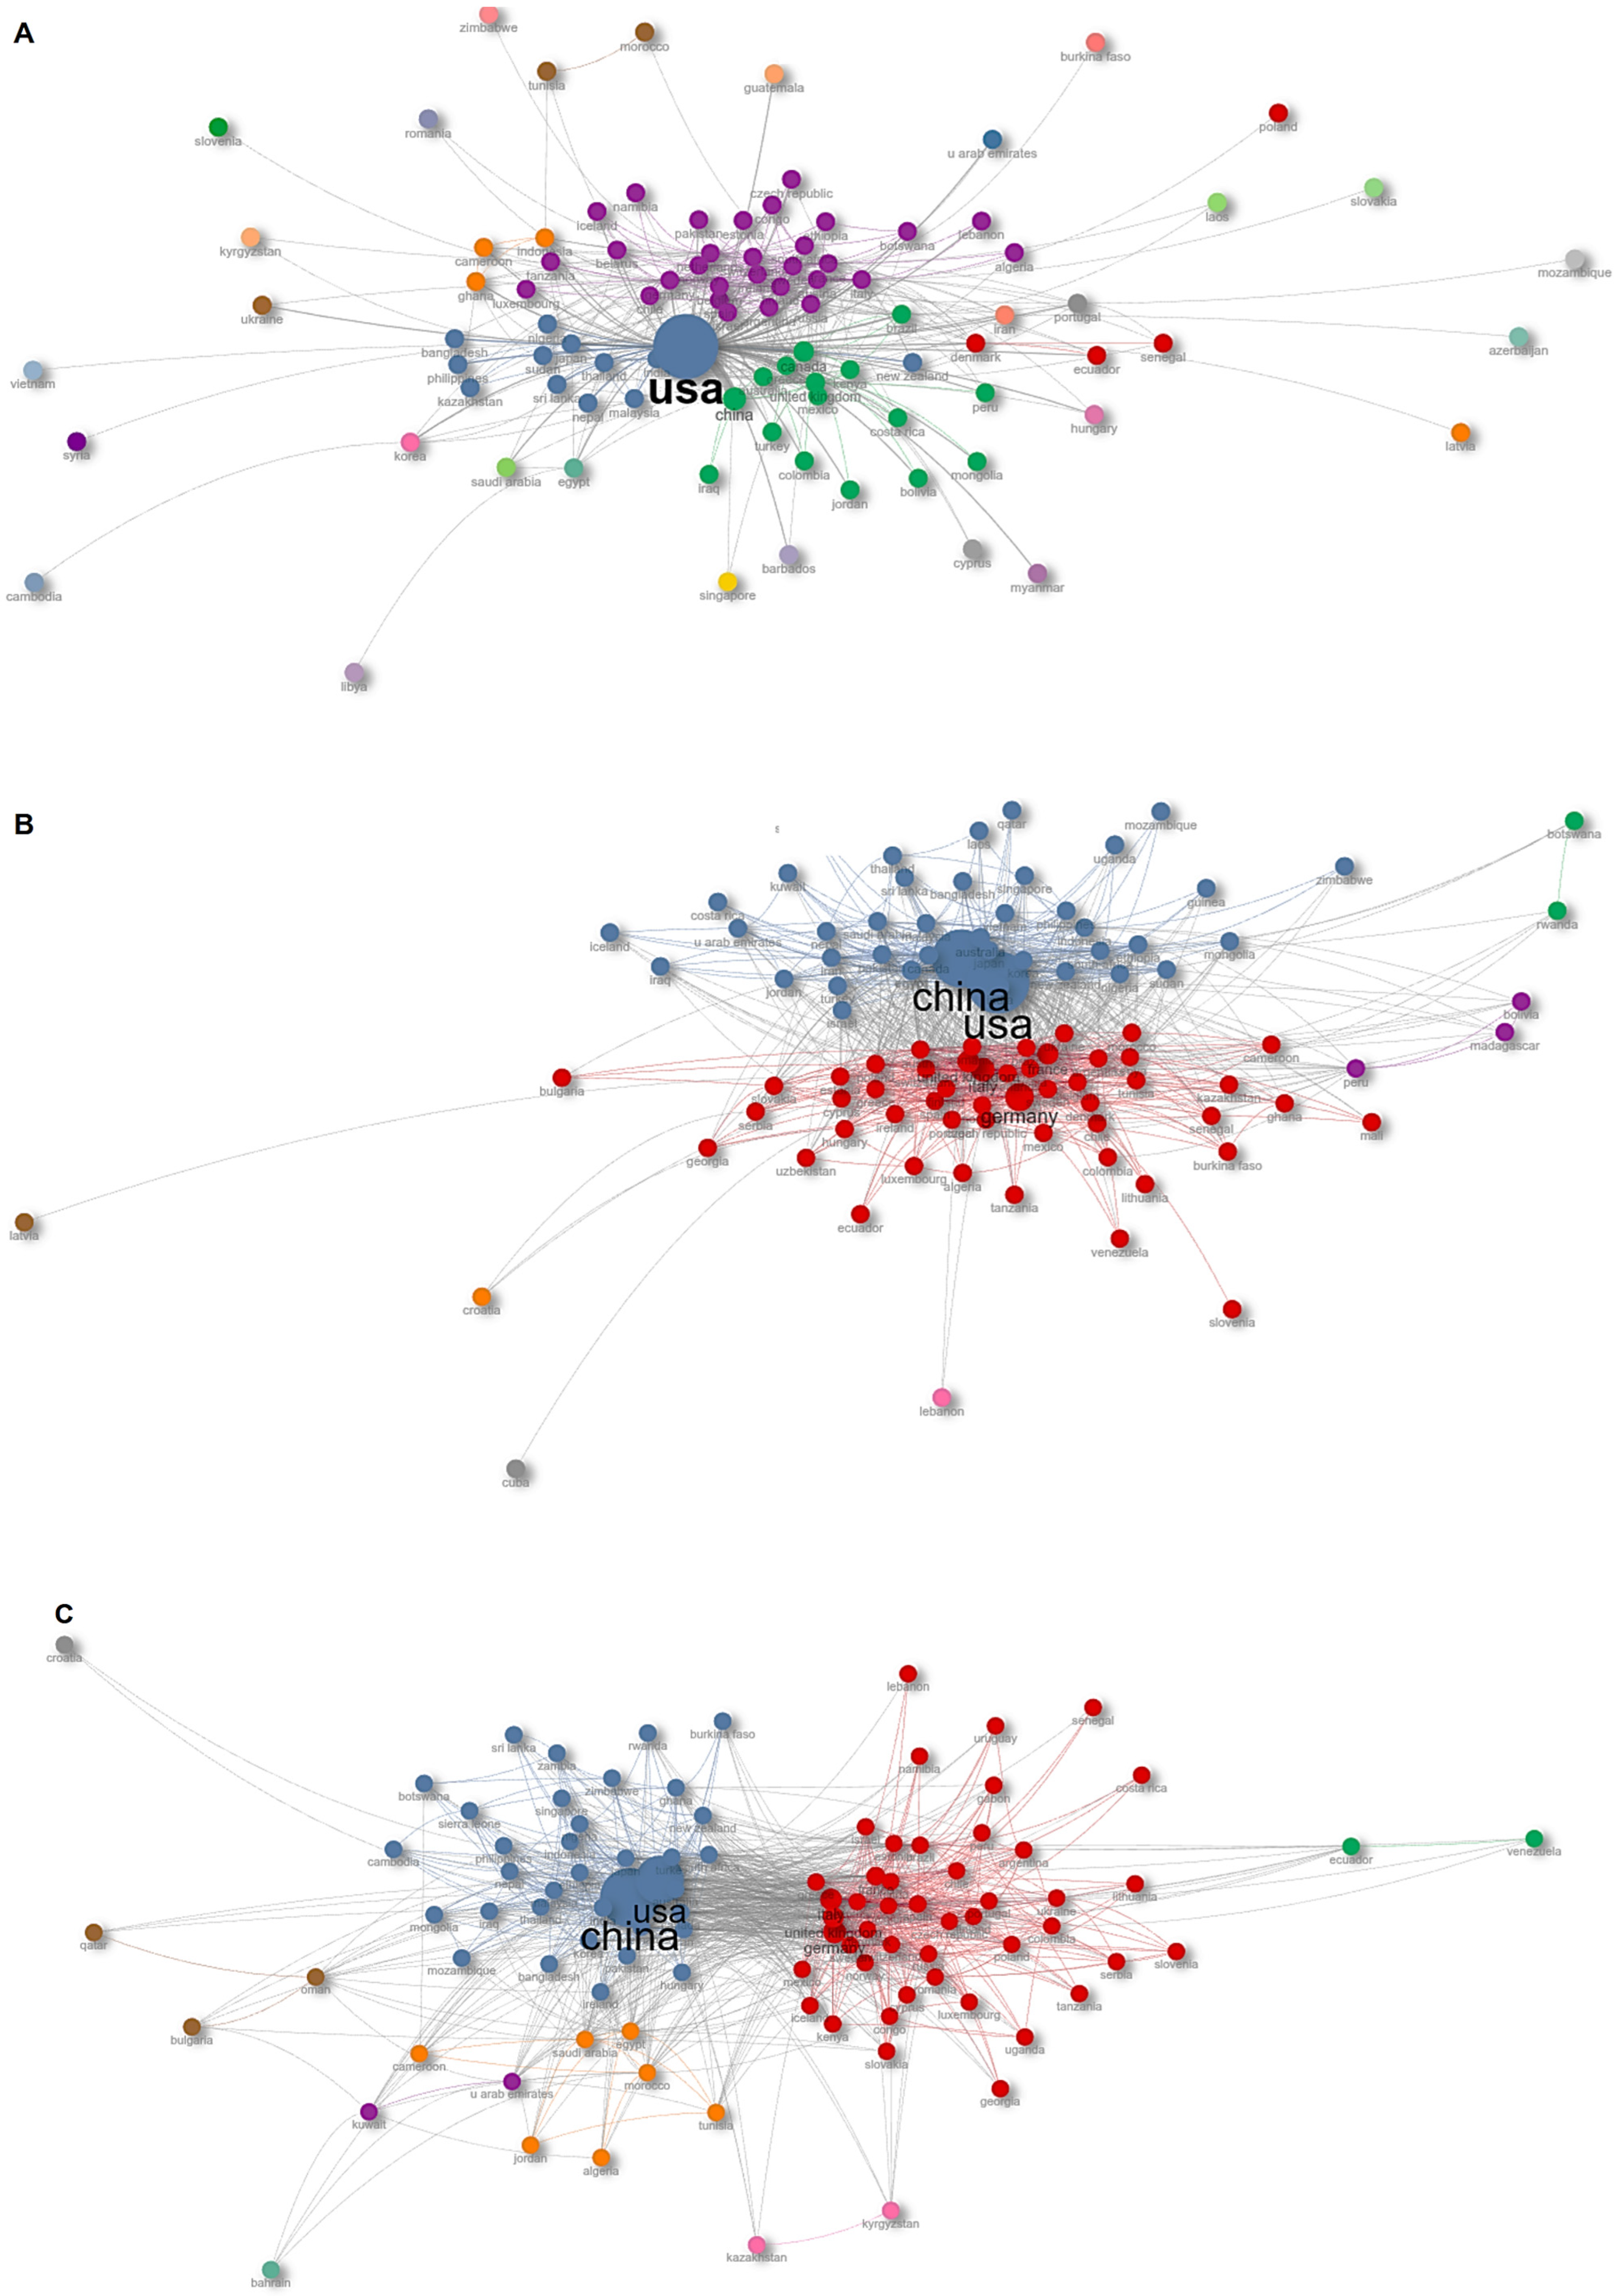
Figure 14 illustrates the temporal evolution of country-level collaboration networks, following a pattern like that observed in authorship networks shown in
Figure S4. Over time, the number of fragmented collaboration groups gradually decreases. In these networks, nodes represent countries, while edges denote international co-authorship links.
In the early period (1978–2011), the network is highly centralised (
Figure 14A). The United States occupies a dominant position and functions as the primary hub of international collaboration. Most other countries are connected through relatively sparse and peripheral links.
During the 2012–2018 period, China emerges as an additional central actor (
Figure 14B). This shift leads to a more interconnected network structure and a clearer formation of collaboration clusters. In this phase, the United States and China remain part of the same dominant collaboration community. At the same time, European countries become more prominently integrated within a secondary but cohesive collaboration core.
In the 2019–2021 period, the collaboration network continues to be structured around China and the United States (
Figure 14C). However, a notable change in internal organisation becomes apparent. China assumes a leading role within the network. The secondary collaboration group is no longer homogeneously concentrated around European countries and displays a more diverse and distributed structure instead.
This pattern persists in the most recent period (2022–2024). China further strengthens its leading position. The overall network appears more consolidated, with fewer isolated or weakly connected countries.
Despite shifts in relative dominance, China and the United States consistently remain within the same main collaboration cluster throughout the entire second period 2012–2024 (
Figure 14D). This highlights their enduring central role in shaping global research collaboration patterns. Across all periods, secondary collaboration clusters evolve from weakly defined and fragmented structures in the initial phase to more clearly differentiated communities in the intermediate phases. In the most recent phase, these communities become more stable and cohesive. They retain a distributed internal structure while remaining strongly connected to the dominant global collaboration core.
The observed collaboration patterns indicate that the recent intensification of international cooperation in Earth observation research is primarily taking place through multi-country co-authorship networks, in which countries of the Global South—particularly from Africa, South and Southeast Asia, and Latin America—are increasingly integrated into collaboration structures centred around China and the United States (
Figure 14C,D).
Geographical Collaboration Maps (1978–2024)
Spatial patterns of international collaboration reveal a clear and persistent concentration of EO research within a small number of countries, accompanied by gradual but uneven expansion of global cooperation over time. To complement the network-based visualisations and to emphasise the geographical dimension of EO collaboration, spatial collaboration maps were produced for all four temporal segments. These maps reveal how collaboration hubs shifted over time, how European and North American networks expanded, and how China became a central global actor after 2015. Spatialising collaboration patterns also highlights persistent gaps in participation across Africa, South America and parts of Asia. The four collaboration maps (
Figure 15) illustrate the evolution of cross-national scientific linkages across the four temporal segments used in this study: 1978–2011, 2012–2018, 2019–2021 and 2022–2024. Together, these maps provide insight into how geopolitical, technological and infrastructural developments have shaped the geography of EO research networks.
In the 1978–2011 period (
Figure 14A), collaboration networks were sparse and dominated by a limited number of countries with long-established EO infrastructures. The United States acted as the principal global hub, exhibiting both the highest publication output and the strongest bilateral collaborations, most notably with Canada, the United Kingdom, Germany and Australia. China was already present but formed substantially fewer connections than in later periods. Collaboration lines were concentrated in North America and Western Europe, while large parts of Africa, South America and South/Southeast Asia remained weakly connected or entirely absent. The structure of the network mirrors the early development of remote sensing, which relied more heavily on national agencies, specialised research centres and long-running programmes, such as Landsat and MODIS.
The 2012–2018 period (
Figure 14B) marks a pronounced intensification of international cooperation, largely aligned with the adoption of open-data policies and the launch of the Sentinel constellation. China emerged as a second major global hub, significantly expanding its collaboration network across Europe, Asia, Africa and Oceania. The United States and European countries (particularly Germany, the United Kingdom, Italy and France) remained influential, but the growing centrality of China is clearly visible in the increasing number and density of its collaborative ties. Countries in the Global South became more integrated into international networks, though typically through partnerships with high-capacity institutions in the USA, China, Australia or Western Europe. This period reflects the broader shift toward large multinational research teams and the rising use of cloud-based platforms that facilitate distributed collaboration.
Between 2019 and 2021 (
Figure 14C), the collaboration network became larger, denser and more global. China overtook the United States in the number of multi-country publications and became the main international hub in EO research. The European Research Area kept strong internal links, which reflects the organisation of the Copernicus program and EU-funded research projects. Collaboration with Africa and South America increased slightly, but these regions still show asymmetrical patterns, where many countries participate mainly through a few bilateral partnerships. This period also coincides with important methodological changes, especially the wider use of Google Earth Engine. These tools made participation easier, but they did not fully close the gap in research capacity between regions.
The 2022–2024 period (
Figure 14D) shows the most extensive and complex collaboration network. Two large global clusters can be seen: one centred on China and one on the United States, with Europe acting as a bridge between them. High-income Asia–Pacific countries (Australia, New Zealand, Japan, Republic of Korea) are also strongly connected to both clusters. The density of collaboration links within Europe increased further. In contrast, Africa and South America still have lower publication numbers but show growing dependence on multi-country collaborations. This confirms the increasing role of shared access to computing, expertise and data infrastructures. Even though global connectivity has expanded, spatial imbalances in scientific production remain clear. The most connected countries are also those with the highest output, strongest funding and most developed institutions.
Across all four periods, the maps indicate several important changes in the geography of EO collaboration. Over time, the system evolved from a highly centralised structure dominated by a few countries to a more diversified, but still unequal, global network. The stronger role of China after 2012 clearly changed global collaboration patterns and reflects both major national investments and the influence of open satellite missions. Participation from the Global South has grown, but it still depends strongly on partnerships with technologically advanced countries. This suggests that open data alone is not enough to remove deeper structural barriers. At the same time, the increasing density and wider spatial reach of the network follows the thematic development of EO research, where data-intensive, multi-institutional and cloud-based approaches have become central to the field.
3.4. Implications for Global EO Research
Although the global distribution of EO research output is still very uneven, most publications still come from countries with long-established research infrastructures, even though major satellite missions and cloud-based platforms offer access to EO data all over the world. High-income regions dominate the number of papers, while many lower-income countries contribute much less. These differences are more related to funding, institutional capacity, and training opportunities than to problems with access to satellite data itself.
From a geographical perspective, these spatial inequalities reflect uneven global distributions of scientific and technological capacity, including access to infrastructure, computing resources, and international research networks. By mapping these disparities across time, this study contributes to the geography of science by showing how EO research expands alongside new technologies while also reproducing persistent inequalities in knowledge production.
The growth of cloud-based analytical platforms, especially Google Earth Engine and the Copernicus cloud services, happened at the same time as a strong increase in publication numbers after 2015. These platforms combine large data archives with scalable computing resources and therefore reduce some technical barriers. However, the spatial patterns from this study indicate that they mainly increase productivity in countries that already have strong analytical capacity. Instead of creating a more balanced global research landscape, cloud platforms often strengthen existing differences, with North America, Western Europe, and East Asia keeping their leading positions.
Within this context, the United States and China appear as the two most influential contributors to EO research, but with different institutional structures. In the United States, EO research is spread across many universities, federal agencies and private companies, creating a highly decentralised system. In China, a large share of publications is concentrated in a smaller number of big institutions, within the Chinese Academy of Sciences. These institutional differences shape collaboration networks and reflect the broader organisation of national research systems.
European countries together also produce a large share of global EO publications, supported by the Copernicus program and long-term investment in satellite missions. At the same time, output is not equal across Europe. Western European countries are very active, while some parts of Southern and Eastern Europe contribute less. Europe profits from shared infrastructure at the continental level, but research capacity is mainly built at the national level. As a result, Europe shows high total productivity, but a more heterogeneous institutional structure compared with the United States or China. The results are also relevant for understanding integrative spatial planning concepts, such as Digital Twins, that are strongly dependent on EO data and associated analytical and computational infrastructures.
4. Conclusions
This study provides a spatially explicit overview of the long-term development of EO research from 1978 to 2024, with a focus on how technological change, research capacity and collaboration patterns shape contemporary environmental research. We examined publication trends, geographical patterns of scientific activity, thematic evolution, and international collaboration networks. The analysis used data from the Web of Science Core Collection, with bibliometric processing applied for data cleaning, disambiguation, keyword harmonisation, and network construction. The selected period allowed us to look both at the early decades of EO, focused on sensor development and calibration, and at the recent period shaped by open-data policies, the Sentinel missions, and cloud-based platforms.
Across the whole period, the number of EO-related publications increased strongly, with the largest acceleration after 2012. This pattern is linked to open-access missions, such as Landsat and Sentinel, better processing standards, and the wider use of platforms like Google Earth Engine. In the earlier years, Landsat and MODIS were the dominant missions in the literature, while Sentinel and newer missions, such as EnMAP, became more important in the past decade. These results address RQ1 and show that the main growth in EO publications follows major technological shifts, with Sentinel having a key role in the post-2014 period.
The geography of EO scientific production remains very unequal. The United States, China, and Western European countries provide most of the publications, while many regions with weaker institutional and infrastructural capacity are still underrepresented. This pattern supports RQ2 and indicates that global output is dominated by a small number of high-capacity research systems. National structures also matter in the USA, EO research is more decentralised and spread across many universities, agencies, and private actors; in China, growth is driven by strong, central institutions, such as those within the Chinese Academy of Sciences. Europe shows high total productivity through the Copernicus program, but there are clear differences between member states. These findings suggest that long-term investment strategies and governance models strongly influence research capacity, not only data access.
International collaboration networks expanded significantly after 2012. Earlier decades were characterised by smaller and more local research teams, while later years show more multi-institutional and multinational co-authorship. However, collaboration is not equally distributed. Countries with strong computational infrastructure and long research traditions are in the central positions of the networks, whereas lower-capacity regions appear more at the margins and often rely on cooperation with leading institutions. In this way, the results for RQ3 show that collaboration has grown, but structural inequalities in co-authorship patterns remain.
Thematic analysis confirms a clear shift in EO research topics. In the first period, many studies were focused on sensor properties, calibration, and basic image processing. Later, research moves towards machine learning, long time-series analysis, land-surface dynamics, and integrated environmental modelling. Keyword trajectories illustrate the rise of random forests, deep learning, LULC change analysis, flood mapping, and drought monitoring, especially after open data and cloud computing became widely available. These developments respond to RQ4 and show that methodological innovation is closely connected to research capacity: countries with stronger infrastructure adopt new methods faster, while others change more slowly.
Overall, the results show that the EO research landscape is shaped by the interaction of technological innovation, infrastructure, and the organisation of science. Open data have clearly expanded opportunities for participation, but they did not fully equalise research capacity. Long-established centres of EO expertise still gain the most from new sensors, open-access archives, and cloud platforms. As a result, EO knowledge production remains spatially concentrated, even if more countries than before are now involved. This has direct implications for the use of EO data in environmental monitoring, spatial planning and global change research, where uneven research capacity can translate into uneven knowledge production and decision support.
While this study does not aim to provide prescriptive policy recommendations and is limited to bibliometric evidence, the observed patterns suggest persistent disparities in research capacity between developed regions and countries of the Global South. Within this context, strengthening international collaboration and improving access to open satellite data, cloud-based processing platforms, and open-source tools may help support more balanced participation in Earth observation research.
These findings suggest that improving data availability is necessary but not sufficient for more balanced global participation. Long-term support for local research infrastructure, training programmes, mobility schemes and institutional development is also needed. Stronger integration of underrepresented regions into global research networks would help to reduce existing gaps. Without such measures, the rapid growth of satellite missions and open platforms may continue to reproduce current inequalities instead of reducing them.