Article

Forestland Resource Dynamics in Hollow Frontiers of Sub-Saharan Africa: Empirical Insights from the Mungo Corridor of Cameroon

by
Chick Emil Abam
1,2,
Jude Ndzifon Kimengsi
2,3,* and
Zephania Nji Fogwe
1
1
Department of Geography and Planning, Faculty of Arts, The University of Bamenda, Bambili P.O. Box 39, North West Region, Cameroon
2
Forest Institutions and International Development (FIID) Research Group, Chair of Tropical and International Forestry, Faculty of Environmental Sciences, Technische Universität Dresden, 01069 Dresden, Germany
3
Department of Geography, HTTC, The University of Bamenda, Bambili P.O. Box 39, North West Region, Cameroon
*
Author to whom correspondence should be addressed.
Earth 2025, 6(4), 140; https://doi.org/10.3390/earth6040140
Submission received: 28 August 2025 / Revised: 17 October 2025 / Accepted: 30 October 2025 / Published: 3 November 2025

Abstract

Natural resource-endowed landscapes in many parts of the Global South play a crucial role in the livelihoods of communities. Such resource-endowed areas attract current and prospective resource-use actors, making them veritable hollow frontiers. Hollow frontiers, as crucial resource attractions in many parts of sub-Saharan Africa (SSA), have attracted significant interest in scientific and policy circles. While studies have explored the patterns of migration and population change around hollow frontiers, there is limited evidence on the resource-use dynamics and trajectories in hollow frontiers. This study uses the case of the Mungo Corridor of Cameroon, a hollow frontier par excellence, to (1) determine the variations in forestland resource-use practices, and (2) analyze changes in forestland resource space in the corridor. Data for this study was collected through key informant interviews (n = 37), focus group discussions (n = 15), household surveys using a structured questionnaire (n = 250), and Landsat images. Geospatial analysis, descriptive statistics, and the chi-square statistical technique were employed in the analysis. The study revealed that forestland resource-use practices (NTFPs harvesting) witnessed a significant decline due to the intensification of extraction rates. Furthermore, forestland witnessed a significant decline in Njombe-Penja and Loum (35.216% and 48.176%, respectively) between 1984 and 2024. The results provide novel insights on the pattern of resource use around hollow frontiers and further informs land management policy in the context of the regulation of land-based resources in the hollow frontiers of Cameroon and similar sub-Saharan African contexts. Future studies should explore forestland resource regeneration strategies in the Mungo Corridor.

1. Introduction

Forestlands, areas which were or are covered by forests, have witnessed dramatic transformation in SSA [1]. The area of land covered by natural forests, or by woodlands classified as forests, in sub-Saharan Africa (SSA) declined by nearly 10 percent between 2000 and 2010 [2,3]. Three-quarters of this decline was caused by forest conversion for agriculture, largely due to growing domestic food demands [4]. The increase in food demand is due to the combined effects of population growth, which is considerably more rapid in SSA than in other regions of the world, as well as the changing consumption patterns in many countries in SSA [3].
In Cameroon, forest degradation rates have increased between 2000 and 2005 [5]. Demographic pressure has transformed initial forestlands into agrarian lands, coupled with intense fuel wood activities [5,6,7,8]. The Mungo Corridor is an agricultural hub in Cameroon that grows different types of crops including plantation crops, commercial fruit crops, and subsistence crops. The expansion of croplands in this Corridor appears to affect other land uses including forestland, which has witnessed a rapid decline [8,9].
Hollow frontiers attract different typologies of actors, including natural resource exploiters [10,11,12], further explained by the fact that such areas are characterized by available land areas which possess rich soils and other economic opportunities. According to [13], the Mungo Corridor, a hollow frontier par excellence, has attracted a diversity of exogenous and endogenous actors including forest resource-dependent populations. Moreover, [13] revealed that very little research has been carried out on the space–time dynamics of this hollow frontier (the Mungo Corridor) despite its diverse economic activities. While there is evidence on population growth, migration, and land resource utilization around the Mungo Corridor [9,13], very limited evidence exists on the forestland resource-use dynamics and its trajectories in and around hollow frontiers. Using the case of the Mungo Corridor of Cameroon, this study (1) investigates the variations in forestland resource-use practices and (2) analyzes changes in forestland resource space. The results reveal novel insights on the pattern of resource use around hollow frontiers while informing land management policy around the hollow frontiers of Cameroon.
This study adopts the hollow frontier concept. Hollow frontiers denote areas of resource abundance that serve as attractive pools which have attracted several groups with socio-economic interest in these resources [13,14]. According to [14], some resource frontiers sustain successful resource-based development, while others collapse under social and ecological pressures. Figure 1 presents the theoretical framework of forest resource dynamics in hollow frontiers.

2. Study Area and Method

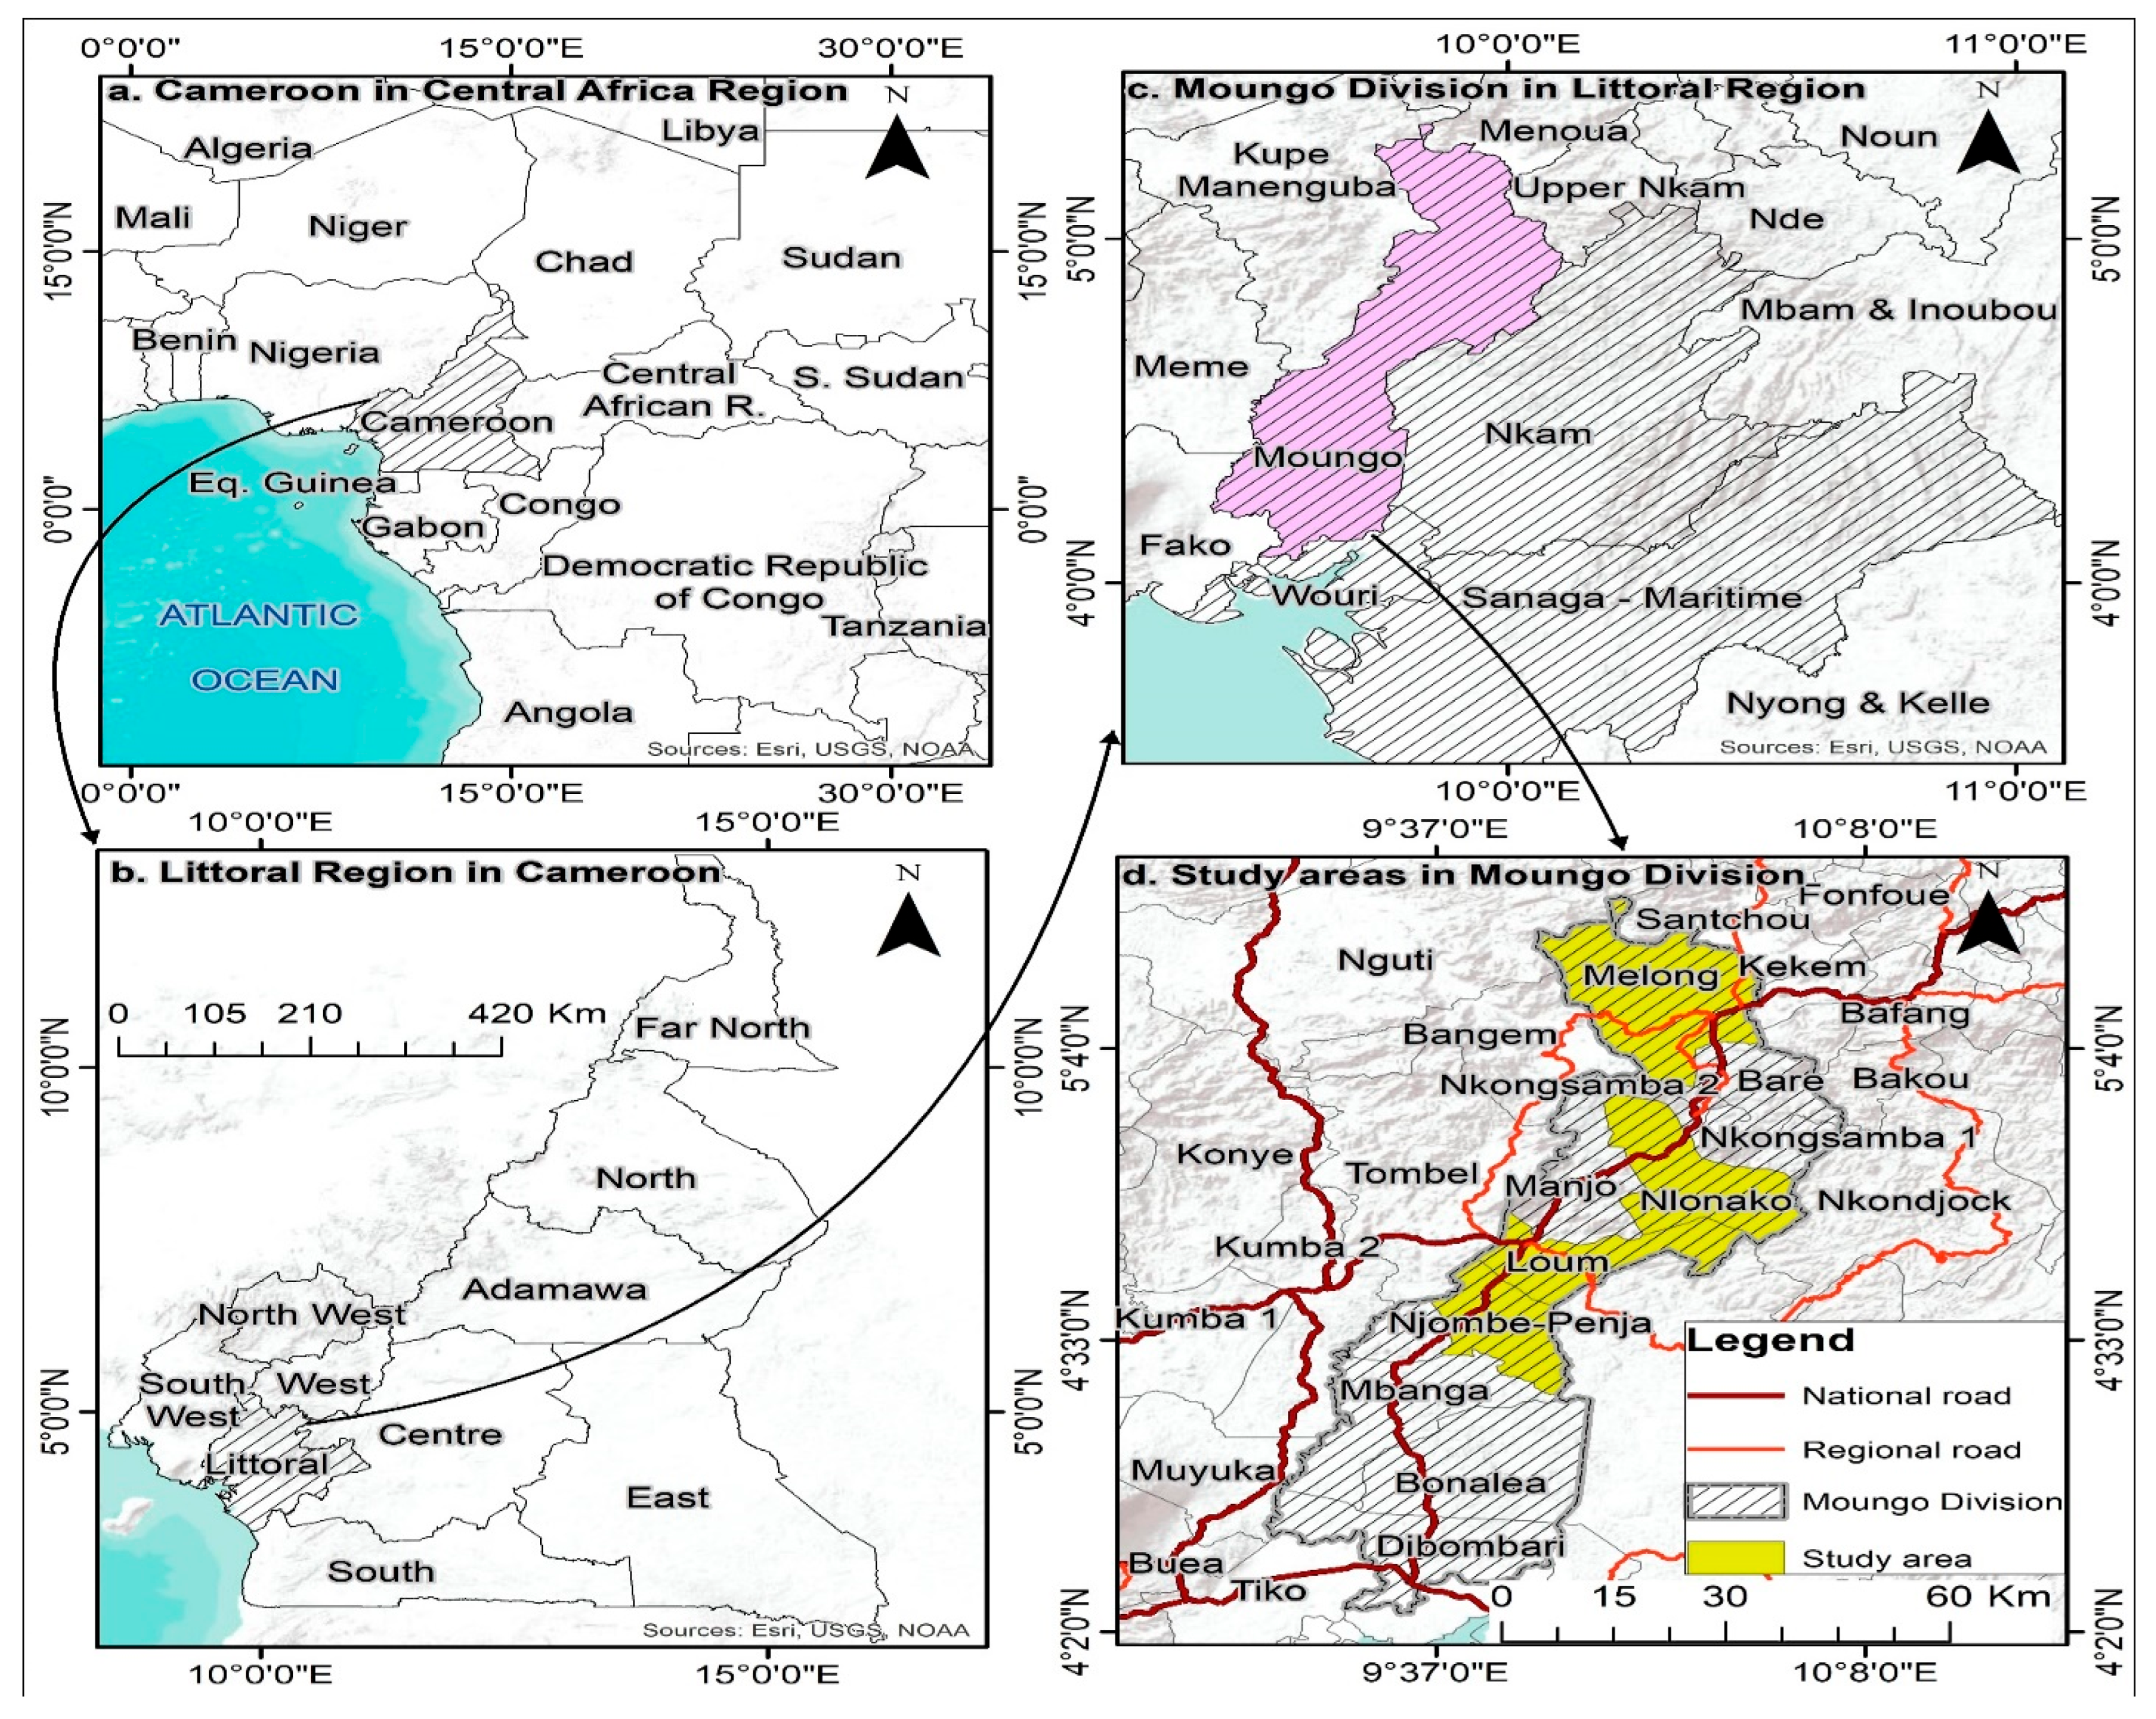
The Mungo landscape is located in the Mungo Division of the Littoral region of Cameroon (Figure 2). The Division covers an area of about 3723 km2 and it is made up of 13 municipalities, namely, Baré-Bakem, Bonalea, Dibombari, Melong, Nlonako, Loum, Manjo, Mbanga, Mélong, Mombo, Njombé-Penja, Nkongsamba I, Nkongsamba II, Nkongsamba III, and Eboné. This Corridor is suitable for this study because of its rich ecological background. It is endowed with forestlands which include the Bakaka forest reserve, the Melong forest reserve, and ancestral forest. These forestlands, through agricultural intensification, have witnessed significant dynamic changes. To facilitate data collection, four subdivisions were purposively selected to include Melong, Nlonako, Loum, and Njombe-Penja. These subdivisions were selected based on the concentration of forestland resources and their diversity.

Data Collection

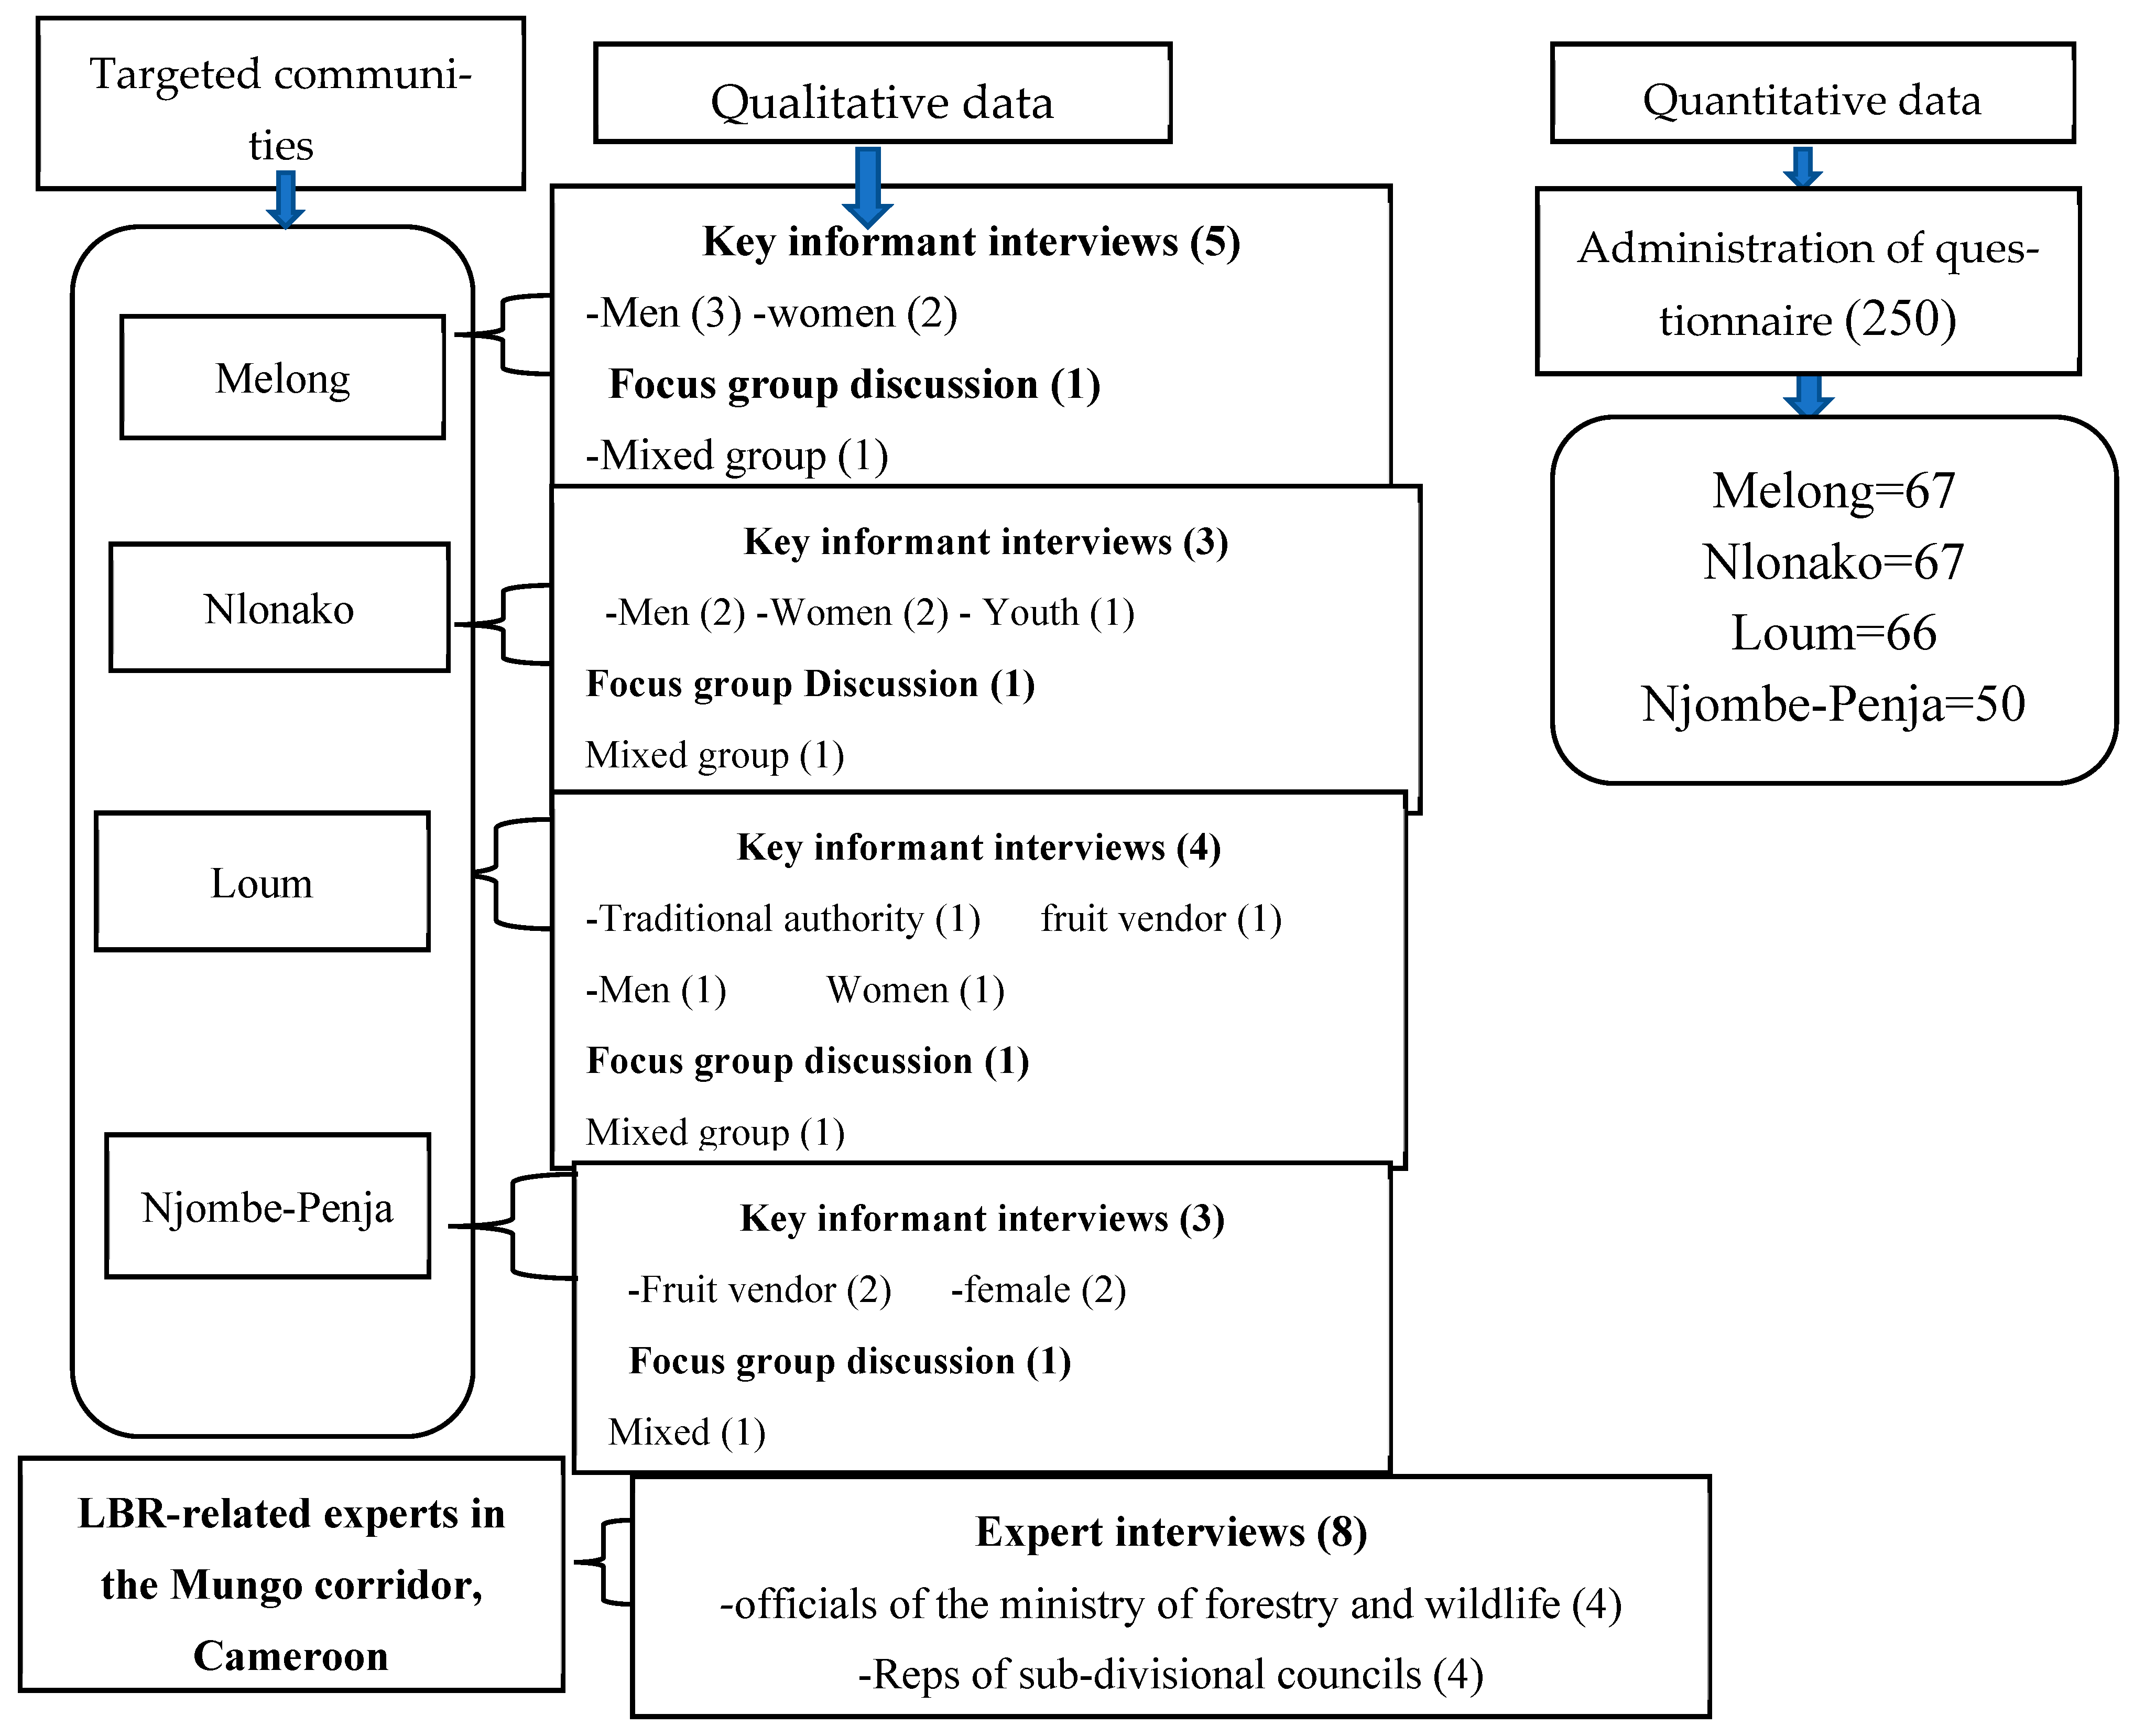
This study employed a mixed-methods approach which involves both qualitative and quantitative data collection and analysis. Data for this study were collected through key informant interviews (n = 15), expert interviews (n = 8), focus group discussions (n = 4), and household surveys using a structured questionnaire (n = 250). The key informant interviews (KIIs) consisted of six questions on the variations in forestland resource-use practices in the Mungo corridor and changes in forestland resource space. The questionnaire was designed based on the research objectives which formed subthemes under which questions were structured. The validity of the questionnaire was confirmed after it was reviewed and tested by the researchers. It became reliable for data collection after a pilot test was conducted in a neighboring community—Santchou. Questionnaires (250) were distributed through a random sampling approach in the communities of Melong, Nlonako, Loum, and Njombe-Penja in English and French. A field assistant was employed to facilitate translation and discussions in French. Houses in the targeted communities were counted and documented on pieces of paper with each number representing a household. These papers were twisted and thrown on the floor for the selection of 250 random numbers, after which, targeted households were randomly selected. The entire data collection period ran from July to September 2024. Respondents took between 25 and 35 min to respond to each questionnaire. Out of the 250 questionnaires administered, 67 questionnaires were administered in Melong, 67 in Nlonako, 66 in Loum, and 50 in Njombe-Penja, based on population distribution (Figure 3).
Data obtained from key informant interviews include the identification of NTFPs, perceptions on the quantity of NTFPs extracted between 2010 and 2015 and 2016 and 2024. This paved the way for FGDs, which had six questions with emphasis on the types of NTFPs collected in the Mungo corridor. Four focus group discussions were carried out in the four communities (one per community). Participants were carefully selected based on their knowledge and engagement in forest resource-use practices. The FGDs involved between 4 and 11 participants and most of the discussions lasted between 45 and 65 min. Focus groups were organized based on the willingness and in-depth knowledge of participants with regards to forest resource-use practices over time. A tape recorder was used to record the responses obtained during KIIs and FGDs. Prior to data collection, verbal consent was sought from the participants. Qualitative data were collected to compliment quantitative data by generating detailed information that provided further evidence on the variations in forestland resource-use practices. The qualitative evidence was treated and analyzed using directed content analysis. This was then presented as narratives and used to corroborate the descriptive and spatial analysis reported in the results.
Cartographic information was an essential tool for this study. Thematic maps for the study following standard cartographic methods and base maps from the National Institute of Cartography (NIC), Yaoundé, Cameroon, were used. Using administrative limits base maps of Cameroon, the location map of the study was designed in ArcGIS (10.5). To ensure that several images for the study composites were obtained from each study site, 16-day Landsat images for the selected time periods of 1984, 2003, 2010, 2016, and 2024 were used. To reduce the effect of cloud cover in the humid region, we filtered to include only the months of December, January, and February for each year from 1984 to 2024, meaning that the actual acquisition windows span two calendar years for each seasonal composite. Cloud cover ratio was set at 20% to capture only high-quality images. These images were processed in Google Earth Engine and downloaded for further processing in ArcGIS. Further analysis was performed regarding the yearly composites in ArcGIS via pixel-based supervised image classification techniques which included the use of maximum likelihood classification to create forestland-cover/use-change matrices for the selected years. The advantage of the pixel approach is that information is obtained at a more precise spatial level (the scale of a pixel). Expert knowledge was used, high-resolution Google earth images and field work to validate the forestland-cover-change maps. Forestland-cover maps were developed for each studied timescale and the corresponding change statistics, including forest-cover-change detection (1984 to 2024) (after extracting individual land-cover classes per study site via pixel-wise supervised image classification in ArcGIS, land cover for each year was extracted across the time period and used to calculate the change statistics and loss ratio). Accuracy assessment was established, ranging between 86.3% (1984) and 95.7% (2024). The period of 1984 was chosen as the base year to examine the state of the forestland before the Cameroon Forestry Law was enacted in 1994.
The data obtained was analyzed using two methods. Quantitative data was analyzed descriptively through the chi-square analytic test, whereas qualitative data was analyzed using a content analysis and presented in the form of narratives. The chi-square test was employed to comparatively analyze variations in forest resource-use practices. In addition, mapping information on the dynamics of forestland resources was presented for the periods 1984 to 2003, 2003 to 2010, 2010 to 2016, and 2016 to 2024. This was based on data availability for spatial analysis for the different periods. The choice of 1984 as the base year was intended to examine the state of the forestland cover before the Cameroon forestry law was enacted. In addition, the choice to investigate forest resource extraction between 2010 and 2015, and between 2016 and 2024, was motivated to examine the extraction of forest resources before the Anglophone crisis (2010 to 2015) and during the Anglophone crisis (2016 to 2024) which displaced many Anglophones into the Mungo Corridor who engaged in forest resource extraction for survival.

3. Results

Typology and Distribution of Non-Timber Forest Products (NTFPs) in the Mungo Corridor

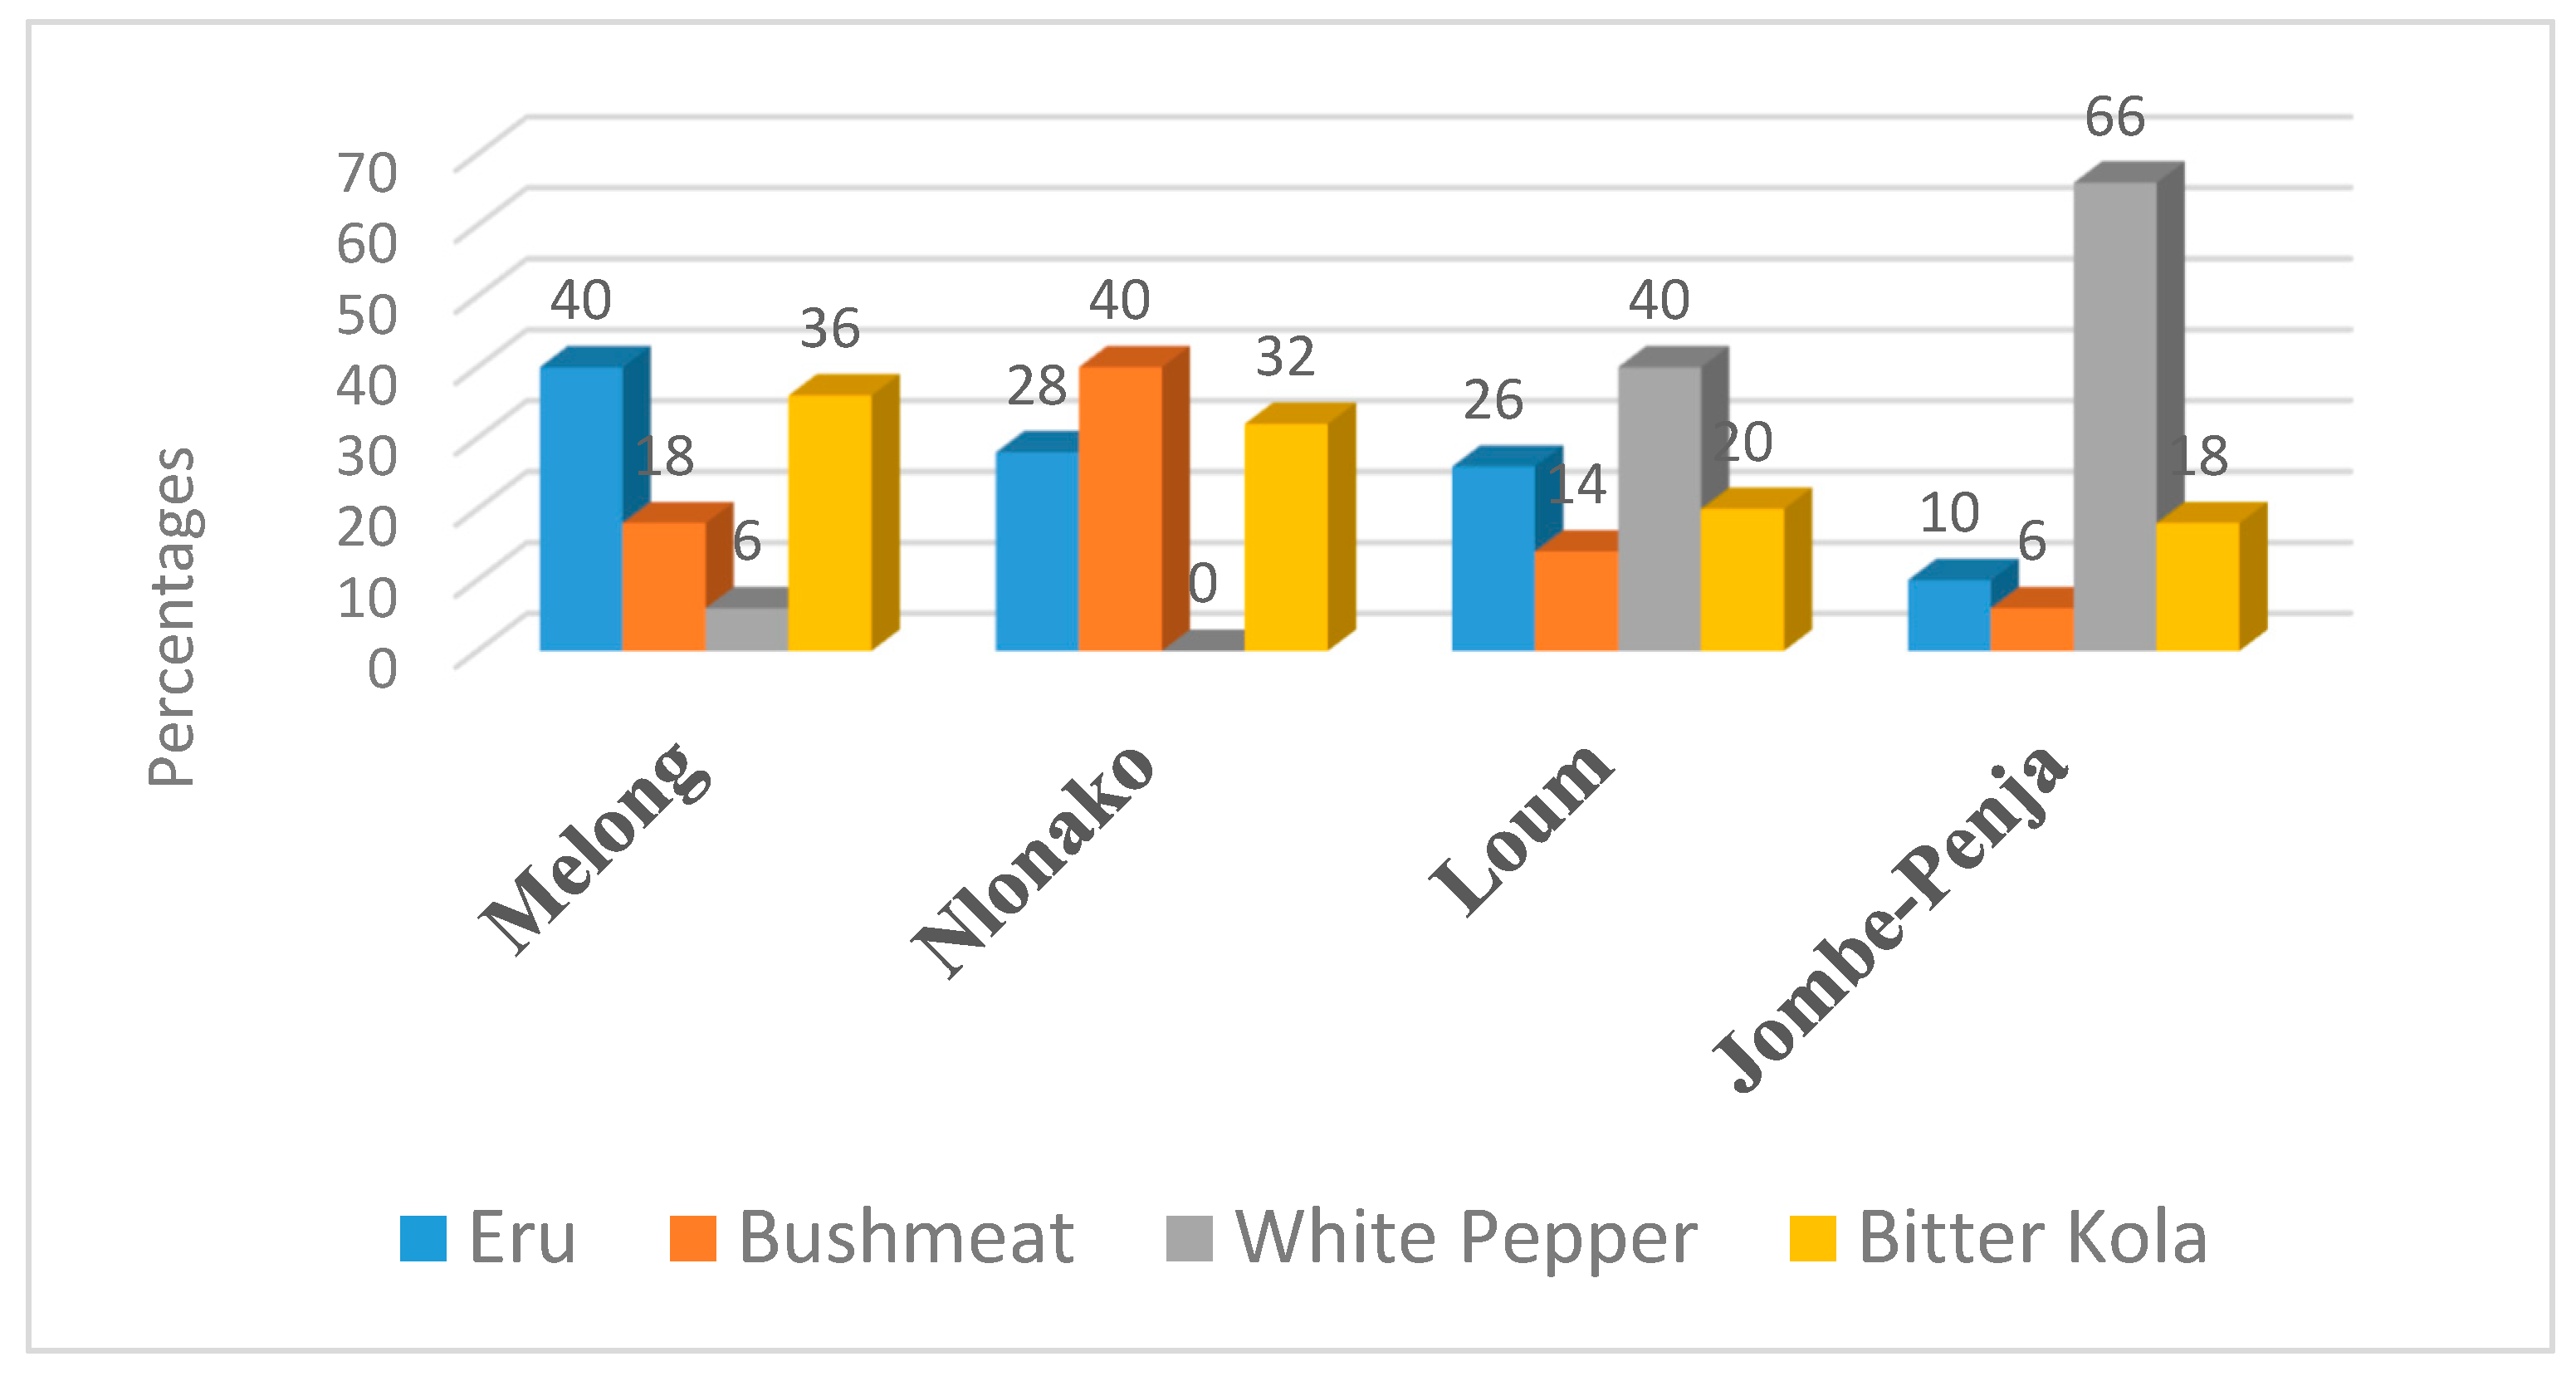
The Mungo corridor is endowed with different types of NTFPs which exhibit variations across communities (Figure 4).
Figure 4 shows that NTFPs in the Mungo Corridor include eru, bushmeat, white-pepper, and bitter-kola. These NTFPs significantly vary in their distribution. In Njombe-Penja and Loum (66% and 40%, respectively), white-pepper is the dominant NTFP. In this axis of the Corridor, white-pepper is reportedly domesticated on vast lands. A female key informant in Njombe-Penja (KII 14) noted that
“White-pepper is the dominant NTFPs here in Njombe-Penja. White-pepper is dominant because it has become the most domesticated NTFPs by the local population and private companies to include Plantation du Haute Penja (PHP)”.
In Loum, it was reported by a focus group participant (FGD4) that
“Individuals have domesticated white-pepper estimated on two hectares of land. PHP has domesticated white-pepper on very large-scale banana plantation. The increase in the price of white-pepper has intensified the domestication of white-pepper, making it the most dominant NTFPs here in Loum”.
In support of these statements, white-pepper was observed to be cultivated on a large scale by PHP. In addition, eru (40%) and bitter-kola (36%) are dominant NTFPs in Melong. A male key informant in Melong (KII 02) reported that
“Eru is domesticated, though by a few. Eru used to be regarded just as every other NTFPs to include bushmeat which was only extracted from the forest. But, due to an increase in the demand and price of eru, and also the decrease in its availability due to forest cover, triggers the domestication of eru beside bitter-kola”.
In Nlonako, the dominant NTFPs include bushmeat (40%) and bitter-kola (32%). A male key informant interview in Nlonako (KII 05) noted that
“The dominant forest resource that here is bushmeat. There are occasions that I will go into the forest without the intention of hunting bushmeat, my dogs will hunt and kill more than four to five animals to include snakes, rat moles, porcupine, antelope, grass cutter, and giant frogs, without my intervention”.
The quantity of NTFPs extracted between 2010 and 2015, and 2016 and 2024 are presented in Table 1 below.
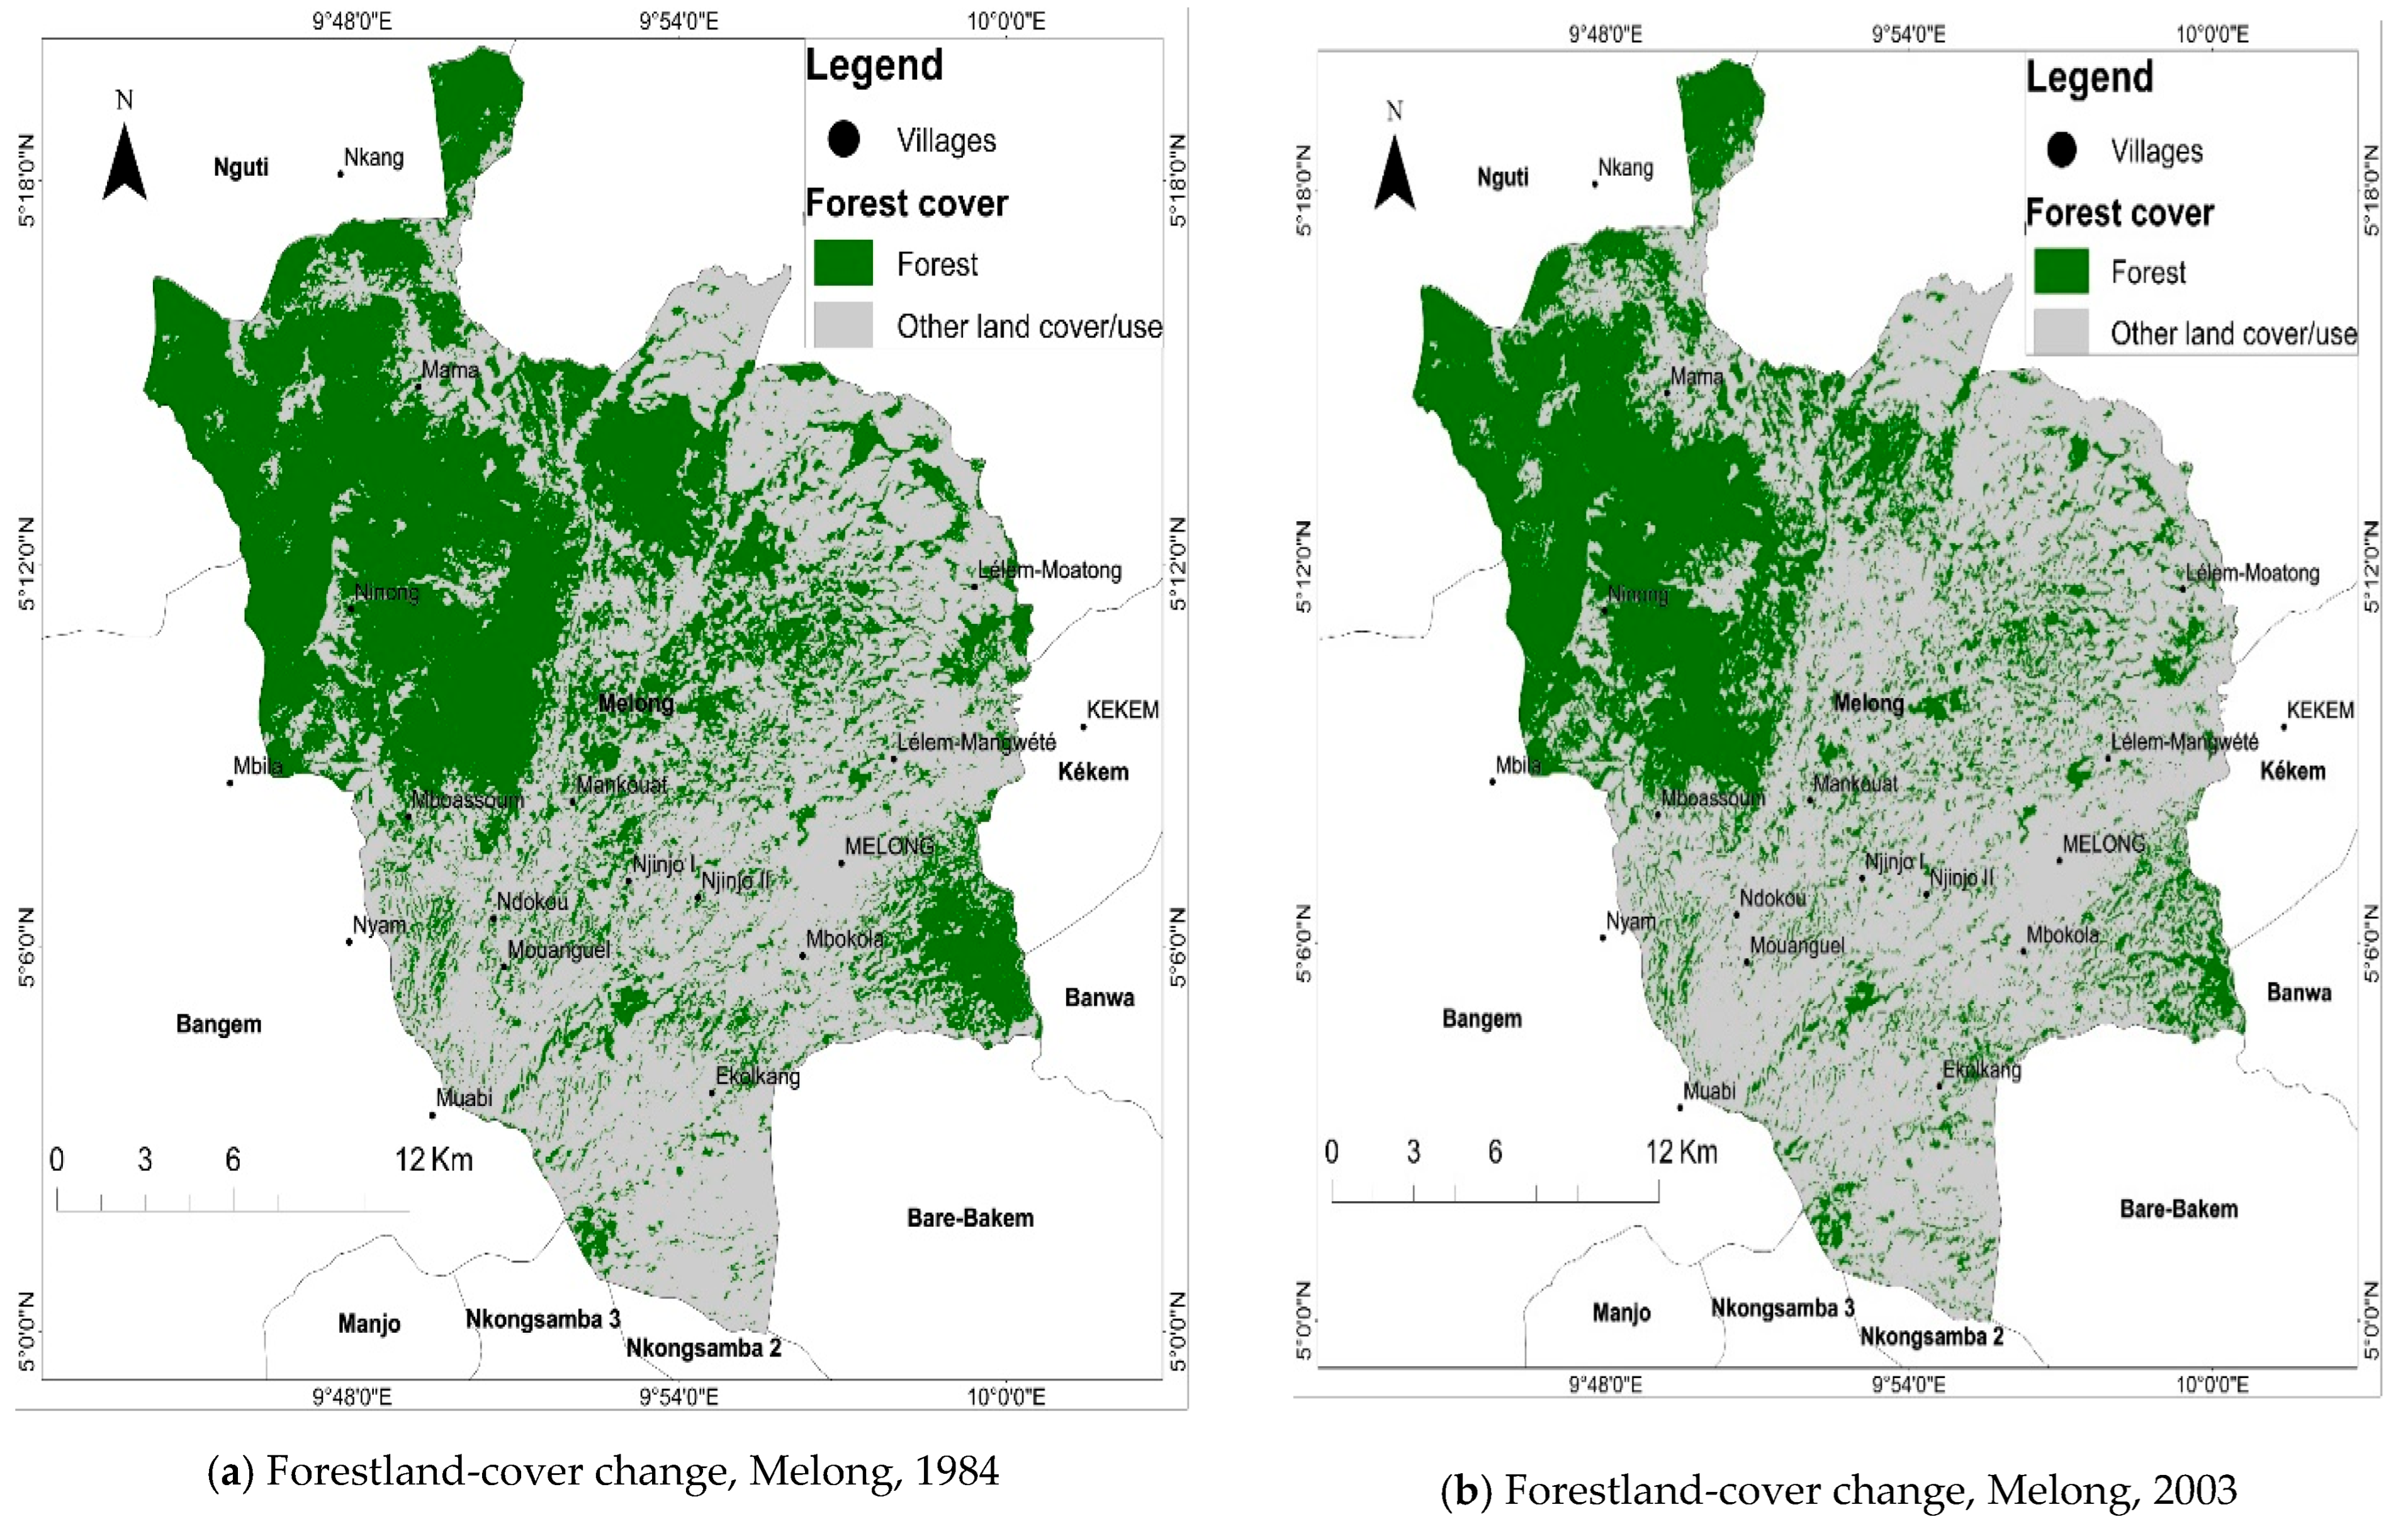
Table 1 shows that, between 2010 and 2015, the quantity of NTFPs extracted was higher than the quantity of NTFPs extracted between 2016 and 2024. In Melong, 68.5% of the population reported that NTFPs were extracted in 10 bags and above between 2010 and 2015. Whereas, from 2016 to 2024, only 1.5% of the population reported the extraction of NTFPs in 10+ bags. This indicates a significant difference of 67% in those who extracted 10 or more bags of NTFPs between 2010 and 2015, and between 2016 and 2024. Furthermore, 31.4% of the population in Melong reported that, between 2010 and 2015, NTFPs were extracted in 7 to 9 bags, indicating a less significant difference of 3% change in the quantity of NTFPs extracted in 7–9 bags between 2010 and 2015, and 2016 and 2024. In Nlonako, 76.1% of the population reported that NTFPs were extracted in more than 10 bags from 2010 to 2015, whereas only 34.6% of the population reported the extraction of NTFPs in 10 bags and above, signifying a 41.5% difference between those who extracted 10 bags and above between 2010 and 2015, and between 2016 and 2024. Further observation showed that a significant difference of 61.05% change exists in Loum between those who extracted more than 10 bags of NTFPs between 2010 and 2015, and between 2016 and 2024, indicating a higher extraction rate between 2010 and 2015. In addition, a 63.08% change is witnessed in Loum, indicating a significant extraction of NTFPs in 7–9 bags between 2016 and 2024. In Njombe-Penja, a 63.6365% change is observed in the extraction of NTFPs between 2010 and 2015, and between 2016 and 2024, indicating an increase in the extraction of NTFPs in 7–9 bags in 2016 to 2024. Changes in the extraction rate of NTFPs are driven by changes in the forestland cover over time. Figure 5 shows changes in forestland cover in the Mungo corridor from 1984 to 2024.
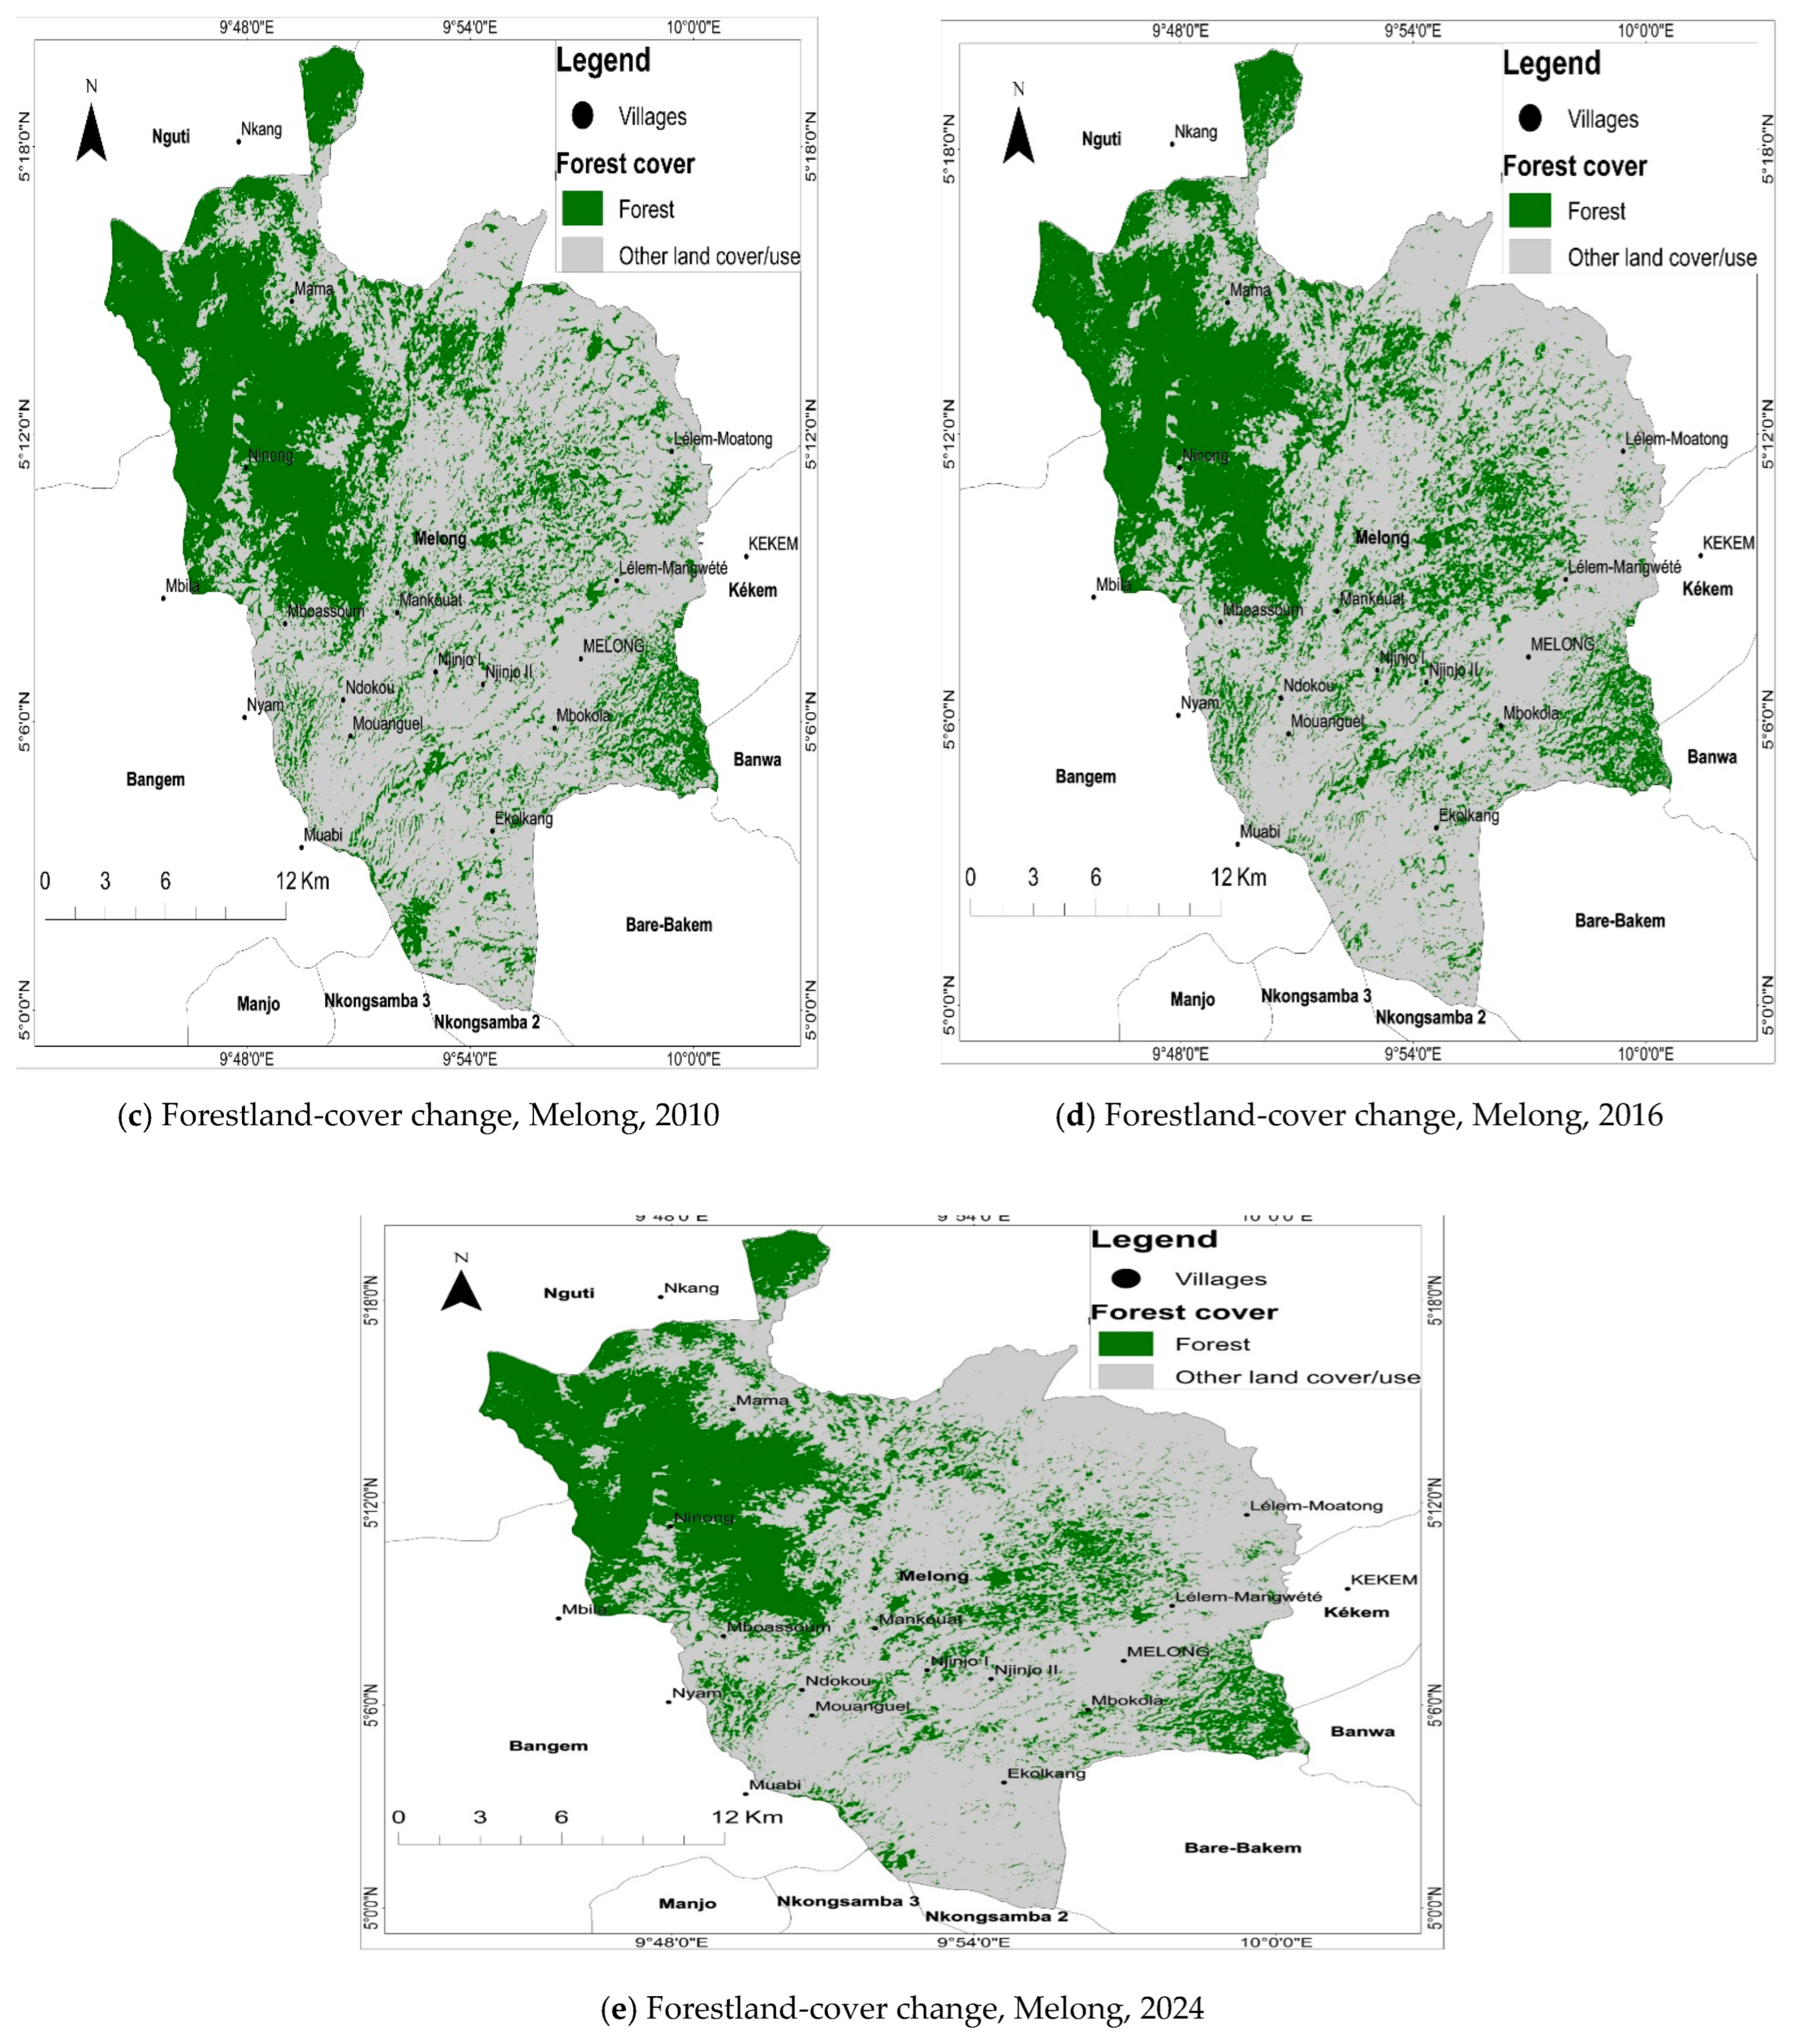
Based on Figure 5, forestland cover witnessed a significant change from 1984 to 2024 in Melong. Table 2 presents changes in the forestland cover for Melong.
From Table 2, the forestland cover for Melong from 1984 to 2024 witnessed a decline of 807.527 ha, indicating a percentage change of 69.69%. Between 1984 and 2003, the forestland cover for Melong witnessed a significant decline of 568.136 ha in favor of other land uses such as cropland and the built-up area. Between 2003 and 2010, forestland cover witnessed an increase of 21.258 ha. This recorded increase within the period right up to 2014 was attributed to the activities of Service de l’envrionment et de Regeneration de Forets (SEREF) (an NGO), which engaged in tree planting activities in the Melong forest reserve. In 2016, the forestland cover for Melong witnessed a 174.662 ha decline. This decline was attributed to the intensification of agricultural practices around the Melong forest reserve. The intensification was marked by financial conflicts that erupted between SEREF and the local council. The local council had an agreement to pay SEREF for the tree planting activity. However, the failure by the local council to keep to this agreement led to conflicts that exposed the reserve to agrarian activities. From 2016 to 2024, the forestland cover for Melong continued to witness a decline which amounted to the loss of 85.987 ha to other land uses in Melong. Figure 6 presents changes in the forestland cover for Nlonako.
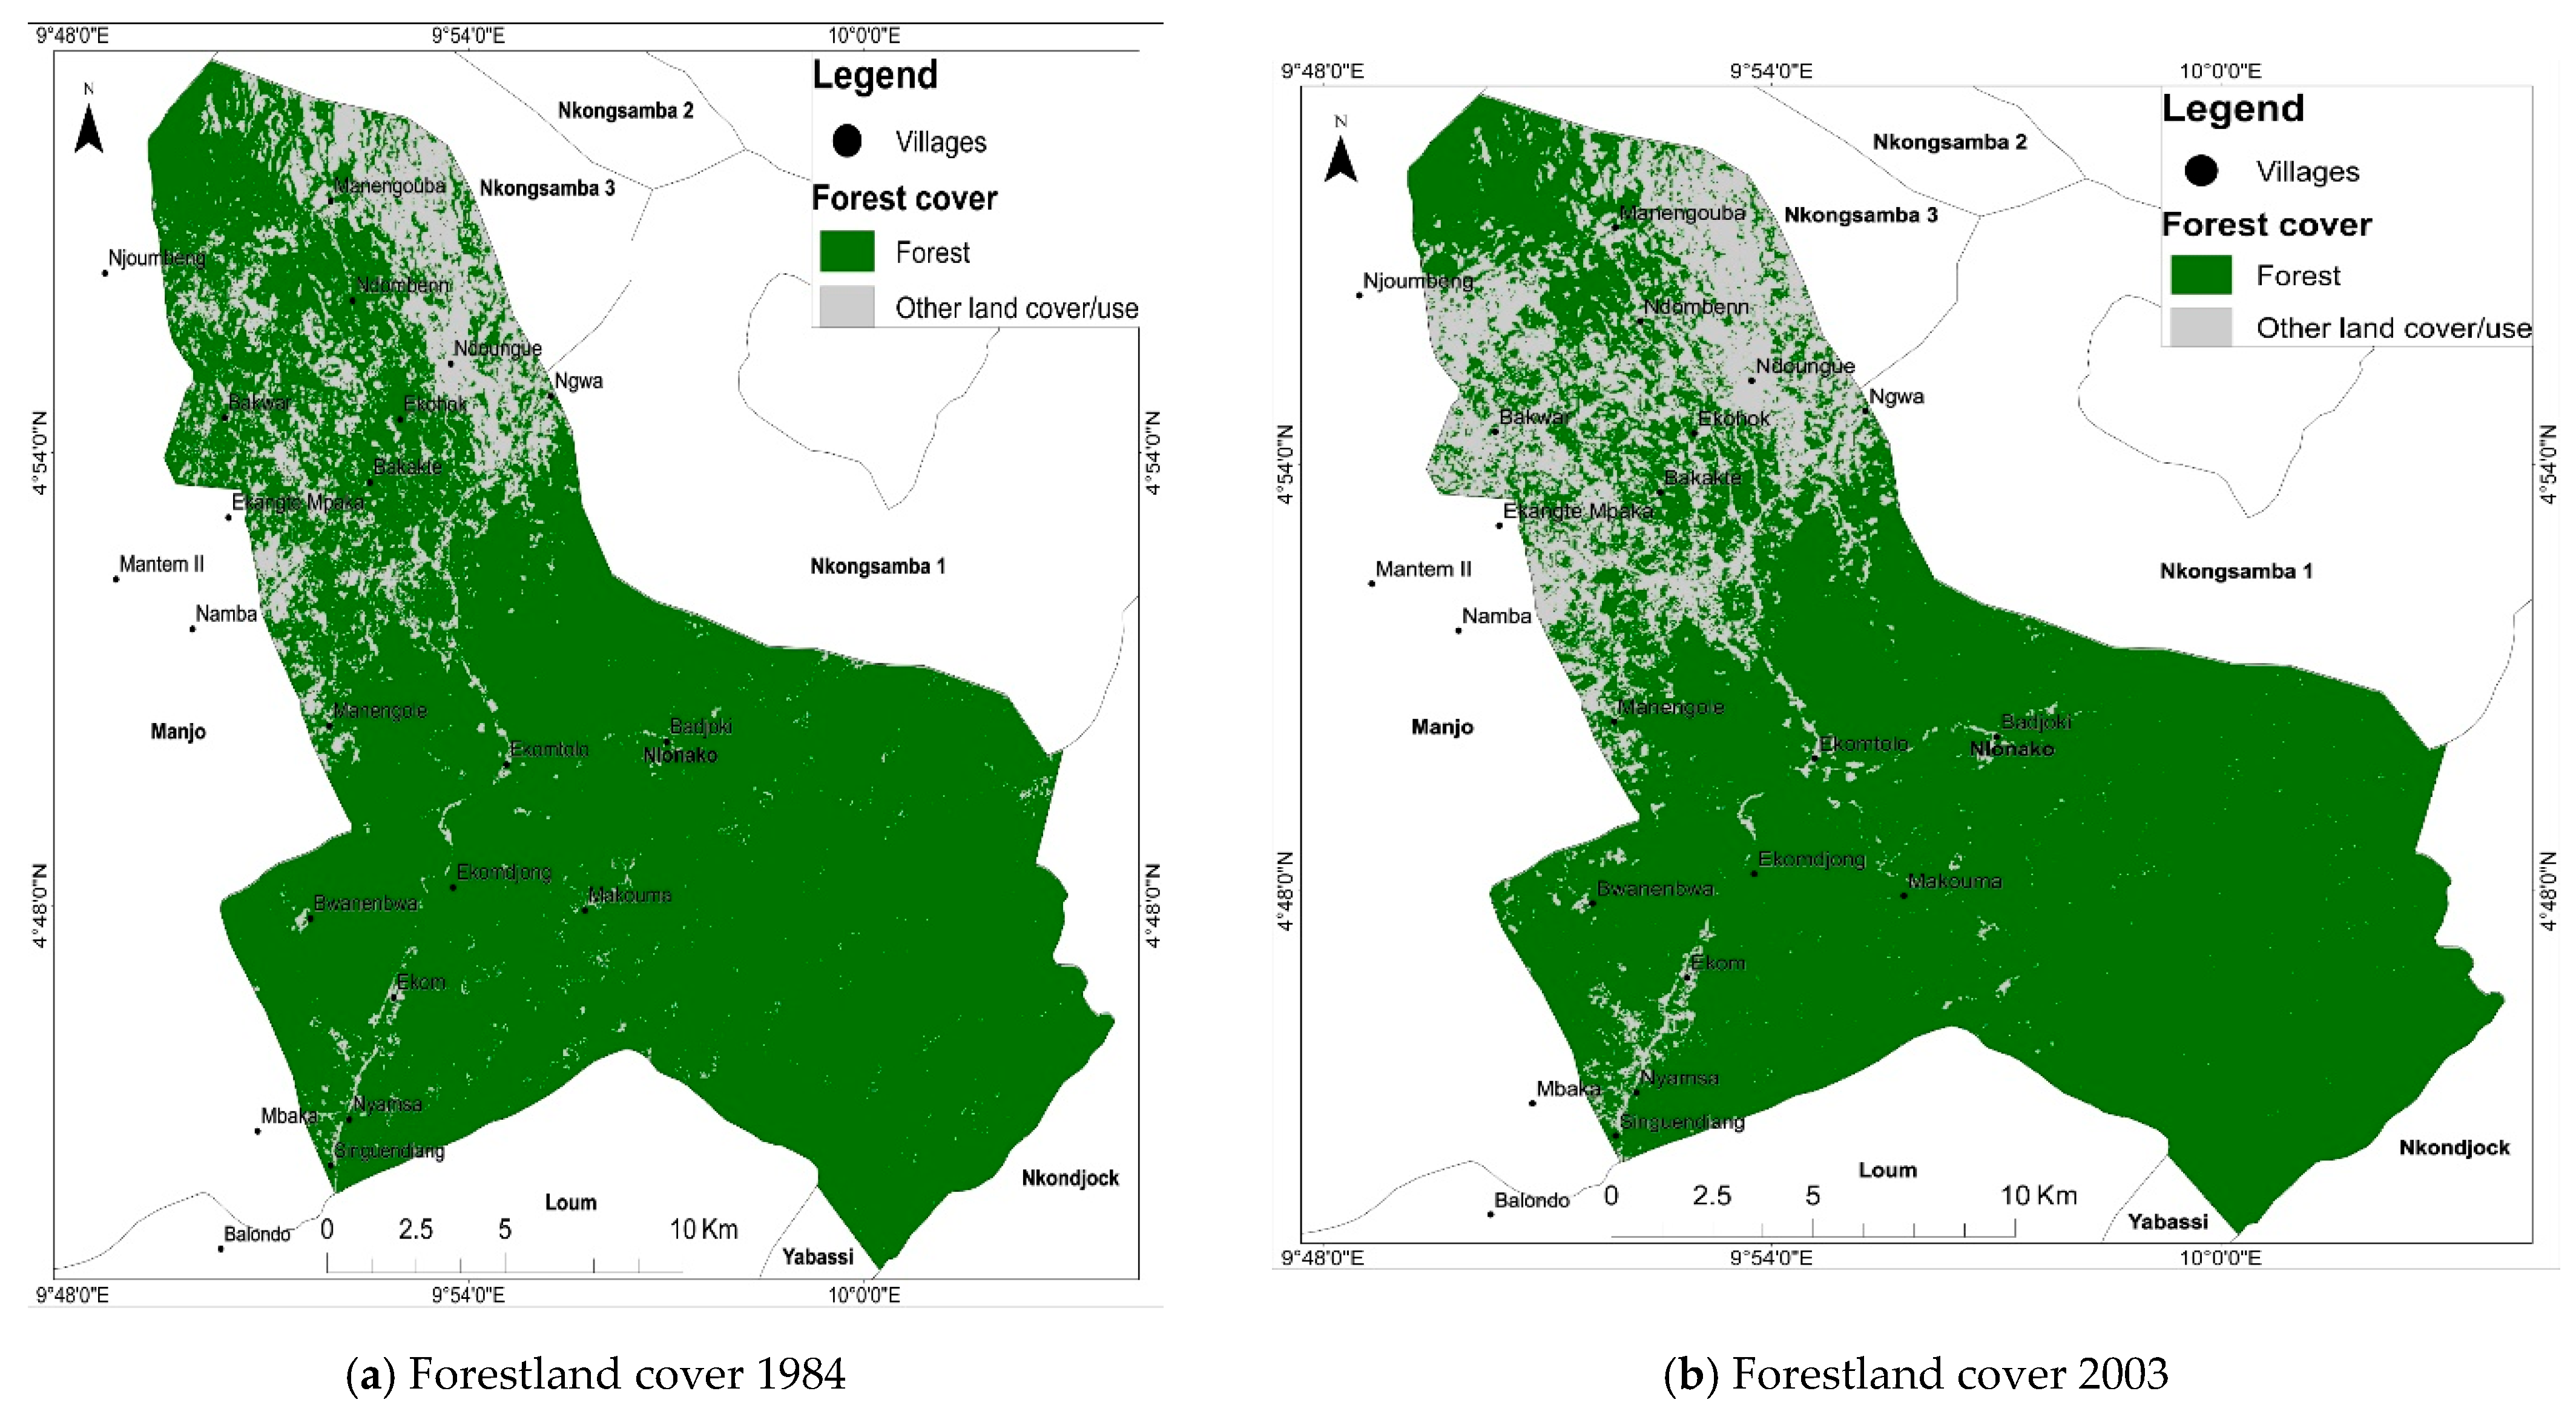
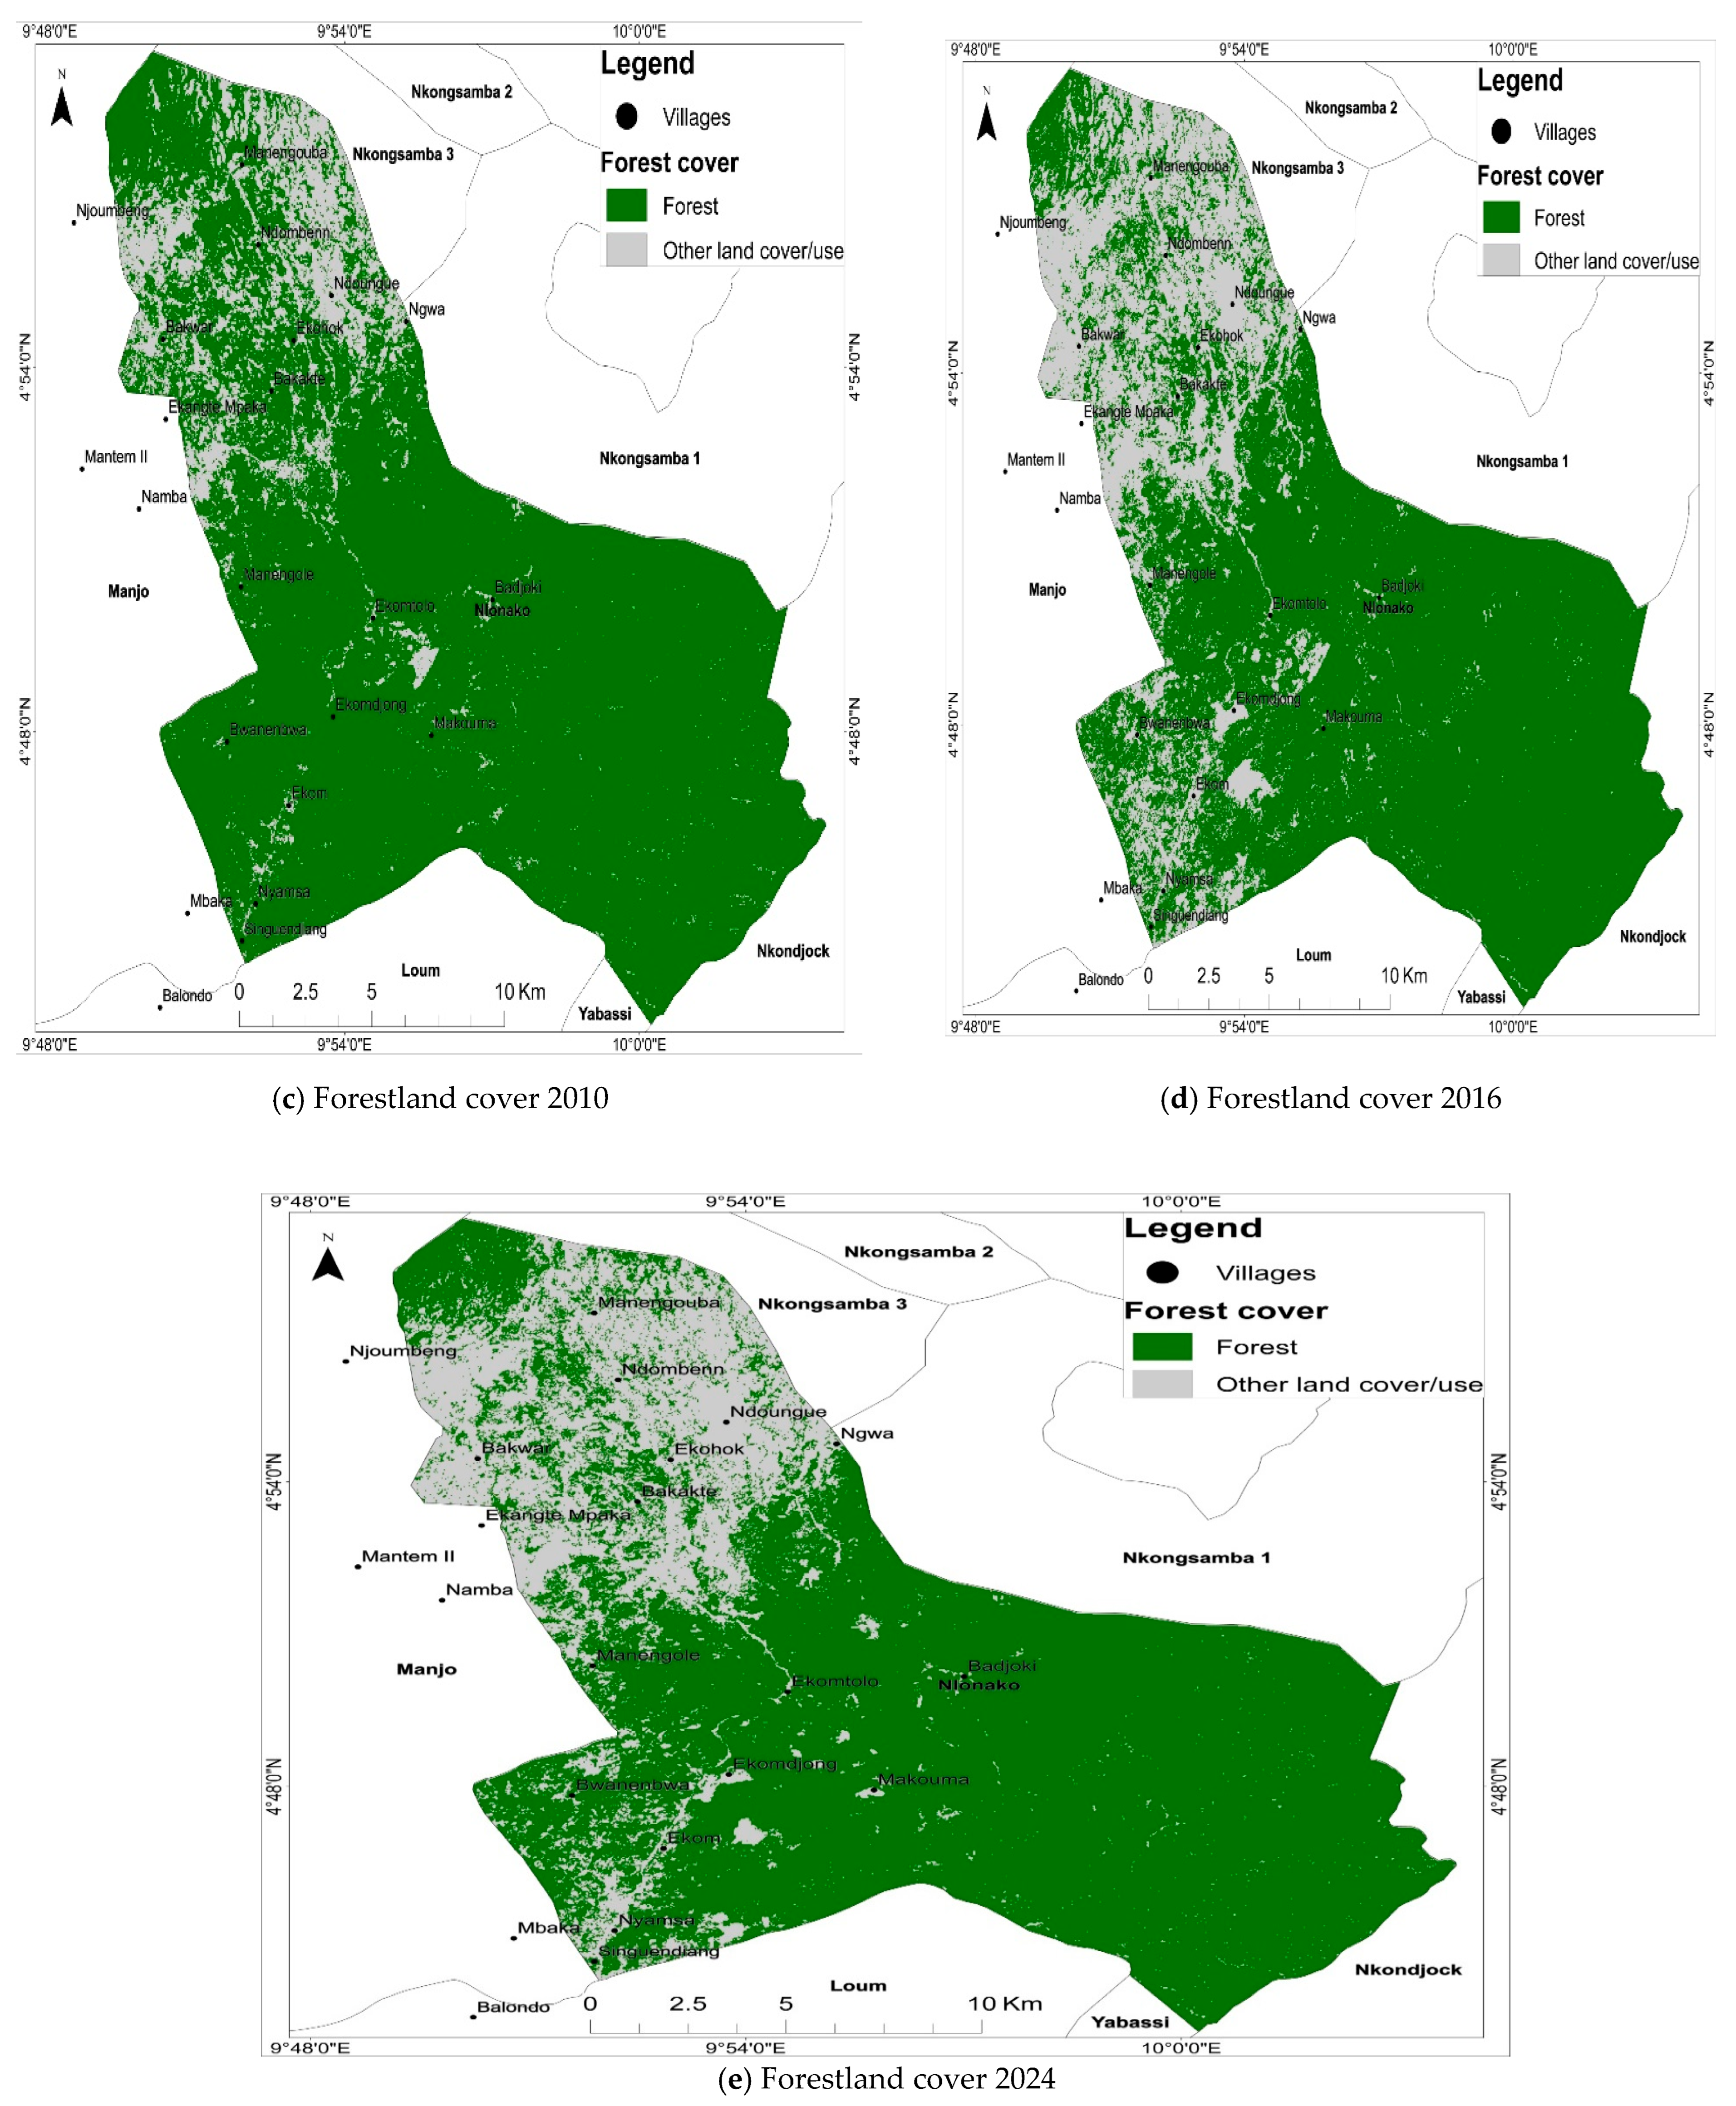
From Figure 6, forestland cover for Nlonako witnessed less significant changes between 1984 and 2024. Table 3 presents the calculated changes in forestland cover for Nlonako.
From Table 3, it can be observed that forestland cover for Nlonako witnessed a reduction of 472.461 ha, indicating a percentage change of 86.39% between 1984 and 2024. Between 1984 and 2003, the forestland cover witnessed a significant decline of 216.96 ha in favor of other land uses. In addition, between 2010 and 2016, the forestland cover recorded a decline of 369.954 ha.
Conversely, between 2003 and 2010, forestland cover witnessed an increase of 38.979 ha. Also, between 2016 and 2024, forestland cover witnessed a less significant increase of 75.474 ha. Figure 7 presents changes in the forestland cover for Loum.
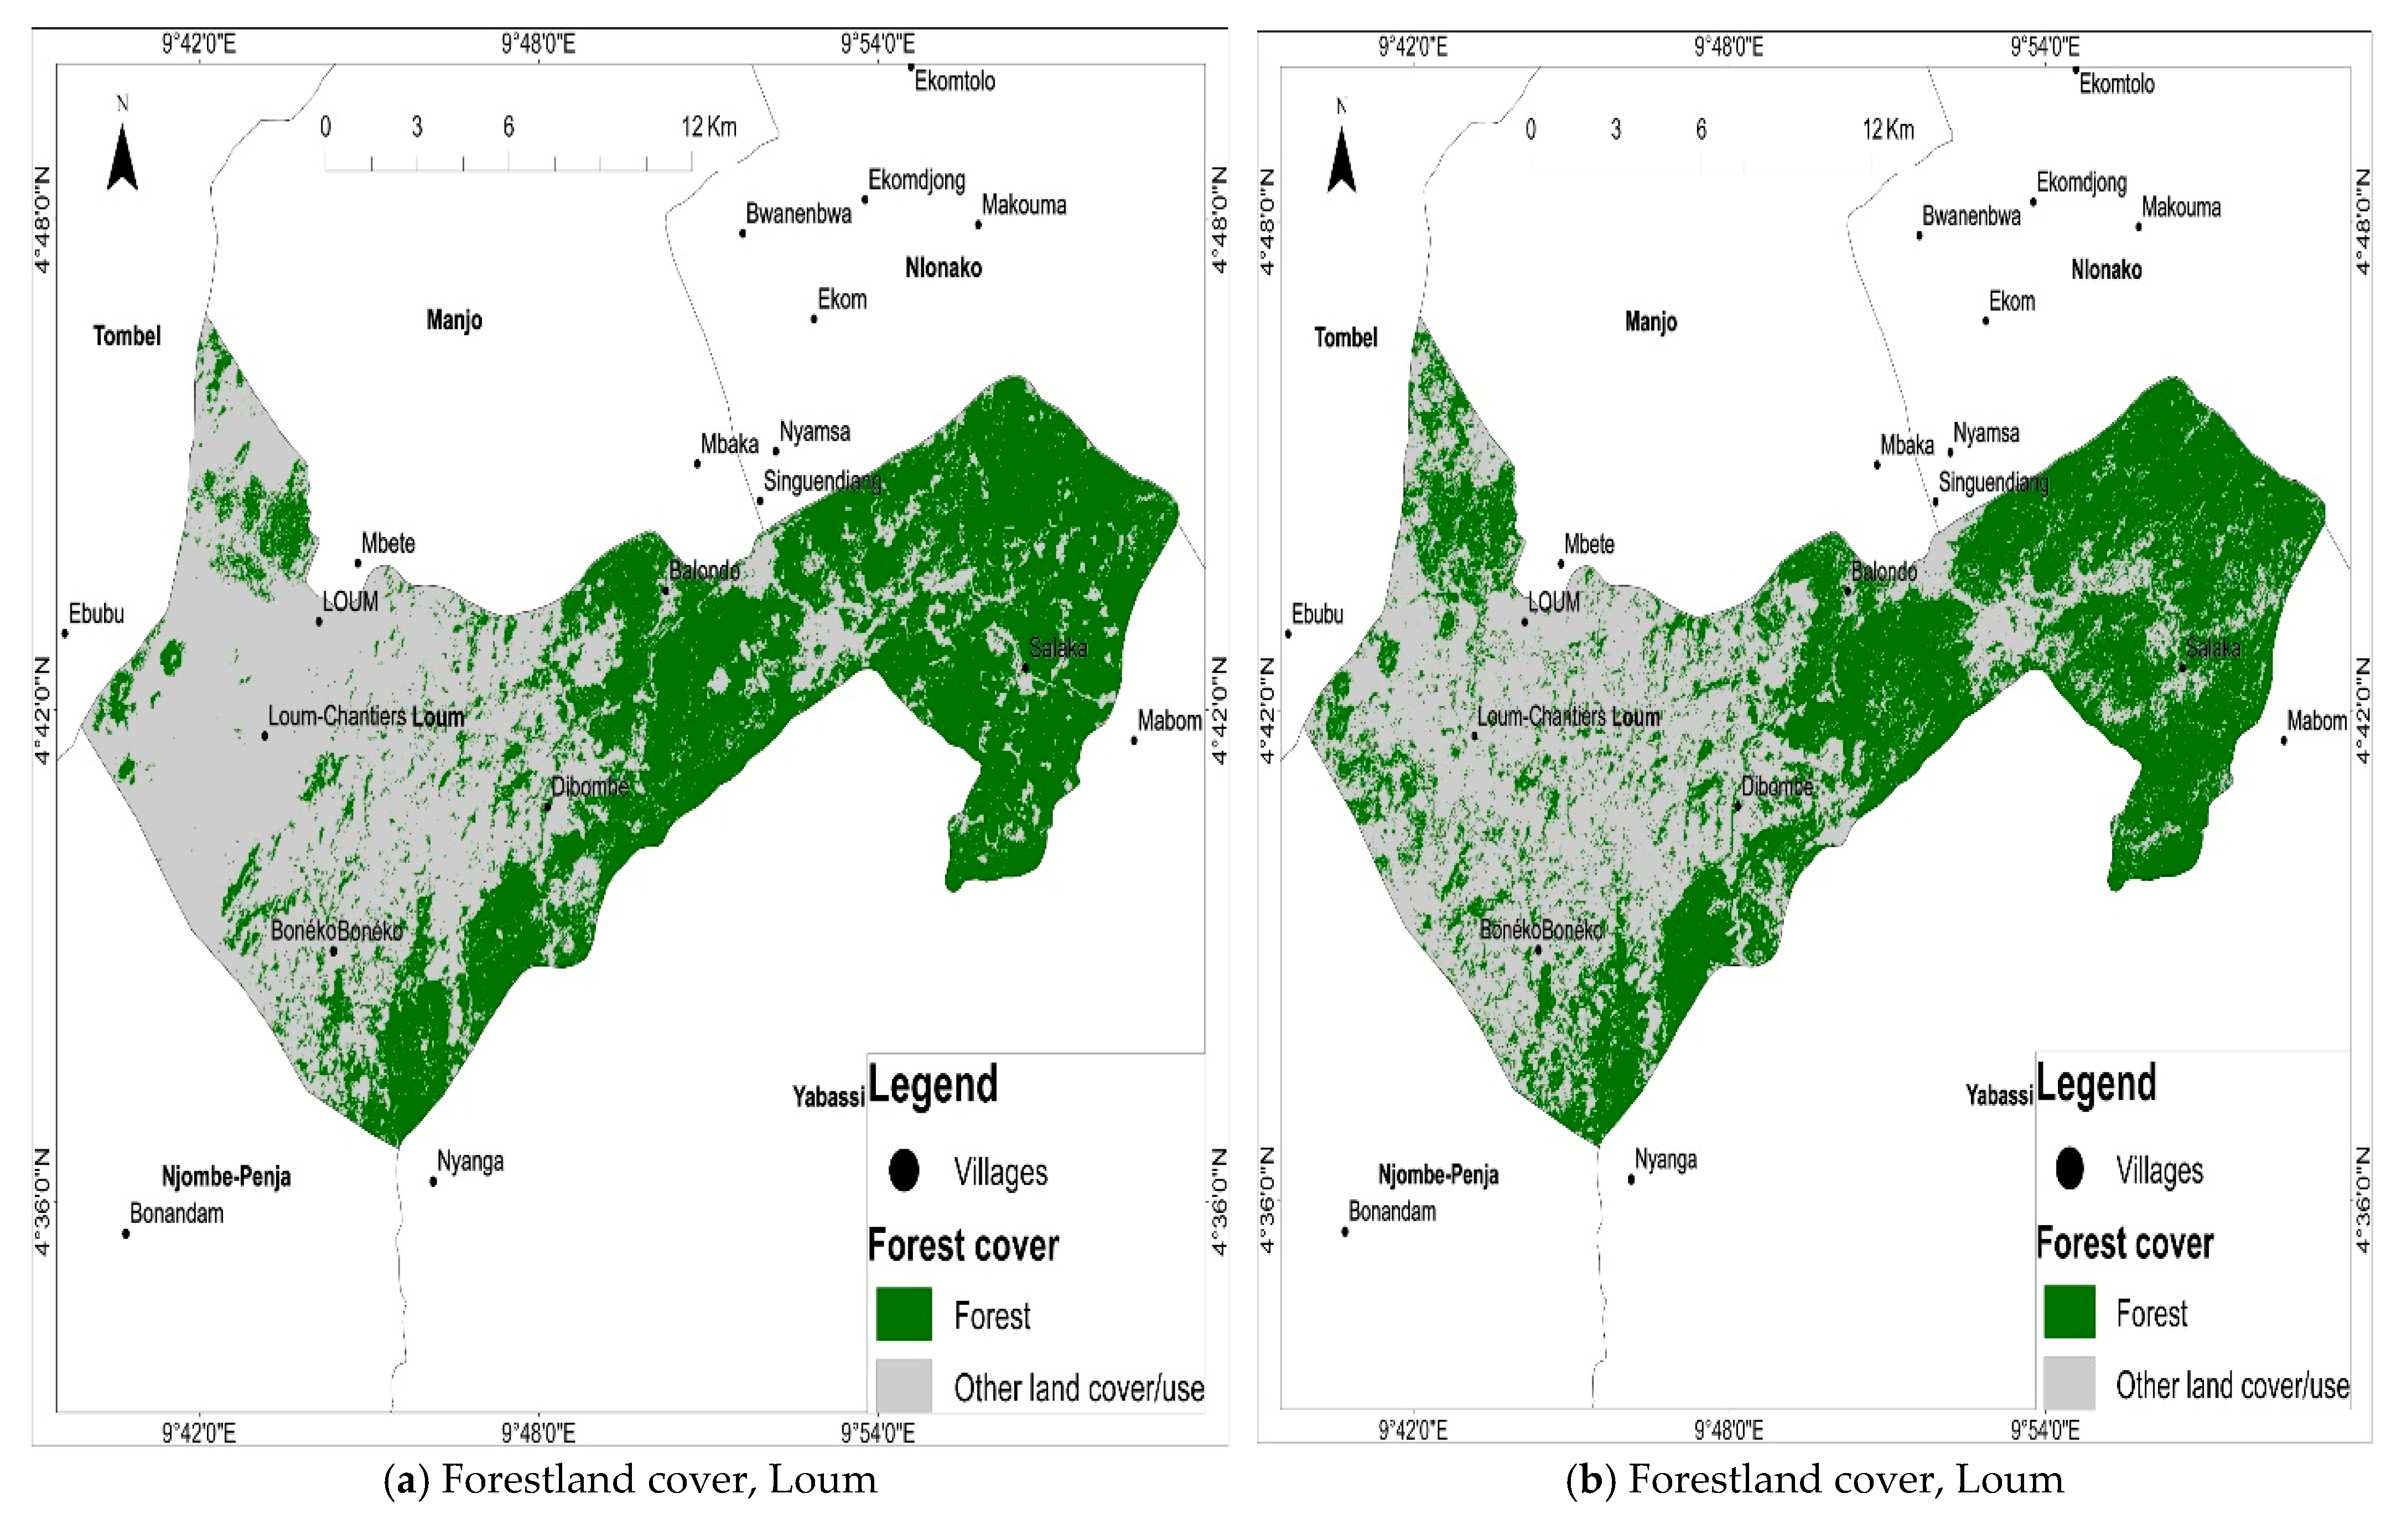
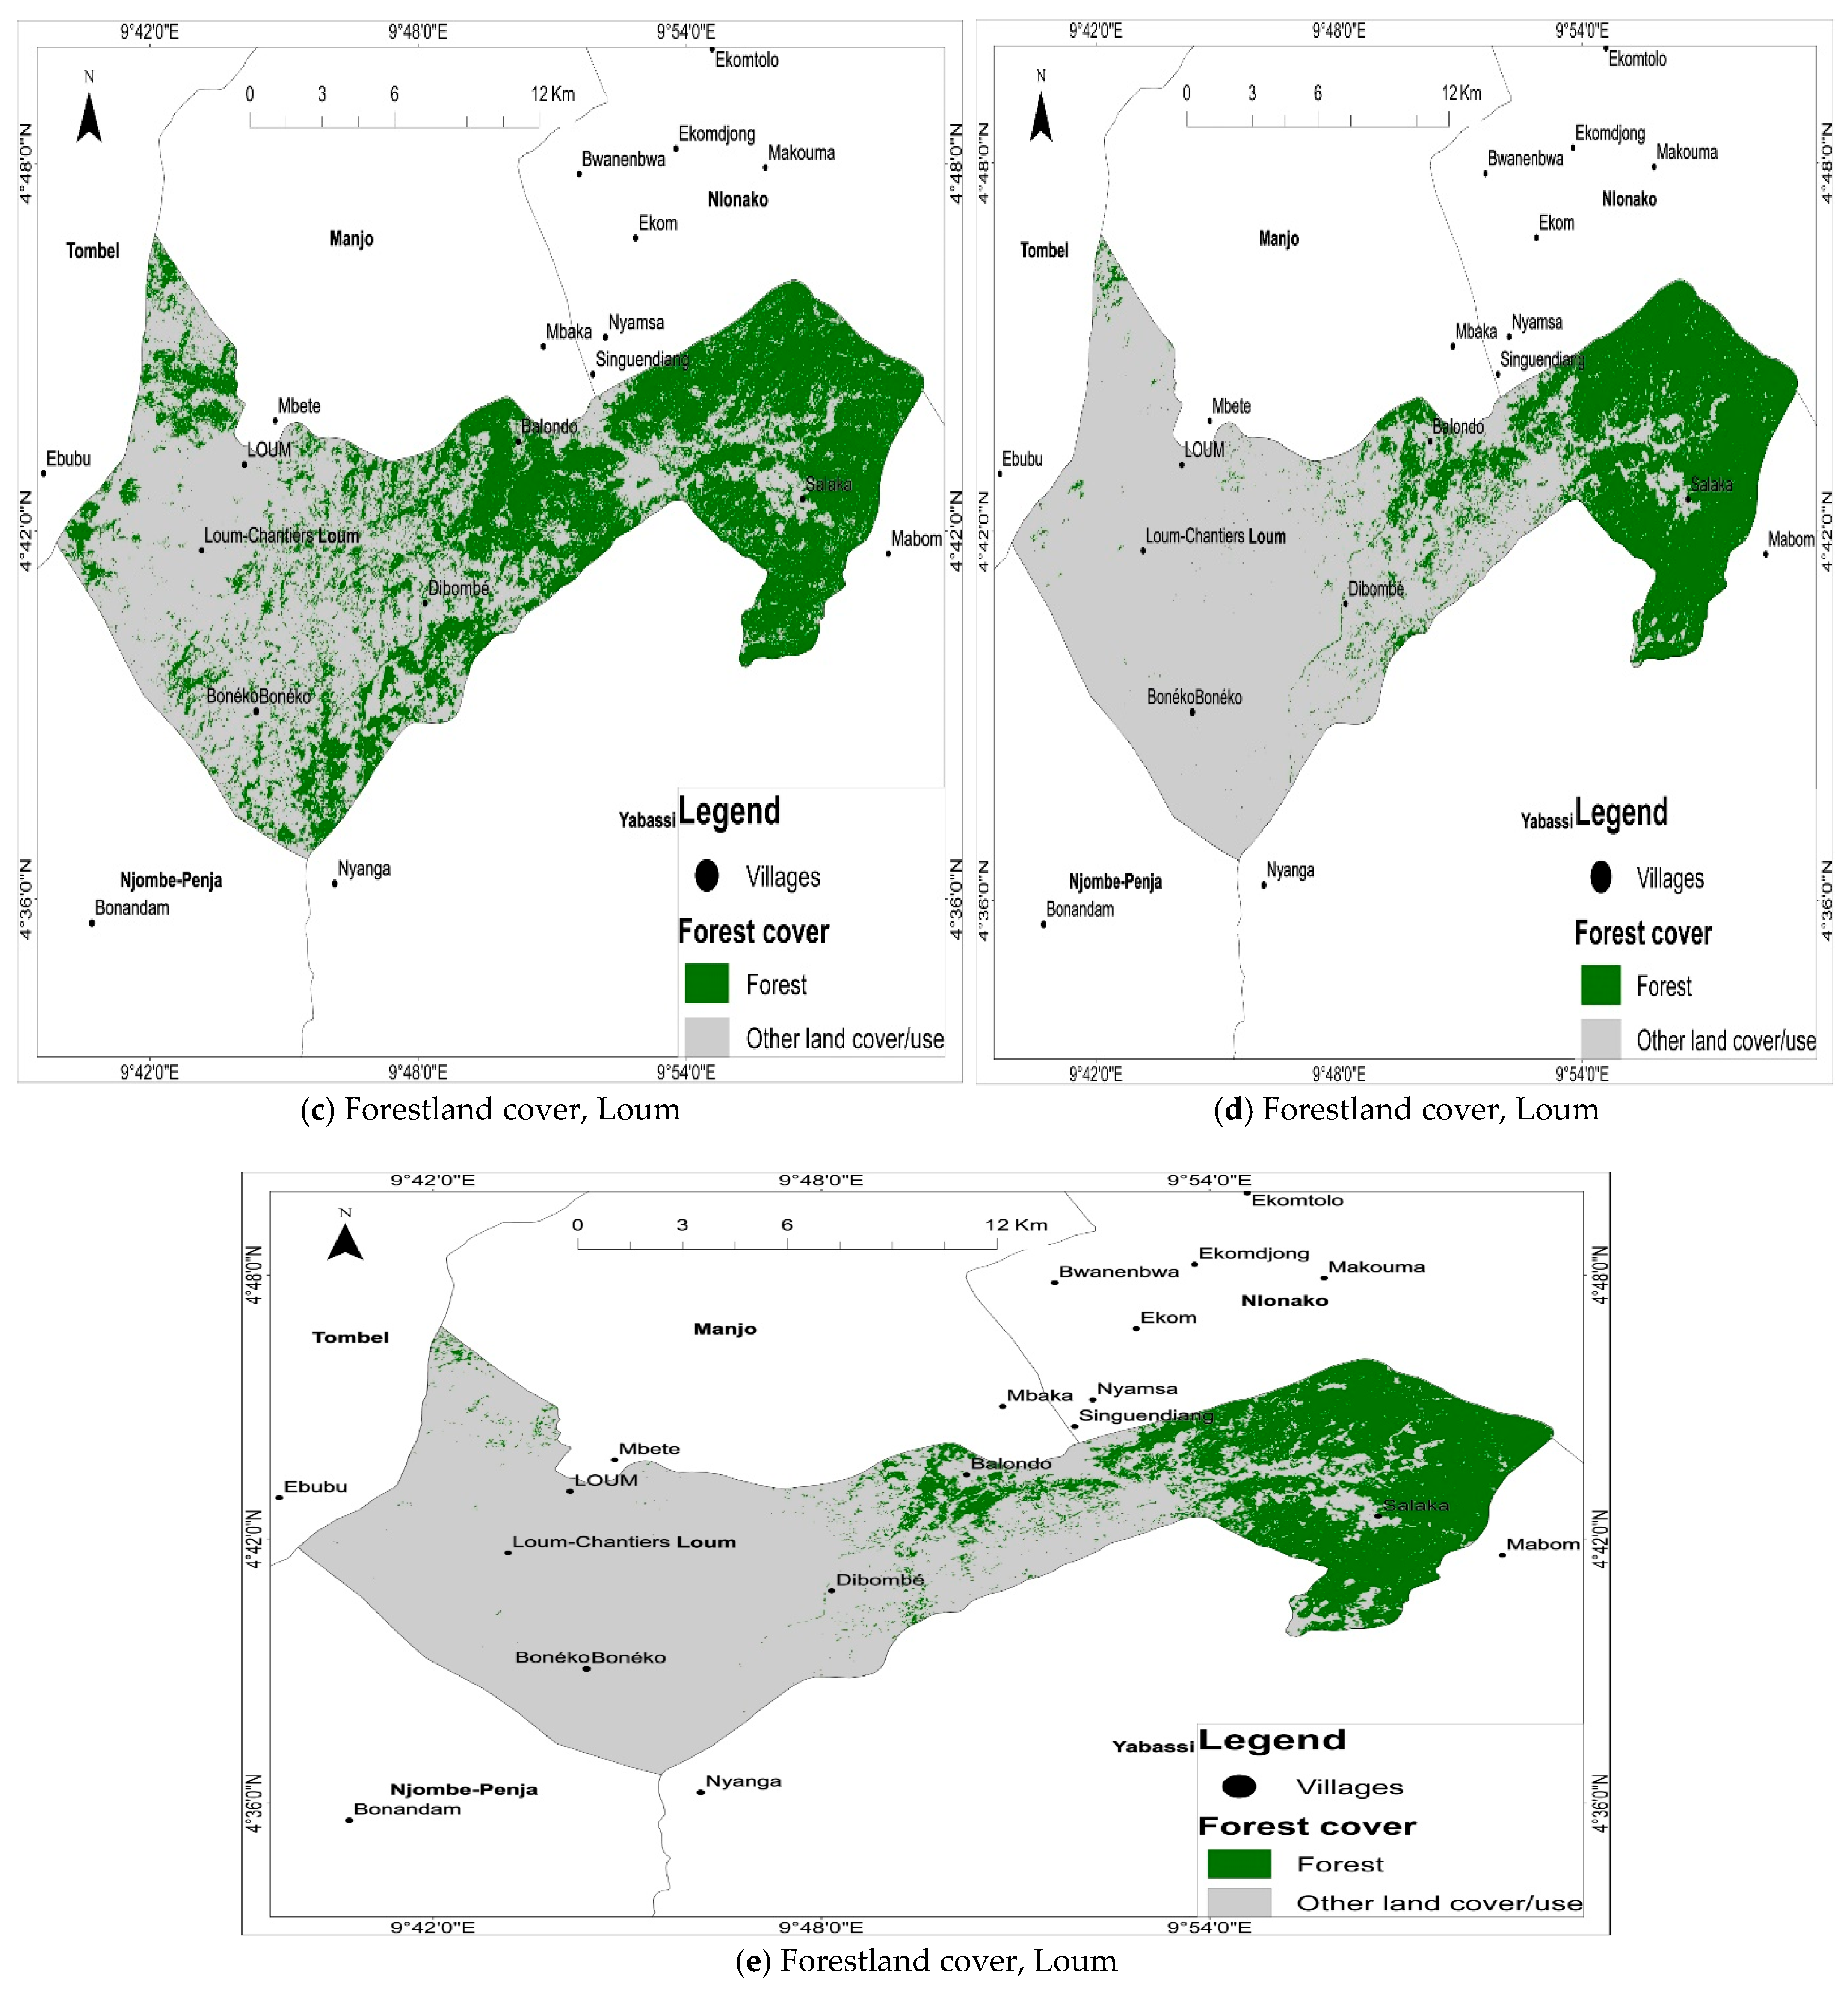
Figure 7 shows that forestland cover for Loum witnessed changes between 1984 and 2024. Table 4 presents the calculated changes in the forestland cover.
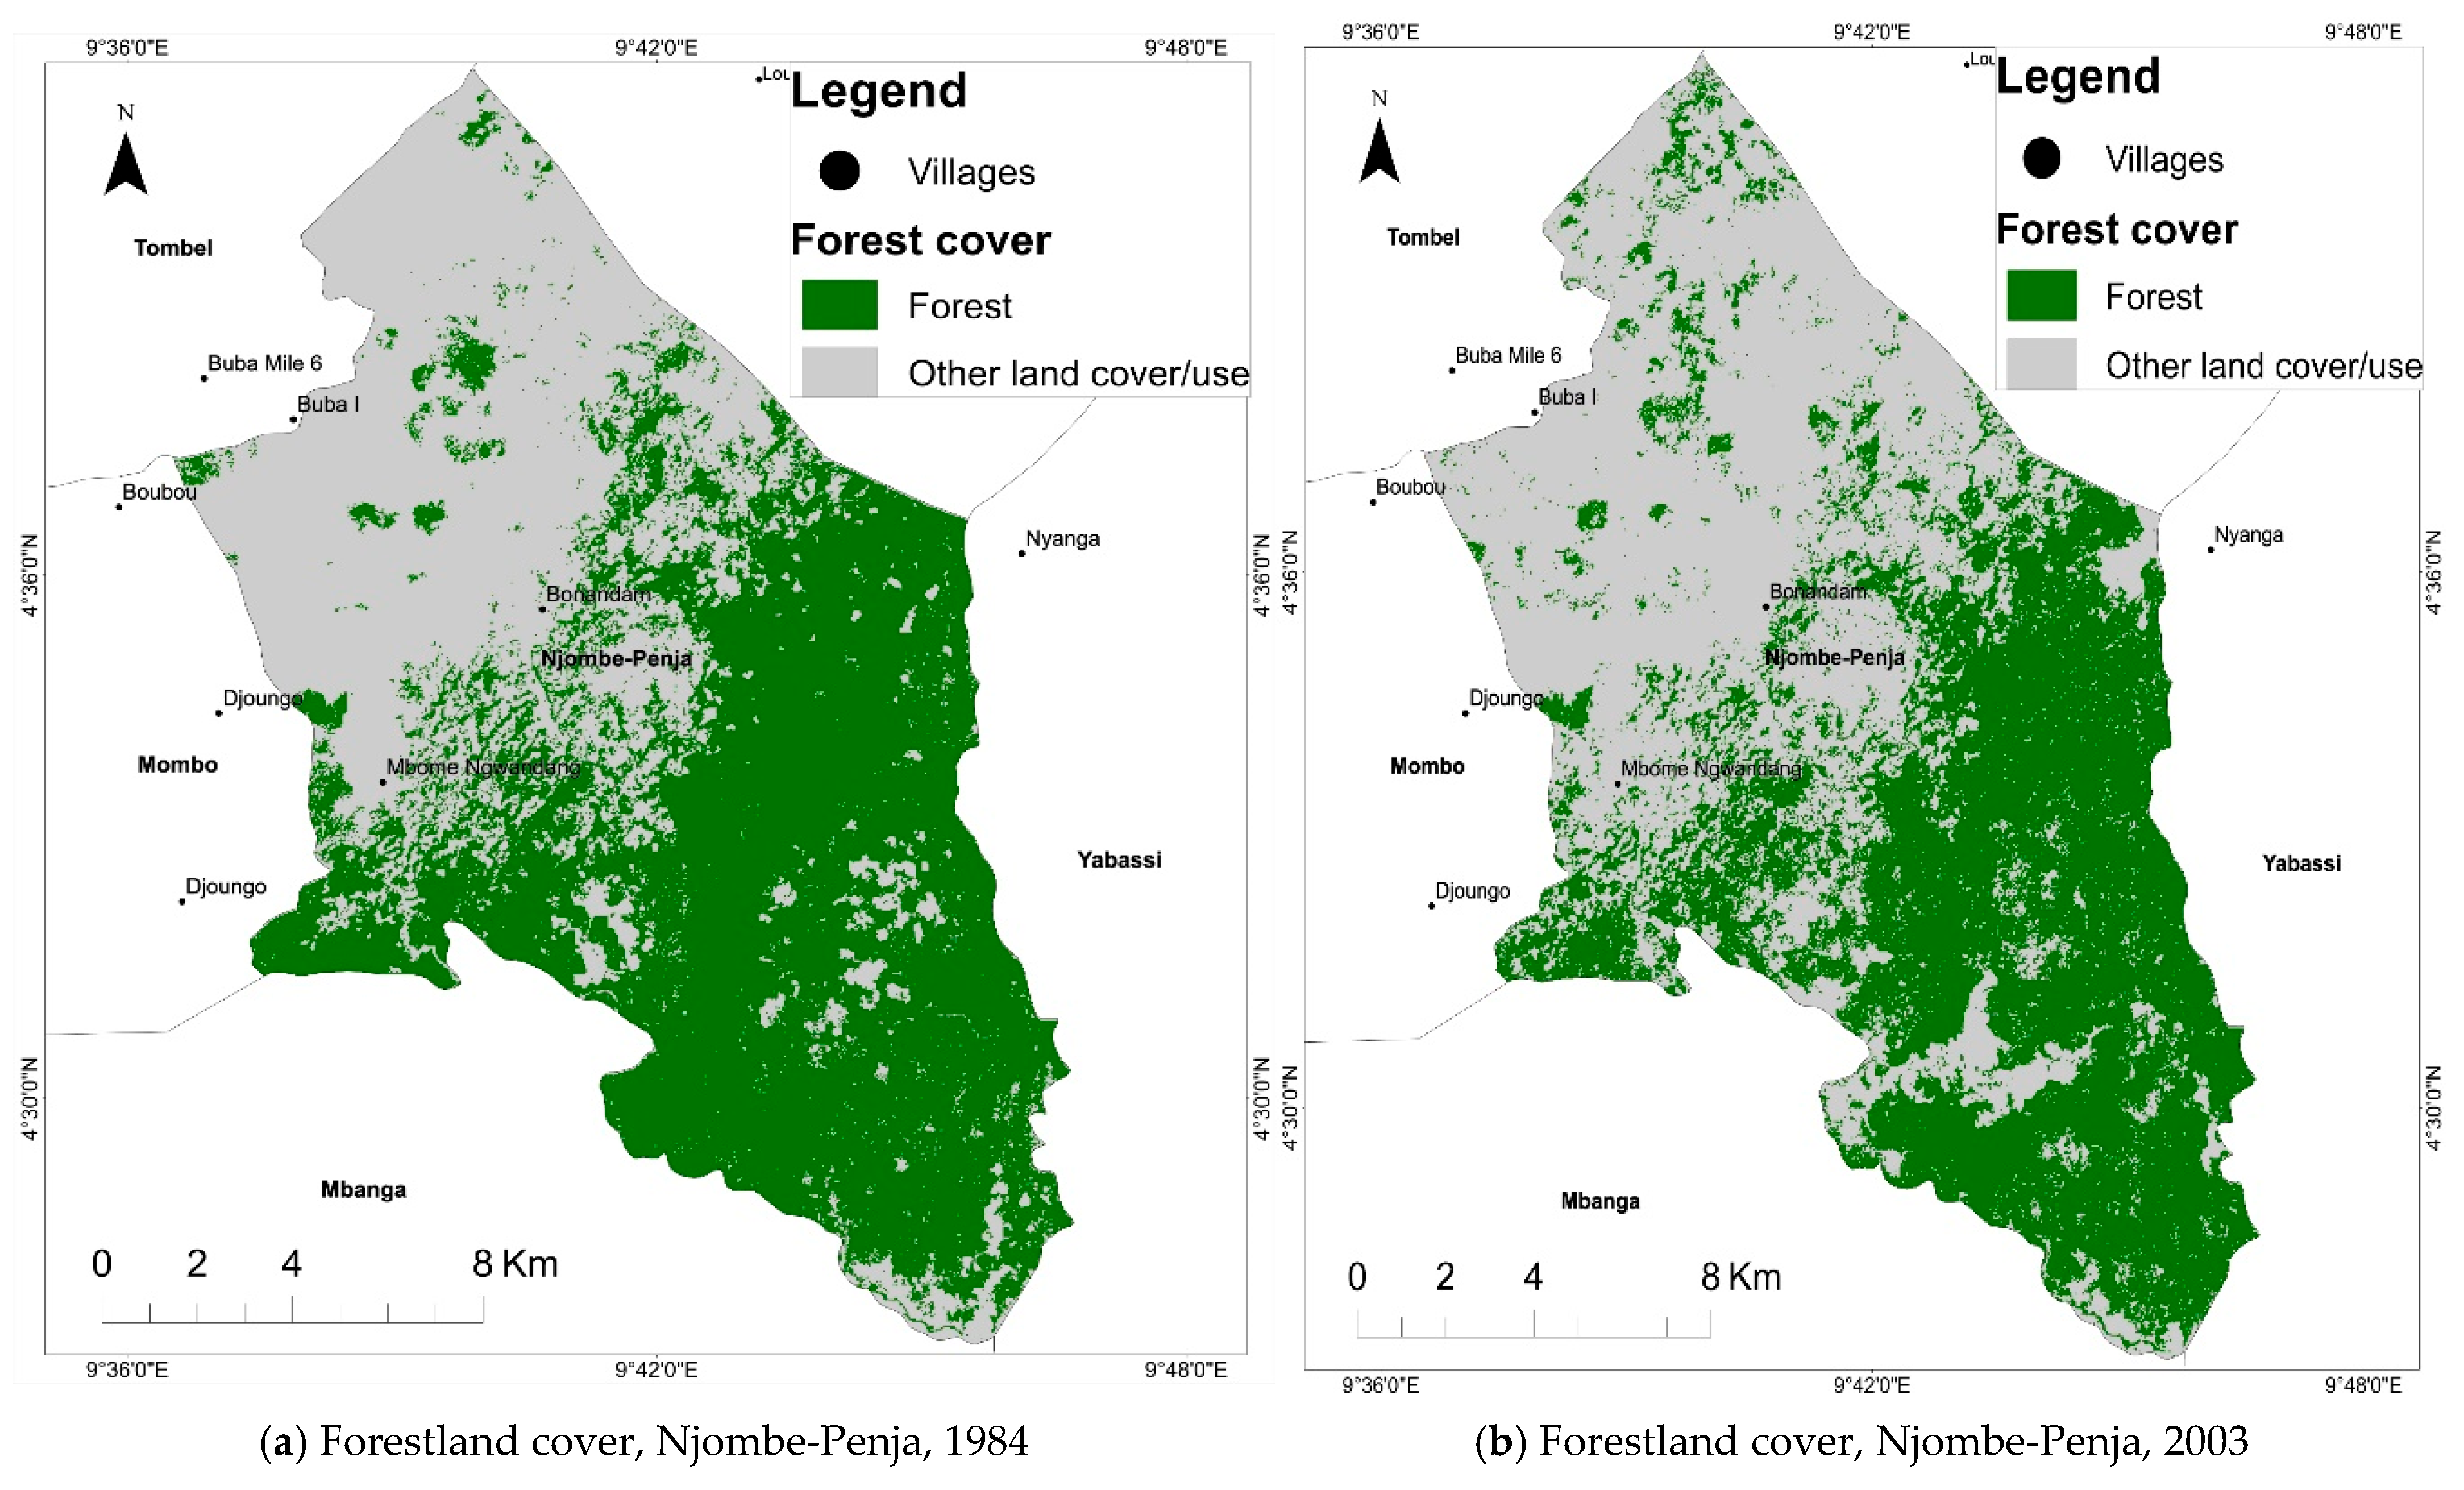
Table 4 shows that forestland cover for Loum experienced a decline of 759.322 ha, with a reported percentage change of 48.176% between 1984 and 2024. Between 1984 and 2003, the forestland cover for Loum witnessed a significant decline of 20.15 ha in favor of other land uses. In addition, between 2003 and 2010, forestland cover experienced a continued decline of 164.252 ha. Furthermore, 2010 to 2016 saw a forestland-cover decline of 477.72 ha. In addition, between 2016 and 2024, a continued decline of 97.2 ha of forestland was observed. Of all the different periods that witnessed reported declines in the forestland cover, 2010 to 2016 marked the most significant decline in the forestland cover in Loum. Figure 8 presents the forestland-cover changes for Njombe-Penja between 1984 and 2023.
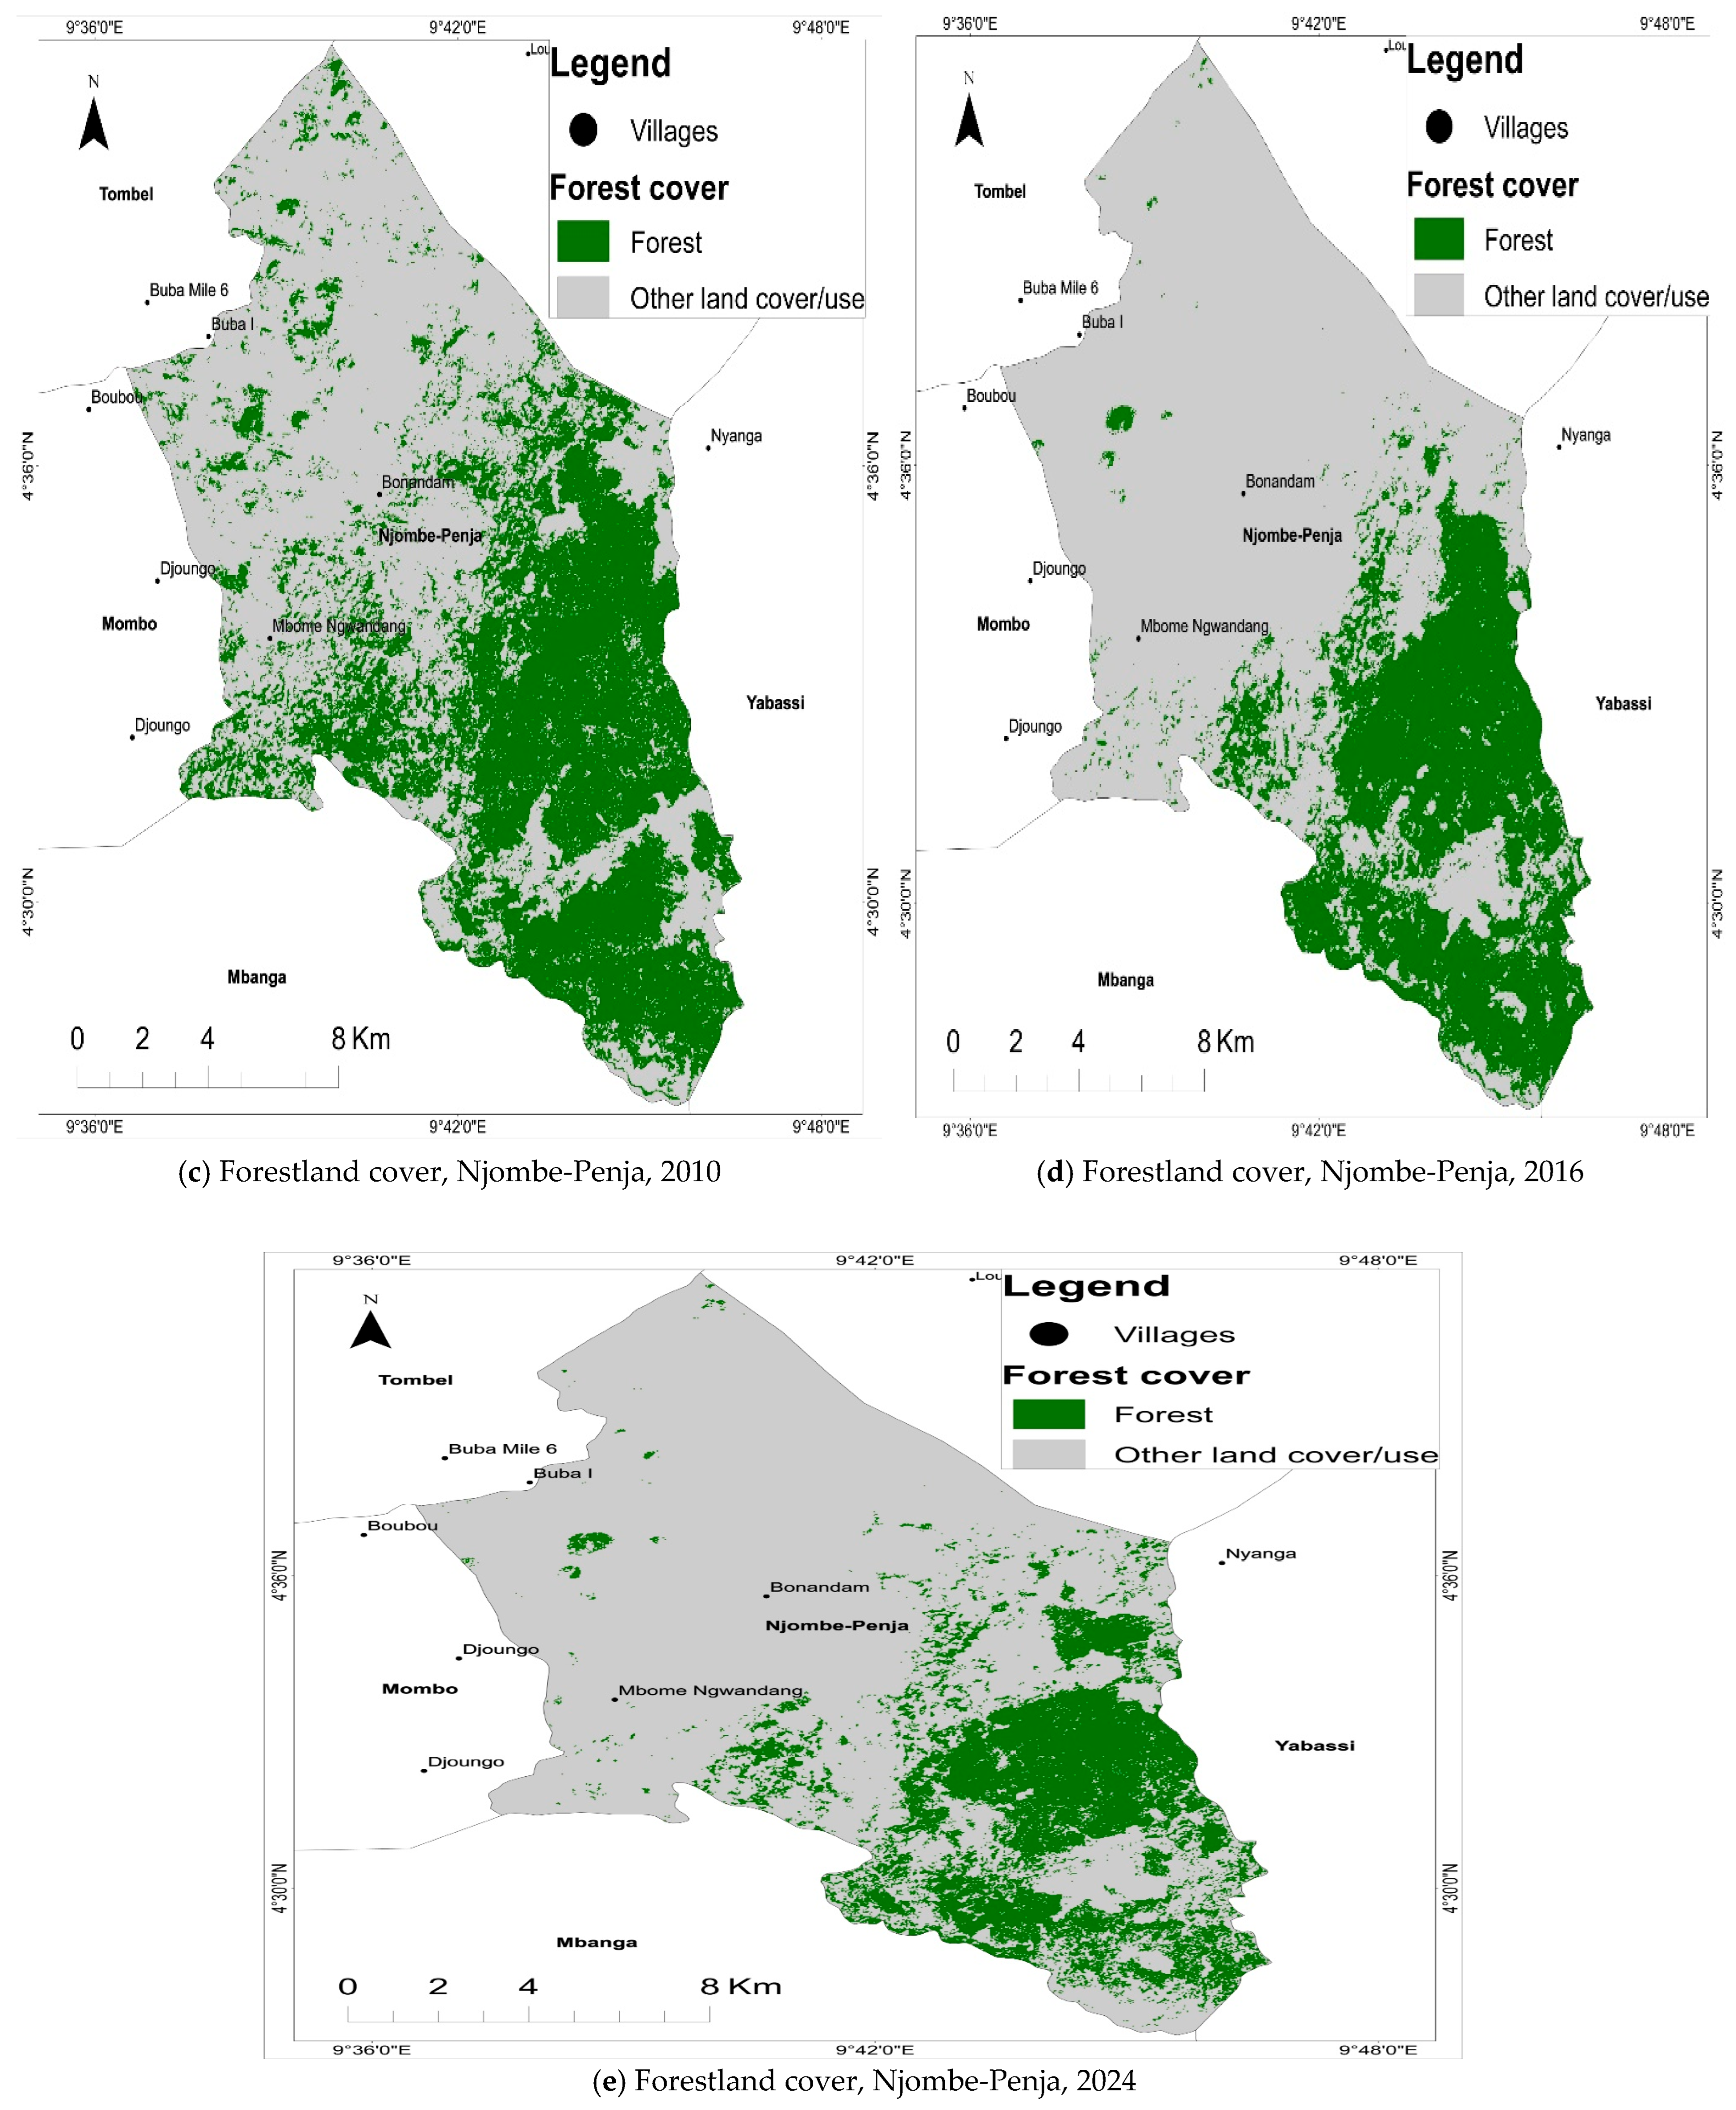
From Figure 8, forestland cover for Njombe-Penja witnessed significant changes between 1984 and 2024. Table 5 presents the calculated changes in the forestland cover for Njombe-Penja between 1984 and 2024.
Table 5 shows that forestland cover for Njombe-Penja experienced a decline of 1008.419 ha, indicating a percentage change of 35.216% between 1984 and 2024. Between 1984 and 2003, the forestland cover witnessed a decline of 80.95 ha in favor of other lands to include cropland and built-up. In addition, 2003 to 2010 witnessed a more significant decline of 374.824 ha of forestland cover. Furthermore, a recorded decline of 340.452 ha of forestland cover was witnessed between 2010 and 2016. Finally, the period of 2016 to 2024 experienced a decline of 212.193 ha.

4. Discussion

This study presented different types of NTFPs in the Mungo Corridor hollow frontier, their distribution, variations, and changes in the extraction rate between 2010 and 2015, and between 2016 and 2024. The study further presented changes in the forestland cover between 1984 and 2024.
The Mungo Corridor hollow frontier is endowed with NTFPs which include eru, white-pepper, bitter-kola, and bushmeat. These NTFPs vary in their distribution, with white-pepper being the dominant NTFP in Njombe-Penja and Loum (66% and 40%, respectively), whereas bushmeat is the dominant NTFP in Nlonako (40%). With regards to the quantity of extracted NTFPs, the period of 2010 to 2015 witnessed a significant rate of NTFPs extraction over the period of 2016 to 2024. Between 2010 and 2015, the quantity of NTFPs extracted was estimated at 10 bags and above in Melong (68.5%), Nlonako (76.1%), Loum (74.2), and Njombe-Penja (72%). Between 2016 and 2024, the quantity of NTFPs extracted ranged from 4 to 6 bags in Melong (46.3%) and Njombe-Penja (44%), compared to Nlonako and Loum. This study aligns with [15], which observed that significant variations exist in the rates of forest resource extraction with significant declines in the availability of NTFPs in the present time. Furthermore, the study disagrees with [16], which established that forest resource extraction has witnessed an increasing trend.
In the Mungo Corridor, forestland witnessed a decline from 1984 to 2024, with Njombe-Penja witnessing the most significant decline of 1008.419 ha, indicating a percentage change of 35.216%. This is compared to Nlonako, which witnessed the least significant decline of 472.461 ha, indicating a percentage change of 86.39% between 1984 and 2024. Loum is the community that has witnessed the second-highest significant decline of 759.322 ha, indicating a percentage change of 48.176% in the forestland cover between 1984 and 2024. In Loum, 2010 to 2016 marked the most significant period of decline at 477.72 ha in the forestland cover. Between 2010 and 2016, Loum and Nlonako marked the most significant declines in forestland, indicating a change of 477.72 ha and 3291.35 ha, respectively. This study aligns with the work of [16], who observed that forestland cover has witnessed significant declines due to anthropogenic activities such as farming. However, they contrast with [17], who argued that communities in Cameroon such as Ebo, Ndokbou, and Mikembe’ witnessed an increase in the forestland cover between 2004 and 2024 due to sustainable ecological interventions such as agroforestry, enrichment planting, and farmer-managed natural regeneration by state actors and NGOs.

5. Conclusions

This study reiterates the dynamics of land-based resources in hollow frontiers with forest covers witnessing a significant decline in favor of agriculture and the built-up area. The analysis leads to the following conclusions: forestland resource-use practices (e.g., NTFP harvesting) witnessed a significant decline due to the intensification of extraction rates. Furthermore, forestland cover witnessed a significant decline in the Mungo Corridor which ranged from 35. 216% to 86.39% during the period between 1984 and 2024, with some variations across the Corridor. The results provide novel insights on the pattern of resource use around hollow frontiers. It further informs land management policies in the context of land-based resources regulation in the hollow frontiers of Cameroon and other similar contexts in sub-Saharan Africa. Management interventions such as the regulation of forest resource and agricultural practices, and the institution of surveillance activities should be made effective. Forestland should be classified into zones to regulate activities which trigger forest-cover decline in hollow frontiers. As a limitation, the study intended to map out forestland resource change at 10-year intervals between 1984 and 2024. However, data unavailability made it difficult to adopt this interval. Furthermore, this study did not focus on statistical tests but rather relied more on spatial analysis to uncover evidence on the variations in forestland cover from 1984 to 2024. Future studies should explore forest resource regeneration strategies in the Mungo Corridor. In addition, a future study should be conducted on the drivers and impact of forest resource dynamics in the Mungo Corridor.

Author Contributions

Conceptualization, C.E.A., J.N.K., and Z.N.F.; methodology, C.E.A.; writing—original draft, C.E.A.; writing—review and editing, C.E.A., J.N.K., and Z.N.F.; supervision, J.N.K. and Z.N.F. All authors have read and agreed to the published version of the manuscript.

Funding

This research was funded by the Deutsche Forschungsgemeinschaft (DFG)—Project ID: 437116427.

Institutional Review Board Statement

Ethical review and approval were waived for this study due to the fact that the study focused on forestland resource dynamics. The data collection process was conducted with strict respect for the integrity and privacy of all respondents. The research process did not involve data collection on human specimens.

Data Availability Statement

Data will be made available on request.

Conflicts of Interest

The authors declare that they have no known competing financial interests or personal relationships that could have appeared to influence the work reported in this paper.

References

  1. Castella, J.-C.; Boissau, S.; Thanh, N.H.; Novosad, P. Impact of forestland allocation on land use in a mountainous province of Vietnam. Land Use Policy 2006, 23, 147–160. [Google Scholar] [CrossRef]
  2. WDI. World Development Indicators. 2016. Available online: https://data.worldbank.org/products/wdi (accessed on 10 January 2025).
  3. Franks, P.; Hou-Jones, X. Reconciling Forest Conservation with Food Production in Sub-Saharan Africa: Case Studies from Ethiopia, Ghana and Tanzania; IIED Research Report: London, UK, 2017; ISBN 978-1-78431-470-5. Available online: http://pubs.iied.org/17605IIED (accessed on 5 April 2025).
  4. Kissinger, G.; Herold, M.; De Sy, V. Drivers of Deforestation and Forest Degradation: A Synthesis Report for REDD+ Policymakers; Lexeme Consulting: Vancouver, BC, Canada, 2012. [Google Scholar]
  5. Kamga, A.; Kouamé, C.; Tchindjang, M.; Chagomoka, T.; Drescher, A.W. Environmental impacts from overuse of chemical fertilizers and pesticides amongst market gardening in Bamenda, Cameroon. Rev. Sci. Tech. Forêt Environ. Bassin Congo 2013, 1, 6–19. [Google Scholar]
  6. Mirkatouli, J.; Hosseini, A.; Neshat, A. Analysis of land use and land cover spatial pattern based on Markov chains modelling. City Territ. Arch. 2015, 2, 4. [Google Scholar] [CrossRef]
  7. Atangana, J.N.; Tchindjang, M.; Moulende, T.; Bene Bene, C.L. Evaluation Eenvironnementale de la Problématique de Bois de feu dans la vile de Garoua Nord Cameroun. Colloque SIFEE. 2010. Available online: http://www.sifee.org/Actes/actes_paris_2010/Communications/BLOC_4/S_4.1/3_NTSAMA_ATANGANA_TXT.pdf. (accessed on 15 March 2025).
  8. Tchindjang, M.; Amougou, J.A.; Abossolo, S.A.; Bessoh Bell, S. Challenges of climate change, landscape dynamics and environmental risks in Cameroon. In Landscape Evolution, Neotectonics and Quaternary Environmental Change in Southern Cameroon: Palaeoecology of Africa; Taylor and Francis: London, UK, 2012; Volume 31, Chapter 5; pp. 237–286. [Google Scholar]
  9. Forba, C.F.; Kimengsi, J.N. An Empirical Analysis of the Relationship between Plantation Development and Urbanisation in the Mungo Corridor of Cameroon. Greener J. Environ. Manag. Public Saf. 2015, 4, 1–8. [Google Scholar]
  10. Bongaarts, J.; Buetterner, J.; Heilig, G.; Pelletier, F. Has the AIDS epidemic peaked? Popul. Dev. Rev. 2008, 34, 199–244. [Google Scholar] [CrossRef]
  11. Busch, C.B.; Vance, C. The Diffusion of Cattle Ranching and Deforestation—Prospects for a Hol-low Frontier in Mexico’s Yucatán; Ruhr Economic Papers No.242; Rheinisch-Westfälisches Institut für Wirtschaftsforschung (RWI): Essen, Germany, 2011. [Google Scholar]
  12. Taylor, H.W. Sao Pailo’s hollow frontier. Rev. Geogr. 1973, 149–166. [Google Scholar]
  13. Kimengsi, N.J.; Nkongwibuen, A.L.; Assako, R.L.; Suiven, J.P.T.; Yemmafouo, A.; Mairomi, H.W. Hollow Frontier Dynamics and Land Resource Exploitation in the Mungo Landscape of Cameroon. Can. J. Trop. Geogr. Rev. Can. Géographie Trop. 2023, 9, 7–13. [Google Scholar]
  14. Sven, B.; Ulbe, B.; Mindi, S.; Vanhaute, E. Commodity frontier and global histories: The tasks ahead. J. Glob. Hist. 2021, 16, 466–469. [Google Scholar] [CrossRef] [PubMed]
  15. Ujjayant, C.; Herath, M.G. Forest Resources Extraction by Local Communities: A Comparative Dynamics Analysis; SSRN; FEEM: Milan, Italy, 2000. [Google Scholar] [CrossRef]
  16. Ibifubara, W.R.; Emem Okon, A.; Patrick Anthony, A. Overexploitation of Forest Resources and Its Impact on Environment: A Case Study of ITU Local Government Area of Akwa Ibom States. Int. J. Oper. Res. Manag. Soc. Sci. Educ. 2018, 4, 36–45. [Google Scholar]
  17. Nyongo, P.K.; Kimengsi, J.N. Socio-ecological outcomes of forest landscape mutations in the Congo Basin: Learning from Cameroon. Land 2025, 14, 1644. [Google Scholar] [CrossRef]
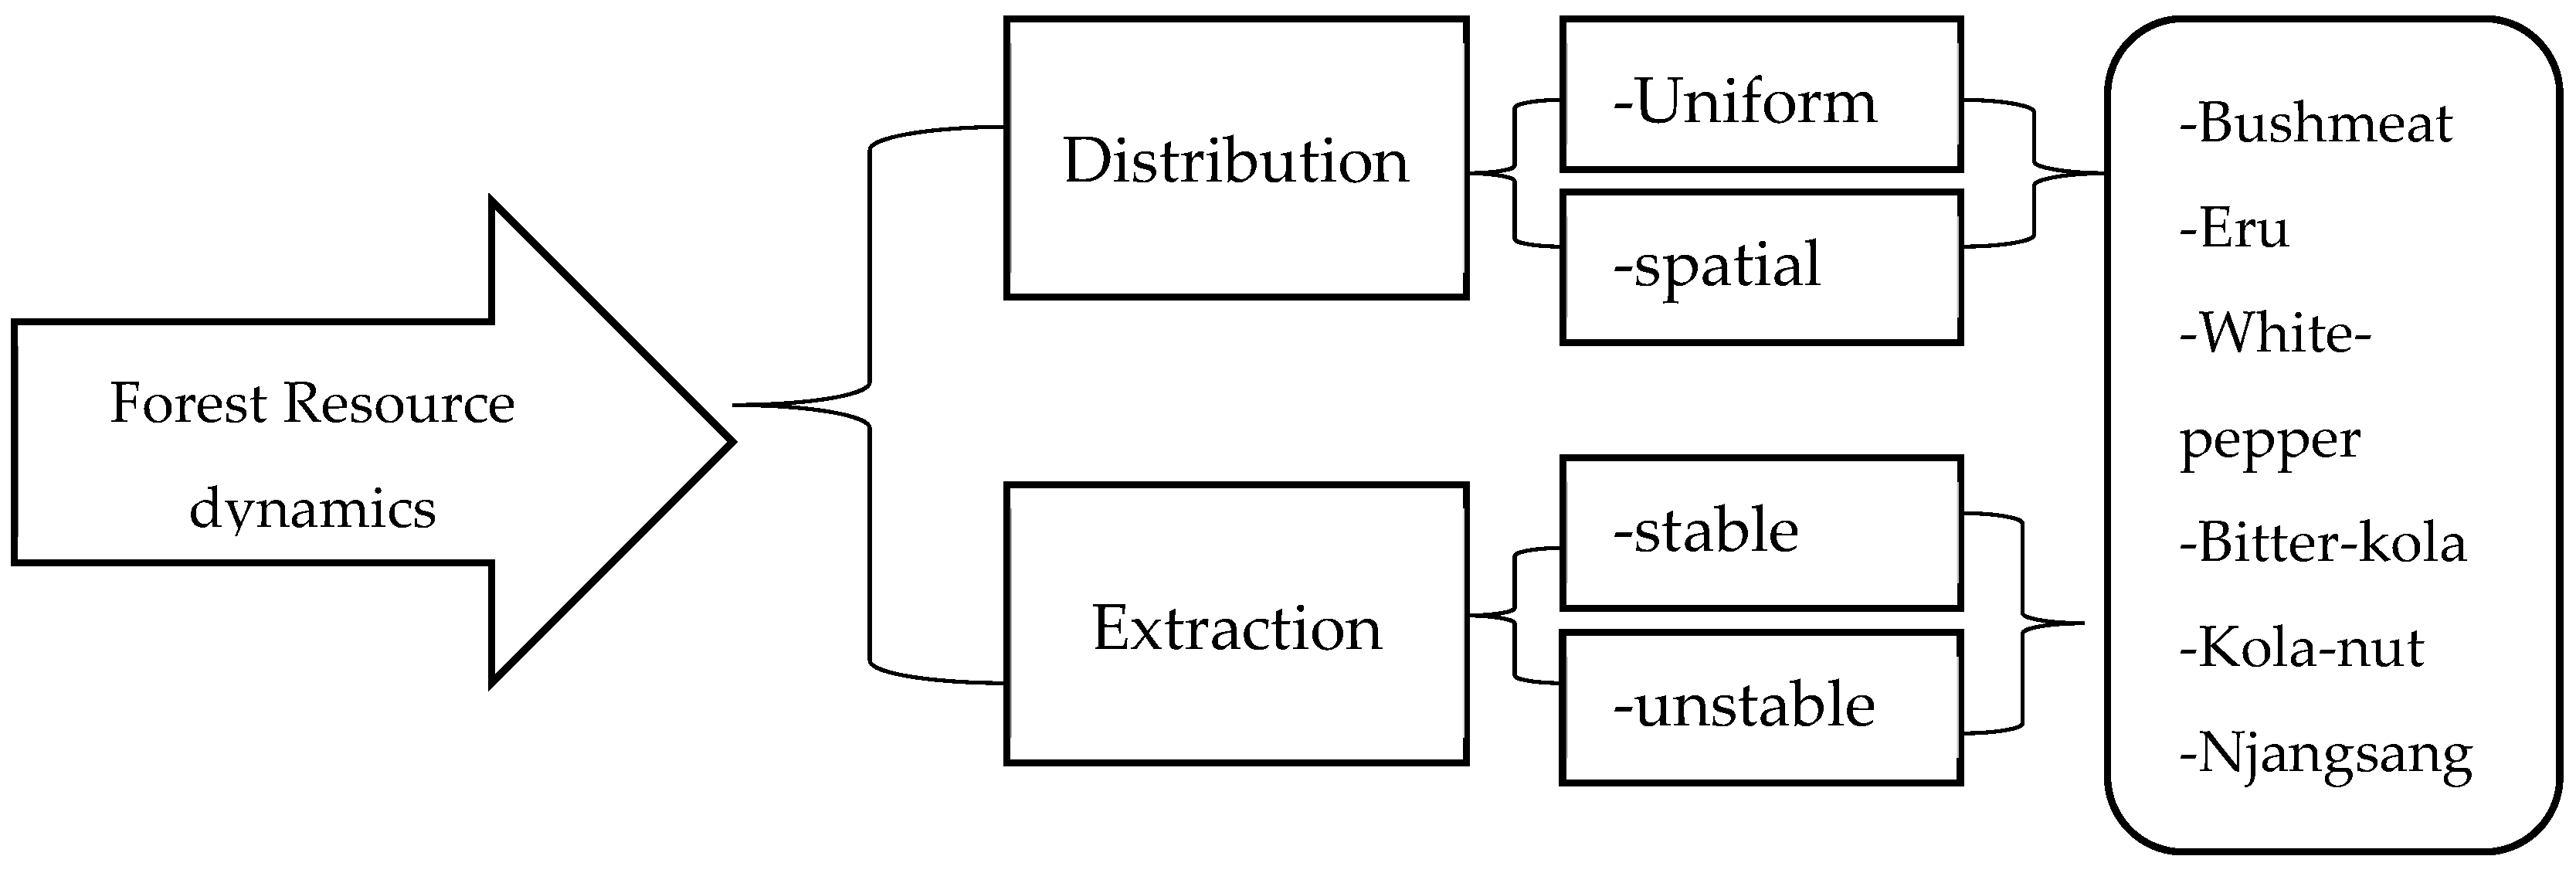
Figure 1. Forest resource dynamics in hollow frontiers.
Earth 06 00140 g001
Figure 2. Location map of the Mungo Corridor. Source: Landsat 8 (NASA, 2024).
Earth 06 00140 g002
Figure 3. Qualitative and quantitative data collection.
Earth 06 00140 g003
Figure 4. NTFPs in the Mungo Corridor.
Earth 06 00140 g004
Figure 5. Forest land cover change in Melong (1984-2024). Source: Landsat 5, 7, and 8 (NASA 1984, 2003, 2010, 2016, and 2024).
Earth 06 00140 g005aEarth 06 00140 g005b
Figure 6. Forest land cover 1984, 2003, 2010, 2016, and 2024. Source: Landsat 5, 7 and 8 (NASA 1984, 2003, 2010, 2016, and 2024).
Earth 06 00140 g006aEarth 06 00140 g006b
Figure 7. Forest land cover Loum. Source: Landsat 5, 7 and 8 ((NASA 1984, 2003, 2010, 2016 and 2024).
Earth 06 00140 g007aEarth 06 00140 g007b
Figure 8. Forest land cover, Njombe-Penja from 1984 to 2024. Source: Landsat 5, 7 and 8 (NASA 1984, 2003, 2010, 2016 and 2024).
Earth 06 00140 g008aEarth 06 00140 g008b
Table 1. Variation in the quantity of NTFPs extracted between 2010 and 2015, and between 2016 and 2024.
Community2010–20152016–2024
1–3 Bags4–6 Bags7–9 Bags10+ Bags1–3 Bags4–6 Bags7–9 Bags10+ Bags
Melong0%0%31.4%68.5%17.8%46.3%34.4%1.5%
Nlonako0%0%23.9%76.1%0%13.4%52%34.6%
Loum0%0%25.8%74.2%6.2%7.5%40.9%45.3%
Njombe-Penja0%0%28%72%0%0%44%56%
Source: Field work, 2024.
Table 2. Forestland-cover/use change for Melong (1984–2024).
LCLU19842003201020162024Percentage Change
Forest2664.922096.7842118.0421943.381857.39369.69%
Cropland2858.8143522.363459.033593.013663.71128.15%
Grassland353.672246.967285.112304.343309.2387.43%
Water bodies2.7282.0422.862.1972.853104.5%
Built-up61.93873.9277.02399.144108.883175.8%
Total5942.075942.075942.075942.075942.07565.57%
Source: Classified Planetscope images at 4.77 m resolution.
Table 3. Forestland-cover/use change for Nlonako (1984–2024).
LCLU19842003201020162024Percentage Change
Forest3472.263255.303294.2792924.3252999.79986.39%
Cropland448.299646.902627.894987.408894.114199.44%
Grassland26.95533.95710.02917.37917.04963.24%
Built-up16.227.55831.51834.60852.758325.66%
Total3963.723963.723963.723963.723963.72674.73%
Source: Classified Planetscope images at 4.77 m resolution.
Table 4. Forestland-cover/use change statistics (ha) for Loum (1984–2024).
LCLU19842003201020162024Percentage Change
Forest1465.211445.061280.808803.088705.88848.176%
Cropland1368.971382.661538.001994.252076.14151.657%
Water bodies2.5882.5312.22.352.75106.259%
Built-up26.4632.98542.22863.54978.455296.504%
Total2863.232863.232863.2332863.2332863.233602.596
Source: Classified Planetscope images at 4.77 m resolution.
Table 5. Forestland-cover/use change for Njombe-Penja (1984–2024).
LCLU19842003201020162024Percentage Change
Forest1556.601475.651100.826760.374548.18135.216%
Cropland1055.181127.951480.701814.652022.45191.668%
Built-up26.24434.41756.49662.99967.39256.668%
Total2638.022638.022638.022638.022638.02483.552%
Source: Classified Planetscope images at 4.77 m resolution.
Disclaimer/Publisher’s Note: The statements, opinions and data contained in all publications are solely those of the individual author(s) and contributor(s) and not of MDPI and/or the editor(s). MDPI and/or the editor(s) disclaim responsibility for any injury to people or property resulting from any ideas, methods, instructions or products referred to in the content.