Article

Health and Economic Benefits of Ozone Reduction: Case Study in Santiago and Valparaíso

by
Fidel Vallejo
1,2,*,
Patricio Villacrés
1,2,
Jorge Leiva-González
3,*,
Ernesto Pino-Cortés
4,
Lorena Espinoza-Pérez
5,6,7,
Andrea Espinoza-Pérez
6,7,
Luis Díaz-Robles
8,9,
Pablo Castro
10,
Valeria Campos
10 and
Rasa Zalakeviciute
11
1
Industrial Engineering, National University of Chimborazo, Riobamba 060108, Ecuador
2
ProcesLab Research Group, National University of Chimborazo, Riobamba 060108, Ecuador
3
Escuela Ingenería civil y Ciencias Geoespaciales, Facultad de Ingeniería, Ciencia y Tecnología, Universidad Bernardo O’Higgins, Santiago 8370993, Chile
4
Escuela de Ingeniería Química, Pontificia Universidad Católica de Valparaíso, Valparaíso 2362854, Chile
5
Équipe de Recherche sur les Processus Innovatifs, Université de Lorraine (ERPI), F-54000 Nancy, France
6
Program for the Development of Sustainable Production Systems (PDSPS), University of Santiago of Chile, Estación Central, Santiago 9170124, Chile
7
Industrial Engineering Department, University of Santiago of Chile, Estación Central, Santiago 9170124, Chile
8
Environmental Engineering and Management Particulas SpA, Santiago 7500010, Chile
9
Grupo Verde Nilo, Santiago 7500010, Chile
10
Department of Chemical Engineering, University of Santiago of Chile, Santiago 9170022, Chile
11
Biodiversidad, Medio Ambiente y Salud (BIOMAS), Universidad de Las Americas, Quito 170513, Ecuador
*
Authors to whom correspondence should be addressed.
Earth 2025, 6(4), 134; https://doi.org/10.3390/earth6040134
Submission received: 17 September 2025 / Revised: 15 October 2025 / Accepted: 17 October 2025 / Published: 28 October 2025
(This article belongs to the Special Issue Special Issue Series: Young Investigators in Earth Science)

Abstract

This study estimated the relative risks (RRs) of respiratory and cardiovascular mortality and morbidity due to short-term ozone exposure in 13 polluted communes across Chile’s Santiago Metropolitan and Valparaíso regions. Data on daily ozone, meteorology, and pollutants were sourced from the National Air Quality Information System (NAQIS), while health outcomes (mortality, hospital admissions, and emergency visits) were obtained from the Department of Health Statistics. A Poisson regression model, adjusted for trends, meteorology, day-of-week effects, and pollutants, quantified RRs for a 10 ppb ozone increase, ranging from 1.004 to 1.198 (95% CI). The highest risks were in Santiago’s Eastern zone (cerebrovascular, RR 1.171, 95% CI: 1.018–1.347), Western zone (cardiovascular, RR 1.198, 95% CI: 1.049–1.369), and Valparaíso’s Viña del Mar (ischemic heart disease, RR 1.127, 95% CI: 1.017–1.248). The 5–64-year age group was most affected, particularly in terms of emergency visits. Reducing ozone to the WHO guideline (100 µg/m3) could avoid 837,498 cases in Santiago and 17,992 in Valparaíso annually, resulting in economic savings of $7,439,930,640 and $1,044,568,800, respectively. These results highlight the need for stricter air quality policies to reduce ozone-related health burdens.

1. Introduction

Tropospheric ozone, a potent secondary air pollutant, arises from complex photochemical reactions involving precursors such as nitrogen oxides (NOx), volatile organic compounds (VOCs), methane (CH4), and carbon monoxide (CO) under solar radiation [1,2]. Unlike its stratospheric counterpart, which protects life from ultraviolet rays, ground-level tropospheric ozone poses significant threats to human health, ecosystems, and climate dynamics [3]. Its formation is driven by both natural sources, like biogenic emissions from vegetation, and anthropogenic activities, including vehicle exhaust, industrial processes, and fossil fuel combustion. In urban environments, where precursor emissions are concentrated, ozone levels frequently exceed safe thresholds, thereby amplifying public health risks and exacerbating environmental degradation [4,5].
Despite global efforts to mitigate ozone pollution, uncertainties persist in understanding the full spectrum of health impacts [6], particularly the synergistic effects with other pollutants like PM2.5 and the variable susceptibility across socioeconomic groups [7,8]. Current technologies for real-time ozone precursor monitoring [9,10] and advanced photochemical modeling [11] remain underdeveloped, necessitating breakthroughs to enhance predictive accuracy and policy efficacy [12]. Exposure to elevated tropospheric ozone concentrations triggers a cascade of adverse health effects, particularly affecting the respiratory and cardiovascular systems. Short-term exposure can induce acute responses, such as airway inflammation, chest pain, throat and eye irritation, and exacerbation of asthma symptoms [3,13,14]. It also aggravates preexisting heart conditions, manifesting as coughing, wheezing, and reduced lung function during physical activity. Prolonged or repeated exposure over months can lead to irreversible lung damage, compromising respiratory health and immune defense [15]. Vulnerable populations: children, people over 65 years old, and individuals who spend extended periods outdoors, face heightened risks, with older adults showing disproportionately higher rates of hospitalization for ozone-related illnesses [16,17]. These health impacts underscore the urgency of addressing tropospheric ozone as a critical public health challenge in urban areas.
The Santiago Metropolitan Region, nestled in a basin surrounded by the Andes and coastal mountain ranges, exemplifies urban air pollution challenges, consistently ranking among the world’s most polluted cities [18,19]. Its topography restricts pollutant dispersion, trapping emissions from a dense population, extensive vehicle traffic, and industrial activities. Meanwhile, meteorological conditions such as temperature inversions and low wind speeds foster photochemical ozone formation [20]. The Santiago Metropolitan Region has struggled with high ozone levels since formal air quality monitoring began in 1996, frequently exceeding the national standard of 61 parts per billion (ppb) for the 8 h moving average [21]. It led to its designation as a non-compliant area for ozone, reflecting persistent challenges in meeting air quality targets [6,22]. Efforts to reduce ozone, including improved fuel quality and the use of catalytic converters, have lowered mixing ratios until 2013, although mobile sources remain the dominant source of emissions, emitting approximately 39,000 tons of NOx annually [23].
The Valparaíso Region, a coastal area with significant industrial and urban activity, faces similar ozone pollution issues. The Aconcagua Valley, particularly Los Andes, records high ozone concentrations surpassing national standards [11]. Coastal communes like Concón, Quintero, and Puchuncaví experience severe pollution episodes due to industrial emissions and precursors, including benzene and non-methane hydrocarbons, which trigger health alerts and school closures. Other communes, including La Calera, Catemu, Llay Llay, Putaendo, and Quillota, contend with rising pollution from thermal power plants, vehicle traffic, and wood combustion, amplifying ozone risks [24].
The persistence of high ozone levels in both the Santiago Metropolitan and Valparaíso regions, coupled with rising hospitalizations and premature deaths, necessitates a comprehensive assessment of the health impacts of short-term ozone exposure. Quantifying these impacts through relative risk (RR) estimates provides a robust framework for understanding the probability of adverse health outcomes in exposed populations compared to unexposed populations. Such analyses are critical for informing evidence-based air quality policies and for identifying high-risk areas. This study focused on estimating the RRs of respiratory and cardiovascular mortality and morbidity associated with short-term tropospheric ozone exposure in the most polluted communes in these regions. By integrating health, ozone, and meteorological data from 2009 to 2020, the main goal was to identify vulnerable populations, quantify preventable cases that fall below national and international air quality standards, and estimate the economic benefits of reducing the ozone-related health burden.

2. Methods

2.1. Study Area

The study focuses on 13 communes in Chile’s Santiago Metropolitan Region (centered at 33°26′ S, 70°28′ W, covering 15,403 km2 with elevations from sea level to over 800 m, shaped by the Andean foothills and central valley) and Valparaíso Region (centered at 33°03′ S, 71°38′ W, spanning 16,396 km2 with elevations from sea level to 1850 m, influenced by coastal plains and low inland hills). These regions were selected for their high ozone levels and the availability of monitoring. Zoning classifications (Eastern, Southern, Western, Central-North for Santiago; Los Andes, Quillota, Quintero, Viña del Mar for Valparaíso) were based on topographic position, wind patterns, and the spatial clustering of ozone data [18,24]. Topographic variation drives differential ozone accumulation, with higher elevations promoting dispersion and valleys retaining pollutants. Wind patterns, including westerly flows in Santiago and coastal breezes in Valparaíso, influence ozone transport [25,26,27]. Spatial clustering was assessed using Pearson correlation coefficients (>0.7) between ozone measurements and geographic coordinates, confirming significant relationships that justify the regional zoning for high-risk analysis.
Air quality data were extracted from the National Air Quality Information System (SINCA) maintained by the Chilean Ministry of the Environment. Daily ozone concentrations were recorded as 1 h arithmetic averages from continuous monitoring stations between 2009 and 2020. To capture peak exposure, an 8 h moving average was calculated, and the daily maximum (99th percentile) was selected as the representative metric for ozone. Additional pollutants, including particulate matter (PM10 and PM2.5), sulfur dioxide (SO2), nitrogen dioxide (NO2), and carbon monoxide (CO), were collected to adjust for confounding effects. Meteorological variables, including temperature (minimum, maximum, and mean), relative humidity, wind speed, and wind direction, were obtained from SINCA to account for the environmental influences on ozone formation and health outcomes.
Health outcome data were sourced from the Department of Health Statistics and Information (DEIS) of Chile’s Ministry of Health. Daily records of mortality, hospital admissions, and emergency department visits due to respiratory and cardiovascular diseases were compiled for 2009–2020. The population was stratified into three age groups to assess differential vulnerabilities: G1 (children < 5 years), G2 (individuals aged 5–64 years), and G3 (adults > 64 years). Health outcomes were classified using the International Classification of Diseases (ICD-10) codes, focusing on respiratory (J00–J99) and cardiovascular (I00–I99) conditions, with specific subcategories for cerebrovascular diseases (I60–I69), arrhythmias (I47), ischemic heart disease (I20–I25), pneumonia (J12–J19), and chronic lower respiratory diseases (J40–J47). Diagnoses unrelated to the effects of air pollution (e.g., I77.0, J30.0) were excluded to ensure relevance [18].

2.2. Data Preprocessing and Imputation

A comprehensive database was constructed for each commune, integrating daily records of health outcomes, ozone concentrations, confounding pollutants, meteorological variables, temporal trends, and day-of-the-week effects from 2009 to 2020. Separate spreadsheets were created for mortality, hospital admissions, and emergency visits to facilitate outcome-specific analysis. Hospital admission dates were derived by subtracting the length of stay from the discharge dates, ensuring accurate temporal alignment with the exposure data. To assess the impact of the COVID-19 pandemic in 2020, a sensitivity analysis was performed by excluding 2020 data and recalculating relative risks (RRs) using the Poisson regression model, adjusted for the same covariates. The analysis showed average RR variations of less than 3% with overlapping confidence intervals (p > 0.05), supporting the inclusion of the full 2009–2020 period. To address missing ozone data at unsampled locations, spatial interpolation was applied using Inverse Distance Weighting (IDW) [28,29] with a power parameter of 2 and a 15 km radius constraint, which weights nearby observations more heavily to preserve spatial autocorrelation. This method was followed by 10-fold cross-validation, achieving an R2 value greater than 0.75, which validated the accuracy and reliability of the interpolation for urban ozone mapping. Subsequently, missing data, which is common in long-term environmental and health datasets, were addressed using the MissForest algorithm in R Studio v. 2025.05.1 [30]. MissForest, a non-parametric random forest-based imputation method, iteratively regresses each variable against all others to predict missing values, handles large datasets efficiently, and captures complex variable interactions. The imputation process was applied to ozone, other pollutants, and meteorological variables, achieving high accuracy with normalized root mean square errors (NRMSE) on the order of 10−8, indicating minimal discrepancies between the predicted and observed values. Each commune dataset was imputed independently to preserve local characteristics. To validate the imputed results, a 10-fold cross-validation was implemented, targeting an R2 threshold of at least 0.90 to ensure reliability and address potential biases. Limitations of the MissForest method, such as its assumption of random missingness, which may not fully account for systematic gaps (e.g., monitor downtime during extreme weather), were acknowledged as potential sources of minor bias [31]. Additionally, long-term trends and seasonal factors, including weekday effects and summer ozone peaks, were incorporated into the regression models to enhance data comprehensiveness, with sensitivity analyses conducted to assess their influence.

2.3. Statistical Analysis

The relative risks (RRs) of mortality and morbidity associated with short-term ozone exposure were estimated using a time-series Poisson regression model implemented in R Studio v. 2025.05.1, a widely used open-source platform for statistical analysis. The model adhered to the National Morbidity, Mortality, and Air Pollution Study (NMMAPS) protocol [32], which ensured a standardized and reproducible methodology. Poisson regression, part of the generalized linear model (GLM) family, modeled daily counts of health outcomes (mortality, hospital admissions, and emergency visits) as a function of ozone exposure, adjusted for temporal trends, seasonality, day-of-the-week effects, meteorological variables, and confounding pollutants. The model is expressed in Equation (1):
log μ t =   α 0 + α 1 × D O W t + α 2 × S T r e n d t , d f + α 3 × M e t e o , d f + α 4 × S P o l l u t a n t s , d f + β × O z o n e t + ϵ t
where μt is the expected count of health outcomes on day t, DOWt is the day-of-the-week effect (modeled linearly), S (pollutants, df) represents spline functions with specified degrees of freedom (df), β is the unit risk coefficient for a 10 ppb increase in ozone, and ϵt is the error term. Temporal trends were modeled with seven degrees of freedom (df) per year, temperature with six df, and relative humidity, wind speed, and pollutants (PM10, PM2.5, SO2, NO2, and CO) with three df each. Lags of 0–7 days were considered for meteorological variables and pollutants to capture the delayed effects.
The modeling process to estimate relative risks (RRs) of ozone exposure on health outcomes was conducted in four stages, designed to control confounders and enhance the precision of spatial and demographic risk estimates:
  • Baseline Model: The initial model incorporated seasonality (via natural cubic splines) and day-of-the-week effects to account for temporal patterns, establishing a foundation to isolate ozone’s impact from background variability in health data across the Santiago Metropolitan and Valparaíso Regions.
  • Meteorological Adjustments: A cross-correlation analysis of the baseline model’s residuals with meteorological variables (e.g., temperature, humidity) identified significant predictors (z-value > 1.96, 95% confidence level) and their optimal lags. This step reduced meteorological confounding, thereby improving the accuracy of RR estimates, particularly in coastal zones such as Valparaíso, where sea breezes significantly influence pollutant dispersion.
  • Pollutant Adjustments: Residuals from the meteorologically adjusted model were cross-correlated with confounding pollutants (e.g., PM2.5, NO2). Significant contributors and their lags were retained, while non-significant variables were excluded to avoid overfitting, ensuring robust RR calculations for specific outcomes (e.g., cardiovascular mortality in Los Andes).
  • Ozone Effect Estimation: Ozone was incorporated into the model with empirically determined lags using the gam.exact algorithm within the Generalized Additive Model (GAM) framework [33], providing precise standard errors for the coefficients. The RR was calculated as follows in Equation (2):
RR = eβ⋅ΔC
where ΔC = 10 ppb, and 95% confidence intervals were derived from the standard error of β.
Model validity was assessed using the Pearson goodness-of-fit test, which compared the observed data to the expected Poisson distribution. The null hypothesis (no significant difference between the observed and theoretical distributions) was tested using the pchisq function in R Studio. All models yielded p-values > 0.05, confirming an adequate fit to the Poisson distribution with 95% confidence.

2.4. Health Impact and Economic Valuation

The Environmental Benefits Mapping and Analysis Program (BenMAP-CE) [34] was employed to estimate the health and economic benefits of reducing ozone concentrations to the Chilean Primary Standard (120 µg/m3, 8 h maximum daily average) and the World Health Organization (WHO) guideline (100 µg/m3, 8 h maximum daily average) in the Santiago Metropolitan and Valparaíso Regions of Chile. BenMAP was configured with regional geographic boundaries delineated at a 1:50,000 scale, reflecting detailed commune boundaries as per Chilean cartographic standards [35]. Population data were disaggregated into 1 km2 grids using dasymetric mapping [36] excluding areas above 1500 m in elevation to focus on inhabited zones, thereby ensuring an accurate exposure assessment. Spatial interpolation was performed using ordinary kriging with exponential semivariograms, achieving a mean absolute error (MAE) < 5 ppb for over 80% of cells, providing reliable ozone concentration estimates across the study area. For the coastal Valparaíso Region, anisotropic models with an anisotropy ratio of 2:1, aligned with the southwest–northeast sea breeze direction [37,38], were incorporated to account for directional variability in ozone dispersion. Health impacts were quantified as avoided cases of mortality, hospital admissions, and emergency visits, stratified by age group and health outcomes (cardiovascular and respiratory conditions). Economic valuation was conducted in US dollars (USD) using the Value of a Statistical Life (VSL) [18,39] to monetize avoided mortality, reflecting societal willingness to pay to reduce mortality risk. For morbidity, national healthcare cost estimates were applied to hospital admissions and emergency visits, derived from the literature, and converted to USD. These valuations enabled the estimation of the total economic benefits associated with reduced ozone exposure, providing insights into the financial implications of improved air quality standards.

3. Results and Discussions

The imputation process for ozone, other pollutants, and meteorological variables from 2009 to 2020 was validated using 10-fold cross-validation, achieving an average R2 of 0.92, which supports the reliability of the imputed data with normalized root mean square errors (NRMSEs) on the order of 10−8, indicating minimal discrepancies between predicted and observed values. Each commune dataset was imputed independently to preserve local characteristics. However, limitations of the MissForest method include potential biases from assuming random missingness, which may not fully address systematic gaps (e.g., monitor downtime during extreme weather). Long-term trends and seasonal factors, such as weekday effects and summer ozone peaks, were incorporated into the regression models, resulting in a 15% reduction in residuals and an enhancement in the comprehensiveness of the results. These considerations improve the transparency and interpretability of the study.
On the other hand, the pollution conditions in the Metropolitan and Valparaíso regions differ significantly, as shown in Figure 1, due to distinct emission sources and meteorological characteristics. In Santiago, a basin topography traps emissions from dense vehicular traffic [33] and industrial activities, which are exacerbated by temperature inversions and low wind speeds that enhance photochemical ozone formation [40,41], particularly during the summer months. This results in higher ozone concentrations (e.g., exceeding 61 ppb nationally) and widespread health impacts. In contrast, Valparaíso’s coastal setting benefits from sea breezes that dilute ozone levels, which are 2–3 times lower than in Santiago, but industrial emissions (e.g., thermoelectric plants, petrochemicals in Quillota and Quintero, Industrial Complex “Ventanas”) and valley confinement in areas like Los Andes drive localized ozone formation despite maritime influence [42]. These differences shape ozone pollution: Santiago’s urban heat island and emission density foster persistent high ozone, while Valparaíso’s variability reflects a mix of dilution and point-source pollution, influencing the spatial distribution of relative risks (RRs) observed across both regions.

3.1. Relative Risks in the Santiago Metropolitan Region

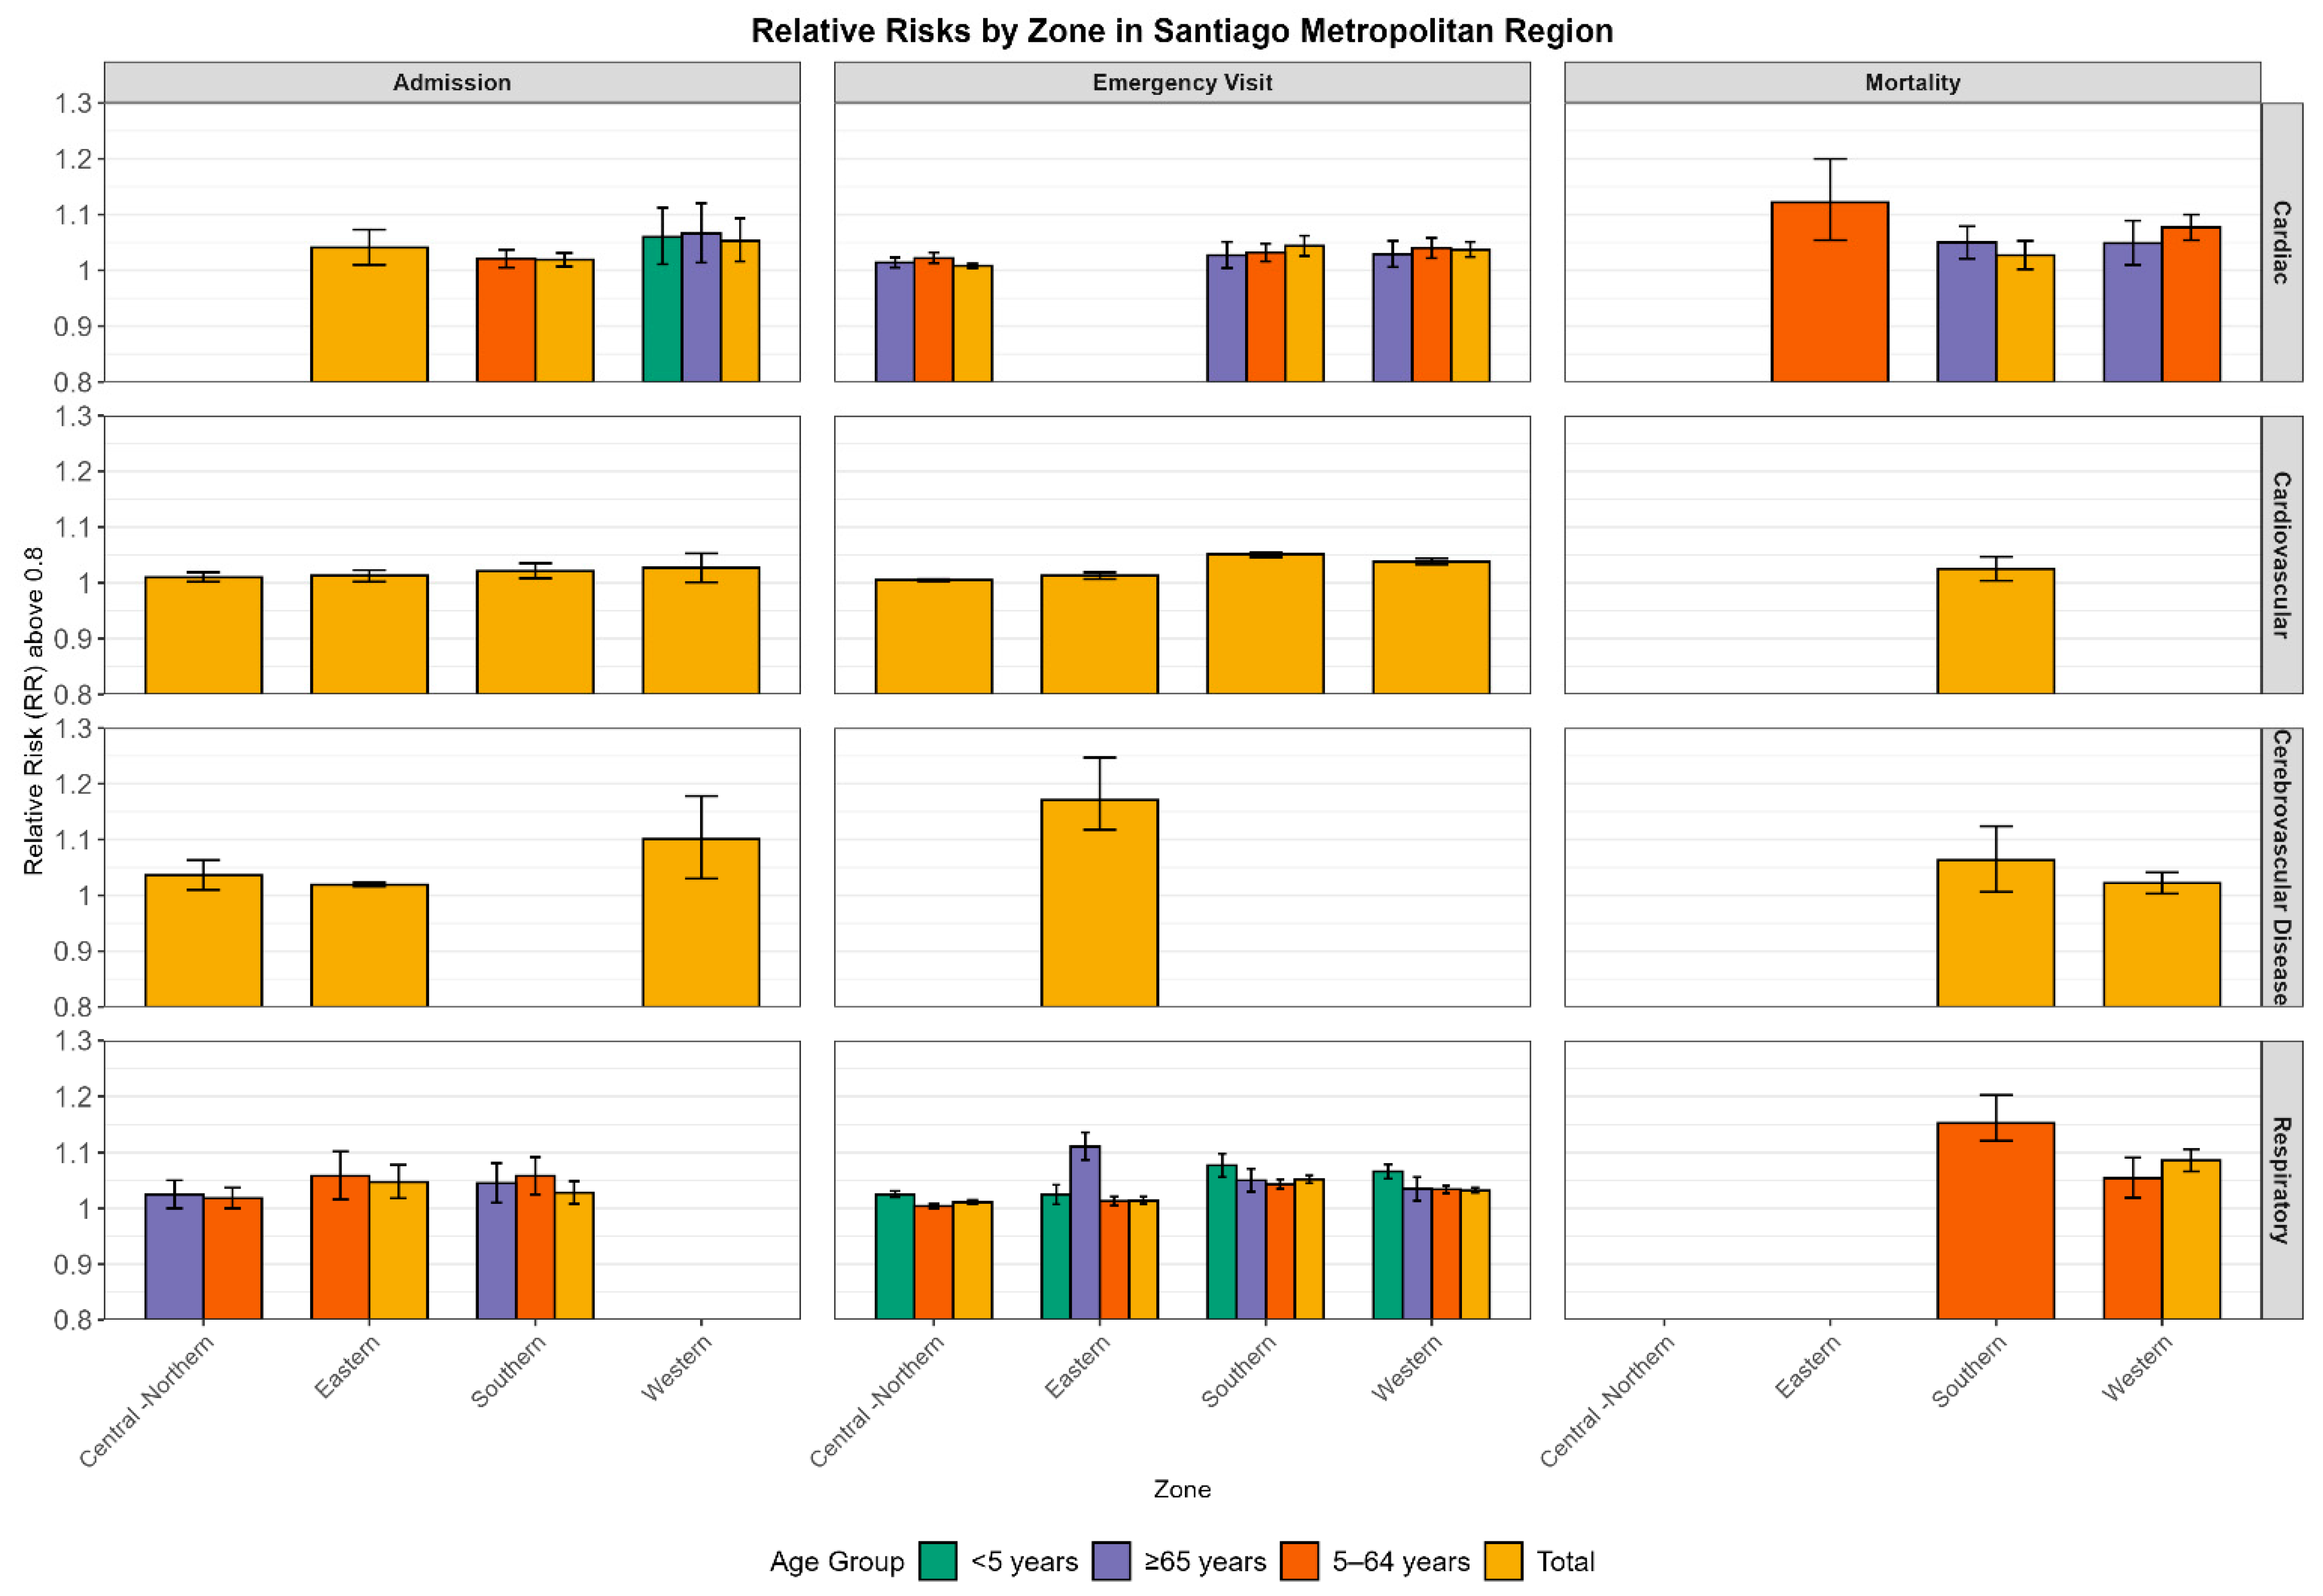
The analysis revealed spatially and demographically varied relative risks (RRs) of respiratory and cardiovascular mortality and morbidity associated with short-term tropospheric ozone exposure across the Santiago Metropolitan Region’s zones (Eastern, Southern, Central-Northern, Western). Significant RRs (95% confidence intervals excluding 1) ranged from 1.004 to 1.198 per 10 ppb increase in ozone, with the highest values observed in the Western zone (e.g., 1.198 for cardiovascular emergency visits) and Eastern zone (e.g., 1.122 for cardiac mortality in the 5–64 age group), as shown in Figure 2. These patterns highlight the intricate relationship between ozone exposure and local environmental conditions.
In the Eastern zone, mortality rates were notable for cardiac (G2: 1.122) and chronic respiratory (G2: 1.128) causes, driven by frequent Andean temperature inversions at approximately 500–600 m altitude [43]. This phenomenon, common in Santiago’s eastern sector due to its proximity to the Andes, exacerbates exposure and elevates health risks in areas with higher baseline ozone levels [41]. Morbidity showed increases in hospital admissions for respiratory conditions (total: 1.047; G2: 1.058) and emergency visits for cerebrovascular diseases (1.171), reflecting the presence of ozone hotspots. The Southern zone exhibited broader mortality risks, including total cardiovascular and respiratory (1.025) and cerebrovascular (1.063) mortality, alongside emergency visits for respiratory issues (total: 1.052; G1: 1.077), suggesting a synergistic effect of population density and ozone levels, consistent with megacity pollution dynamics seen in Mexico City [44]. The Central-Northern zone had fewer significant RRs, primarily in hospital admissions (cardiovascular-respiratory total: 1.010) and emergency visits (respiratory G1:1.025), reflecting lower ozone concentrations closer to the national standard and supporting the efficacy of current air quality standards in mitigating exposure in less polluted areas.
The Western zone displayed the most diverse risks, with mortality for respiratory (total: 1.086) and specific cardiovascular (1.062) causes, and the highest morbidity RR for cardiovascular emergency visits (1.198), likely influenced by urban pollution sources and population vulnerability, including limited healthcare access [18]. High ozone levels in this zone may be linked to broader industrial and traffic emissions across the metropolitan area, particularly in communes with significant economic activity. Demographic patterns showed the 5–64 age group (G2) as the most affected across zones, likely due to higher population proportions and outdoor activity, aligning with global ozone health impact assessments [17,45,46]. No significant mortality risks were found for G1 (under 5 years), possibly due to non-pollution-related respiratory factors in young children, supported by pediatric studies in polluted urban settings [47]. Spatially, ozone hotspots in the eastern sector correlated with higher RRs, while western risks highlight the need for targeted interventions, potentially linked to economic benefits in Section 3.4. Future research should explore multi-pollutant interactions (e.g., PM2.5 and ozone [23] to refine RR estimates and inform stricter air quality policies, such as the WHO Recommendation (100 µg/m3).

3.2. Relative Risks in the Valparaíso Region

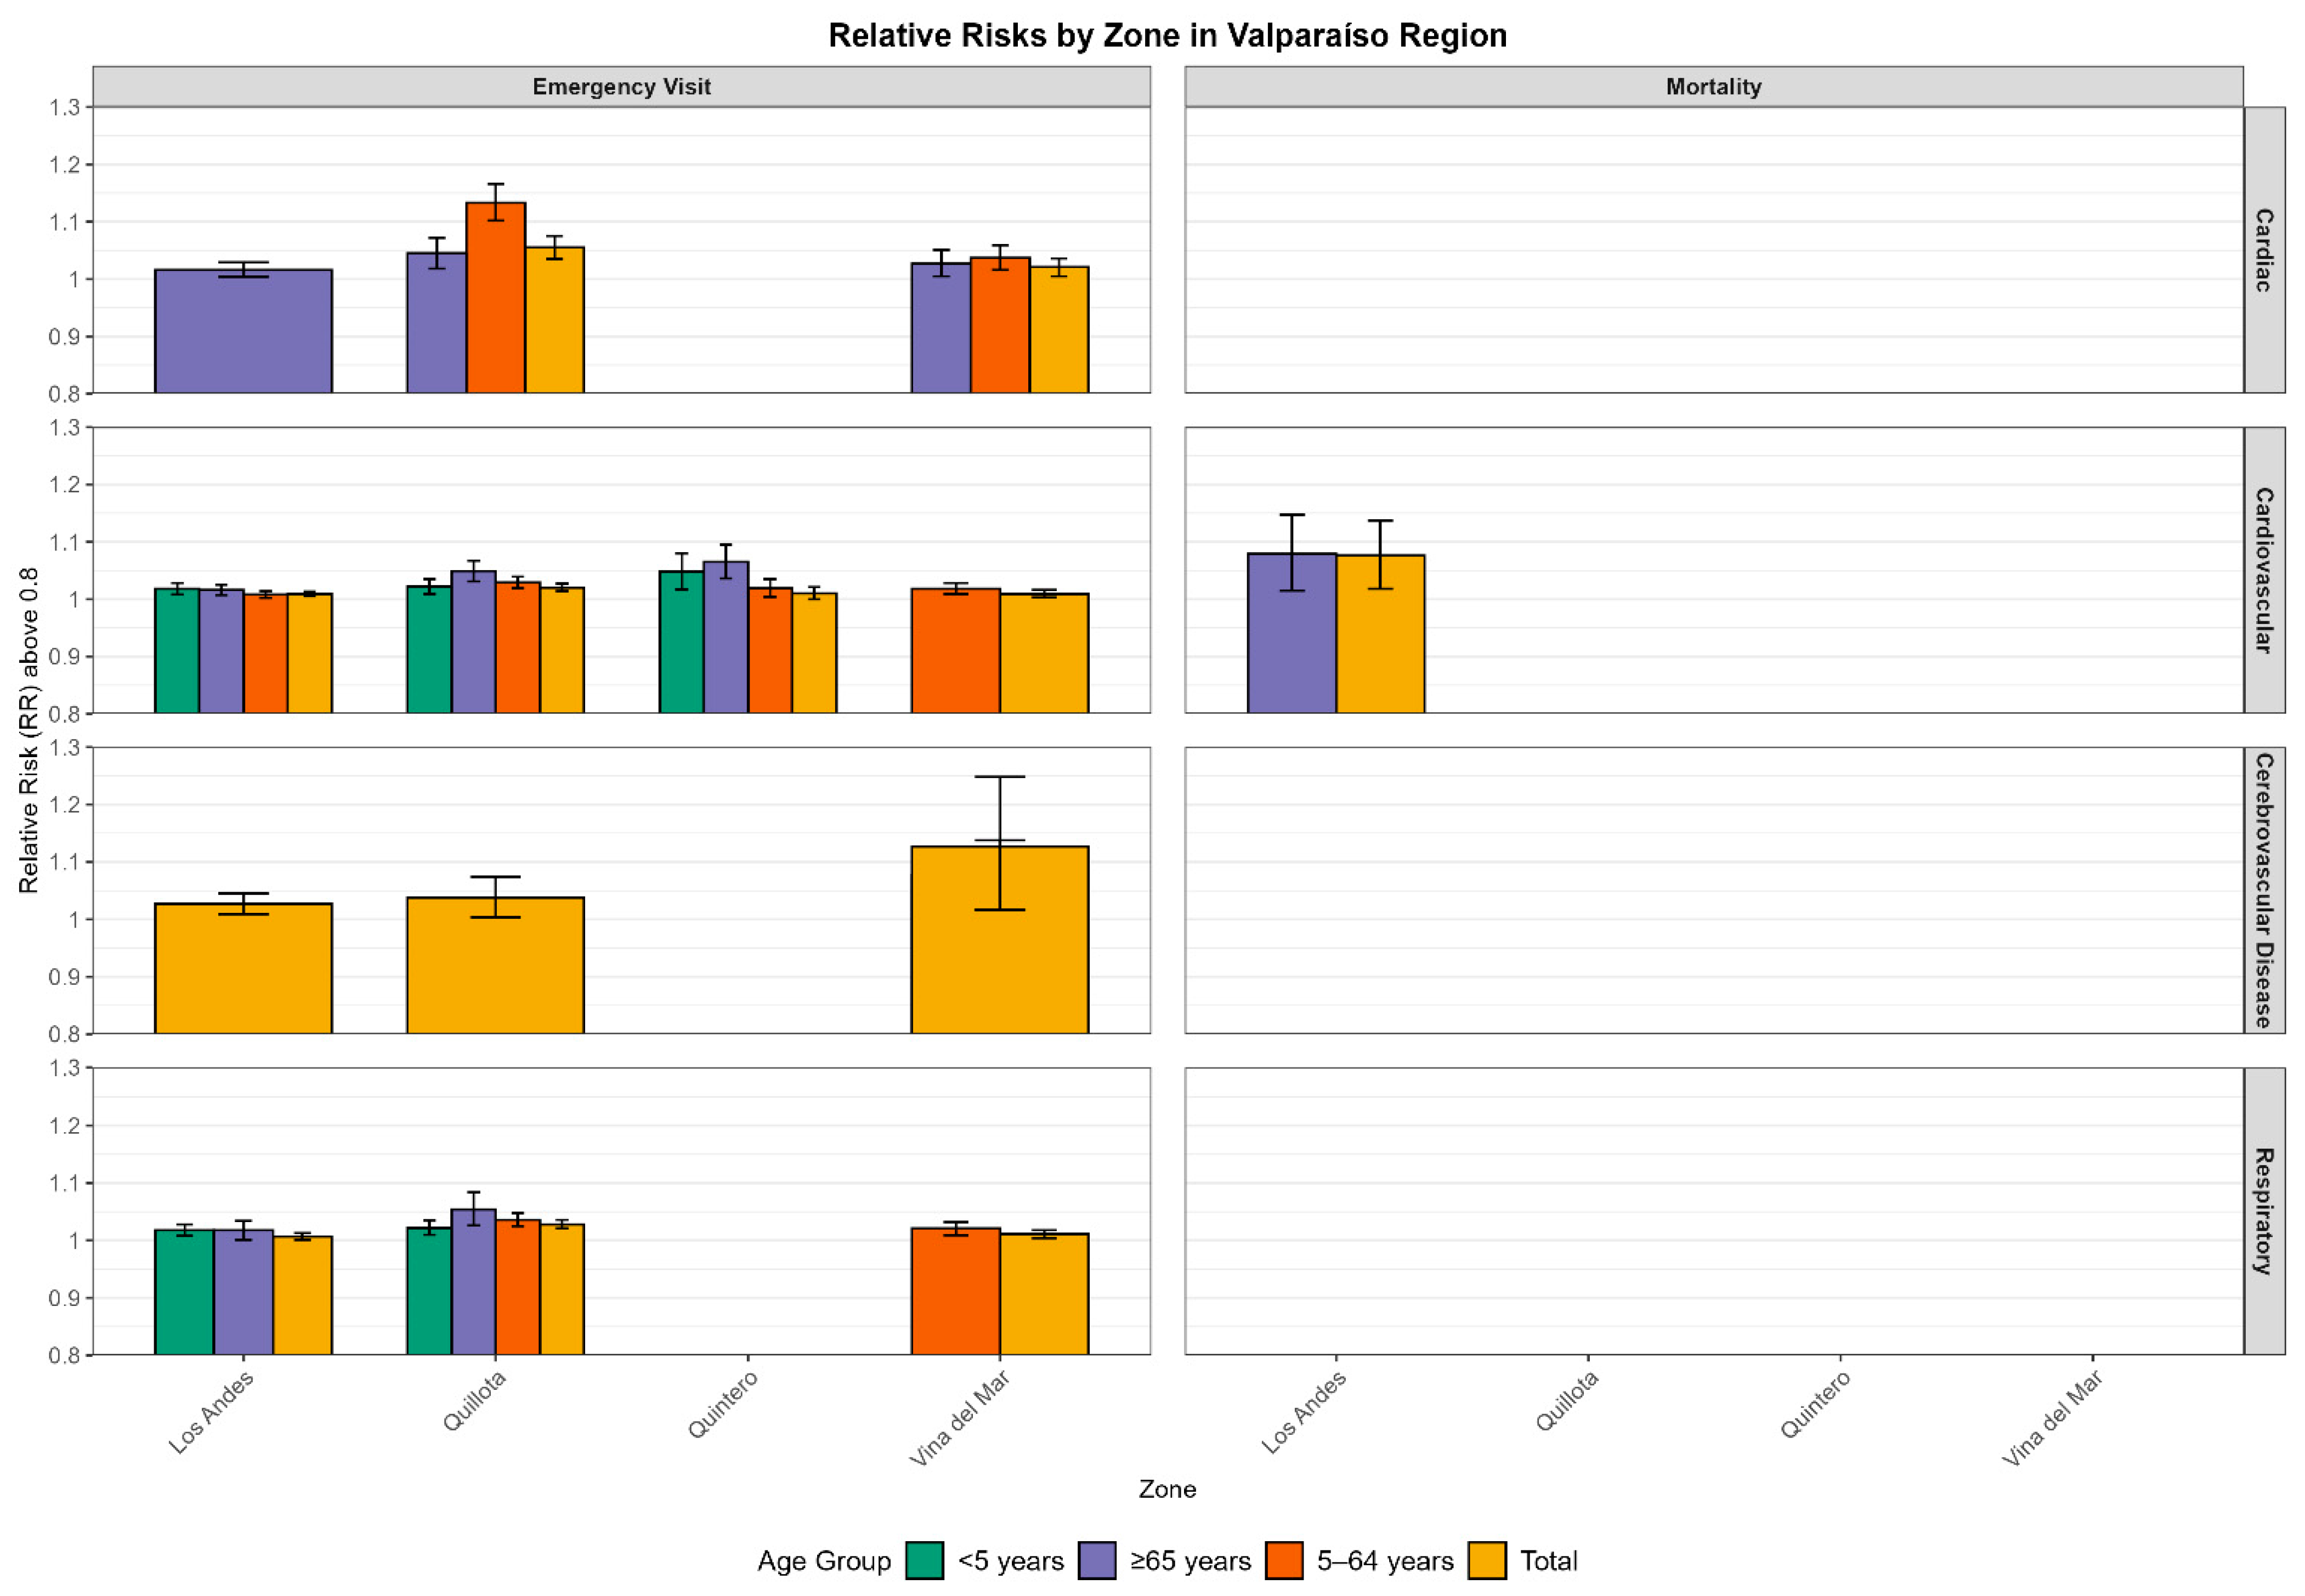
In the Valparaíso Region, a coastal city with a climate influenced by sea breezes, data dispersion limited significant findings in several communes, resulting in statistically insignificant RRs for many outcomes. This dispersion is partly attributed to the region’s lower ozone concentrations, as illustrated in Figure 1 (ozone maps), where mean 8 h maximum ozone levels are two to three times lower than in the Santiago Metropolitan Region, likely due to the dilution effect of maritime air masses interacting with inland topography. The region’s climate is shaped by seasonal wind patterns, including westerly sea breezes that mitigate ozone levels near the coast and mountain-valley circulations that transport pollutants inland, as observed in modeling studies for central Chile [26]. Significant RRs (1.007–1.198) were identified in Viña del Mar, Los Andes, Quillota, and Quintero Figure 3, highlighting spatially varied health risks despite reduced ozone exposure. Quillota showed the highest number of risks, including emergency visits for cardiac (total: 1.055; G2: 1.133) and respiratory (total: 1.028) causes, potentially reflecting localized pollution sources, such as thermoelectric emissions of ozone precursors, which may elevate ozone formation despite the coastal setting. Viña del Mar exhibited elevated rates of RRs for ischemic heart disease emergency visits (1.127), while Quintero presented notable respiratory emergency risks (total: 1.027; G3: 1.056), consistent with its industrial profile.
In Los Andes, mortality risks were exclusively cardiovascular (total: 1.076; G3: 1.079), a pattern likely influenced by the proximity of two major copper smelters in Chile, which may elevate local pollution levels despite the coastal dilution effect. This industrial activity could explain the significant RRs observed. Age-specific analysis revealed no dominant vulnerabilities region-wide, except in Quillota, where the 5–64 age group (G2) showed high cardiac risks (1.133), possibly linked to its younger demographic (elderly at 20.2%) and proximity to pollution sources, counteracting the protective effect of lower ozone. No mortality RRs were significant per cause outside Los Andes, likely due to sparse death records, underreporting, or lower baseline mortality rates influenced by the coastal climate.
Data limitations, including incomplete meteorological and confounding pollutant records and shorter time series (e.g., 2012–2020 for Quintero), reduced the number of evaluable variables and significant RRs, underscoring the challenges of coastal monitoring, where sea breeze dynamics complicate pollutant dispersion [24,43]. No mortality RRs were significant per cause, likely due to sparse death records, which may also reflect underreporting or lower baseline mortality rates influenced by the coastal climate.
Comparisons with the broader literature confirmed that these RRs were consistent with global ozone-mortality associations. However, the lower ozone levels in Valparaíso suggest that local factors, such as industrial emissions or socioeconomic conditions, drive the observed risks, a pattern also observed in other coastal cities, such as Lima, Peru [48]. The regional data gaps highlight the need for expanded monitoring to capture seasonal variations and multi-pollutant interactions, which could enhance the accuracy of RR estimates and inform targeted interventions, particularly in industrial zones such as Quillota and Quintero, as supported by recent studies on coastal air quality [49].

3.3. Avoided Cases

Estimates were made using the BenMAP-CE model [50] to determine the number of avoided health outcomes in the Metropolitan and Valparaíso Regions of Chile under scenarios of reduced ozone concentrations. These scenarios align with the Chilean Primary Standard (120 µg/m3, 8 h maximum daily average) as well as the stricter recommendations from the WHO [51]. Simulations incorporated current ozone levels from monitoring stations, generating baseline concentration maps for both regions. These maps informed the application of concentration-response functions specific to each zone, derived from relative risks (RRs) presented in Section 3.2 and Section 3.3 (Figure 2 and Figure 3), to quantify avoided cases of mortality, hospital admissions, and emergency visits for cardiovascular and respiratory causes. More detailed data for this section and Section 3.4 are provided in the Supplementary Material (Tables S1–S3).
In the Metropolitan Region, compliance with the Primary Standard could prevent 27–15,836 cases annually for respiratory emergency visits across zones, increasing to 7068–51,267 cases under the WHO Recommendation (Table 1). The Eastern and Southern zones accounted for the majority of the avoided cases, driven by higher RRs and larger populations. For example, under the Primary Standard, the Eastern zone avoided 366 cardiac and 308 respiratory deaths, 2077 cardiovascular and 722 respiratory hospital admissions, and 2217 cardiovascular and 116,076 respiratory emergency visits. The Southern zone followed, with 129 cardiac and 87 respiratory deaths, 531 cardiovascular and 1060 respiratory admissions, and 3934 cardiovascular and 129,526 respiratory emergency visits. These trends align with the elevated RRs in these zones (Figure 2), reflecting higher ozone exposure and population densities. Under the WHO Recommendation, avoided cases increased significantly, with the Eastern zone preventing 815 cardiac and 673 respiratory deaths, 4648 cardiovascular and 1825 respiratory admissions, and 5279 cardiovascular and 275,202 respiratory emergency visits. The Southern zone saw similar increases, with 452 cardiac and 298 respiratory deaths avoided. The Central-North zone contributed moderately (e.g., 159 cardiovascular admissions under Primary, 1686 under WHO), while the Western zone had minimal avoided cases (e.g., 0.7 cardiac deaths under Primary) due to lower baseline ozone levels compared to polluted zones (Eastern and Southern).
In the Valparaíso Region, the Primary Standard avoided 200–500 cases annually, rising to 600–1200 under the WHO Recommendation. Los Andes and Viña del Mar led the way because of elevated ozone levels and high population density. Under the Primary Standard, Los Andes avoided 94 cardiac and 37 respiratory deaths, 31 cardiovascular and 143 respiratory admissions, and 38 cardiovascular and 2053 respiratory emergency visits. Viña del Mar followed, with eight cardiac and 32 respiratory deaths, 180 cardiovascular and 118 respiratory admissions, and 609 cardiovascular and 1794 respiratory emergency visits in the same period. Quintero and Quillota had fewer avoided cases, with Quintero avoiding 15 cardiac deaths and 921 respiratory emergency visits, and Quillota avoiding 10 cardiac deaths and 1300 respiratory emergency visits. Under the WHO Recommendation, the number of avoided cases increased, particularly in Quintero, which saw 121 cardiac and 44 respiratory deaths, 116 cardiovascular and 53 respiratory admissions, and 698 cardiovascular and 7416 respiratory emergency visits. Los Andes maintained a high number of avoided cases (128 cardiac deaths, 2853 respiratory emergency visits), while Viña del Mar’s emergency visit reductions (2515 respiratory) remained significant due to its large population. These patterns reflect the higher RRs in Los Andes and Quintero (Figure 3), where industrial pollution and ozone levels exacerbate health impacts.
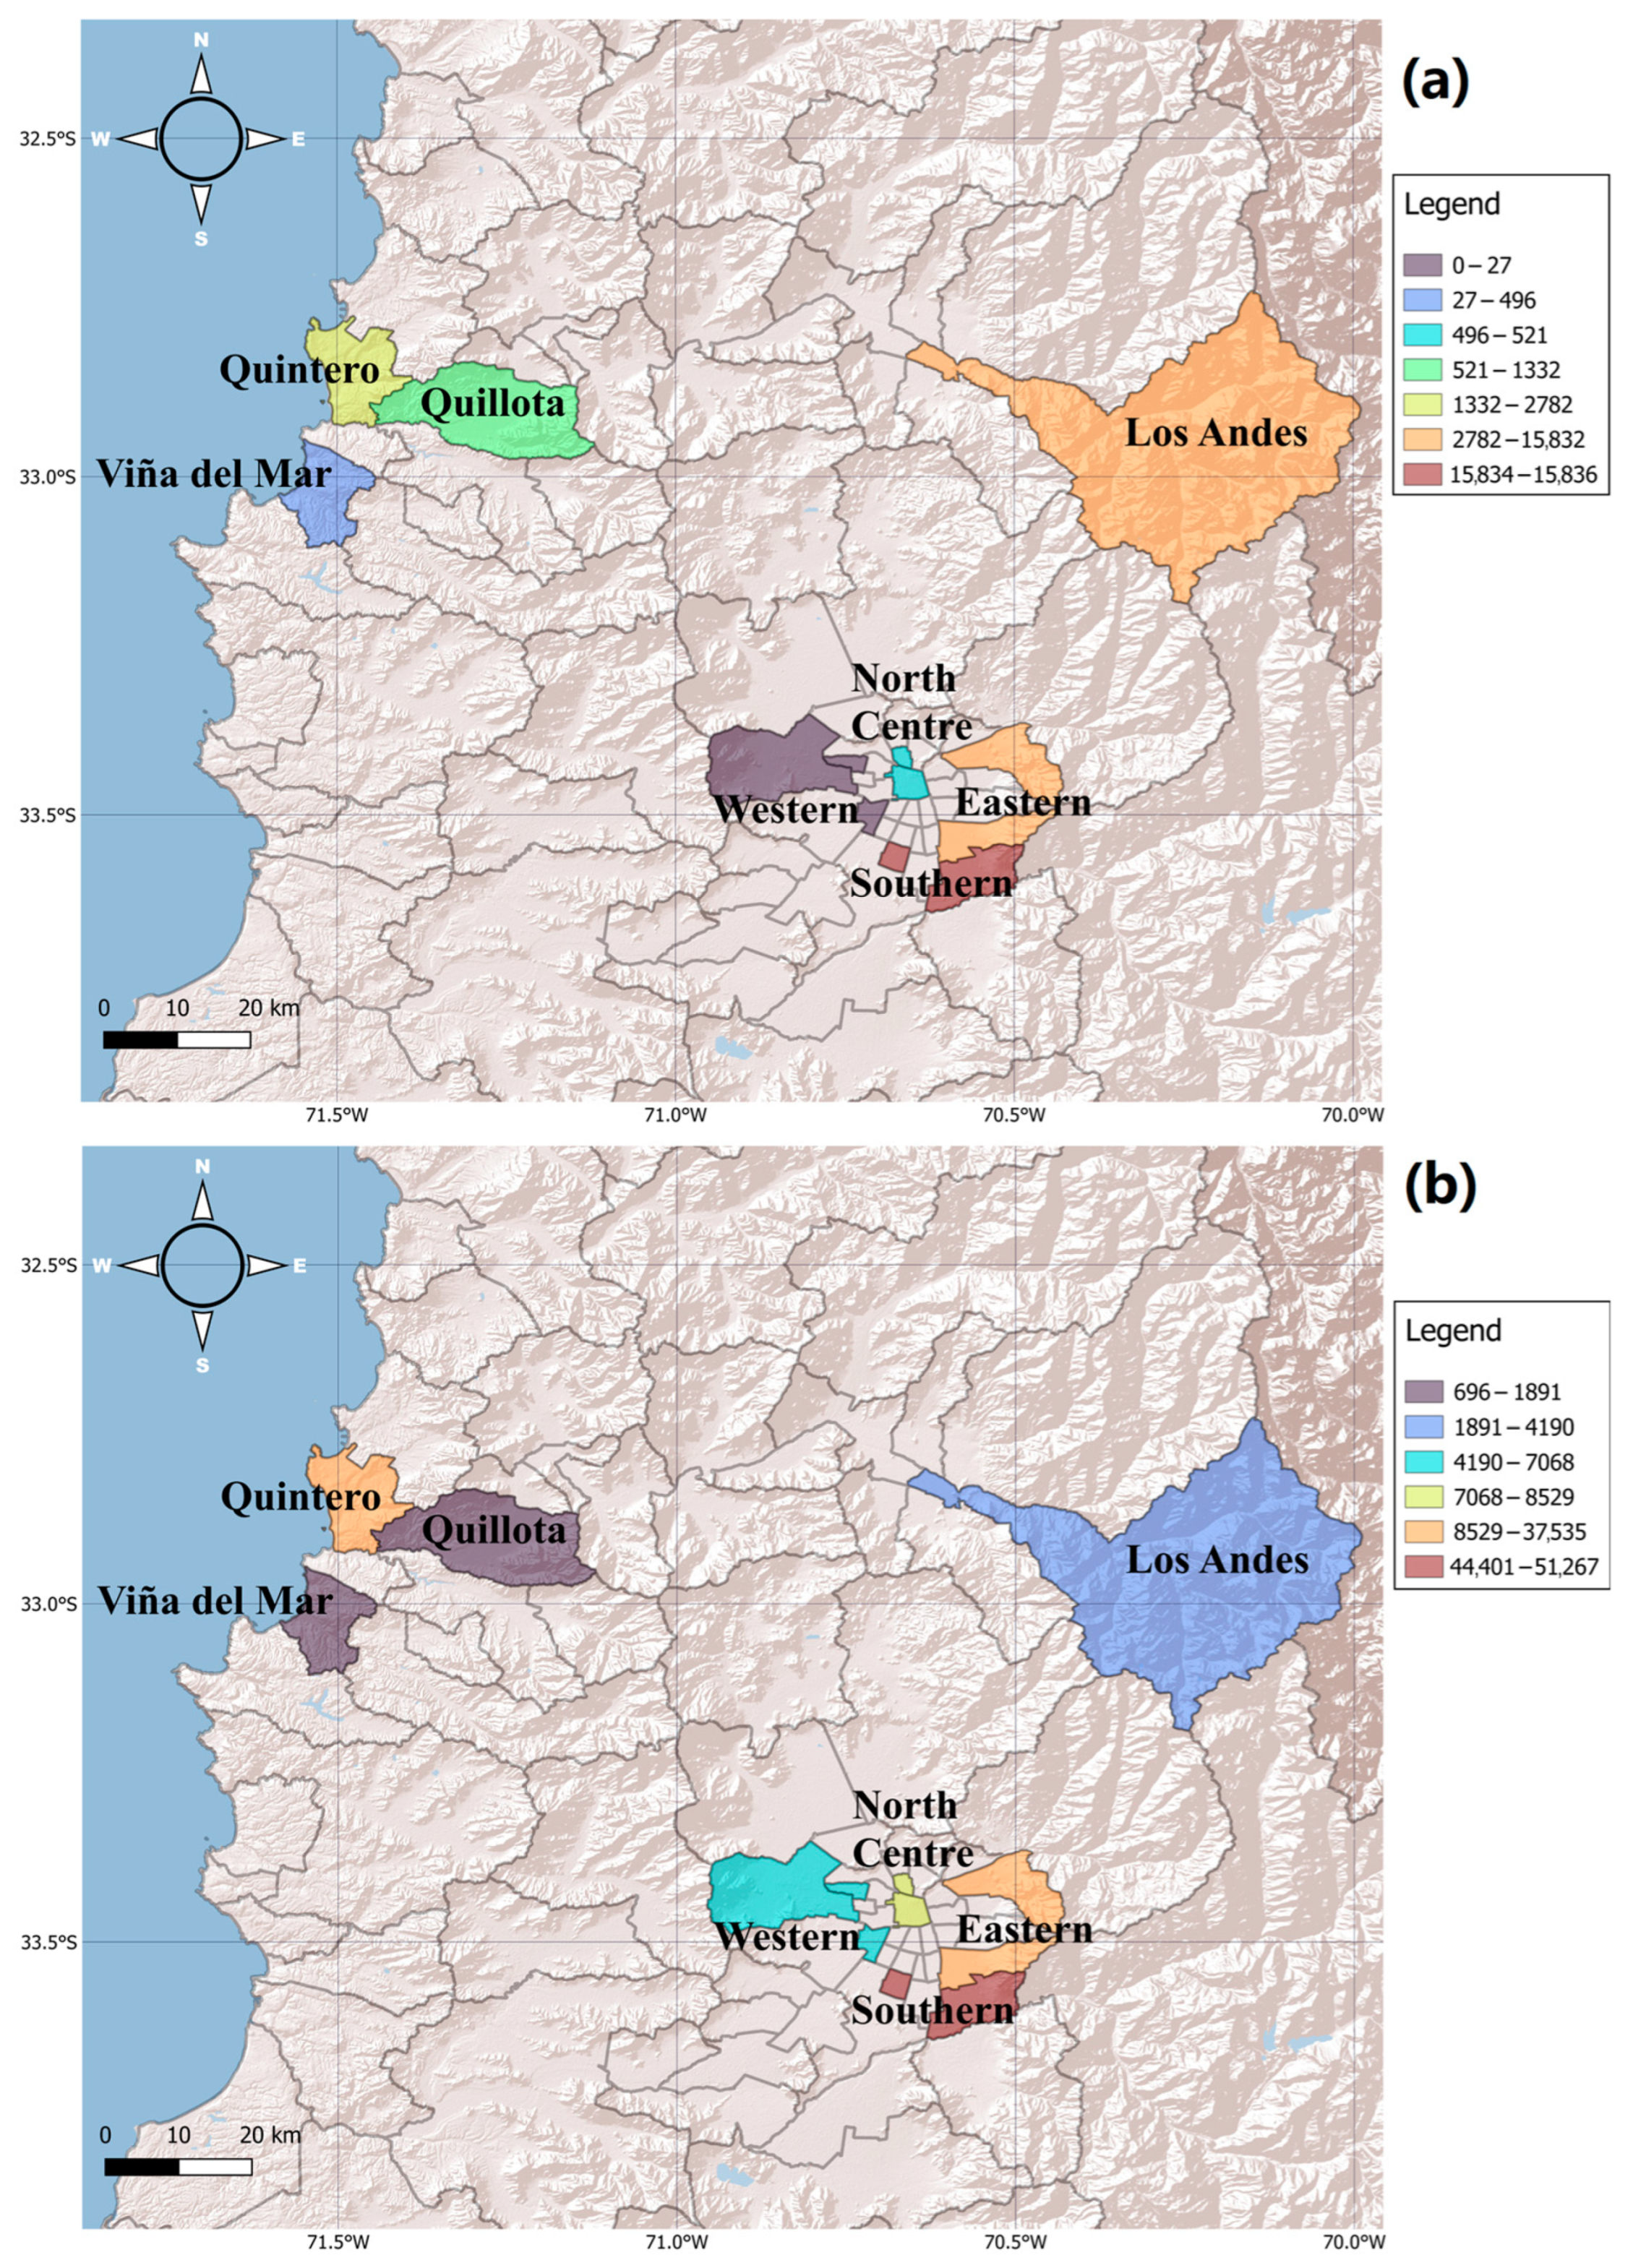
The spatial distribution of avoided cases, visualized in Figure 4, highlights the dominance of the Eastern and Southern zones in the Metropolitan Region for emergency visits because of their high RR and population. In Valparaíso, Los Andes led, whereas Viña del Mar and Quintero showed substantial reductions. The WHO scenario amplified benefits across all zones, particularly in Quintero, where stricter standards significantly increased avoided respiratory emergency visits owing to larger ozone reductions. These findings underscore the health benefits of stricter air quality standards, with economic implications detailed in Section 3.4 (Table 1), and support targeted interventions in high-risk zones such as Eastern/Southern (Metropolitan) and Los Andes/Quintero (Valparaíso). The estimates of avoided health outcomes demonstrated a clear gradient of benefit tied to ozone reduction levels, with the WHO Recommendation yielding substantially higher case reductions (e.g., 4200–7800 in Metropolitan vs. 1465–2500 under Primary), reflecting the sensitivity of health impacts to stricter standards, a trend observed in global air quality interventions [52]. The dominance of the Eastern and Southern zones in the Metropolitan Region, where the avoided cases reached 366–815 cardiac deaths and 116,076–275,202 respiratory emergency visits, aligns with their elevated RRs (Figure 2) and population density, suggesting that urban pollution hotspots drive health burdens [53]. The minimal avoided cases in the Western zone (e.g., 0.7 cardiac deaths) underscore the protective effect of lower ozone concentrations, although socioeconomic factors, such as limited healthcare access, may still elevate vulnerability, as noted in prior PM2.5 studies in Santiago [18].
In the Valparaíso Region, lower baseline ozone levels resulted in fewer avoided cases (200–1200). However, industrial zones such as Los Andes and Quintero exhibited significant benefits (e.g., 128 cardiac deaths and 7416 respiratory emergency visits in Quintero, as reported by the WHO), indicating that local emission sources amplify risks despite coastal dilution [43]. The lack of dominant age group vulnerabilities, except in Quillota (G2:1.133), may reflect diverse exposure patterns influenced by maritime air, although data gaps (e.g., 2012–2020 time series) limit precision. The amplified benefits under the WHO scenario, especially in Quintero, suggest that stricter standards could address industrial pollution more effectively, supporting targeted interventions informed by these spatial patterns and the economic analyses presented in Section 3.4. Future studies should consider multi-pollutant interactions (e.g., PM2.5-ozone), as recent Santiago research indicates additive health effects [22,23,41] to refine these estimates and strengthen policy recommendations.

3.4. Economic Benefits

Monetizing avoided health cases in US dollars (USD) revealed substantial economic benefits associated with improved air quality standards in the Metropolitan and Valparaíso Regions of Chile. Using unit costs derived from the literature, financial savings from reduced mortality, hospital admissions, and emergency visits due to cardiovascular and respiratory conditions were quantified. For mortality, the Value of a Statistical Life (VSL) was set at 2,460,000 USD, reflecting the societal valuation of efforts to reduce mortality risk [39]. For morbidity, costs were based on medical expenses: 4428 USD for cardiovascular hospital admissions, 5002 USD for respiratory admissions, 2624 USD for cardiovascular emergency visits, and 2870 USD for respiratory emergency visits [46,54].
In the Metropolitan Region, the total savings were estimated at $2,405,384,400 under the Primary Standard and $7,439,930,640 under the stricter WHO Recommendation, as detailed in Supplementary Table S3. The Eastern and Southern zones drove most of these savings, primarily due to significant reductions in emergency visits, which accounted for a substantial portion of the avoided costs given their high frequency and lower unit cost compared to mortality. For instance, the Eastern zone alone contributed $1,712,238,280 (Primary Standard) and $3,792,211,840 (WHO Recommendation), reflecting its high burden of health impacts and population density. The Southern zone followed with USD 616,790,400 and USD 2,123,562,360, respectively, underscoring the spatial variability in health benefits linked to air quality improvements. In contrast, the Western and Central-North zones yielded lower savings, particularly under the Primary Standard (USD 2,823,440 and USD 73,532,280, respectively), likely due to lower ozone exposure levels or fewer attributable cases in these zones.
In the Valparaíso Region, the total savings were $519,517,240 under the Primary Standard and $1,044,568,800 under the WHO Recommendation, as shown in Supplementary Table S4. The Los Andes and Quillota zones were the primary contributors, with Los Andes accounting for $316,144,320 (Primary) and $430,977,600 (WHO), and Quillota contributing $53,724,680 and $74,513,520, respectively. Viña del Mar also showed notable savings (98,086,320 USD and 137,451,760 USD), whereas Quintero’s benefits were more pronounced under the WHO scenario (401,625,920 USD vs. 51,561,920 USD), likely because its industrial pollution sources benefited from stricter standards. These regional differences underscore the importance of targeted air quality interventions, particularly in areas with high pollution exposure, such as Quintero and Los Andes.
The substantial increase in savings under the WHO Recommendation—approximately three times higher in the Metropolitan Region and double in Valparaíso—underscores the economic value of adopting stricter air quality standards. These estimates integrate healthcare cost reductions (e.g., emergency visits and hospitalizations) and the societal value of avoided mortality, emphasizing the dual health and economic benefits of controlling pollution. Figure 4 illustrates the distribution of benefits across zones and scenarios, highlighting the dominance of the Eastern and Southern zones in the Metropolitan Region, as well as Los Andes and Quillota in Valparaíso. These findings align with the relative risk patterns observed in Section 3.2 and Section 3.3 (Figure 2 and Figure 3), where higher relative risks in the Eastern and Southern zones (Metropolitan) and Quillota and Viña del Mar (Valparaíso) correlate with greater economic benefits due to avoided health outcomes. Policymakers can leverage these results to prioritize resource allocation for air quality interventions, particularly in high-impact zones, and maximize health and economic gains.

4. Conclusions

This study quantified the relative risks of mortality and morbidity associated with short-term ozone exposure across 13 communes in the Santiago Metropolitan and Valparaíso regions of Chile, with a focus on respiratory and cardiovascular outcomes. RRs ranged from 1.004 to 1.198, with the Eastern and Southern zones of the Santiago Metropolitan Region exhibiting the highest risks (e.g., cerebrovascular RR, 1.171; respiratory RR, 1.153). In contrast, the Western zone peaked at 1.198 for cardiovascular emergency visits. In Valparaíso, Quillota and Viña del Mar stood out, with Viña del Mar at 1.127 for ischemic heart disease emergency visits. The 5–64-year age group was most affected, particularly for emergency visits and hospital admissions, while older adults showed elevated but less frequent risks, and children under 5 had no significant mortality risks.
Economic benefits from improved air quality were substantial, with total savings of 2,405,384,400 USD under the Chilean Primary Standard (120 µg/m3) and 7,439,930,640 USD under the WHO Recommendation (100 µg/m3) in the Santiago Metropolitan Region, driven by the Eastern (1,712,238,280 USD) and Southern (616,790,400 USD) zones. In Valparaíso, savings reached 519,517,240 USD and 1,044,568,800 USD, respectively, with Los Andes (316,144,320 USD) and Quillota (53,724,680 USD) leading. The WHO scenario tripled benefits in the Santiago Metropolitan Region and doubled them in Valparaíso, highlighting the value of stricter standards. To address these risks, spatially targeted recommendations include expanding monitoring zones to capture ozone variability, particularly in high-risk areas like the Andean foothills and coastal Valparaíso; enhancing control measures in Quintero to mitigate industrial pollution impacts; and reducing vehicular contributions through public policies, building on existing advances such as the incorporation of electric public buses and the replacement of wood-burning stoves with cleaner alternatives. These interventions are urgent for vulnerable populations, with improved monitoring and policy enforcement needed to refine risk estimates and maximize health and economic gains.

Supplementary Materials

The following supporting information can be downloaded at https://www.mdpi.com/article/10.3390/earth6040134/s1; Table S1: Annual avoided health cases in the Metropolitan Region (Central-North, Eastern, Southern, Western zones) under the Chilean Primary Standard (120 µg/m3, 8-h maximum) and WHO Recommendation (100 µg/m3, 8-h maximum) ozone scenarios. Cases include cardiovascular and respiratory mortality, hospital admissions, and emergency visits.; Table S2: Annual avoided health cases in the Valparaiso under the Chilean Primary Standard (120 µg/m3, 8-h maximum) and WHO Recommendation (100 µg/m3, 8-h maximum) ozone scenarios. Cases include cardiovascular and respiratory mortality, hospital admissions, and emergency visits.; Table S3: Annual economic benefit in the Metropolitan Region (Central-North, Eastern, Southern, Western zones) under the Chilean Primary Standard (120 µg/m3, 8-h maximum) and WHO Recommendation (100 µg/m3, 8-h maximum) ozone scenarios. Cases include cardiovascular and respiratory mortality, hospital admissions, and emergency visits.; Table S4: Annual economic benefit in the Valparaiso under the Chilean Primary Standard (120 µg/m3, 8-h maximum) and WHO Recommendation (100 µg/m3, 8-h maximum) ozone scenarios. Cases include cardiovascular and respiratory mortality, hospital admissions, and emergency visits.

Author Contributions

Conceptualization, F.V. and J.L.-G.; methodology, F.V., V.C. and L.D.-R.; software, P.C. and V.C.; validation, F.V., J.L.-G. and E.P.-C.; formal analysis, F.V. and R.Z.; investigation, F.V.; resources, F.V. and P.V.; data curation, F.V., P.C. and V.C.; writing—original draft preparation, F.V.; writing—review and editing, F.V., J.L.-G., E.P.-C., L.E.-P., A.E.-P., L.D.-R., P.C., V.C. and R.Z.; visualization, F.V. and R.Z.; supervision, F.V.; project administration, V.C.; funding acquisition, V.C. and L.D.-R. All authors have read and agreed to the published version of the manuscript.

Funding

This research received no external funding.

Data Availability Statement

Data are contained within the article or Supplementary Materials.

Acknowledgments

This study was partially supported by the supercomputing infrastructure at the NLHPC (ECM-02).

Conflicts of Interest

Author Luis Díaz-Robles was employed by the company Particulas SpA. The remaining authors declare that the research was conducted in the absence of any commercial or financial relationships that could be construed as a potential conflict of interest.

References

  1. Freeman, B.S.; Taylor, G.; Gharabaghi, B.; Thé, J. Forecasting air quality time series using deep learning. J. Air Waste Manag. Assoc. 2018, 68, 866–886. [Google Scholar] [CrossRef]
  2. Stoyanov, N.; Pandelova, A.; Georgiev, T.; Kalapchiiska, J.; Dzhudzhev, B. Forecasting of Air Pollution with Time Series and Multiple Regression Models in Sofia, Bulgaria. J. Environ. Eng. Landsc. Manag. 2023, 31, 176–185. [Google Scholar] [CrossRef]
  3. Manisalidis, I.; Stavropoulou, E.; Stavropoulos, A.; Bezirtzoglou, E. Environmental and Health Impacts of Air Pollution: A Review. Front. Public Health 2020, 8, 505570. [Google Scholar] [CrossRef] [PubMed]
  4. Buchholz, R.R.; Paton-Walsh, C.; Griffith, D.W.T.; Kubistin, D.; Caldow, C.; Fisher, J.A.; Deutscher, N.M.; Kettlewell, G.; Riggenbach, M.; Macatangay, R.; et al. Source and meteorological influences on air quality (CO, CH4 & CO2) at a Southern Hemisphere urban site. Atmos. Environ. 2016, 126, 274–289. [Google Scholar] [CrossRef]
  5. Wang, L.; Lun, X.; Wang, Q.; Wu, J. Biogenic volatile organic compounds emissions, atmospheric chemistry, and environmental implications: A review. Environ. Chem. Lett. 2024, 22, 3033–3058. [Google Scholar] [CrossRef]
  6. Feron, S.; Cordero, R.R.; Damiani, A.; Oyola, P.; Ansari, T.; Pedemonte, J.C.; Wang, C.; Ouyang, Z.; Gallo, V. Compound climate-pollution extremes in Santiago de Chile. Sci. Rep. 2023, 13, 6726. [Google Scholar] [CrossRef]
  7. Cui, B.; Xian, C.; Han, B.; Shu, C.; Qian, Y.; Ouyang, Z.; Wang, X. High-resolution emission inventory of biogenic volatile organic compounds for rapidly urbanizing areas: A case of Shenzhen megacity, China. J. Environ. Manag. 2024, 351, 119754. [Google Scholar] [CrossRef]
  8. Lyu, X.; Li, K.; Guo, H.; Morawska, L.; Zhou, B.; Zeren, Y.; Jiang, F.; Chen, C.; Goldstein, A.H.; Xu, X.; et al. A synergistic ozone-climate control to address emerging ozone pollution challenges. One Earth 2023, 6, 964–977. [Google Scholar] [CrossRef]
  9. Parra, R.; Cadena, E.; Flores, C. Maximum UV index records (2010–2014) in Quito (Ecuador) and its trend inferred from remote sensing data (1979–2018). Atmosphere 2019, 10, 787. [Google Scholar] [CrossRef]
  10. Zhang, C.; Stevenson, D. Characteristic changes of ozone and its precursors in London during COVID-19 lockdown and the ozone surge reason analysis. Atmos. Environ. 2022, 273, 118980. [Google Scholar] [CrossRef]
  11. Campos, V.; Díaz-Robles, L.; Fadic, X.; Ruggeri, M.F.; Vallejo, F.; Barcaza, G.; Fu, J.S.; Cereceda-Balic, F. High levels and behavior of tropospheric ozone in the Andes Mountains, Central Chile. In Proceedings of the EGU General Assembly 2024, Vienna, Austria, 14–19 April 2024; p. 13411. [Google Scholar] [CrossRef]
  12. Guo, P.; Su, Y.; Sun, X.; Liu, C.; Cui, B.; Xu, X.; Ouyang, Z.; Wang, X. Urban–Rural Comparisons of Biogenic Volatile Organic Compounds and Ground-Level Ozone in Beijing. Forests 2024, 15, 508. [Google Scholar] [CrossRef]
  13. Zalakeviciute, R.; Lopez-Villada, J.; Ochoa, A.; Moreno, V.; Byun, A.; Proaño, E.; Mejía, D.; Bonilla-Bedoya, S.; Rybarczyk, Y.; Vallejo, F. Urban Air Pollution in the Global South: A Never-Ending Crisis? Atmosphere 2025, 16, 487. [Google Scholar] [CrossRef]
  14. Vallejo, F.; Villacrés, P.; Yánez, D.; Espinoza, L.; Bodero-Poveda, E.; Díaz-Robles, L.A.; Oyaneder, M.; Campos, V.; Palmay, P.; Cordovilla-Pérez, A.; et al. Prolonged Power Outages and Air Quality: Insights from Quito’s 2023–2024 Energy Crisis. Atmosphere 2025, 16, 274. [Google Scholar] [CrossRef]
  15. Chen, Y.-H.R.; Lee, W.-C.; Liu, B.-C.; Yang, P.-C.; Ho, C.-C.; Hwang, J.-S.; Huang, T.-H.; Lin, H.-H.; Lo, W.-C. Quantifying the potential effects of air pollution reduction on population health and health expenditure in Taiwan. Environ. Pollut. 2023, 336, 122405. [Google Scholar] [CrossRef]
  16. Kheirbek, I.; Wheeler, K.; Walters, S.; Kass, D.; Matte, T. PM2.5 and ozone health impacts and disparities in New York City: Sensitivity to spatial and temporal resolution. Air Qual. Atmos. Health 2013, 6, 473–486. [Google Scholar] [CrossRef]
  17. Zhou, J.; Gladson, L.; Díaz Suárez, V.; Cromar, K. Respiratory Health Impacts of Outdoor Air Pollution and the Efficacy of Local Risk Communication in Quito, Ecuador. Int. J. Environ. Res. Public Health 2023, 20, 6326. [Google Scholar] [CrossRef]
  18. Pino-Cortés, E.; Díaz-Robles, L.A.; Campos, V.; Vallejo, F.; Cubillos, F.; Gómez, J.; Cereceda-Balic, F.; Fu, J.; Carrasco, S.; Figueroa, J. Effect of socioeconomic status on the relationship between short-term exposure to PM2.5 and cardiorespiratory mortality and morbidity in a megacity: The case of Santiago de Chile. Air Qual. Atmos. Health 2020, 13, 509–517. [Google Scholar] [CrossRef]
  19. Kaur, J.; Singh, S.; Parmar, K.S. Forecasting of AQI (PM2.5) for the three most polluted cities in India during COVID-19 by hybrid Daubechies discrete wavelet decomposition and autoregressive (Db-DWD-ARIMA) model. Environ. Sci. Pollut. Res. 2023, 30, 101035–101052. [Google Scholar] [CrossRef]
  20. Gómez, M.C.; Durana, N.; García, J.A.; de Blas, M.; Sáez de Cámara, E.; García-Ruiz, E.; Gangoiti, G.; Torre-Pascual, E.; Iza, J. Long-term measurement of biogenic volatile organic compounds in a rural background area: Contribution to ozone formation. Atmos. Environ. 2020, 224, 117315. [Google Scholar] [CrossRef]
  21. Cazorla, M.; Trujillo, M.; Seguel, R.; Gallardo, L. Comparative ozone production sensitivity to NO x and VOCs in Quito, Ecuador, and Santiago, Chile. Atmos. Chem. Phys. 2025, 25, 7087–7109. [Google Scholar] [CrossRef]
  22. Lapere, R.; Menut, L.; Mailler, S.; Huneeus, N. Seasonal variation in atmospheric pollutants transport in central Chile: Dynamics and consequences. Atmos. Chem. Phys. 2021, 21, 6431–6454. [Google Scholar] [CrossRef]
  23. Seguel, R.J.; Castillo, L.; Opazo, C.; Rojas, N.Y.; Nogueira, T.; Cazorla, M.; Gavidia-Calderón, M.; Gallardo, L.; Garreaud, R.; Carrasco-Escaff, T.; et al. Changes in South American surface ozone trends: Exploring the influences of precursors and extreme events. Atmos. Chem. Phys. 2024, 24, 8225–8242. [Google Scholar] [CrossRef]
  24. Vallejo, F.; Yánez, D.; Viñán-Guerrero, P.; Díaz-Robles, L.A.; Oyaneder, M.; Reinoso, N.; Billartello, L.; Espinoza-Pérez, A.; Espinoza-Pérez, L.; Pino-Cortés, E. Enhancing air quality predictions in Chile: Integrating ARIMA and Artificial Neural Network models for Quintero and Coyhaique cities. PLoS ONE 2025, 20, e0314278. [Google Scholar] [CrossRef] [PubMed]
  25. Reyer, C.P.O.; Adams, S.; Albrecht, T.; Baarsch, F.; Boit, A.; Canales Trujillo, N.; Cartsburg, M.; Coumou, D.; Eden, A.; Fernandes, E.; et al. Climate change impacts in Latin America and the Caribbean and their implications for development. Reg. Environ. Change 2017, 17, 1601–1621. [Google Scholar] [CrossRef]
  26. Herrera, P.; Rojo, J.; Scapini, V. Relationship between pollution levels and poverty: Regions of Antofagasta, Valparaiso and Biobio, Chile. Int. J. Energy Prod. Manag. 2022, 7, 176–184. [Google Scholar] [CrossRef]
  27. Garcia-Santos, Y.; Narváez, D.A.; Saldías, G.S.; Jacques-Coper, M.; Bozkurt, D.; Garreaud, R.; Valdés-Castro, V. Impact of atmospheric rivers on coastal oceanographic conditions off central-southern Chile. Sci. Rep. 2025, 15, 34569. [Google Scholar] [CrossRef]
  28. Borhani, F.; Motlagh, M.S.; Rashidi, Y.; Ehsani, A.H. Estimation of short-lived climate forced sulfur dioxide in Tehran, Iran, using machine learning analysis. Stoch. Environ. Res. Risk Assess. 2022, 36, 2847–2860. [Google Scholar] [CrossRef]
  29. Kamboj, K.; Sisodiya, S.; Mathur, A.K.; Zare, A.; Verma, P. Assessment and Spatial Distribution Mapping of Criteria Pollutants. Water Air Soil Pollut. 2022, 233, 82. [Google Scholar] [CrossRef]
  30. R Core Team. R: A Language and Environment for Statistical Computing. Vienna, Austria, 2024. v. 2025.05.1. Available online: https://www.r-project.org/ (accessed on 16 September 2025).
  31. Alkabbani, H.; Ramadan, A.; Zhu, Q.; Elkamel, A. An Improved Air Quality Index Machine Learning-Based Forecasting with Multivariate Data Imputation Approach. Atmosphere 2022, 13, 1144. [Google Scholar] [CrossRef]
  32. Fann, N.; Lamson, A.D.; Anenberg, S.C.; Wesson, K.; Risley, D.; Hubbell, B.J. Estimating the National Public Health Burden Associated with Exposure to Ambient PM 2.5 and Ozone. Risk Anal. 2012, 32, 81–95. [Google Scholar] [CrossRef]
  33. Seguel, R.J.; Gallardo, L.; Osses, M.; Rojas, N.Y.; Nogueira, T.; Menares, C.; De Fatima Andrade, M.; Belalcázar, L.C.; Carrasco, P.; Eskes, H.; et al. Photochemical sensitivity to emissions and local meteorology in Bogotá, Santiago, and São Paulo: An analysis of the initial COVID-19 lockdowns. Elementa 2022, 10, 00044. [Google Scholar] [CrossRef]
  34. Sacks, J.D.; Fann, N.; Gumy, S.; Kim, I.; Ruggeri, G.; Mudu, P. Quantifying the public health benefits of reducing air pollution: Critically assessing the features and capabilities of WHO’s AirQ+ and U.S. EPA’s environmental benefits mapping and analysis program-community edition (BenMAP-CE). Atmosphere 2020, 11, 516. [Google Scholar] [CrossRef] [PubMed]
  35. Ministerio de Energía. Compendio Cartográfico Regionalizado: Proyectos de Energías Renovables en Chile; Ministerio de Energía: Santiago, Chile, 2015; pp. 1–35.
  36. Jitt-Aer, K.; Wall, G.; Jones, D.; Teeuw, R. Use of GIS and dasymetric mapping for estimating tsunami-affected population to facilitate humanitarian relief logistics: A case study from Phuket, Thailand. Nat. Hazards 2022, 113, 185–211. [Google Scholar] [CrossRef]
  37. Fu, P.; Kawamura, K.; Chen, J.; Miyazaki, Y. Secondary production of organic aerosols from biogenic VOCs over Mt. Fuji, Japan. Environ. Sci. Technol. 2014, 48, 8491–8497. [Google Scholar] [CrossRef] [PubMed]
  38. Garcia-Santos, Y.; Narváez, D.A.; Jacques-Coper, M.; Saldías, G.S.; Bozkurt, D.; Alessio, B.M. Dominant Wind Patterns Under the Influence of Atmospheric Rivers: Implications for Coastal Upwelling off Central-Southern Chile. J. Geophys. Res. Ocean. 2025, 130, e2024JC021444. [Google Scholar] [CrossRef]
  39. Huang, D.; Andersson, H.; Zhang, S. Willingness to pay to reduce health risks related to air quality: Evidence from a choice experiment survey in Beijing. J. Environ. Plan. Manag. 2018, 61, 2207–2229. [Google Scholar] [CrossRef]
  40. Ren, B.; Xie, P.; Xu, J.; Li, A.; Qin, M.; Hu, R.; Zhang, T.; Fan, G.; Tian, X.; Zhu, W.; et al. Vertical characteristics of NO2 and HCHO, and the ozone formation regimes in Hefei, China. Sci. Total Environ. 2022, 823, 99–109. [Google Scholar] [CrossRef]
  41. Seguel, R.J.; Gallardo, L.; Fleming, Z.L.; Landeros, S. Two decades of ozone standard exceedances in Santiago de Chile. Air Qual. Atmos. Health 2020, 13, 593–605. [Google Scholar] [CrossRef]
  42. Cereceda-Balic, F.; Gala-Morales, M.; de la Palomo-Marín, R.; Fadic, X.; Vidal, V.; Funes, M.; Rueda-Holgado, F.; Pinilla-Gil, E. Spatial distribution, sources, and risk assessment of major ions ad trace elements in rainwater at Puchuncaví Valley, Chile: The impact of industrial activities. Atmos. Pollut. Res. 2020, 11, 99–109. [Google Scholar] [CrossRef]
  43. Seguel, R.J.; Mancilla, C.A.; Rondanelli, R.; Leiva, M.A.; Morales, R.G.E. Ozone distribution in the lower troposphere over complex terrain in Central Chile. J. Geophys. Res. Atmos. 2013, 118, 2966–2980. [Google Scholar] [CrossRef]
  44. Cazorla, M.; Herrera, E.; Palomeque, E.; Saud, N. What the COVID-19 lockdown revealed about photochemistry and ozone production in Quito, Ecuador. Atmos. Pollut. Res. 2021, 12, 124–133. [Google Scholar] [CrossRef] [PubMed]
  45. Monks, P.S.; Archibald, A.T.; Colette, A.; Cooper, O.; Coyle, M.; Derwent, R.; Fowler, D.; Granier, C.; Law, K.S.; Mills, G.E.; et al. Tropospheric ozone and its precursors from the urban to the global scale from air quality to short-lived climate forcer. Atmos. Chem. Phys. 2015, 15, 8889–8973. [Google Scholar] [CrossRef]
  46. Diaz-Robles, L.A.; Cortés, S.; Vergara-Fernández, A.; Ortega, J.C. Short Term Health Effects of Particulate Matter: A Comparison between Wood Smoke and Multi-Source Polluted Urban Areas in Chile. Aerosol Air Qual. Res. 2015, 15, 306–318. [Google Scholar] [CrossRef]
  47. Jeon, W.B.; Lee, S.H.; Lee, H.; Park, C.; Kim, D.H.; Park, S.Y. A study on high ozone formation mechanism associated with change of NOx/VOCs ratio at a rural area in the Korean Peninsula. Atmos. Environ. 2014, 89, 10–21. [Google Scholar] [CrossRef]
  48. Silva, J.S.; Rojas, J.P.; Norabuena, M.; Seguel, R.J. Ozone and volatile organic compounds in the metropolitan area of Lima-Callao, Peru. Air Qual. Atmos. Health 2018, 11, 993–1008. [Google Scholar] [CrossRef]
  49. Seguel, R.J.; Garreaud, R.; Muñoz, R.; Bozkurt, D.; Gallardo, L.; Opazo, C.; Jorquera, H.; Castillo, L.; Menares, C. Volatile organic compounds measured by proton transfer reaction mass spectrometry over the complex terrain of Quintero Bay, Central Chile. Environ. Pollut. 2023, 330, 121759. [Google Scholar] [CrossRef]
  50. EPA. “BenMAP.” 2025. Available online: https://www.epa.gov/benmap/benmap-downloads (accessed on 16 September 2025).
  51. World Health Organization. Air Pollution and Health: Summary of Evidence. 2021, p. 300. Available online: https://www.who.int/publications/i/item/9789240034228 (accessed on 15 September 2025).
  52. Ballesteros-González, K.; Sullivan, A.P.; Morales-Betancourt, R. Estimating the air quality and health impacts of biomass burning in northern South America using a chemical transport model. Sci. Total Environ. 2020, 739, 139755. [Google Scholar] [CrossRef]
  53. Olawepo, J.O.; Chen, L.W.A. Health benefits from upgrading public buses for cleaner air: A case study of Clark County, Nevada and the United States. Int. J. Environ. Res. Public Health 2019, 16, 720. [Google Scholar] [CrossRef]
  54. Sanhueza, P.A.; Torreblanca, M.A.; Diaz-Robles, L.A.; Schiappacasse, L.N.; Silva, M.P.; Astete, T.D. Particulate Air Pollution and Health Effects for Cardiovascular and Respiratory Causes in Temuco, Chile: A Wood-Smoke-Polluted Urban Area. J. Air Waste Manag. Assoc. 2009, 59, 1481–1488. [Google Scholar] [CrossRef]
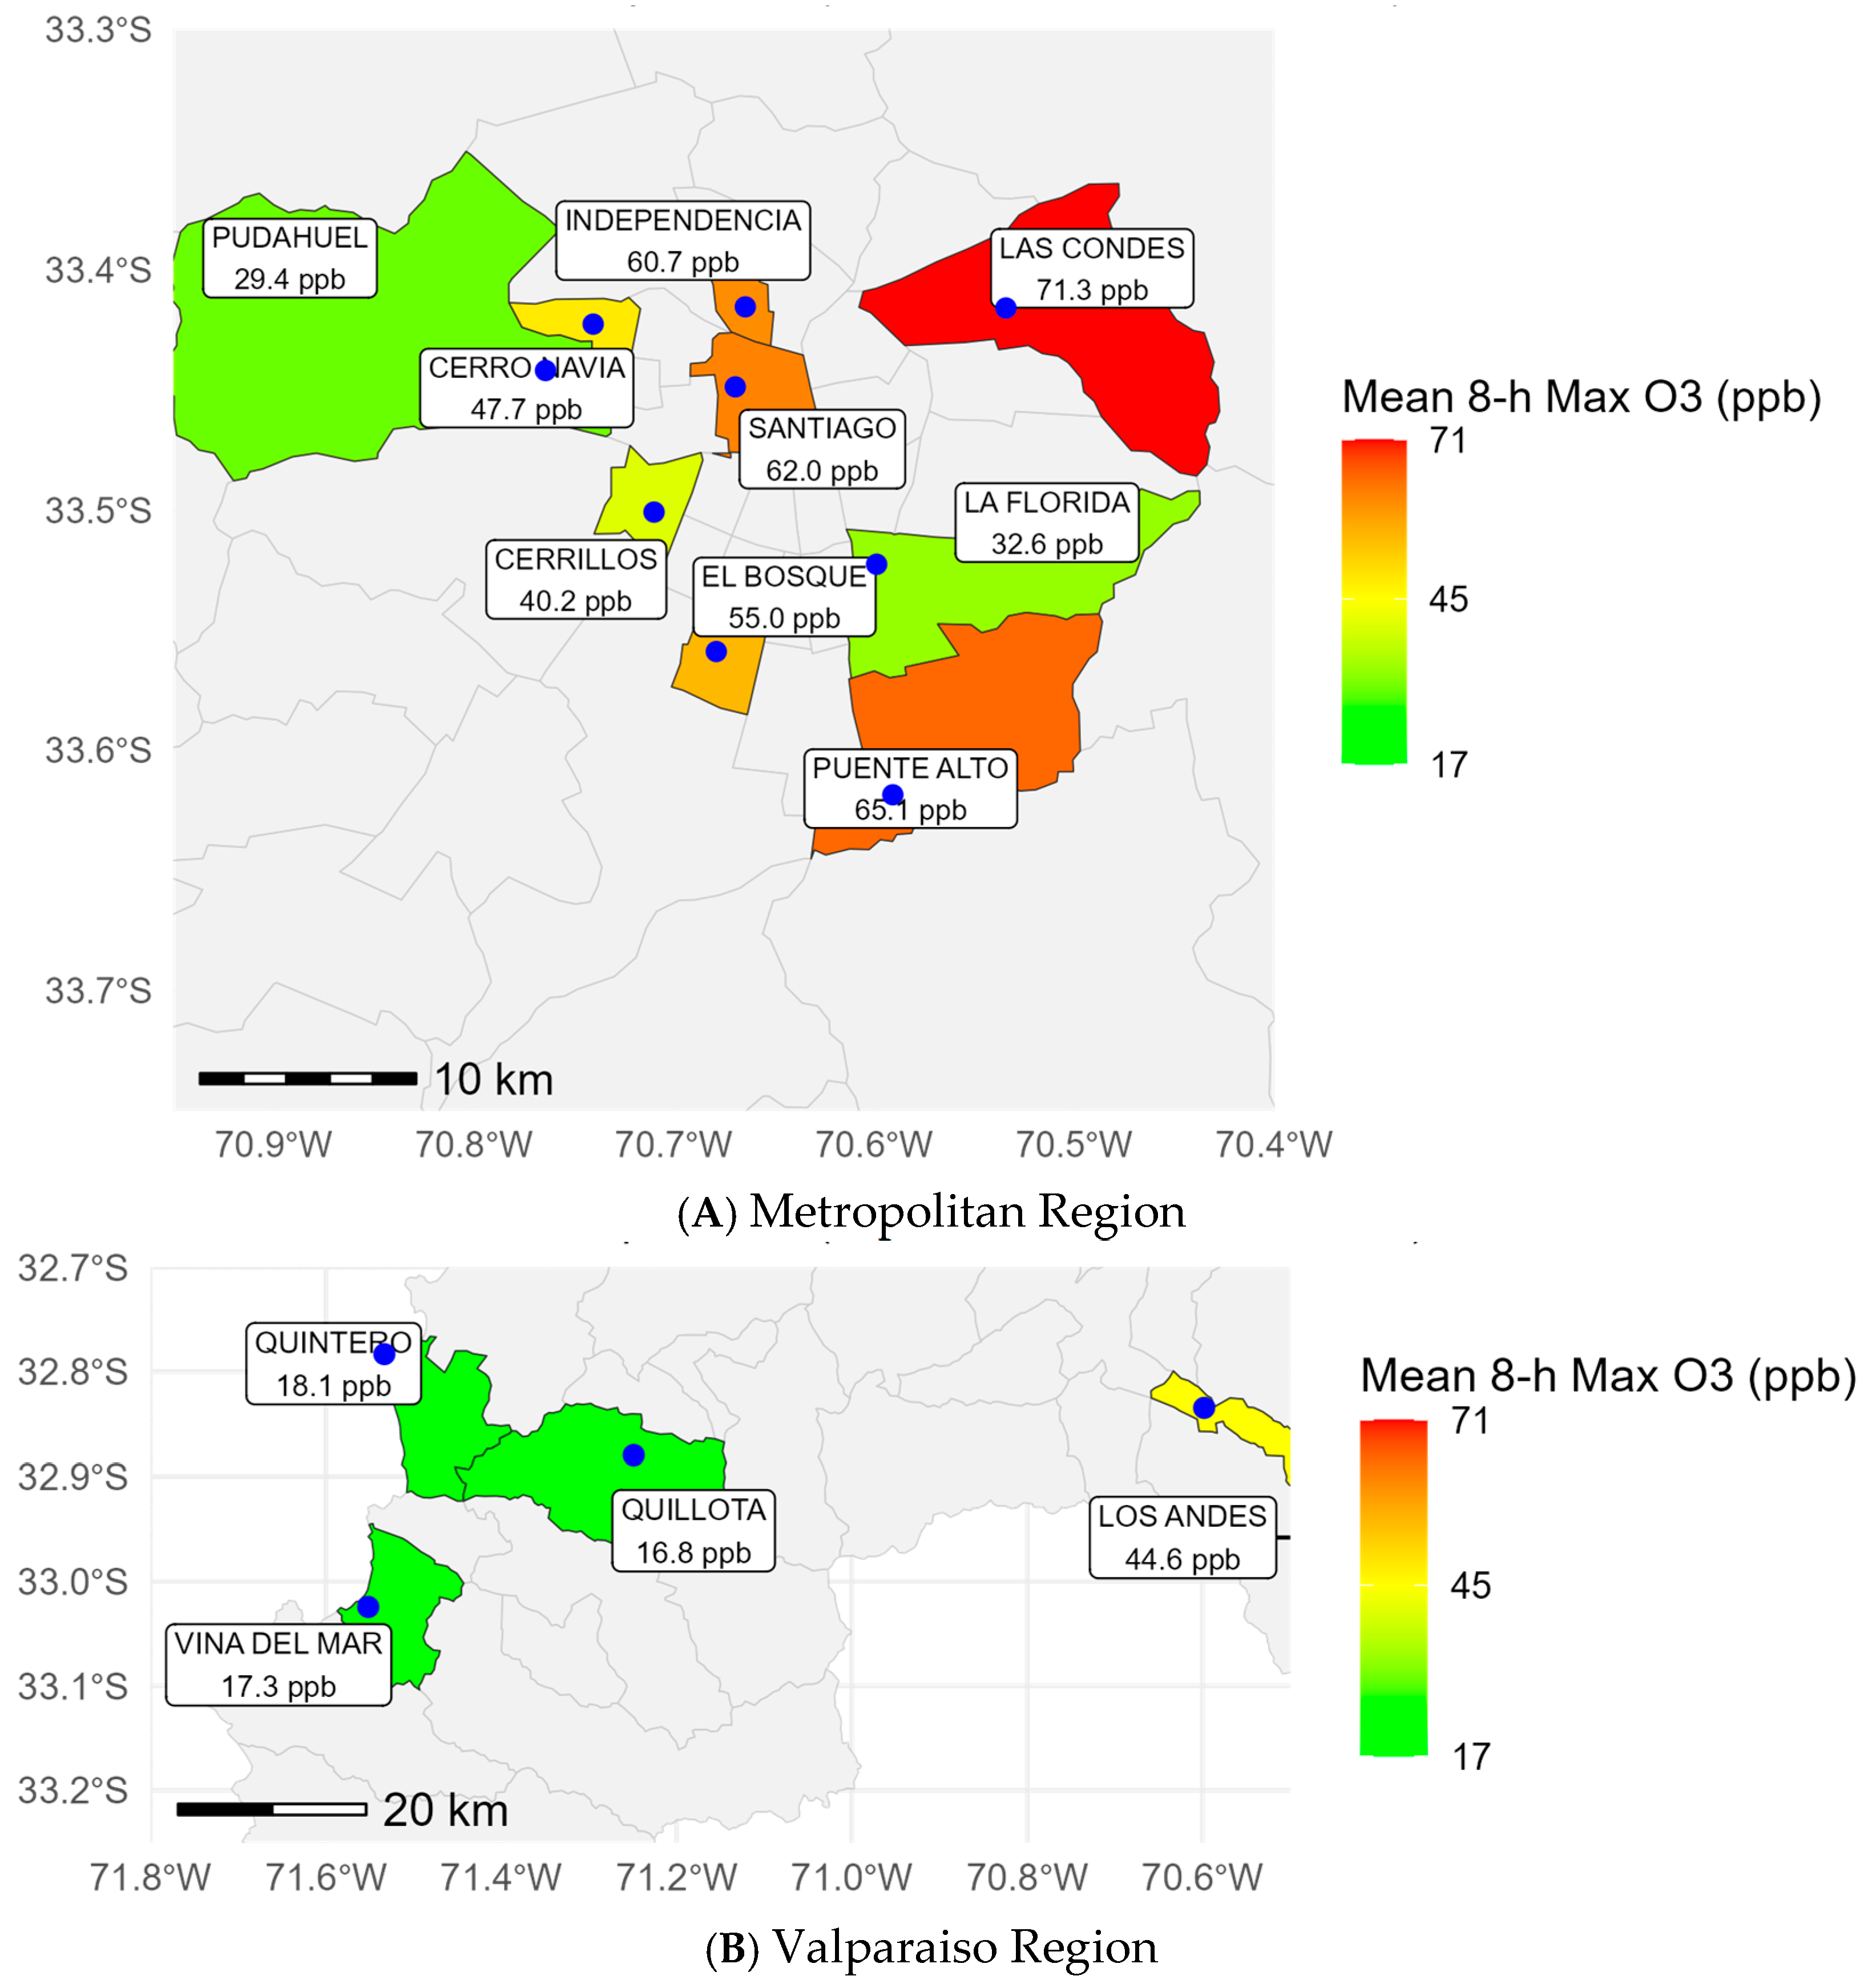
Figure 1. Mean 8 h maximum ozone concentrations (ppb) in (A) Santiago Metropolitan Region and (B) Valparaíso Region. Communes with monitoring data are colored by ozone levels (green = low, yellow = median, red = high) and labeled with commune names and concentrations (ppb). Stations are marked as blue points.
Earth 06 00134 g001
Figure 2. Mean relative risks (RRs) ± 95% confidence interval range for health outcomes in the Metropolitan Region, by zone (Central-Northern, Eastern, Southern, Western) and outcome category (Cardiac, Respiratory, Cardiovascular, Cerebrovascular Disease, etc.). The outcomes include mortality (M), hospital admissions (A), and emergency visits (U).
Earth 06 00134 g002
Figure 3. Mean relative risks (RRs) ± 95% confidence interval range for health outcomes in the Valparaíso Region, by zone (Viña del Mar, Los Andes, Quillota, Quintero) and outcome category (Cardiac, Respiratory, Cardiovascular, Cerebrovascular Disease, etc.). Outcomes include mortality (M), hospital admissions (A), and emergency visits (U).
Earth 06 00134 g003
Figure 4. Avoided health cases for respiratory emergency visits per 100,000 inhabitants in the Metropolitan Region (North-Center, Eastern, Southern, Western) and Valparaíso Region (Viña del Mar, Quintero, Los Andes, Quillota) under (a) Primary Standard (120 µg/m3) and (b) WHO Recommendation (100 µg/m3) scenarios.
Earth 06 00134 g004
Table 1. Summary of Annual Health Benefits (UF) by Zone and Scenario (Metropolitan and Valparaíso Regions).
Region/ZonePrimary Standard Benefits (USD)WHO Recommendation Benefits (USD)
Metropolitan—Central-North73,532,2801,040,141,720
Metropolitan—Eastern1,712,238,2803,792,211,840
Metropolitan—Southern616,790,4002,123,562,360
Metropolitan—Western2,823,440484,014,720
Valparaíso—Viña del Mar98,086,320137,451,760
Valparaíso—Quintero51,561,920401,625,920
Valparaíso—Los Andes316,144,320430,977,600
Valparaíso—Quillota53,724,68074,513,520
Disclaimer/Publisher’s Note: The statements, opinions and data contained in all publications are solely those of the individual author(s) and contributor(s) and not of MDPI and/or the editor(s). MDPI and/or the editor(s) disclaim responsibility for any injury to people or property resulting from any ideas, methods, instructions or products referred to in the content.