Article

Spatial and Temporal Evaluation of PM10 and PM2.5 in the Tropical Weather City Context: Effect of Environmental Parameters and Fixed-Pollution Sources

by
Carlos Alberto Quintal-Franco
1,
Agur Mendicuti-Ramos
1,
Carmen Ponce-Caballero
1,
Virgilio René Góngora-Echeverría
1,* and
Sergio Aguilar-Escalante
2
1
Facultad de Ingeniería, Universidad Autónoma de Yucatán, Av. Industrias No Contaminantes S/N., Mérida CP 97302, Yucatán, Mexico
2
Synthesis SP, Consultoría Estratégica Para La Sostenibilidad, Av. Shután Medina (Calle 4) No. 131 por 9 y 11, Montecristo, Mérida CP 07133, Yucatán, Mexico
*
Author to whom correspondence should be addressed.
Earth 2025, 6(4), 133; https://doi.org/10.3390/earth6040133
Submission received: 15 September 2025 / Revised: 15 October 2025 / Accepted: 17 October 2025 / Published: 23 October 2025

Abstract

Tropical weather cities, such as Mérida in Yucatán, Mexico, are perceived as air pollution-free environments. This study aimed to evaluate the air quality in Mérida City over five years, focusing on PM2.5 and PM10 as well as spatial and temporal factors. A government-accredited monitoring station for PM2.5 (2018–2022) and economic air sensors for PM2.5 and PM10 (2023) were used. Results showed the maximum daily (90 μg m−3) and annual PM2.5 (23 μg m−3) averages for 2020 exceeded the Mexican regulations. Sensors indicated that the fixed pollution sources influenced PM2.5 and PM10. Spatially and temporally, the southwest of the city in the dry season of 2023 showed the highest PM2.5 and PM10. Tropical conditions (solar radiation and temperature) increased PM, while high humidity and precipitation decreased it. Air quality improved during the rainy season. The southwest zone had the highest density of diesel vehicles and fixed pollution sources, which contributed to the highest PM concentration. The monitoring showed that air quality related to PM in Mérida City is a concern. Local and external factors are affecting the air quality. It is mandatory to regulate air emissions from fixed sources and implement vehicle verification, even in tropical weather cities.

Graphical Abstract

1. Introduction

Particles with a diameter of 2.5 μm or less (PM2.5) are a significant concern for air quality and public health, especially in urban environments. In Mexico, NOM-025-SSA1-2021 establishes a maximum PM2.5 daily average concentration of 41 μg m−3 [1], which is higher compared with 35 μg m−3 reported by the U.S. EPA [2] and the 15 μg m−3 recommended by the World Health Organization [3]. Mérida, the capital of Yucatán, México, has experienced rapid urbanization and industrial growth over recent decades, contributing to changes in its atmospheric composition. The Government of Yucatán monitors air quality to ensure that the permissible levels established in Mexican regulations are met. Yucatán has a single air quality monitoring system in downtown Mérida. To provide a general air quality assessment in 2022, low-cost Purple Air sensors were installed at various points in the city of Mérida, providing real-time information on PM10 and PM2.5 particles. Low-cost particle sensors have been proven to be efficient in air monitoring quality [4]. Cities such as Pamplona in Colombia [5], California in the USA [6], and Changwon in South Korea [7] have used low-cost sensors to expand their air quality monitoring networks. PM2.5 particles are particularly hazardous due to their ability to penetrate the respiratory system, posing risks such as respiratory diseases, cardiovascular issues, and premature mortality. In 2017, México had 34,000 deaths attributed to PM2.5 concentration [8].
There are several sources of particulate matter such as domestic fuel burning or industrial emissions [9,10]. Traffic related sources increase PM2.5 concentrations through engine exhaust gases [11,12]. Road dust has become increasingly crucial to PM2.5 concentration, mainly due to dust resuspension [13,14]. According to the Secretary of Economy in Mérida, in 2020, 48% of the population used their vehicle (car, truck, or motorcycle) as the primary means of transportation to work. For commuting to study places, 41.2% of the population used their vehicle (car, truck, motorcycle, etc.) as the primary means of transportation [15]. It was estimated that in 2022, a total of 695,876 vehicles were registered and circulating in the city of Mérida [16]. Considering Mérida City has a population of 1.3 million, there is one vehicle for every two people. Ultimately, natural sources like African dust transport impact PM2.5 concentration in several countries [17,18,19,20]. Mérida has experienced several Sahara dust transport events during dry seasons [21]. Yu et al. [22] reported an extraordinary event, later called “Godzilla”, which transported millions of tons of Sahara dust through the Gulf of México in June 2020.
Although the air-pollution sources are identified, ambient parameters such as humidity, rain, ambient temperature, and solar radiation relate to PM2.5 and PM10 concentrations and play an important role in PM distribution [23,24,25,26,27,28]. Temporality also strongly impacts the PM concentration. Requia et al. [24] determined, through a 30-year study, that the PM concentration varied considerably over the cold and warm seasons in several regions of the USA. The wet and dry seasons showed critical differences in PM2.5 concentration, with dry season months having higher concentrations than the wet season; additionally, environmental haze events associated with the dry season (e.g., wildfires, sea salt, etc.) having a negative impact on PM2.5 concentration have been reported [23]. Also, the planetary boundary layer height (PBLH) has an important contribution to the dispersion of pollutants [29]. Pan et al. [30] reported that PBLH has a negative correlation with PM2.5.
Despite the growing importance of air quality monitoring, limited information is available on the levels, sources, and health impacts of PM2.5 in Mérida. This study aimed to fill this gap by analyzing the concentration of PM2.5 at various locations within the city and identifying the primary sources contributing to these levels. Additionally, the research explores the temporal variations and potential correlations with meteorological conditions, providing a comprehensive overview of the PM2.5 situation in Mérida. Finally, this study will be the first in the area of the Yucatan Peninsula to analyze the tendencies, behavior, and correlations between the meteorological variables and the concentration of PM. Furthermore, a new line of research on this topic could be initiated in the city of Mérida to ensure compliance with the Mexican standards and improve the city’s air quality as a result of this research.

2. Materials and Methods

2.1. Location of Sampling Sites

The study was developed in Mérida City, in the Yucatán State in México. Mérida is a city in the southeast of México with a warm subhumid tropical monsoon climate, characterized by summer rain and a regular to low percentage of winter rain, with slight thermal oscillation. The average annual temperatures in the Yucatán state range from 24 to 28 °C, precipitation from 500 to 1500 mm, and wind predominance from the northeast (NE) throughout the year [31].
For this research, two data sources were used: a monitoring air quality station and low-cost sensors. The air quality monitoring station is in Mérida’s downtown area. The sensors were positioned at four points in the city, ensuring that they met the minimum operating conditions for proper functioning.
The areas where the sensors are located encompass a range of different land uses. Their locations, along with the corresponding land uses, are described in Table 1. For spatial analysis, an influence radius of 8 km was considered for the station, and 2 km for each sensor, which was according to information provided by the Environmental Quality Department of the Climate Change Directorate in the Secretary of Sustainable Development (SDS in Spanish).

2.2. Data Sources

As mentioned previously, two data sources were used for this work. The first was obtained from the monitoring station “SDS01” (hereafter “the station”), located downtown. The second was obtained from four Purple Air brand sensors (hereafter “the sensors”) located at four zones in Mérida City.
The station was equipped with several Thermo Scientific brand analyzers: nitrogen oxide (model 42i) with a precision of ±0.4 ppm, sulfur dioxide (model 43i) with a precision of ±1 ppb, carbon monoxide (model 48i) with an accuracy of ±0.1 ppm, ozone (model 49i) with a precision of ±1 ppb, and an airborne particulate matter monitor (model 5014i) with a precision of ±2.0 μg m−3 for particles with a diameter of 2.5 microns or less (PM2.5) [32,33,34,35,36]. Additionally, the station was equipped with Climatronic brand meteorological sensors: barometric pressure, solar radiation, wind direction and velocity, ambient temperature, and relative humidity. The station complies with the NOM-156-SEMARNAT-2012 standard for air quality monitoring systems, and the maintenance and calibration of the analyzers were up to date at the moment of the data collection.
The sensors registered the Air Quality Index (AQI) using PM2.5 and PM10 criteria from U.S. EPA 454/B-18-007 procedure [37]. The device model was fabricated for the Plantower technology model PMS-5003 and commercialized by Purple Air Ltd, (Draper, UT, USA) The sensors had a maximum consistency error of ±10% at 100 to 500 μg m−3 and ±10 μg m−3 at 0 to 100 μg m−3 for PM2.5. To detect particles, sensors use a laser counter. These measurements were then used to extrapolate the PM values. This method of data collection is called optical particle counting; the devices themselves are sometimes called OPCs [38]. According to the California Air Resources Board [39], particles in the air can scatter light. Optical particle counters (OPC) measure the amount of light scattered by particles to estimate the number and size of particles present in the air. The laser counters are factory-calibrated, with no method for post-production calibration, and no calibration is required according to the manufacturer [40].
Concentration values for the analysis of the pollutants were obtained from the Mexican regulations and are described in Table 2.

2.3. Monitoring and Data Management

The study period for the station was January 2018 to December 2022, and for the sensors, it was from January 2023 to October 2023.
The three seasons present in the tropics of México were considered. These seasons were established based on the distribution of rainfall, evaporation, relative humidity, cloud cover, and temperature throughout the year. The three seasons considered in this study in the context of Yucatán were dry (March to May), rainy (June to October), and cold (November to February).
The obtained data were cleaned of blank entries and then validated using the criteria from Handbook 5, “Air Quality Data Management Protocol”, issued by the National Institute of Ecology [41]. This protocol is a set of conditions and criteria that determine the validity of air quality data based on their replicability, values, and operating ranges. It has been standardized by all air monitoring stations in Mexico to validate the representativeness of the data and is promoted by the National Institute of Ecology and Climate Change (INECC, in Spanish). Examples of the criteria in this Handbook are: invalid data for a pollutant concentration that has the same value for 3 h in a row; invalid data for all the missing data captured; invalid data if the value of concentration of a pollutant is under −3 ppm, if not so, consider zero value; invalid data for all data that were monitored while the maintenance of the equipment was conducted. For a complete list of the criteria established, refer to Handbook 5 [41].
Afterward, the validated values were compared with the station’s maintenance log to ensure that no data were considered if it was monitored during a station malfunction or rebooting after a power failure. Therefore, only fully validated data were considered for the average 24 h concentration of PM2.5 and annual concentration.
For the sensors, the AQI data were transformed into the calculated concentration in μg m−3 using a modified form of the equation in the U.S. EPA 454/B-18-007 procedure [37]. After this transformation, the resulting data were validated using the same criteria as with the station and then compared with the NOM-025-SSA1-2021 reference values.

2.4. Fixed Pollution Source Identification

The identification of fixed pollution sources was performed using a current database from the SDS. The fixed pollution sources were clustered according to the productive sector (Figure 1).

2.5. Data Analysis

The statistical analyses for this work included the Kruskal–Wallis test, Pearson correlations between the PM2.5 and PM10 concentrations and meteorological parameters, and the multiple range test, all conducted using Statgraphics 19. Additionally, the data similarity analysis, principal components analysis, and mean square displacement analysis were performed using the Primer 6 + Permanova software. The Kruskal–Wallis test was used to ensure the significance of the meteorological parameters that did not follow a normal distribution. The Pearson correlation was used to analyze the relationship between PM2.5, PM10, and the meteorological variables. The multiple range test was used to cluster the PM data into groups based on meteorological variables.
Additionally, the PM2.5/PM10 ratio was calculated to determine the air pollution source. This is primarily used to identify primary sources of PM such as anthropogenic (higher ratio values) or natural (lower ratio values) sources [42,43,44,45].

3. Results

3.1. Temporal Analysis Results

Table 3 indicates that the average concentration exceeded the limit for 24 h and the annual limit from 2019 to 2021, and the annual average concentration exceeded the limit from 2018 to 2019. The results showed that the air quality in Mérida did not comply with the Mexican standard established in the NOM-025-SSA1-2021 for the study period. Compared with the U.S. EPA Air Quality Standards (35 μg m−3) [2] and the World Health Organization (15 μg m−3) [3] for daily values, the air quality in Mérida City poses a concern for the health of residents in the study area. An upward trend in average concentrations was observed in the years before the COVID-19 pandemic. For 2022, due to a malfunction in the airborne particulate matter monitor, no data were retrieved.
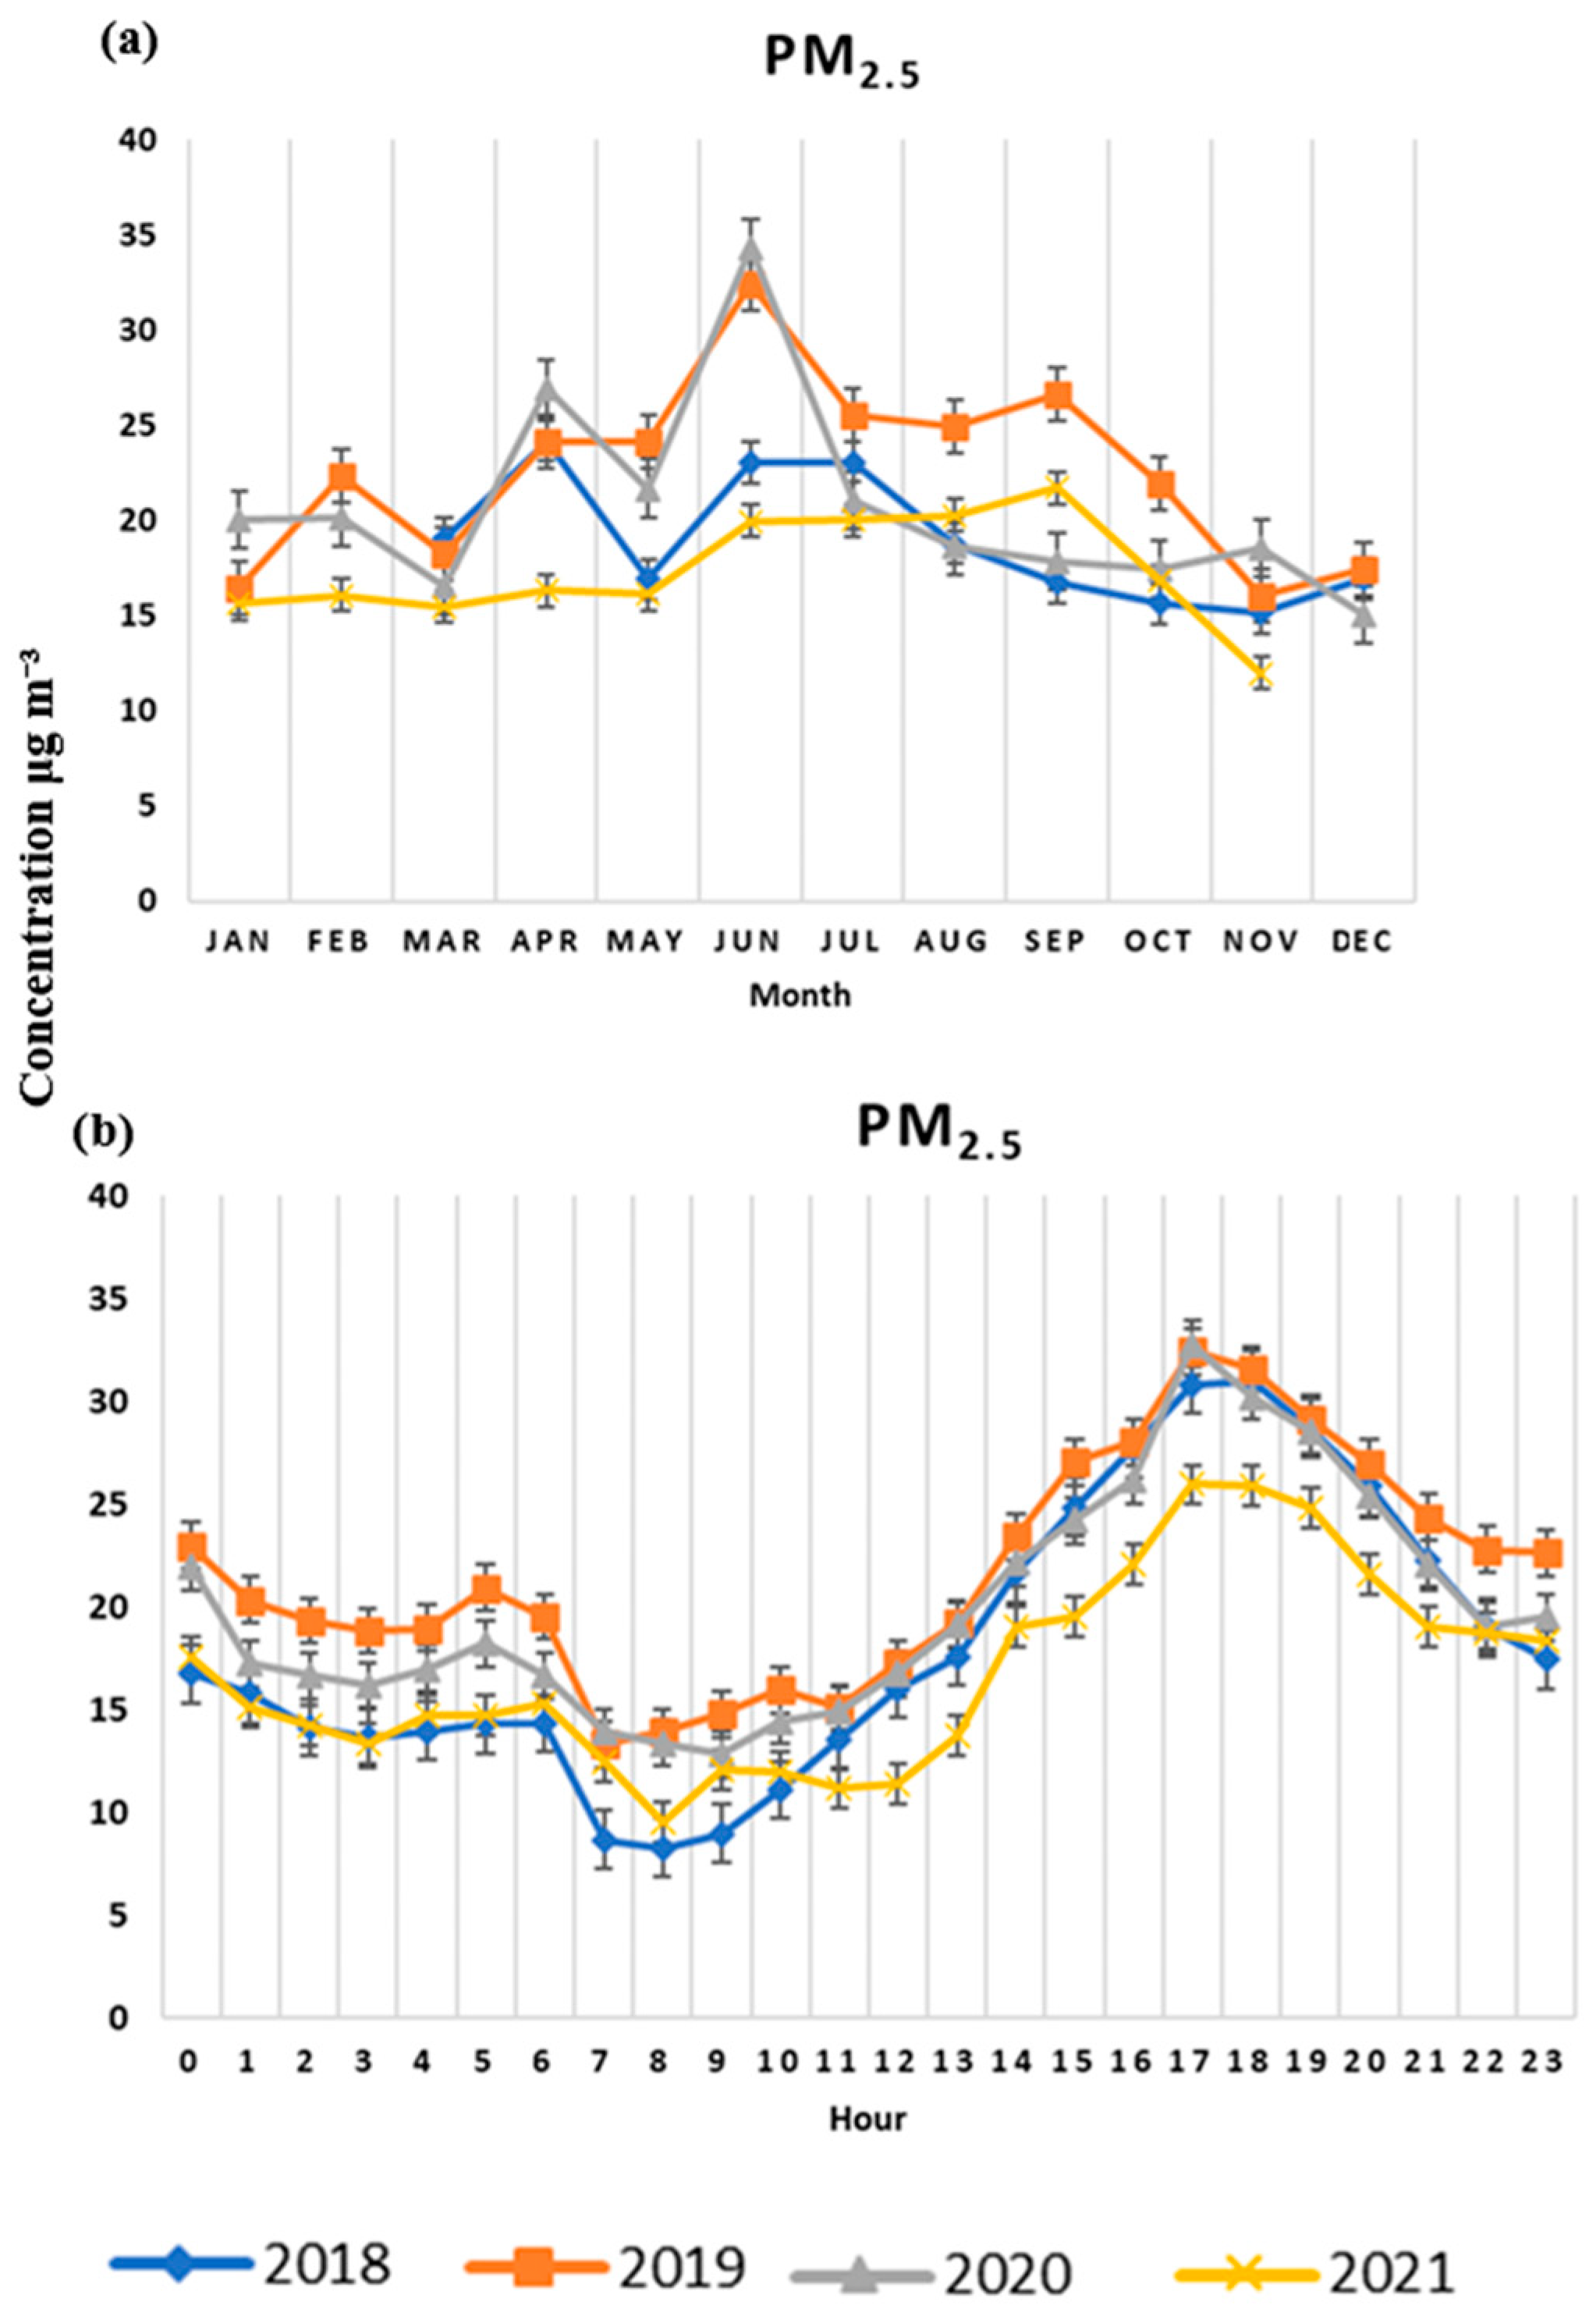
The monthly and hourly average concentrations of PM2.5 were plotted to analyze trends in each period (Figure 2). The maximum monthly concentration occurred in June for both 2019 and 2020. In the hourly trend, the maximum concentration was observed between 17:00 and 19:00 local time (GMT-6) for all four years. The diurnal variation of the PM followed a bimodal distribution, similar to that reported by Choudhary et al. [46] in a 3-year period.
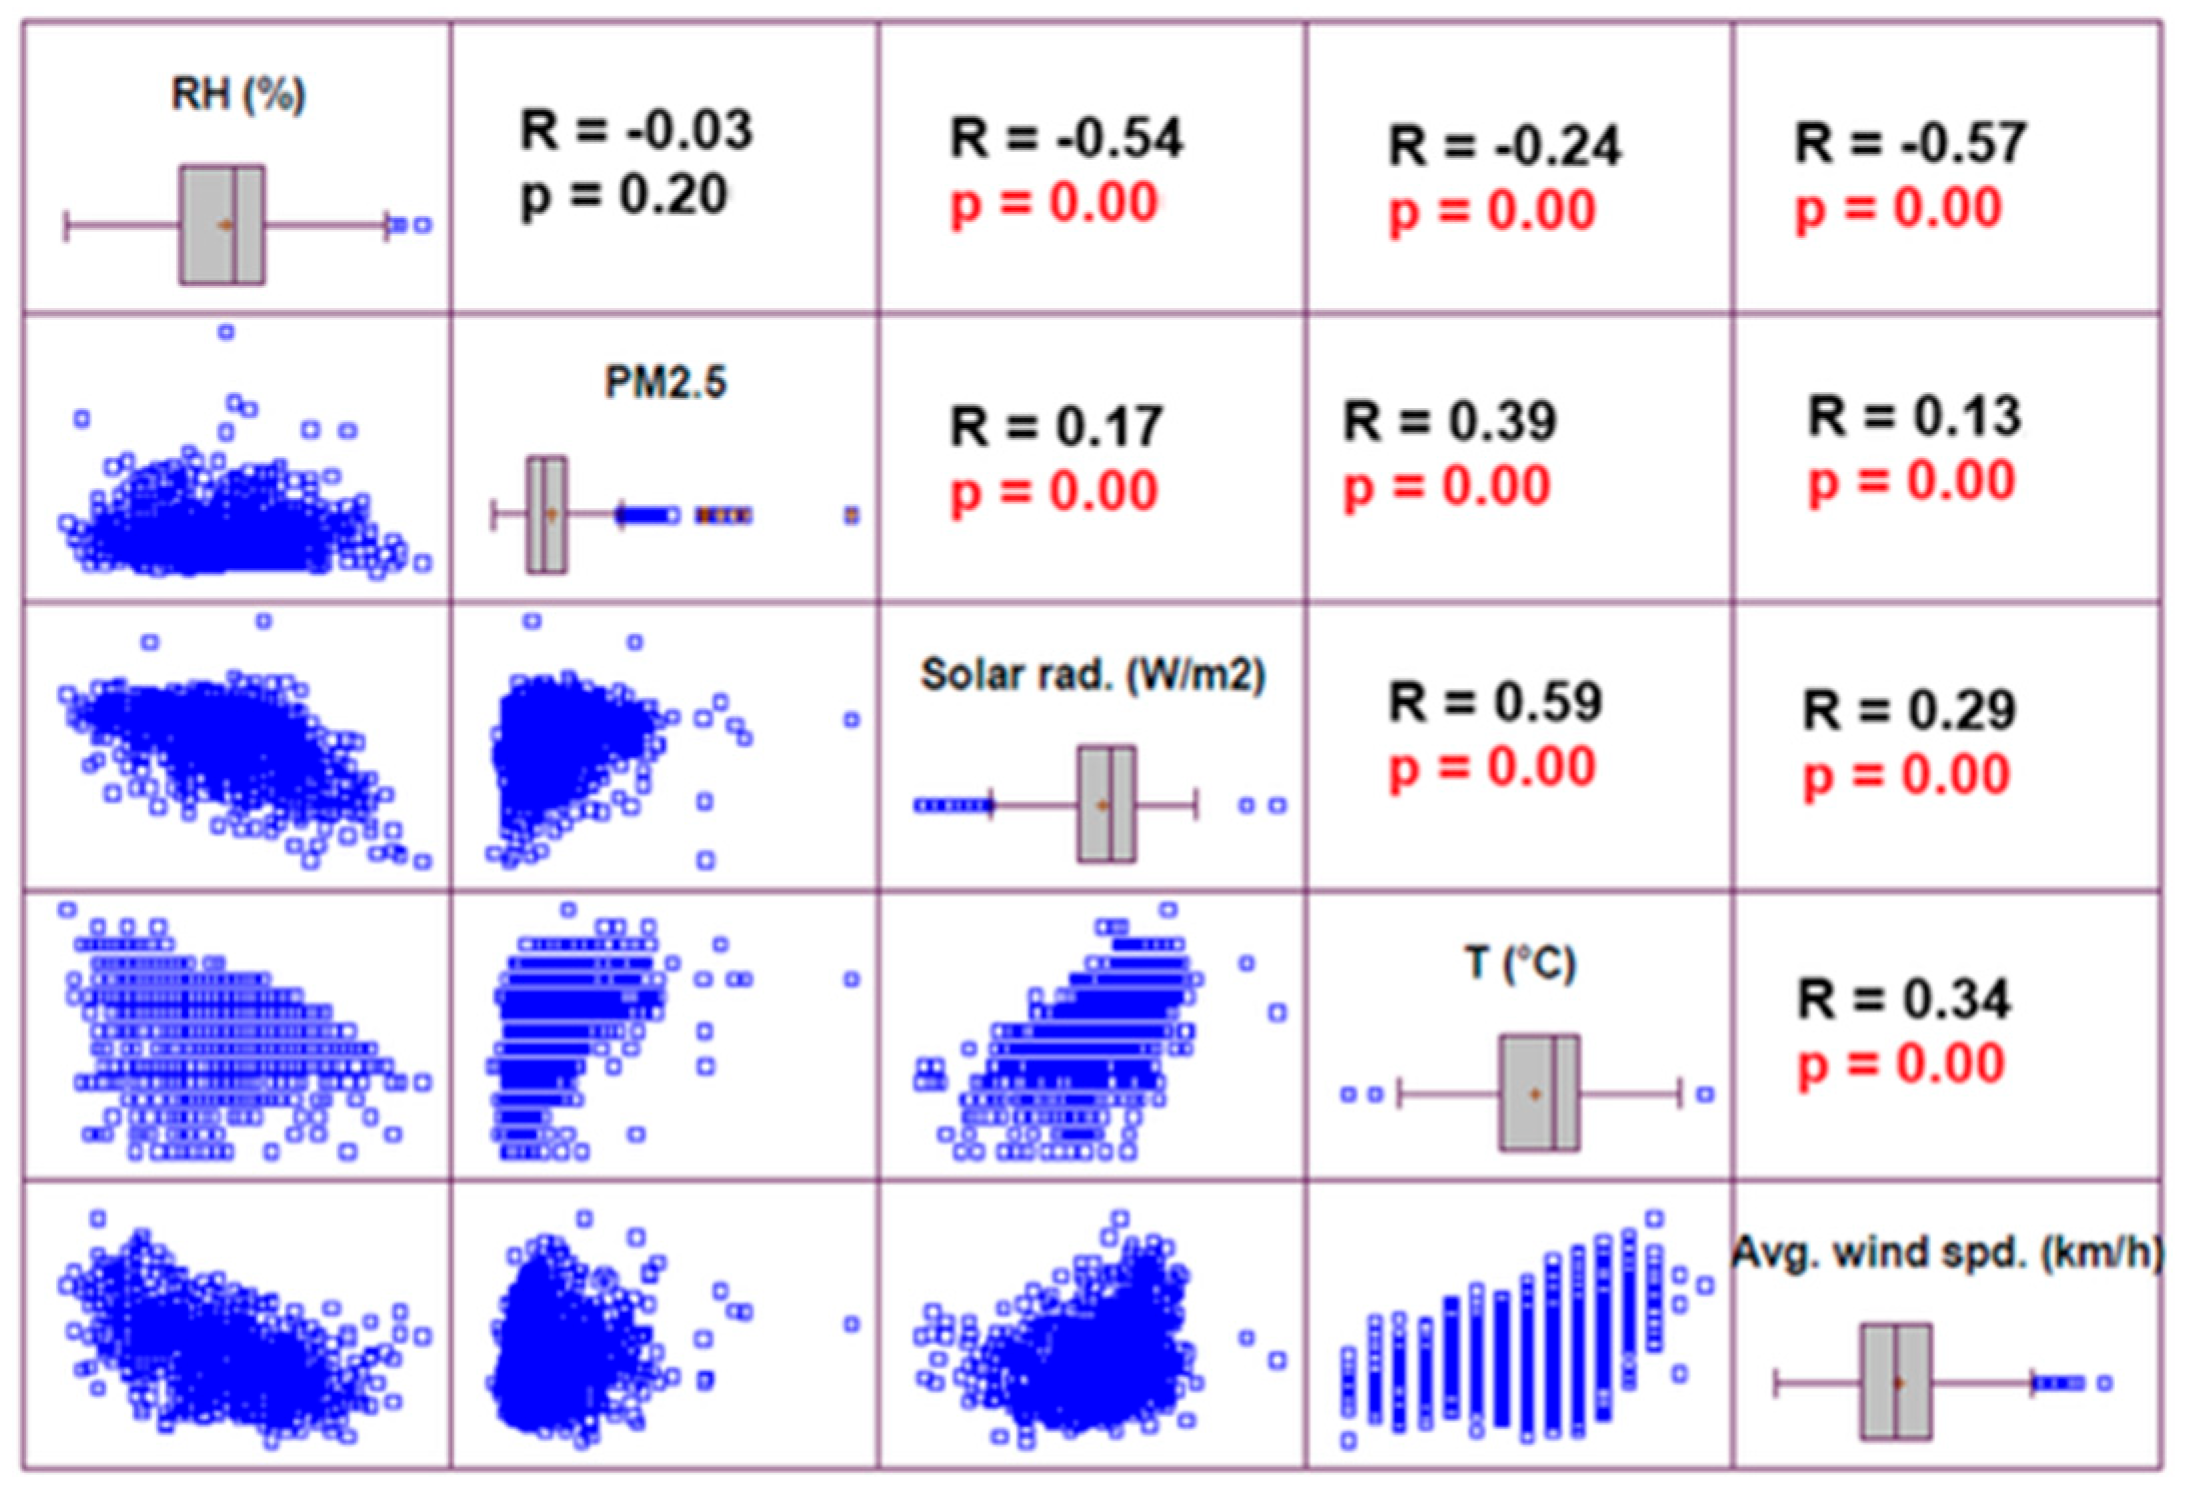
Figure 3 describes the correlations between meteorological variables and PM2.5 concentration, along with the p-values for each correlation; the blue points in the lower cells represent the distribution of the data, and p-values in red represent significant correlations. The results showed significant positive correlations between solar radiation (R = 0.1711), ambient temperature (R = 0.3962), and average wind speed (R = 0.1328).
Ambient temperature, as an indirect factor of the Mérida season, significantly influenced the monitored concentration. Historically, the period from May to July recorded the highest temperatures in Mérida, around 35 to 38 °C [47]. During this period, energy demand for domestic and industrial uses tends to increase, sometimes causing isolated blackouts around the country. In the Yucatán Peninsula, from May to September, the highest energy consumption is reported, making it the highest in the country [48]. The increase in energy demand and production may lead to higher PM2.5 concentrations in the city, as power generation plants are situated along the city’s peripheral highway.
Average wind speed is related to possible air pollution drift from other areas in the city. Liu et al. [27] analyzed this effect in different cities and concluded that wind is a predominant factor in PM transport.
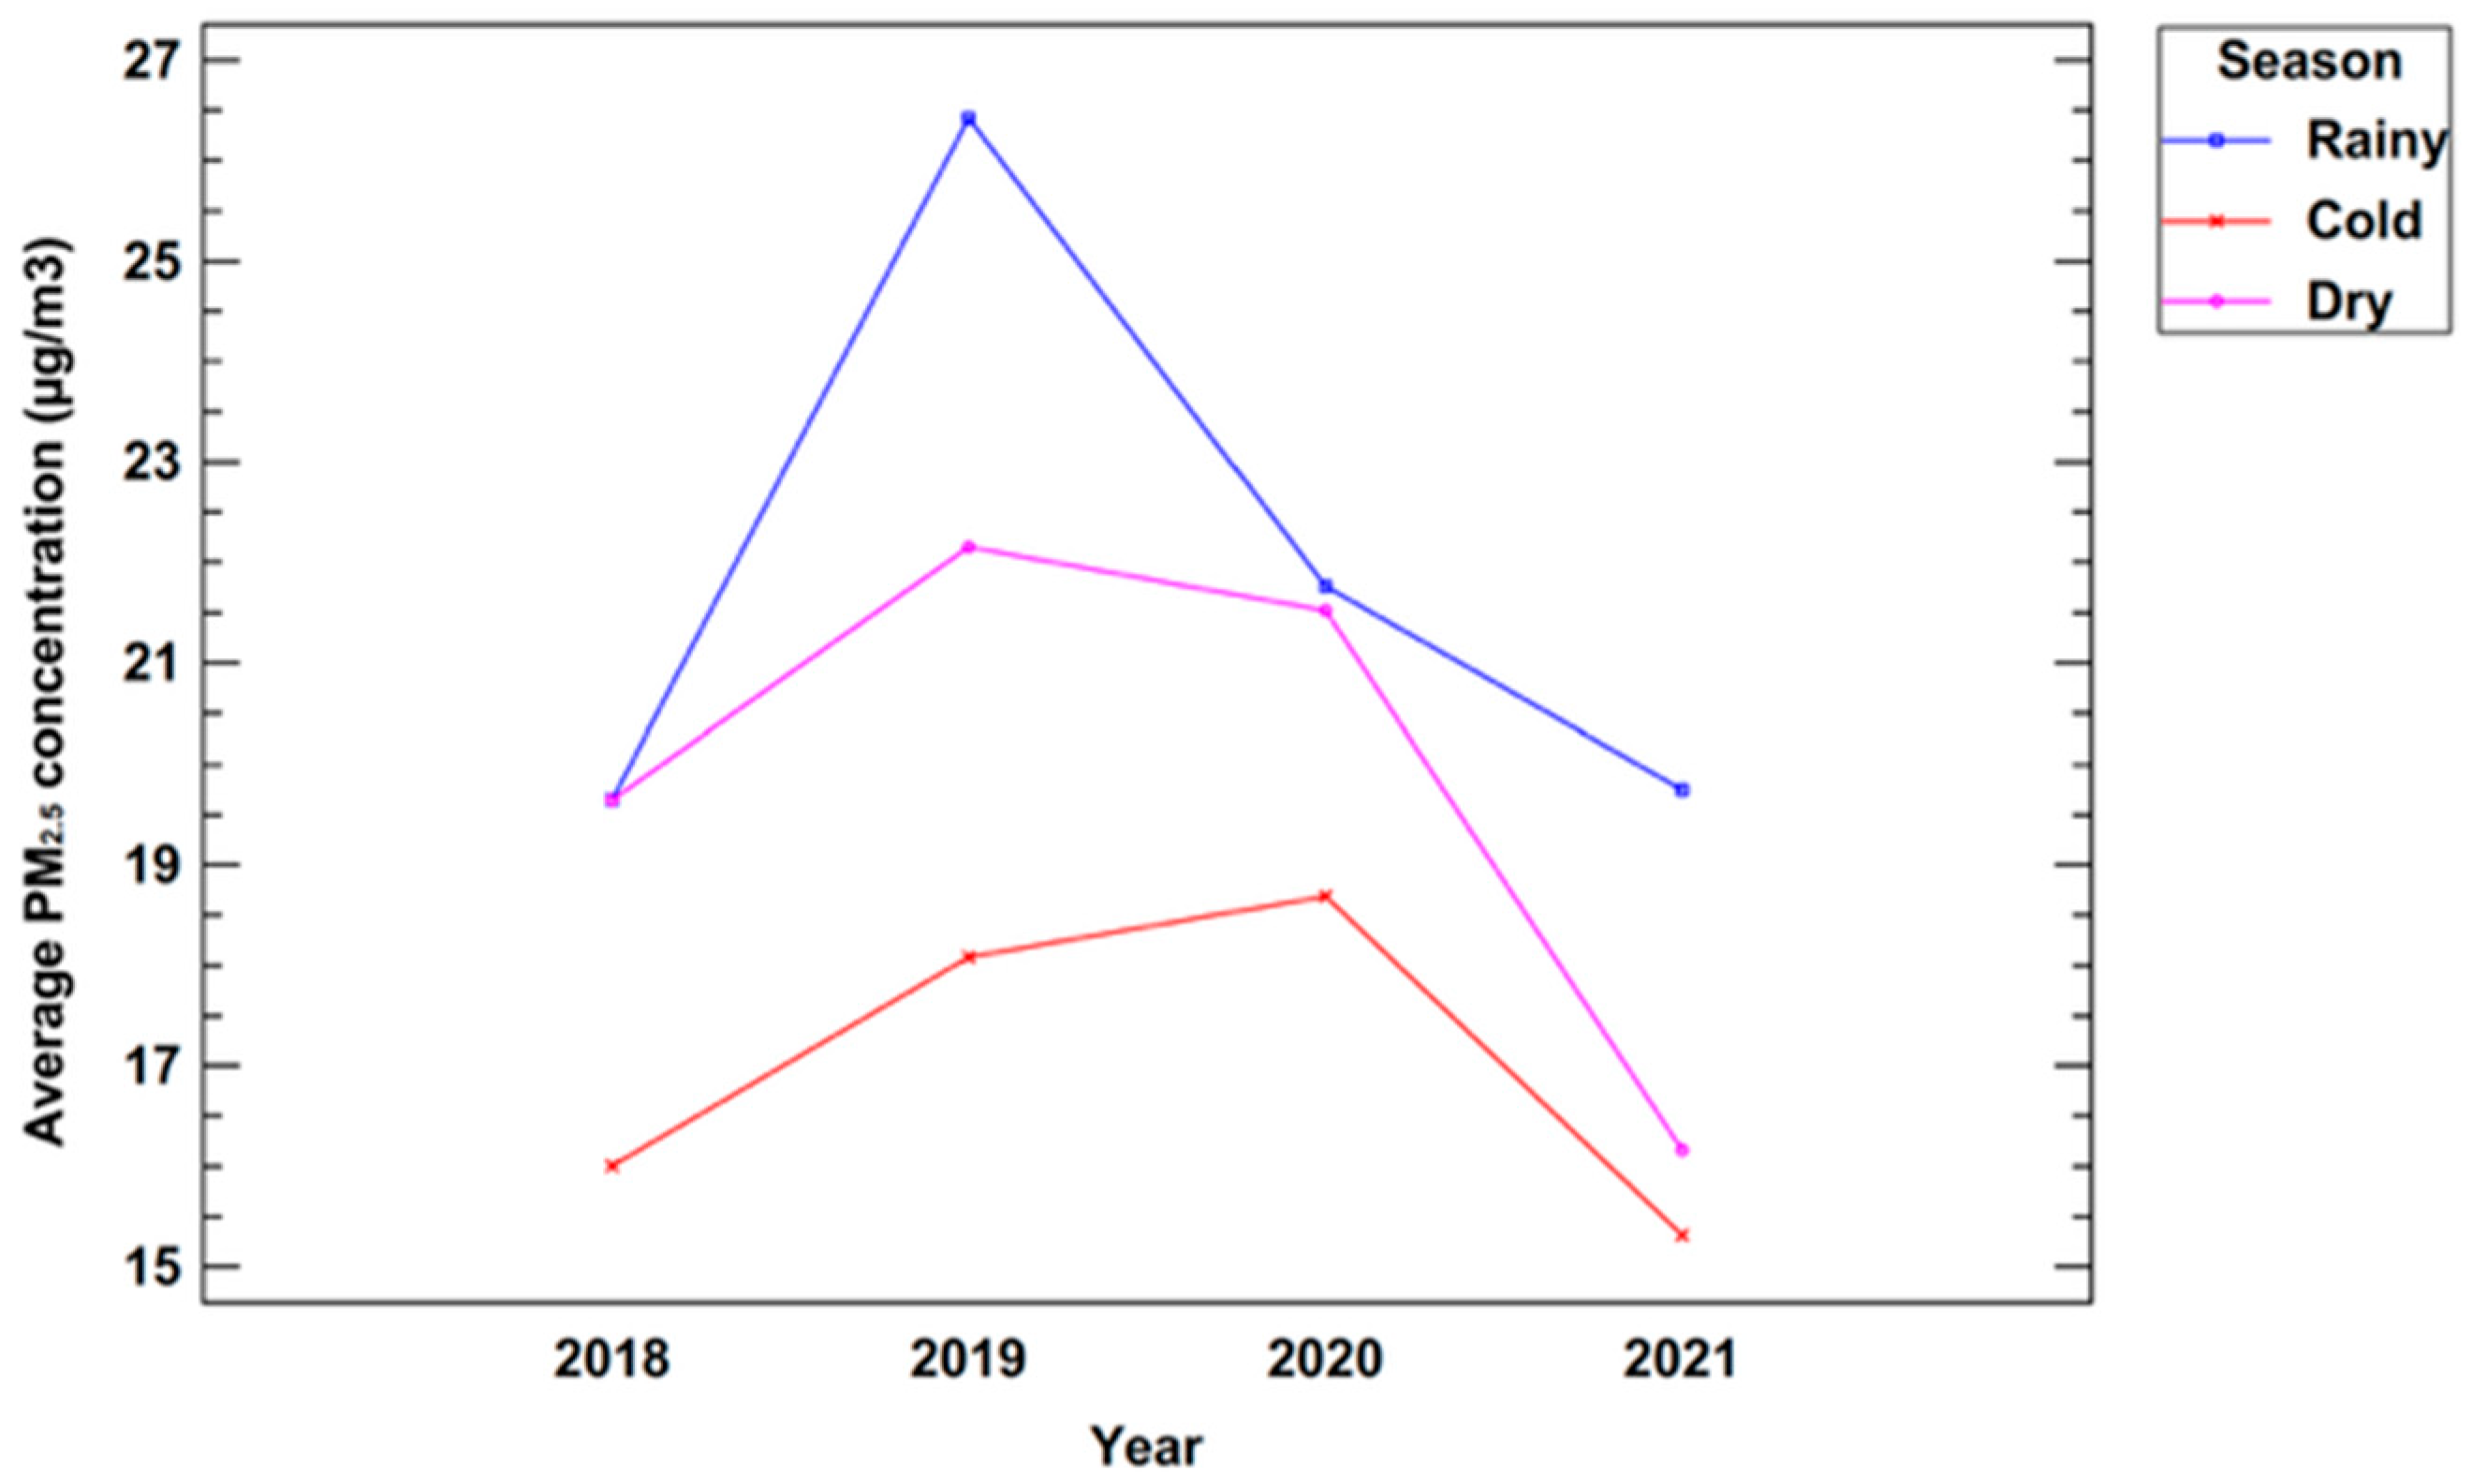
In the temporal analysis, the Kruskal–Wallis test revealed significant differences (p < 0.05) between the three seasons (dry, rainy, and cold) and the four years of the study period. For this reason, the average PM2.5 concentrations were plotted by year and clustered by season in Figure 4. Seasonal variations of PM associated with the precipitation difference in each season of the year have previously been reported [49].
Figure 4 shows a general decrement in the average PM2.5 concentration in 2020 and 2022, resulting from the prevention measures due to COVID-19 in Mérida.

3.2. Spatial Results

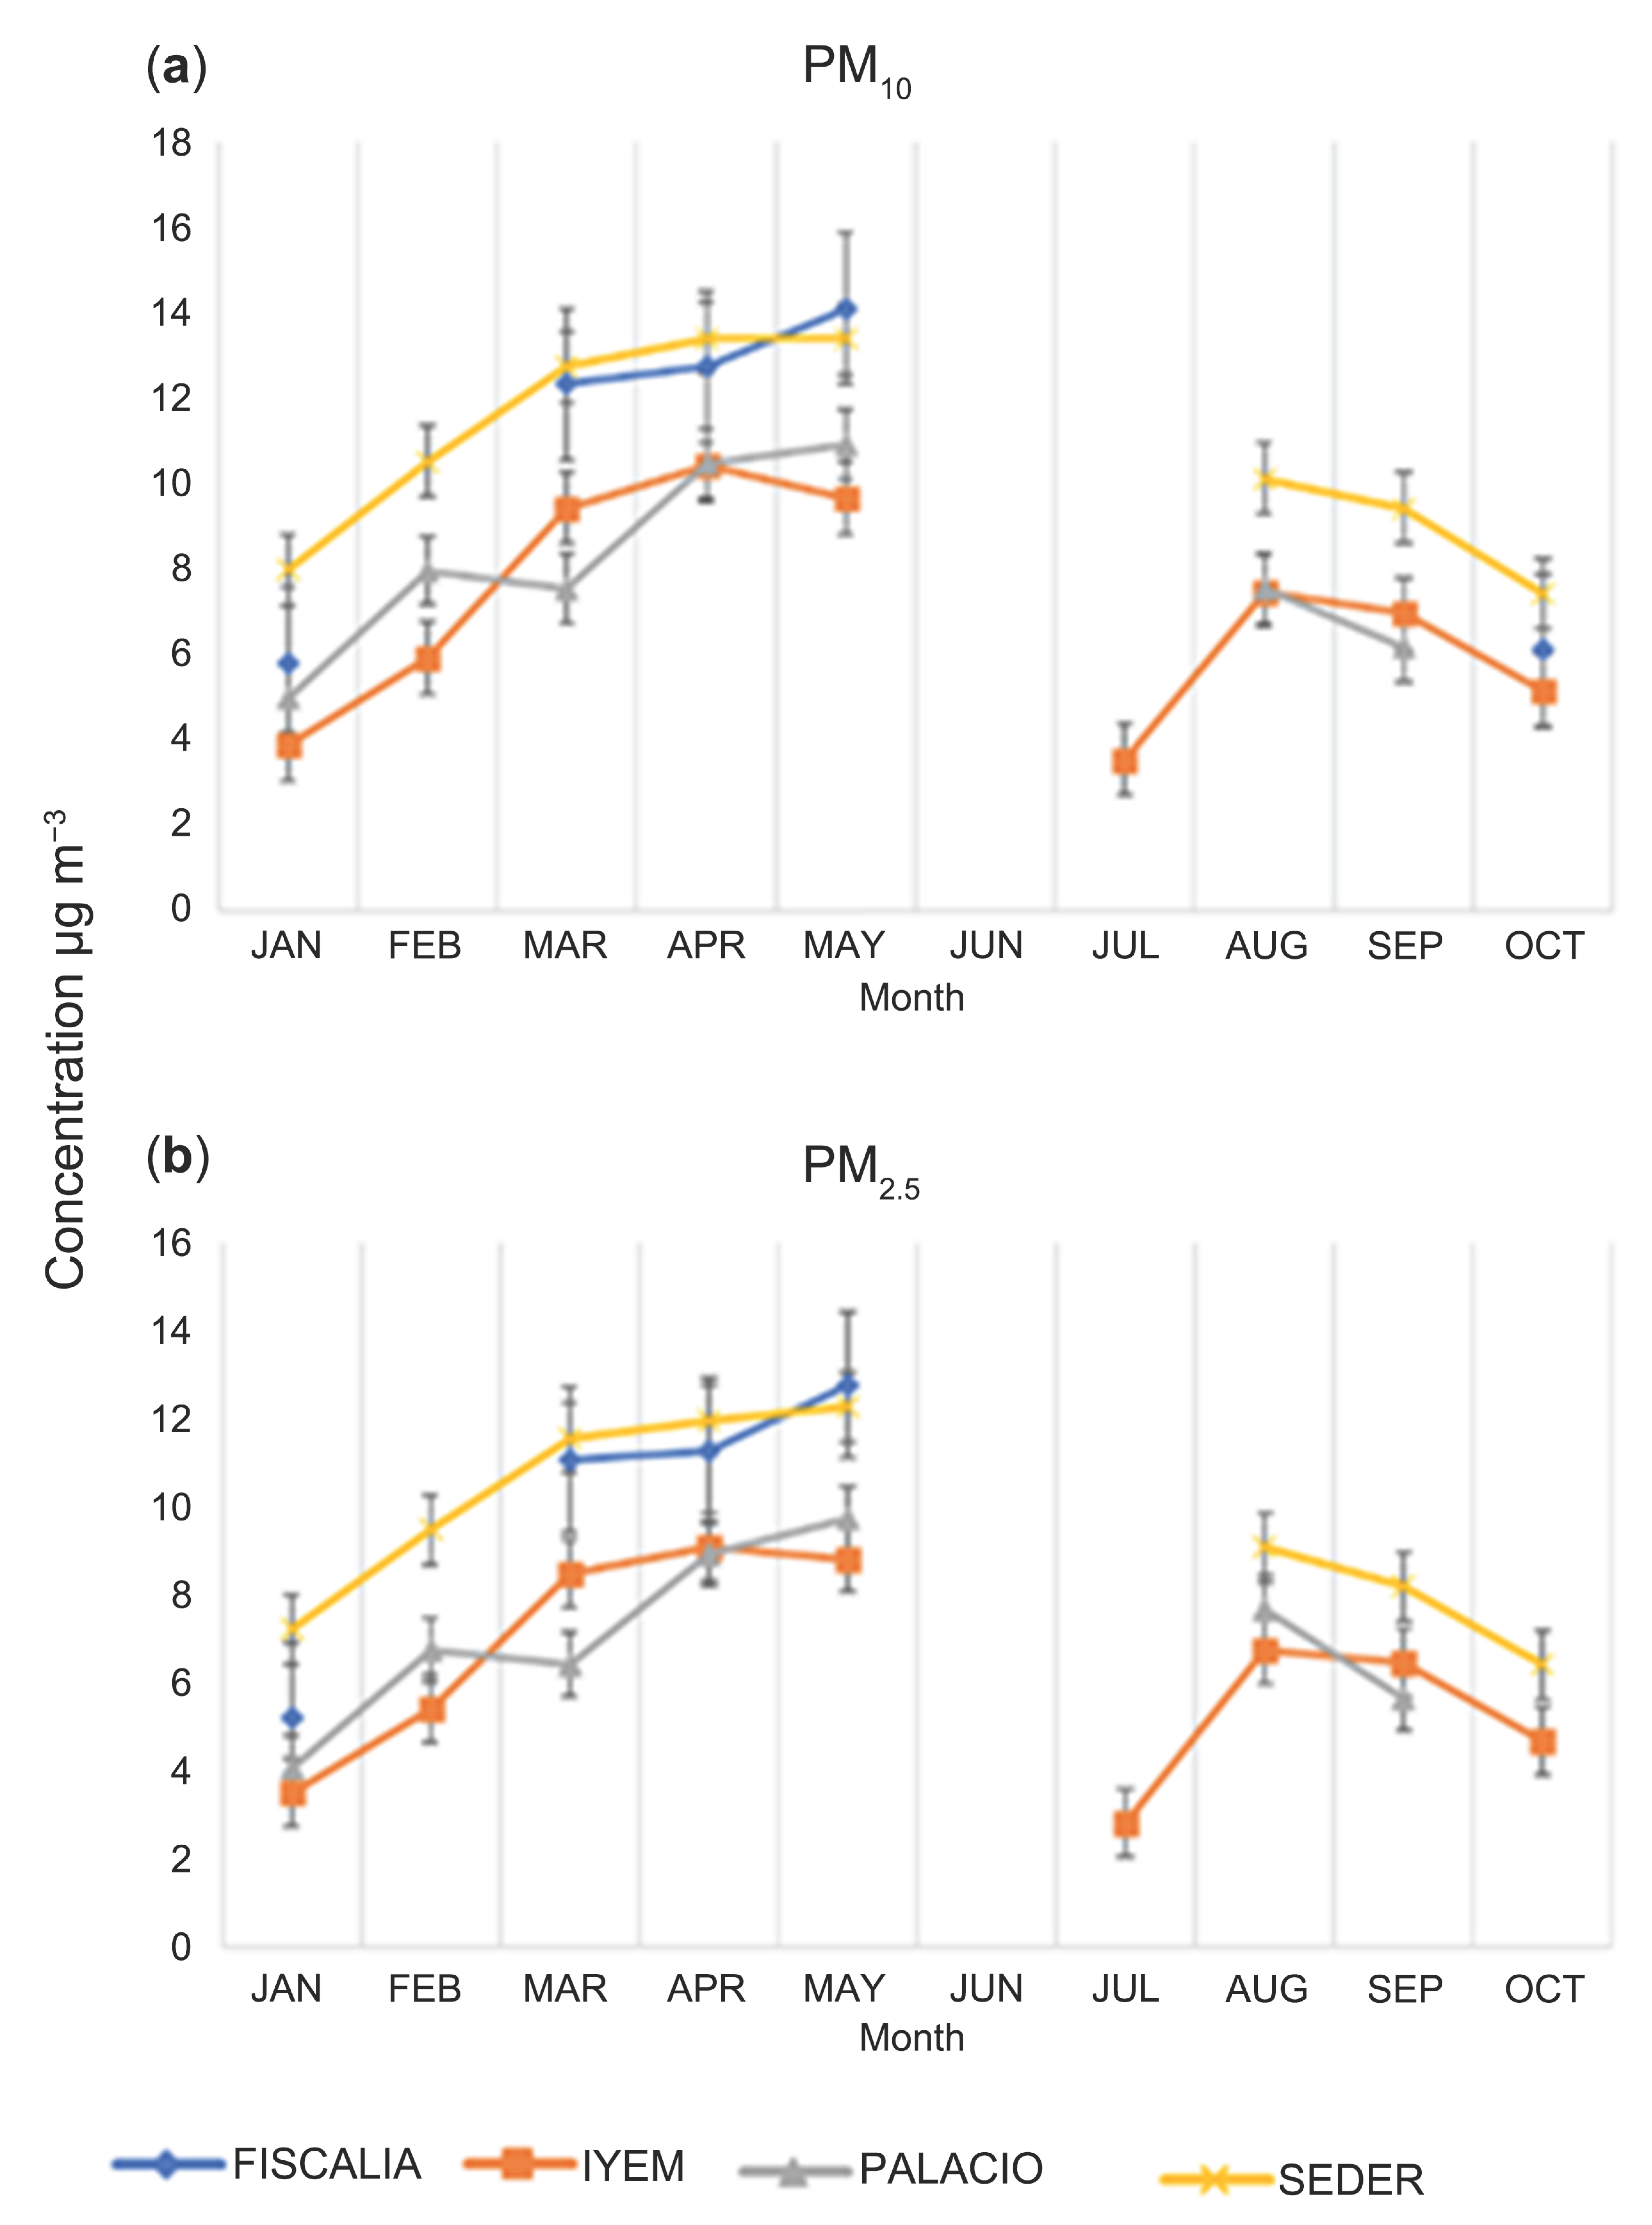
Figure 5 shows an increase in particulate matter concentrations from January to May, followed by a decrease in concentrations in all sensors from August to October in 2023. No data were available in June due to a web datalogger malfunction. However, the tendency of data during that period seemed to be decreasing, and no effects in data analysis were presented.
In Figure 6, the maximum concentrations of PM2.5 and PM10 were reported in all sensors from 6 to 7 h; these values coincide with the traffic peaks recorded in the city. Also, the sensors exhibited different hourly behaviors in the station data; it could be assumed that the difference in the study period and the sources of pollution present at each point were responsible for this discrepancy.
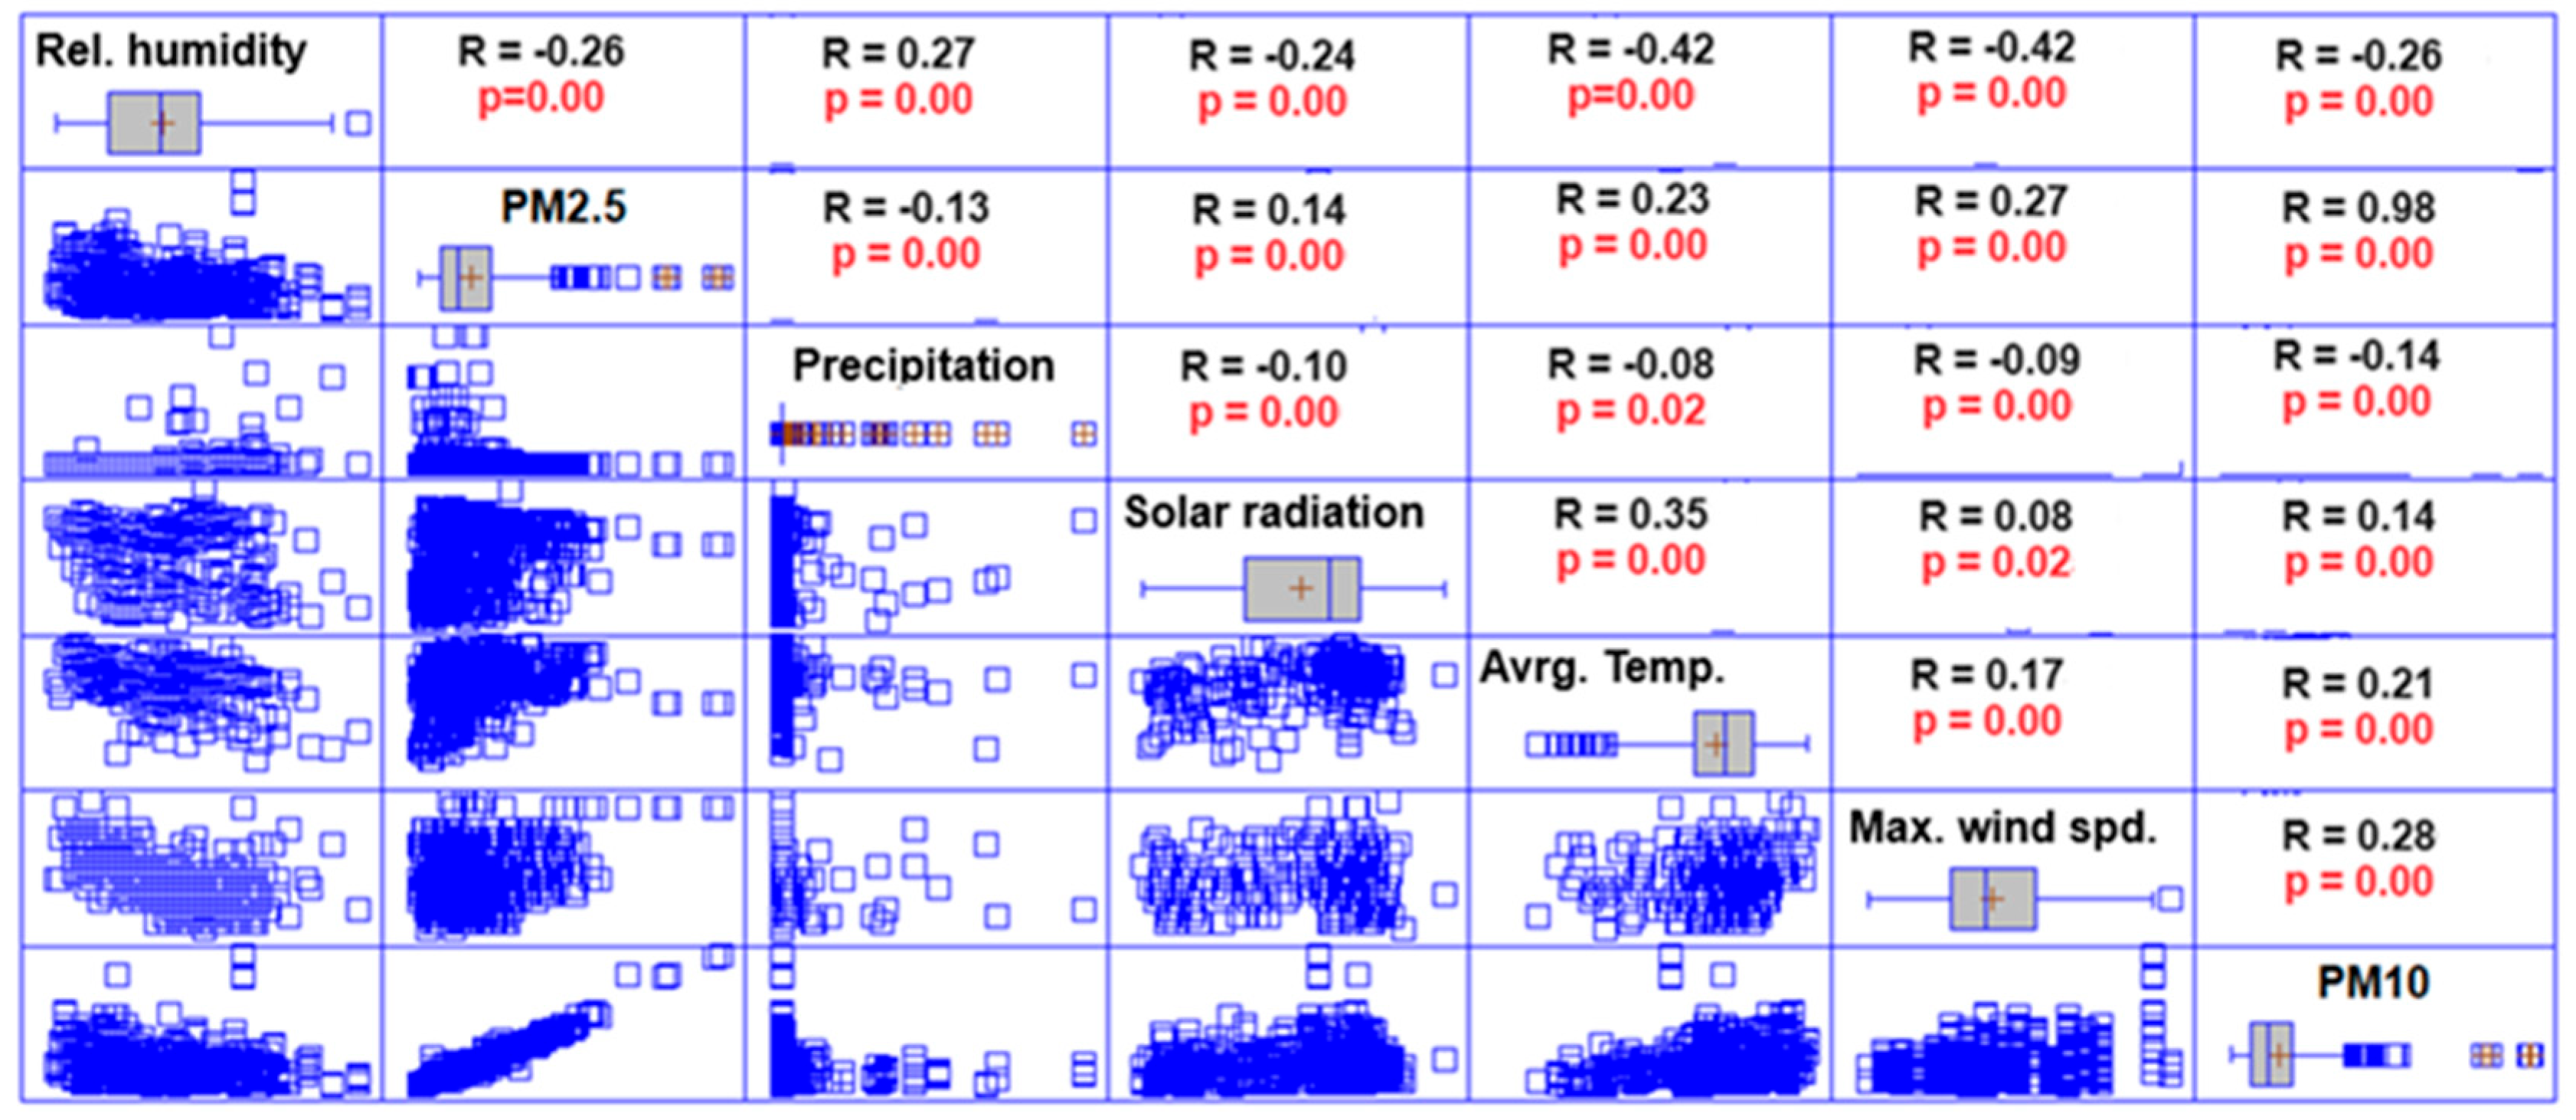
Figure 7 indicates that all meteorological variables were significant for the concentration of PM10 and PM2.5 of the sensors, along with the p-values for each correlation; the blue points in the lower cells represent the distribution of the data. Average humidity and precipitation have a negative correlation with particulate matter because these factors contribute to its deposition on the ground [50], thereby reducing the concentration in the air. The correlation with the maximum wind was positive, suggesting that some particulate matter may be being carried by the winds toward the sampling points. This phenomenon has also been previously reported [51]. However, calculating the return trajectories of the winds would be necessary to determine the source of such pollution [52]. The correlation between PM10 and PM2.5 is high, and this relationship has been studied and found to be linear [53].
The Krustal–Wallis test (Table 4) indicates that all the factors considered were significant in varying the PM10 and PM2.5 concentrations. However, based on their p-value, spatial factors such as sensor location and the presence of fixed sources were the most significant. Similarly, environmental factors such as relative humidity and wind speed were shown to have a more significant impact on the concentration of particulate matter.
From the multiple range test, two groups of variation were observed. One group, formed by the rainy and cold seasons, corresponded to the lowest average values, while the other group, formed by the dry season, corresponded to the highest average values. Similarly, two groups of variations in the average particulate matter concentrations were identified according to the location of the sensors. The first group, consisting of the IYEM and PALACIO sensors, corresponded to the lowest averages. In contrast, the second group, made up of the SEDER and FISCALIA sensors, corresponded to the highest averages. According to Figure 1, there was a noticeable difference in the pollution levels of PM10 and PM2.5 between the south-southwest area of the city and the central-northern area.
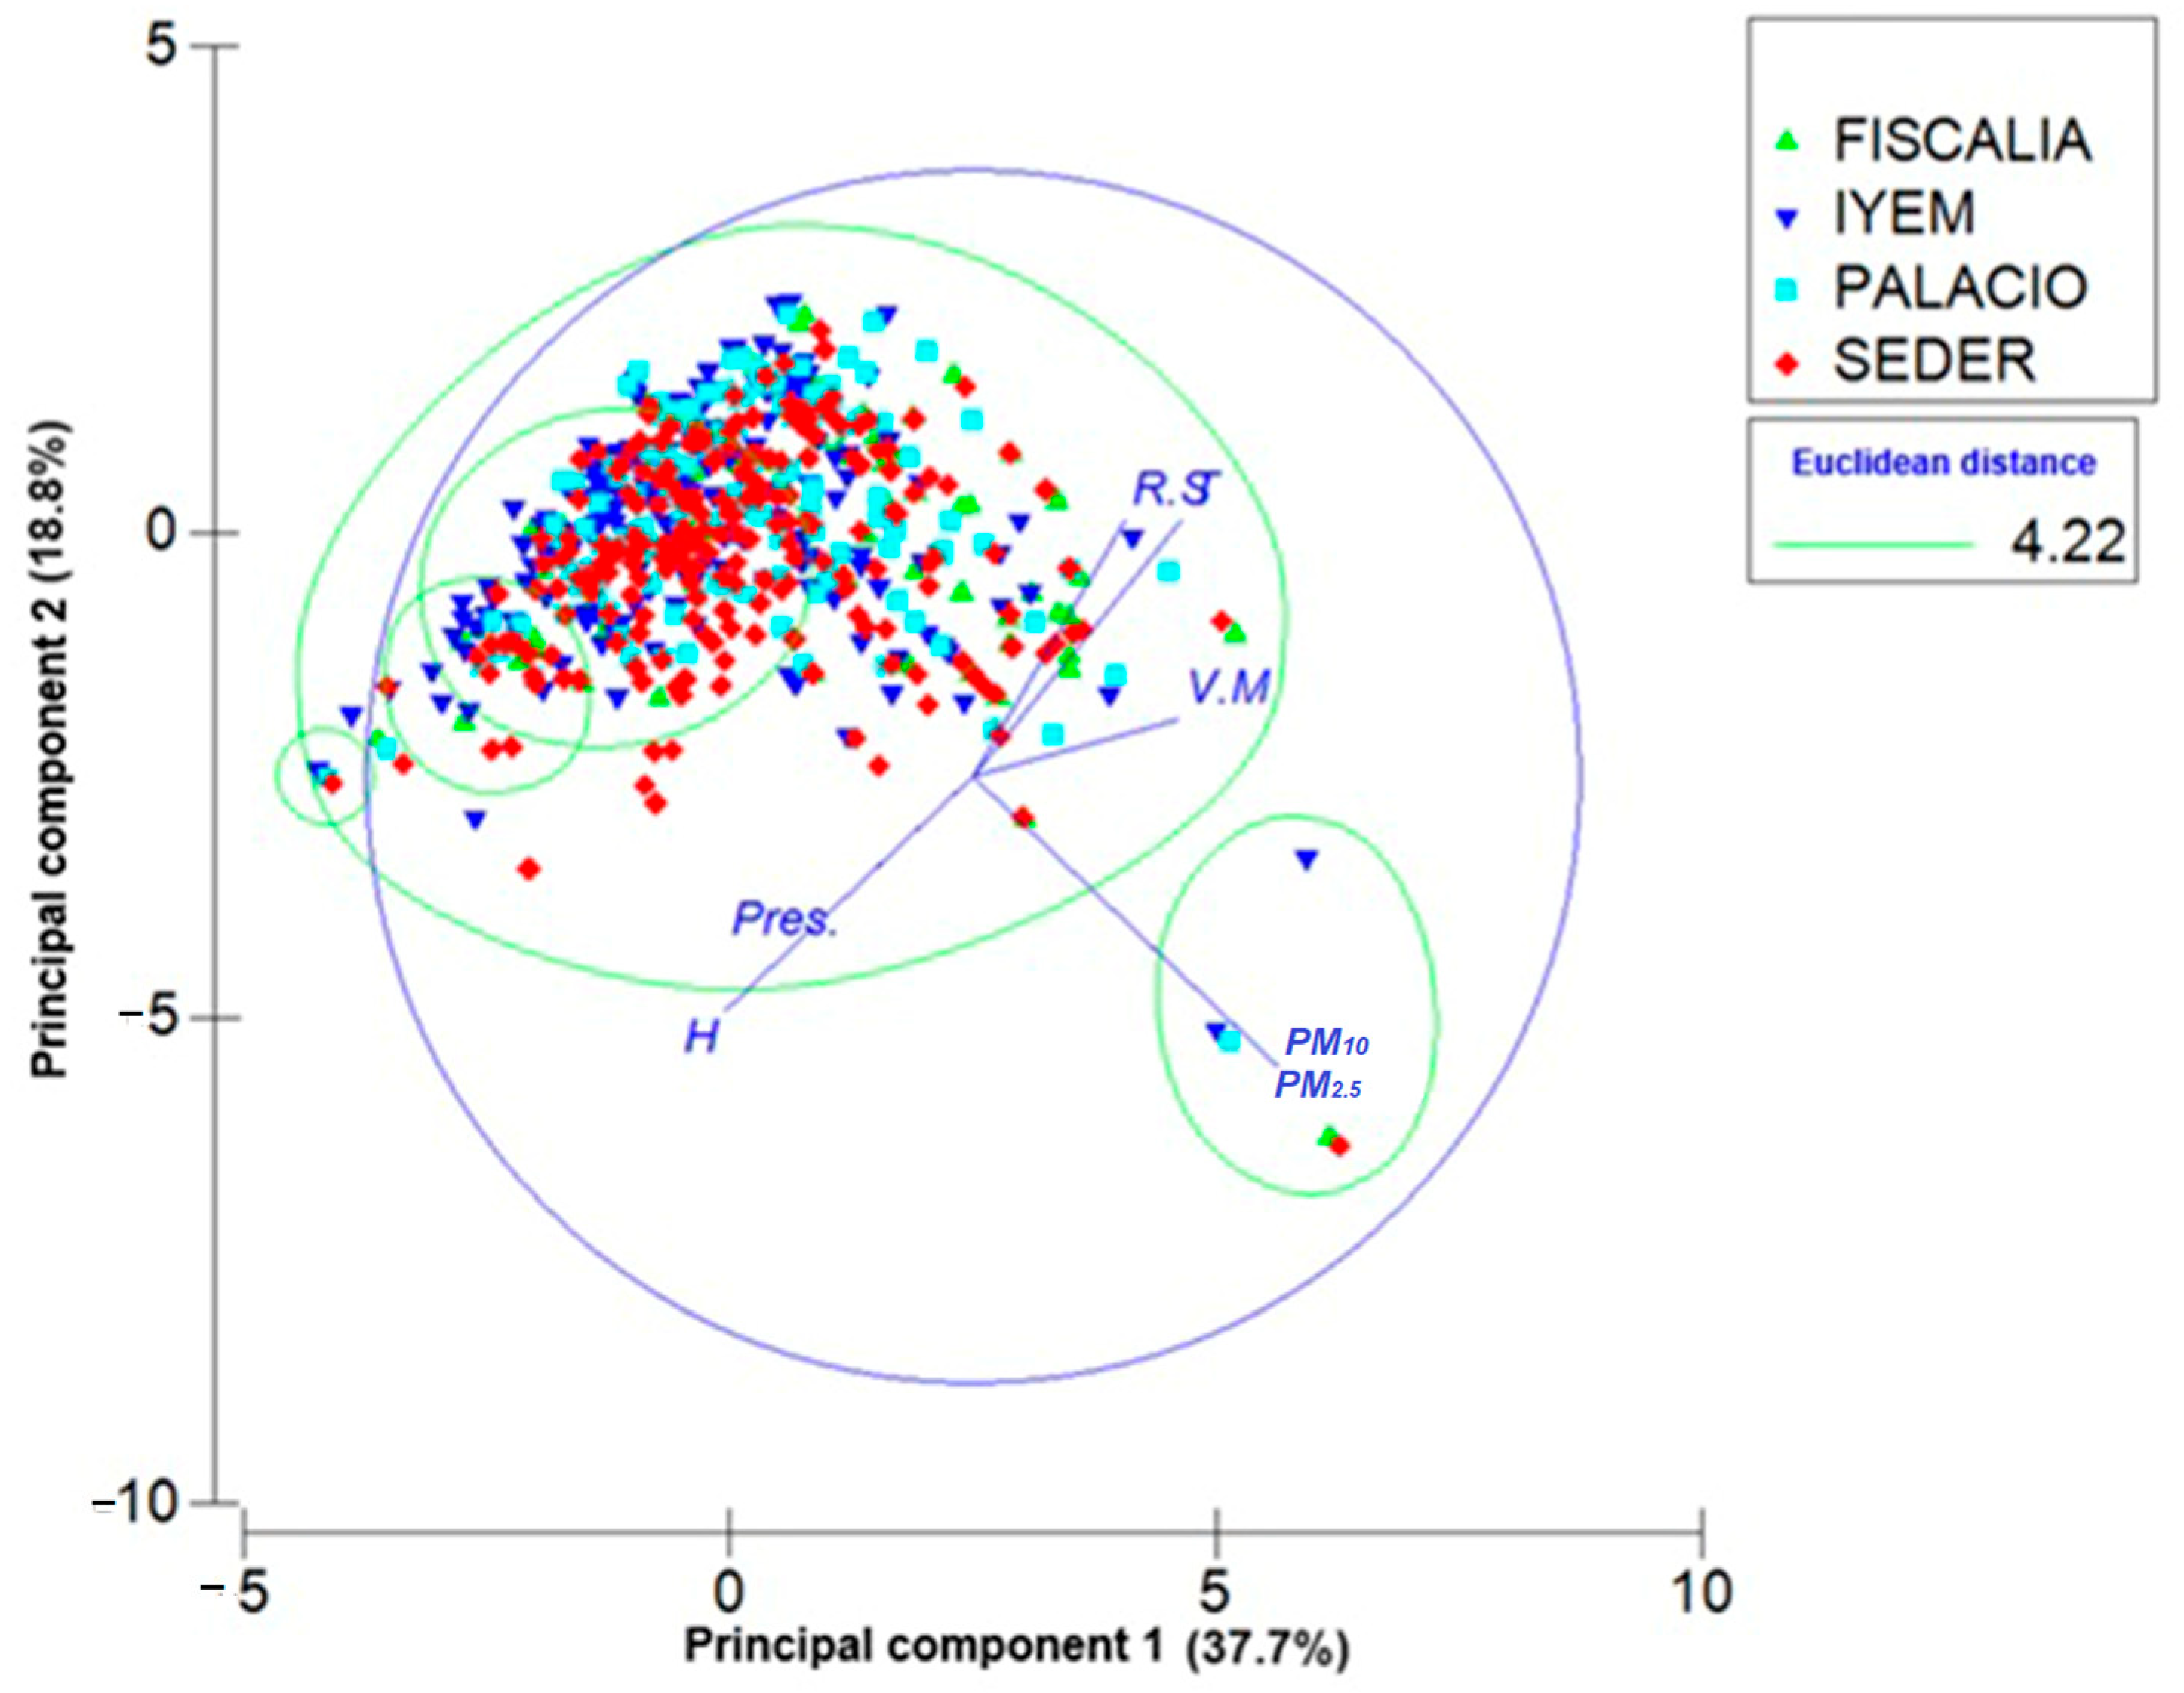
Additionally, to better understand the effect of factors such as solar radiation, maximum wind speed, precipitation, humidity, and average daily temperature on the PM10 and PM2.5 concentrations, principal component (PC) analyses were performed (Figure 8). A mean square displacement (MSD) analysis was also conducted specifically for the season of the year factor. Prior to the MSD analysis, a data similarity analysis determined the optimal Euclidean distance of 4.22 for the groups (clusters), which was then used in both the MSD and PC analyses.
The results of the principal component analysis (Figure 8) showed that the three principal components described 70.8% of the variation in the data, and the two components in the bi-graphic described 56.5% of the variation.
Figure 8 shows that the variables solar radiation (S.R.), mean temperature (T), maximum wind speed (V.M.), and PM10 and PM2.5 concentration had a positive influence on component 1 (X-axis). This indicates that increases in particulate matter in a specific area are related to increases in these parameters. In contrast, for component 2 (Y-axis), the variables precipitation (Pres) and relative humidity (H), along with the calculated concentrations of PM10 and PM2.5, had a negative influence. Therefore, this component mainly measures the effect of rain and humidity on particulate matter concentrations, establishing that increases in these factors reduce the particulate matter concentrations.
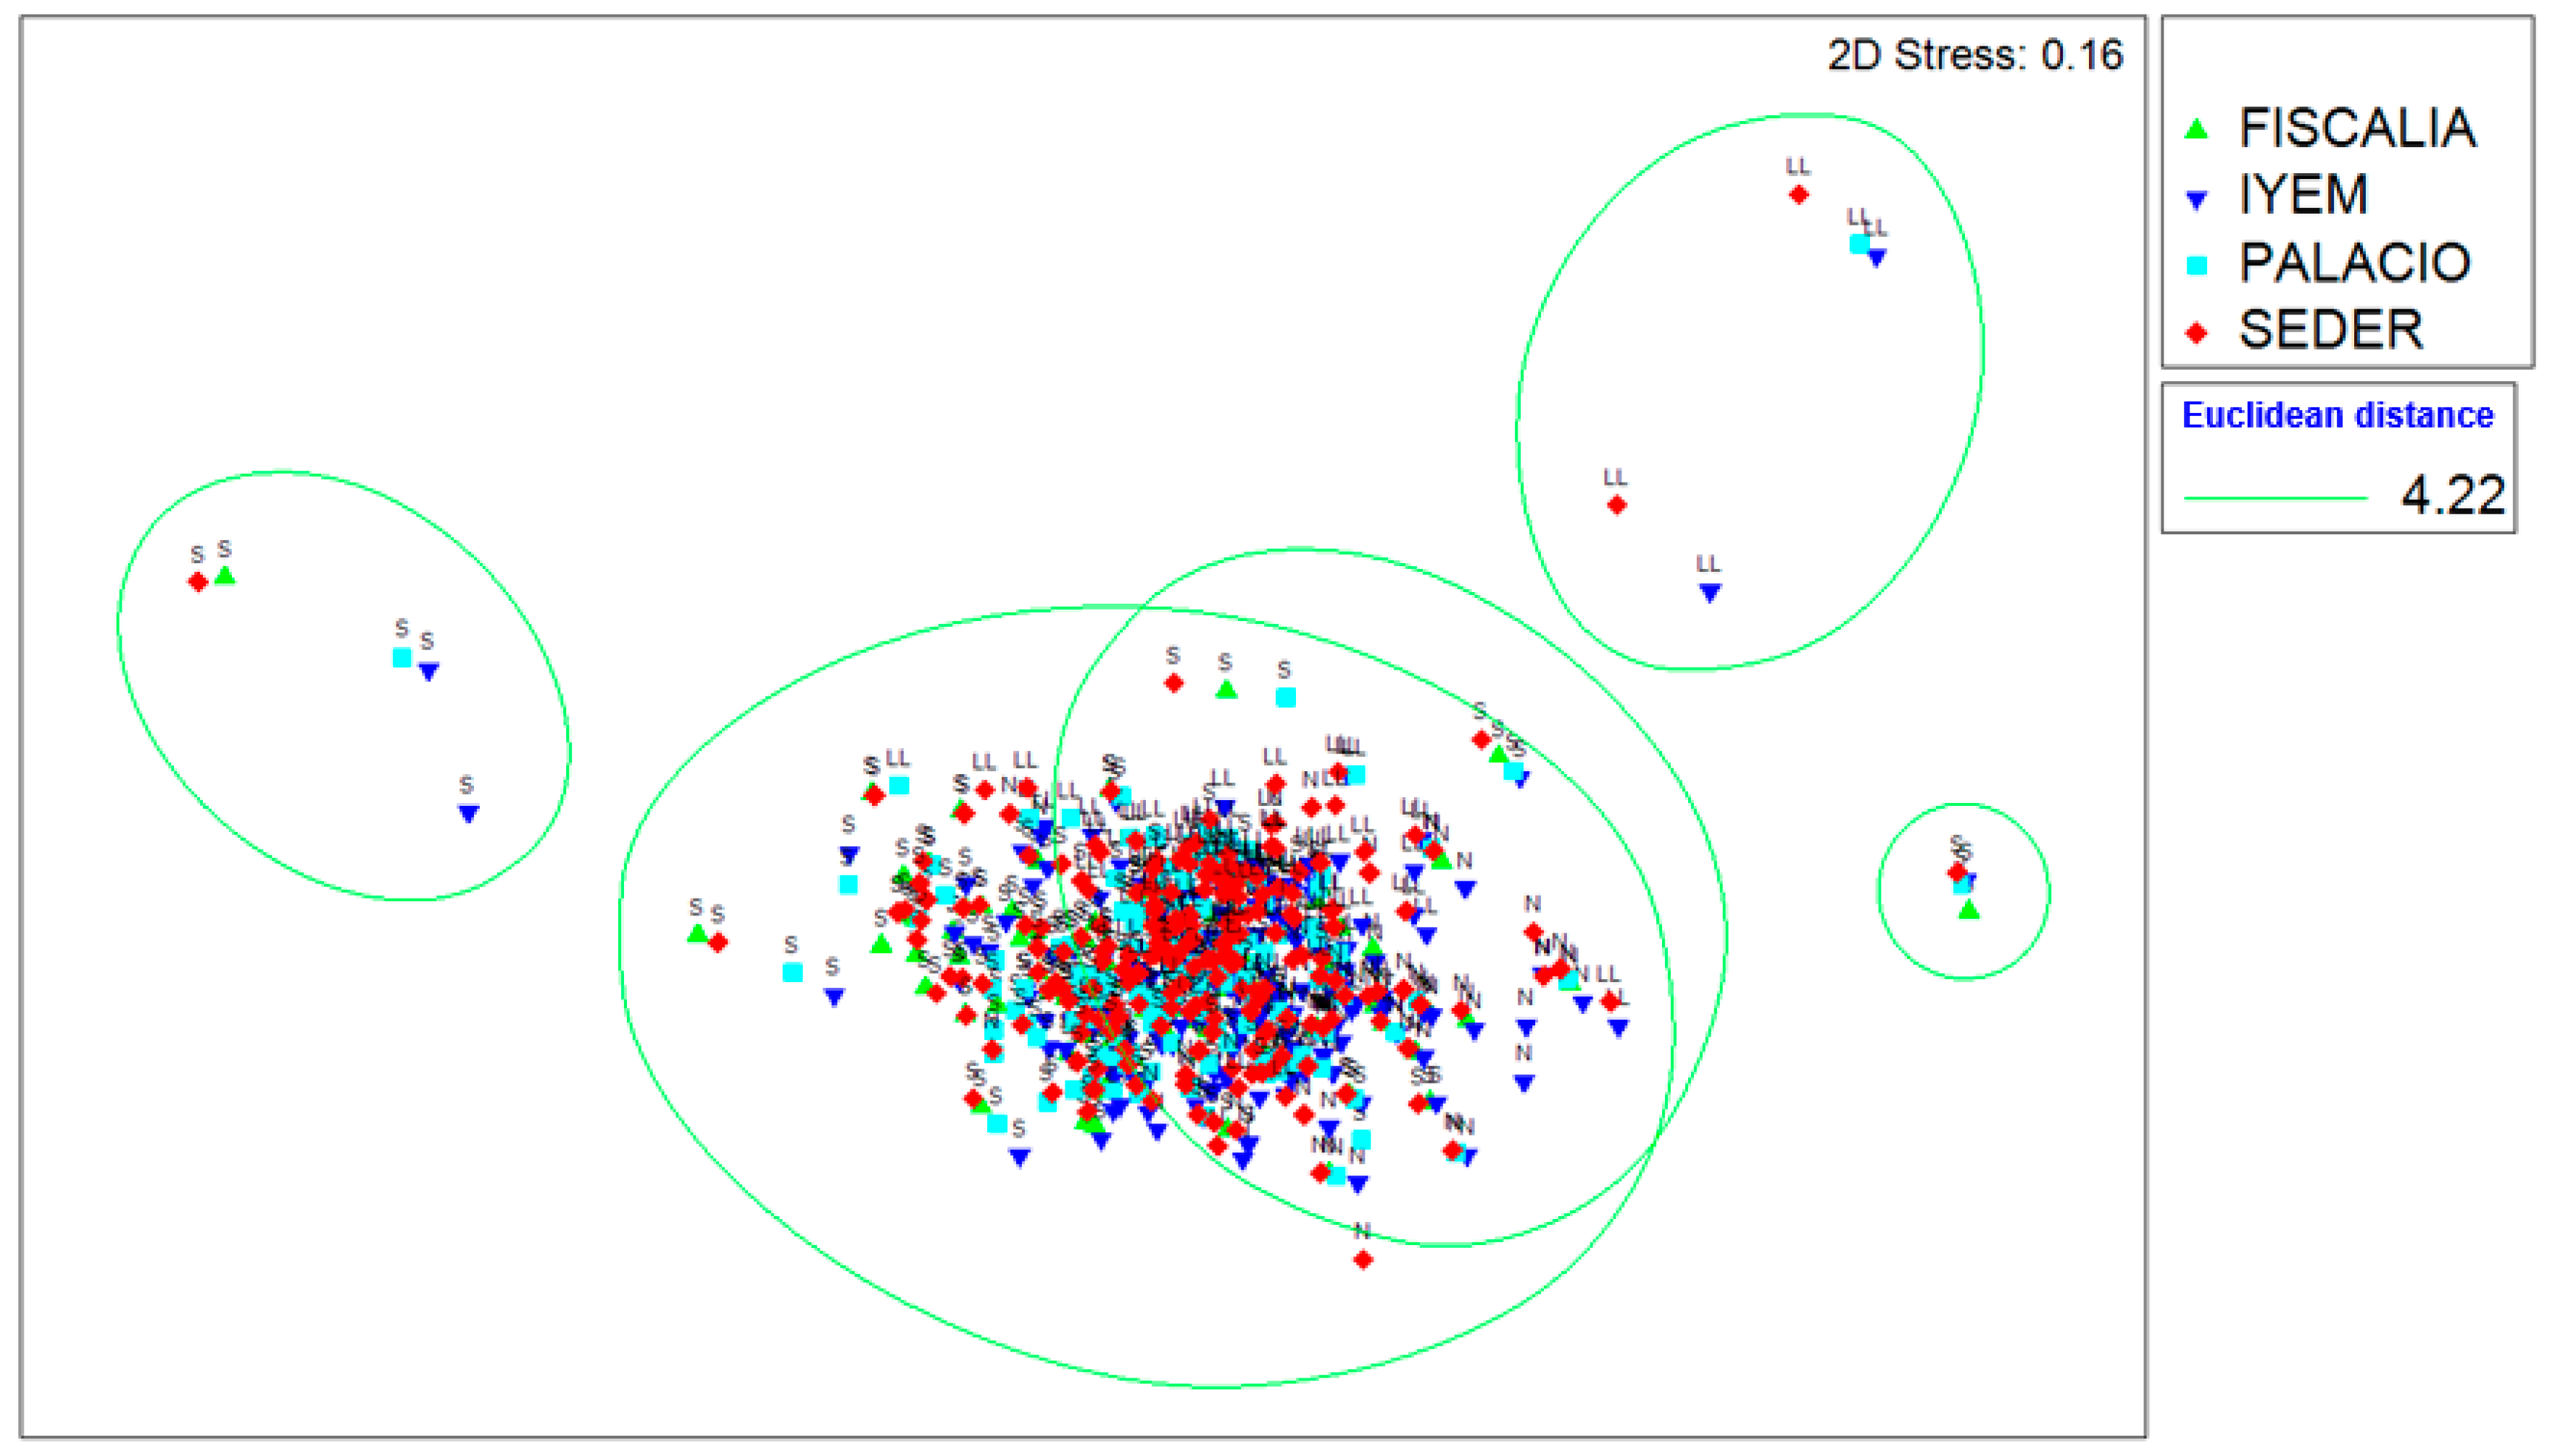
Finally, the MSD analysis is described in Figure 9; most data are concentrated regardless of the season and sensor location. However, it was also observed that the extreme values (highest and lowest) measured by the sensors were grouped according to the season of the year. It was also observed that the dry and rainy seasons influenced the maximum and minimum concentrations recorded. Additionally, the effect of the year’s season was evident in all of the data, which were grouped mainly into two clusters: the first comprises data from the rainy and northern seasons, and the second from the dry season. This is consistent with the results found in the multi-range test. The concentration grouping reported for the rainy and northern seasons was attributed to the wet deposition phenomenon during the rainy season and particle cleaning during the cold seasons. Both phenomena reduce particulate matter [54].
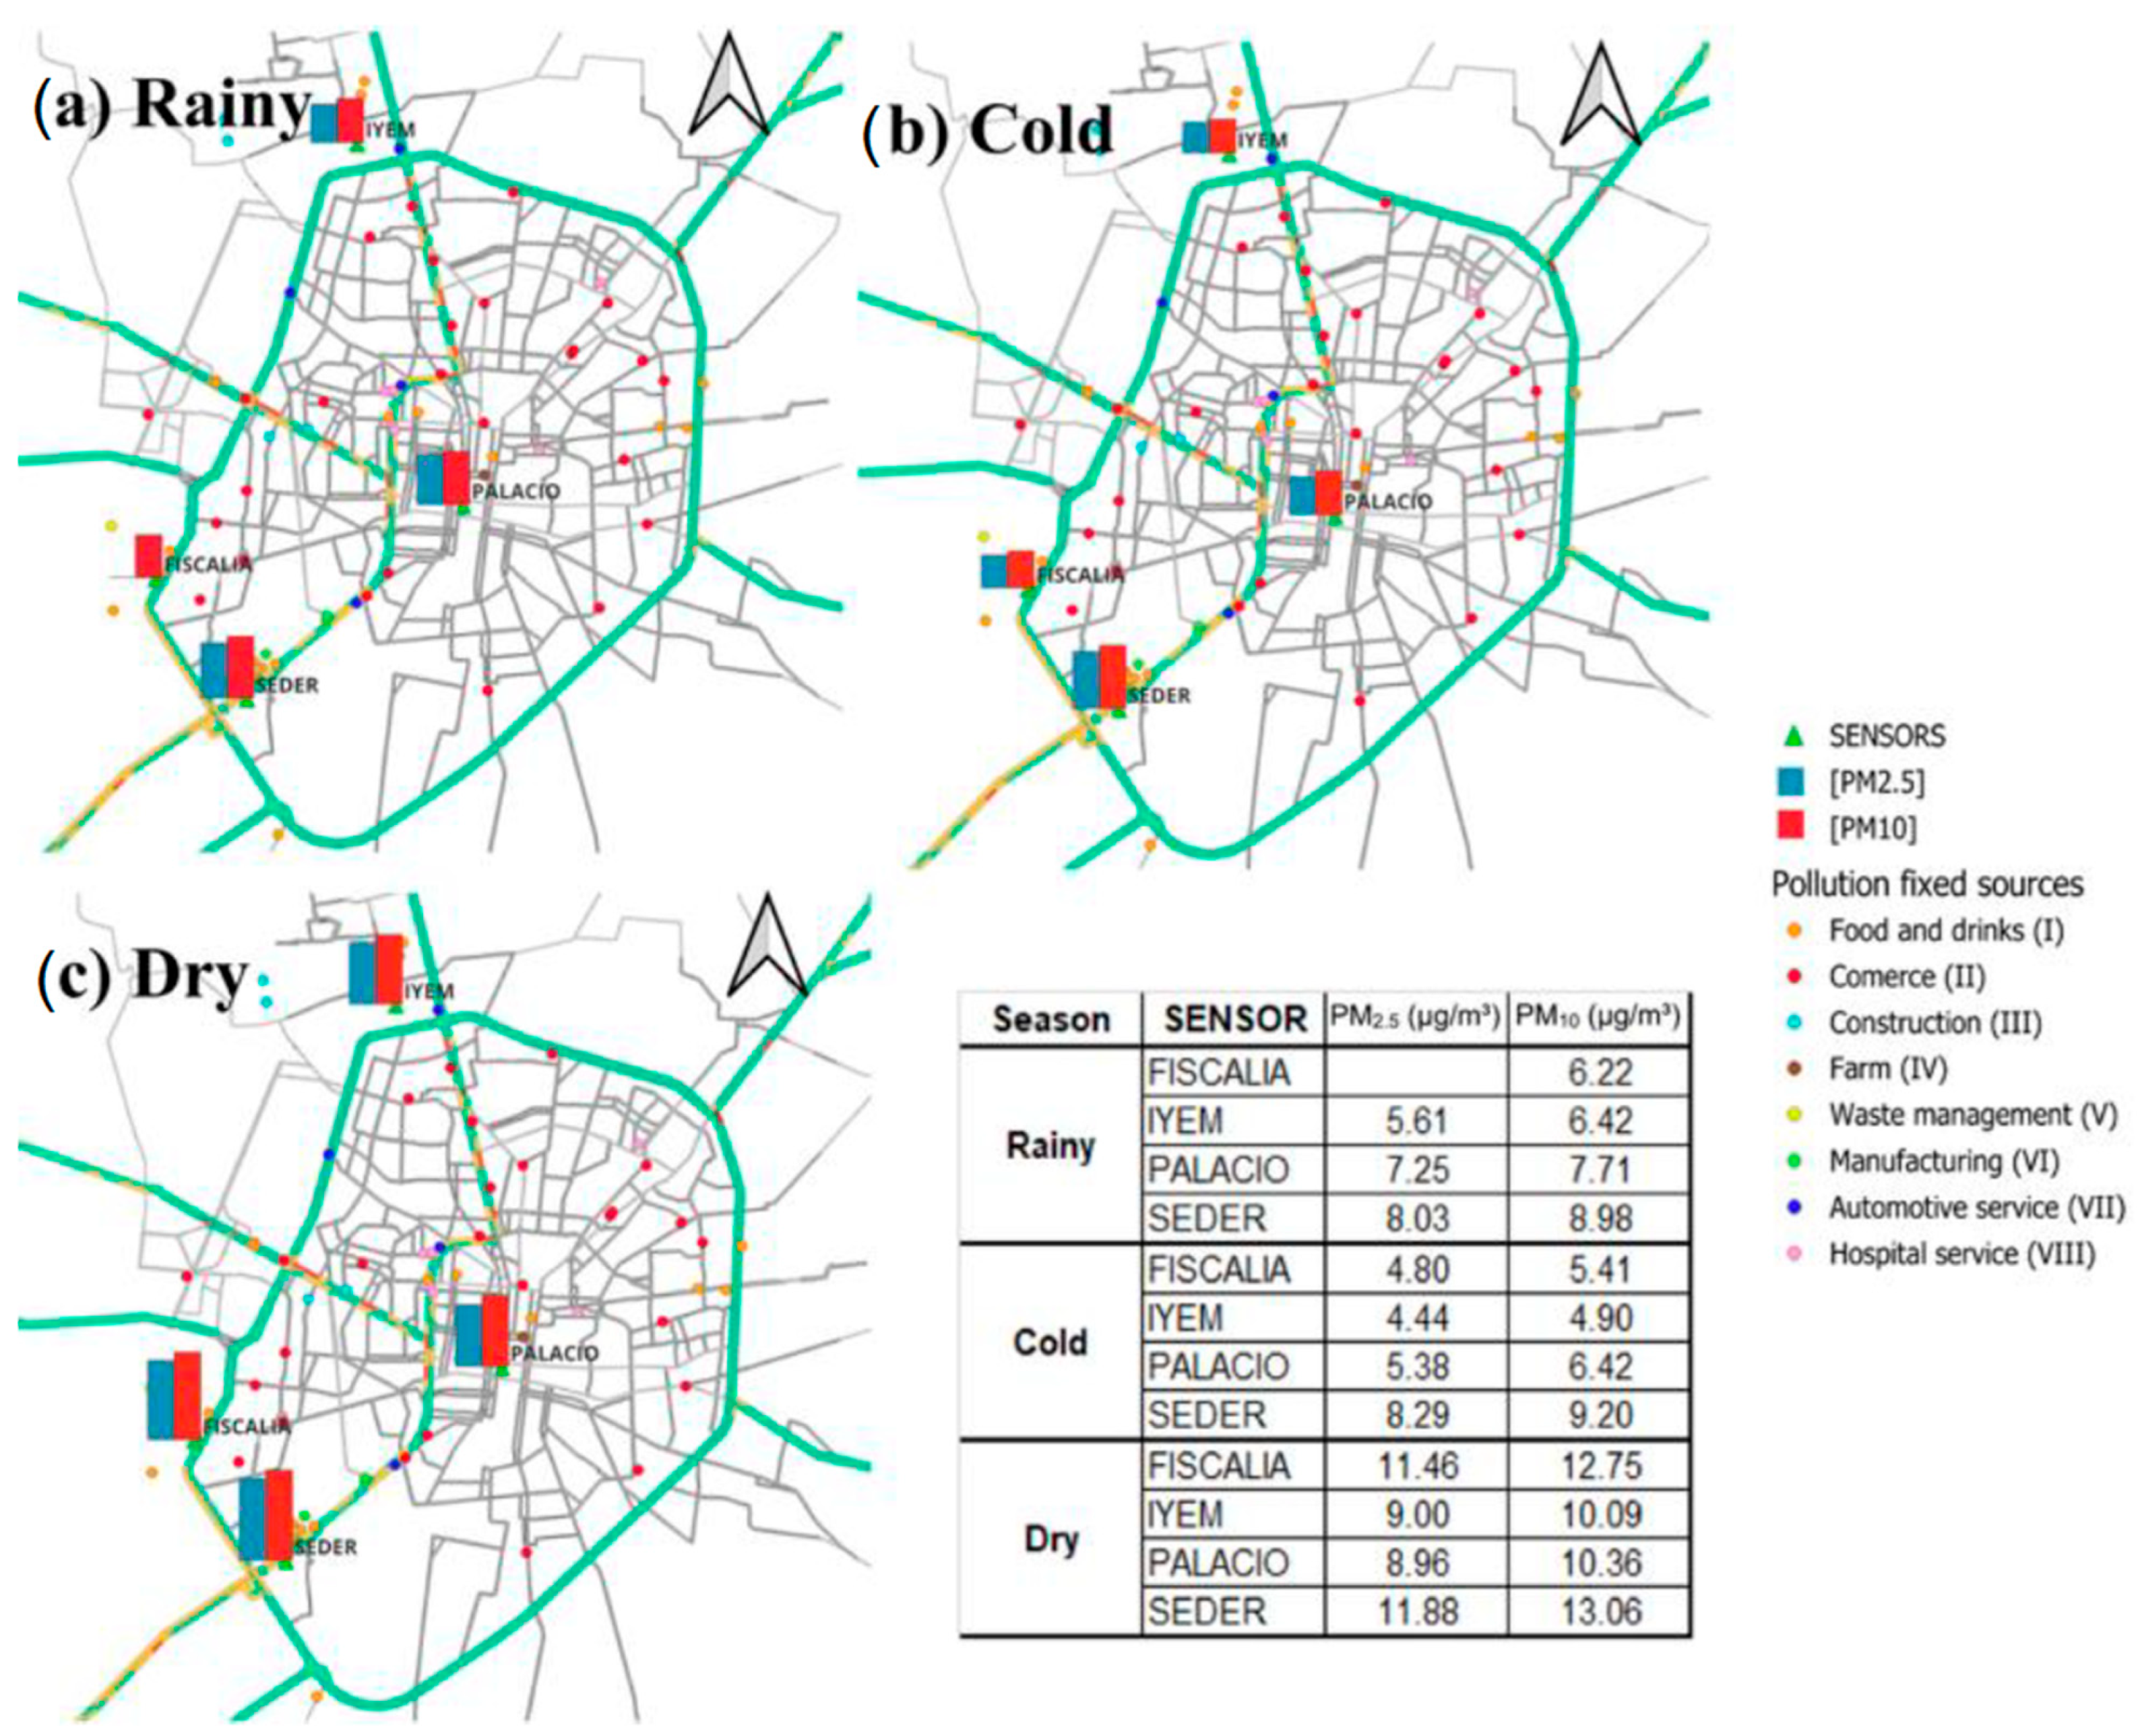
Finally, using data from Google Traffic and the geographic information system QGIS, the relationship between the average daily concentrations of PM2.5 and PM10 from fixed and mobile sources in the sensor area by season was spatially analyzed. Figure 10 illustrates the average 24 h concentration (as specified in NOM-025-SSA1-2021) by season, according to the sensor location. Also, Figure 10 shows that for the “IYEM” and “PALACIO” sensors, the main contribution was for the mobile sources (traffic), since all the industries are located on the southwest side of the city.

3.3. PM2.5/PM10 Ratio

Figure 11 shows the PM2.5/PM10 ratio for the four sample sites. A higher PM2.5/PM10 ratio is related to anthropogenic activities because of fine PM arising from industrial combustion and traffic emissions, whereas lower PM2.5/PM10 ratios are related to natural systems [55,56,57,58,59]. The kurtosis (κ) was calculated as a related variable. Kurtosis is a characteristic number that represents the peak value of the probability distribution function (PDF) at the average value. κ > 0 represents a peak distribution, and κ < 0 indicates a flat distribution. According to [44], when kurtosis ≥ 0, the dust type aerosol is classified as the typical dust type; otherwise, it is the atypical dust type.

4. Discussion

4.1. Temporal Analysis

Figure 12a shows that the highest concentration of PM2.5 occurred during the months from June to September. The highest values for the period were reported during 2019 and 2020, possibly due to the presence of Saharan dust, as noted during the same period in the Yucatán Peninsula [21,22]. The local environmental ministry in Yucatán reported that from 23 to 25 June 2020, the PM2.5 concentration levels ranged from 126 to 142 μg m−3, which were directly related to the presence of Saharan dust [60].
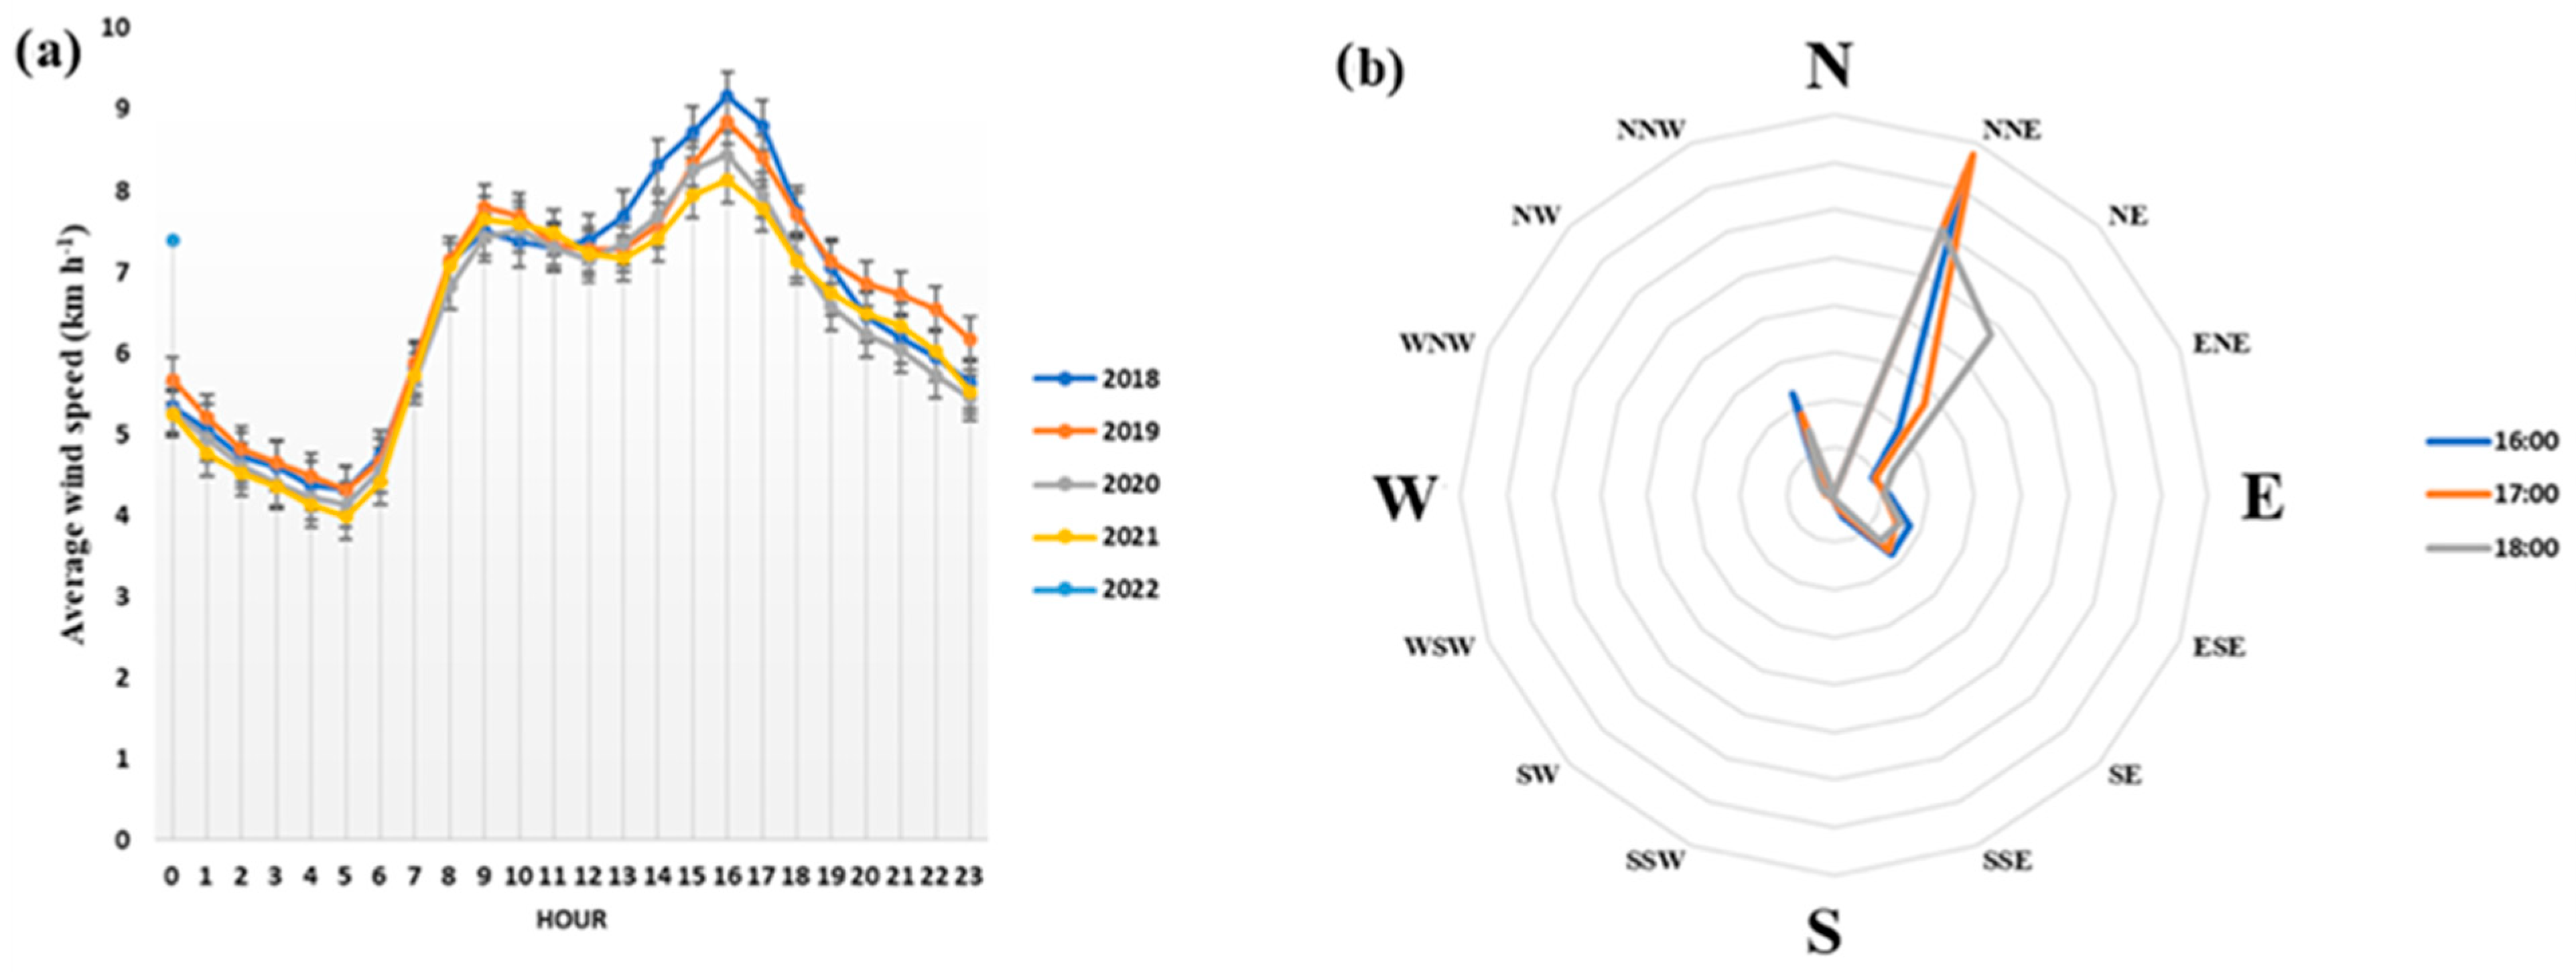
The wind direction and wind speed recorded by the station during the daytime hours were analyzed, and it was detected that the highest wind speed was registered from 16:00 to 18:00 (Figure 12a) throughout the study period. The predominant wind direction during these hours was northeast (Figure 12b). Therefore, the higher concentrations of PM at this time window could be attributed to the drag of particulate matter from the northeast direction of the station. The generation of pollution can occur directly through emissions into the air or through the resuspension of particles by wind action [61]. Although there is no information available in Mérida regarding an estimate of the PBLH, the diurnal behavior of PM2.5 concentrations in Mérida replicates the same behavior also reported by Pan et al. [30], who reported a strong interaction between the evolution of PM2.5 and the PBL (i.e., a higher PM2.5 favors the reduction of solar radiation, which subsequently depresses the PBL).
Figure 4 shows that particulate matter decreased for all seasons in 2021, which coincides with the COVID-19 pandemic. This behavior was observed in various countries throughout the pandemic [62,63,64]. This indicates that although there were decreases in the concentration of particulate matter, these decreases can mainly be attributed to the absence of mobile sources during the isolation period [62,63,64,65,66]. A steep drop in the average PM2.5 concentration during the rainy season from 2019 to 2020 was reported (Figure 4). This drop may be caused by an extraordinary rain event registered in June 2020, designated as Tropical Storm Cristobal, during which a daily accumulated precipitation maximum of 320 mm was reached, and the phenomenon lasted 8 days non-stop [67]. Furthermore, 2020 reported an annual precipitation of 1802.2 mm in Yucatan [47], surpassing the normal yearly average by 48%. These rainy conditions favored a wet deposition effect on the PM2.5 present in the ambient air, thereby reducing its concentration [49,54].
Figure 9 shows that most data were clustered by season. Additionally, it has been reported that during the change of seasons, the concentrations of particulate matter vary significantly at the beginning and then change more slowly [49]. This behavior is consistent with the trend observed in Figure 5, where a significantly different pattern was seen between March and May (dry) and June and October (rainy), with rapid variations at the beginning of each season. The results indicate that wind speed and air humidity play an essential role in the dispersion of polluted air. An inverse relationship between the concentration of particulate matter and relative humidity highlights the significant impact of these parameters, directly related to the rainy season, on the average concentration of PM2.5 and PM10. The results show that the average concentrations of PM2.5 and PM10 decrease when humidity increases. In general, the findings suggest that air quality can be improved during the rainy season because suspended particles are removed and deposited on the ground by sweeping action [25,27].

4.2. Spatial Analysis

The results also indicate the impact of wind speed on the concentration of particulate matter. Studies have shown that both the magnitude of the speed and the direction vector can reduce or increase the concentrations of PM2.5 and PM10 [27]. This, along with the homogeneous groups found in the multiple range test, suggests that the two sensors (IYEM-PALACIO, SEDER-FISCALIA) were affected by the wind differently due to their geographical positions.
In Figure 9, particulate matter concentrations were higher during the dry season than in the other two seasons. It was also observed that the concentration reported by the SEDER sensor remained high throughout all seasons. Additionally, the highest contribution of PM2.5 in the PALACIO and IYEM sensors could be associated with mobile sources, which was linked to the increase in PM2.5 concentration [68,69]. The locations of these sensors coincided with the areas where the highest traffic in the city has been reported [70].
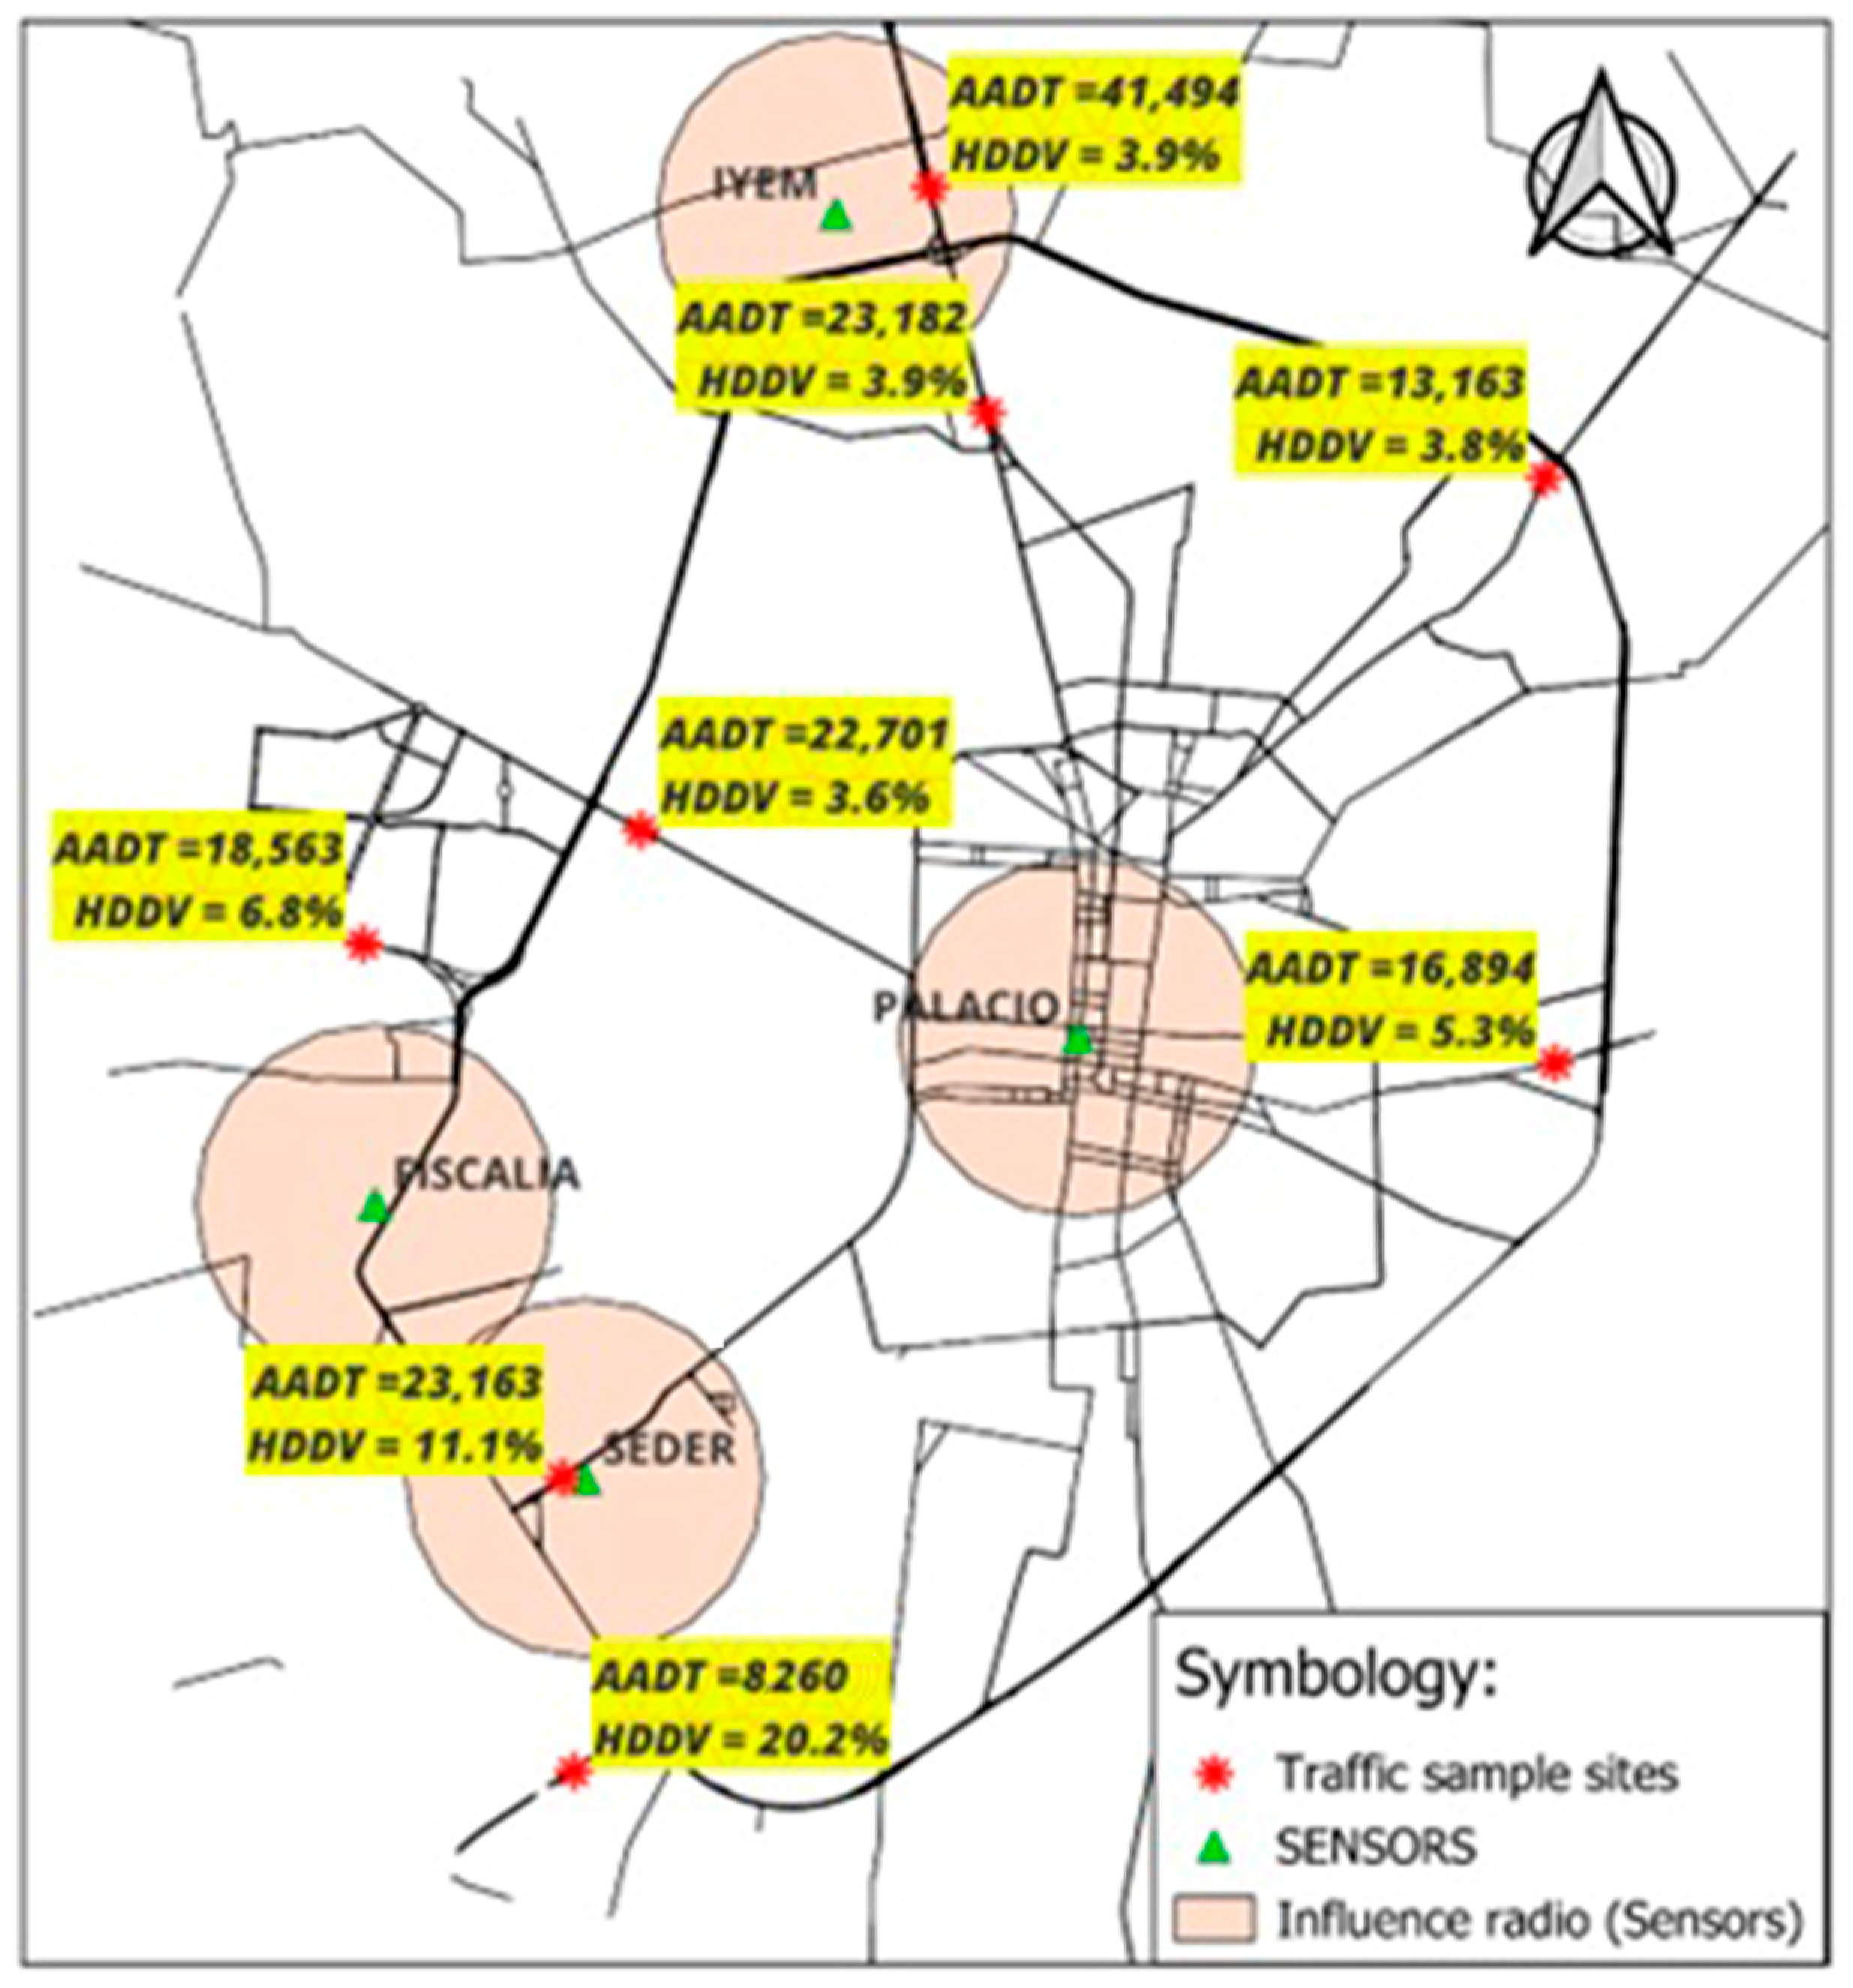
The Communications and Transport Secretary monitored the annual average daily traffic (AADT) and heavy-duty diesel vehicles (HDDV) on some of the federal highways entering the city of Mérida. Figure 12 presents the available data on the distribution of AADT in Mérida.
According to the spatial distribution of AADT in Figure 13, the spatial distribution of fixed pollution sources in Figure 1, and the spatial distribution of PM10 and PM2.5 calculated concentration in Figure 9, it is most likely that the principal contribution of PM in the northern zone of the city is due to mobile sources, as this area had the greatest amount of AADT by far in the whole city. It has been reported that an increase in AADT increases the concentration of PM2.5 [12]. Conversely, the primary attribution of PM concentration in the south-southwest zone of the city is likely due to fixed sources, which were predominantly distributed in that zone (Figure 1). Additionally, in these zones, the percentage of HDDV was greater than in other sampling sites of the city. A strong correlation exists between the rate of HDDV and PM2.5 concentration, with the PM2.5 levels increasing as the HDDV density increases [12].
Some studies in the Yucatán Peninsula have reported the relationship between air pollution and health issues such as allergic diseases with the population growth in the area [71,72]. Despite this, no measures have been taken, even though the air quality data belong to the local government.
Finally, Figure 11 shows that the four sample sites in the city had similar distributions of PM2.5/PM10 ratios for the entire sample period. According to Fan et al. [44], a unimodal distribution with a peak higher than 0.6 and a kurtosis (κ) ≥ 0 can be attributed to a typical anthropogenic source of pollution. Therefore, the particle concentrations monitored at the four sampling sites can be attributed to anthropogenic sources of pollution for the entire study period [55,56,57,58,59]. It can then be assumed that the PM levels present in Mérida, Yucatán, are mainly due to anthropogenic activities. In contrast, other authors have reported that different sampling sites have different PM attributions such as natural atypical dust or typical mixed [44]. This may be due to the larger study area covered by the authors, while the sampling sites in this paper were less than 55 km2.
The strength of this study is supported by the large amount of data available from the “SDS01” monitoring station. This wealth of data allowed statistical analyses with representative precision, making it possible to establish the relationship between PM concentrations and meteorological variables. However, the fact that data were missing for some months from the monitoring station means that detailed PM trend data over time are unavailable.
Additionally, this research was subject to limitations regarding the spatial extent of its data collection. The deployment of monitoring equipment was inherently linked to obtaining authorization from the corresponding authorities, which restricted the number and placement of the sensors. Consequently, despite the availability of data over a significant period, the findings may not fully capture the heterogeneity of air pollution across all of Mérida’s diverse zones. Future studies would benefit from expanded access to a broader array of locations to validate and enhance the representativeness of the results. Therefore, the use of sensors is an appropriate way to complement air quality monitoring.

5. Conclusions

This study provides a comprehensive evaluation of particulate matter in the tropical urban environment of Mérida, Yucatán, revealing critical insights into its air quality challenges. The analysis conclusively demonstrates that spatial and temporal factors, including seasonal variations, the presence of fixed pollution sources, and vehicular flow, exert a significant (p < 0.05) influence on PM concentrations. Atmospherically, it was quantified that tropical conditions, such as elevated temperature and solar radiation, contribute to increased PM levels, whereas high humidity and precipitation act as efficient removal mechanisms, leading to improved air quality during the rainy season.
Spatially, the southwestern zone of the city, characterized by a high density of industrial fixed sources and significant traffic of heavy-duty diesel vehicles, consistently registered the highest PM concentrations (8.11 μg m−3 for PM2.5 and 13.06 μg m−3 for PM10 on dry season). This situation was exacerbated during the dry season. The PM2.5/PM10 ratio across all monitored sites exhibited a consistent, peaked distribution indicative of typical anthropogenic sources, underscoring that human activities are the dominant and pervasive contributor to the city’s particulate pollution. This finding challenges the perception of tropical cities as pollution-free environments.
Critically, the increasing trend in PM concentrations over the study period is a direct reflection of the city’s rapid growth, which manifests as heightened industrial activity and vehicular flow. The successful deployment of a low-cost sensor network proved vital, as it uncovered significant intra-urban pollution disparities that a single official monitoring station could not detect, thereby validating this approach for enhancing air quality surveillance.

Author Contributions

All authors conceived the research. Conceptualization, S.A.-E.; Data curation, A.M.-R.; Investigation, C.A.Q.-F., A.M.-R., and V.R.G.-E.; Methodology, C.A.Q.-F. and V.R.G.-E.; Project administration, C.A.Q.-F. and S.A.-E.; Resources, S.A.-E.; Supervision, C.A.Q.-F. and V.R.G.-E.; Validation, A.M.-R.; Writing—original draft, A.M.-R. and V.R.G.-E.; Writing—review and editing, C.P.-C. All authors have read and agreed to the published version of the manuscript.

Funding

This research received no external funding.

Data Availability Statement

The data presented in this study are available on request from the corresponding author, as some data belong to the local government.

Acknowledgments

This research was partially supported by the National Council of Sciences, Humanities and Technologies (CONAHCYT in Spanish), which provided a Master’s scholarship to co-author M.I. Agur Mendicuti-Ramos.

Conflicts of Interest

The authors declare no conflicts of interest.

Abbreviations

The following abbreviations are used in this manuscript:
PMParticulate matter
SDSSecretary of Sustainable Development (SDS in Spanish)
SEDERSecretary of Rural Development (SEDER in Spanish)
IYEMYucatecan Institute of Entrepreneurs (IYEM in Spanish)
OPCOptical particle counters
AQIAir quality index
MSDMean square displacement
PCAPrincipal component analysis
AADTAnnual average daily traffic
HDDVHeavy-duty diesel vehicles

References

  1. Diario Oficial de la Federación. NOM-025-SSA1-2021: Salud Ambiental. Criterio para Evaluar la Calidad del Aire Ambiente, Con Respecto a las Partículas Suspendidas PM10 y PM2.5. Valores Normados para la Concentración de Partículas Suspendidas PM10 y PM2.5 en el Aire Ambiente, Como Medida de Protección a la Salud de la Población. DOF, 27 October 2021. Available online: https://www.dof.gob.mx/nota_detalle.php?codigo=5633855&fecha=27/10/2021#gsc.tab=0 (accessed on 15 November 2024).
  2. US EPA. Final Rule to Strengthen the National Air Quality Health Standard for Particulate Matter Standards. U.S. Environmental Protection Agency, 7 February 2024. Available online: https://www.epa.gov/system/files/documents/2024-02/pm-naaqs-overview.pdf (accessed on 10 October 2025).
  3. World Health Organization. WHO Global Air Quality Guidelines: Particulate Matter (PM2.5 and PM10), Ozone, Nitrogen Dioxide, Sulfur Dioxide and Carbon Monoxide. World Health Organization 2021. Available online: https://www.who.int/publications/i/item/9789240034228 (accessed on 10 October 2025).
  4. Kumar, V.; Sahu, M.; Biswal, B.; Prakash, J.; Choudhary, S.; Raliya, R.; Chadha, T.S.; Fang, J.; Biswas, P. Real-Time Source Apportionment of Particulate Matter from Low-Cost Particle Sensors Using Machine Learning. Aerosol Sci. Eng. 2024. [Google Scholar] [CrossRef]
  5. Bonilla-Granados, C.A.; Sánchez-Delgado, A.Y.; Rubio-Gómez, Y.M.; Cortez-Huerta, M. Niveles de concentración por PM2.5 mediante sensores de bajo costo. Caso de estudio: Pamplona, Colombia. Rev. UIS Ing. 2023, 22, 29–38. [Google Scholar] [CrossRef]
  6. Kramer, A.L.; Liu, J.; Li, L.; Connolly, R.; Barbato, M.; Zhu, Y. Environmental justice analysis of wildfire-related PM2.5 exposure using low-cost sensors in California. Sci. Total Environ. 2023, 856, 159218. [Google Scholar] [CrossRef]
  7. Song, B.; Park, K.; Kim, T.; Seo, G. Analysis of spatiotemporal PM2.5 concentration patterns in Changwon, Korea, using low-cost PM2.5 sensors. Urban Clim. 2022, 46, 101292. [Google Scholar] [CrossRef]
  8. McDuffie, E.E.; Martin, R.V.; Spadaro, J.V.; Burnett, R.; Smith, S.J.; O’Rourke, P.; Hammer, M.S.; Van Donkelaar, A.; Bindle, L.; Shah, V.; et al. Source sector and fuel contributions to ambient PM2.5 and attributable mortality across multiple spatial scales. Nat. Commun. 2021, 12, 3594. [Google Scholar] [CrossRef]
  9. Karagulian, F.; Belis, C.A.; Dora, C.F.C.; Prüss-Ustün, A.M.; Bonjour, S.; Adair-Rohani, H.; Amann, M. Contributions to cities’ ambient particulate matter (PM): A systematic review of local source contributions at global level. Atmos. Environ. 2015, 120, 475–483. [Google Scholar] [CrossRef]
  10. Li, Q.; Wang, Y.; Chen, W.; Li, M.; Fang, X. Does improvement of industrial land use efficiency reduce PM2.5 pollution? Evidence from a spatiotemporal analysis of China. Ecol. Indic. 2021, 132, 108333. [Google Scholar] [CrossRef]
  11. Gentner, D.R.; Jathar, S.H.; Gordon, T.D.; Bahreini, R.; Day, D.A.; Haddad, I.E.; Hayes, P.L.; Pieber, S.M.; Platt, S.M.; De Gouw, J.; et al. Review of Urban Secondary Organic Aerosol Formation from Gasoline and Diesel Motor Vehicle Emissions. Environ. Sci. Technol. 2017, 51, 1074–1093. [Google Scholar] [CrossRef]
  12. Mukherjee, A.; McCarthy, M.C.; Brown, S.G.; Huang, S.; Landsberg, K.; Eisinger, D.S. Influence of roadway emissions on near-road PM2.5: Monitoring data analysis and implications. Transp. Res. Part D Transp. Environ. 2020, 86, 102442. [Google Scholar] [CrossRef]
  13. Alshetty, D.; Nagendra, S.S. Impact of vehicular movement on road dust resuspension and spatiotemporal distribution of particulate matter during construction activities. Atmos. Pollut. Res. 2022, 13, 101256. [Google Scholar] [CrossRef]
  14. Wang, M.; Duan, Y.; Zhang, Z.; Huo, J.; Huang, Y.; Fu, Q.; Wang, T.; Cao, J.; Lee, S. Increased Contribution to PM2.5 from Traffic-Influenced Road Dust in Shanghai over Recent Years and Predictable Future. Environ. Pollut. 2022, 313, 120119. [Google Scholar] [CrossRef] [PubMed]
  15. Secretary of Economy. Mérida: Economía, Empleo, Equidad, Calidad de Vida, Educación, Salud y Seguridad Pública|Data México. 2024. Available online: https://www.economia.gob.mx/datamexico/es/profile/geo/merida?redirect=true (accessed on 10 January 2025).
  16. INEGI. Parque Vehicular. 2024. Available online: https://www.inegi.org.mx/temas/vehiculos/#tabulados (accessed on 3 October 2024).
  17. Karanasiou, A.; Moreno, N.; Moreno, T.; Viana, M.; De Leeuw, F.; Querol, X. Health Effects from Sahara Dust Episodes in Europe: Literature Review and Research Gaps. Environ. Int. 2012, 47, 107–114. [Google Scholar] [CrossRef]
  18. Varrica, D.; Alaimo, M.G. Influence of Saharan Dust on the Composition of Urban Aerosols in Palermo City (Italy). Atmosphere 2024, 15, 254. [Google Scholar] [CrossRef]
  19. NASA. Godzilla Dust Storm. NASA’s Scientific Visualization Studio, 19 April 2021. Available online: https://svs.gsfc.nasa.gov/4849 (accessed on 5 September 2024).
  20. Remoundaki, E.; Papayannis, A.; Kassomenos, P.; Mantas, E.; Kokkalis, P.; Tsezos, M. Influence of Saharan Dust Transport Events on PM2.5 Concentrations and Composition over Athens. Water Air Soil Pollut. 2012, 224, 1373. [Google Scholar] [CrossRef]
  21. Raga, G.B.; Ladino, L.A.; Baumgardner, D.; Ramírez-Romero, C.; Córdoba, F.; Álvarez-Ospina, H.; Rosas, D.; Amador, T.; Miranda, J.; Rosas, I.; et al. ADABBOY: African Dust and Biomass Burning over Yucatan. Bull. Am. Meteorol. Soc. 2021, 102, 1543–1556. [Google Scholar] [CrossRef]
  22. Yu, H.; Tan, Q.; Zhou, L.; Zhou, Y.; Bian, H.; Chin, M.; Ryder, C.L.; Levy, R.C.; Pradhan, Y.; Shi, Y.; et al. Observation and Modeling of a Historic African Dust Intrusion into the Caribbean Basin and the Southern U.S. in June 2020. Atmos. Chem. Phys. 2021, 21, 12359–12383. [Google Scholar] [CrossRef]
  23. Amil, N.; Latif, M.T.; Khan, M.F.; Mohamad, M. Seasonal Variability of PM2.5 Composition and Sources in the Klang Valley Urban-Industrial Environment. Atmos. Chem. Phys. 2016, 16, 5357–5381. [Google Scholar] [CrossRef]
  24. Requia, W.J.; Jhun, I.; Coull, B.A.; Koutrakis, P. Climate Impact on Ambient PM2.5 Elemental Concentration in the United States: A Trend Analysis over the Last 30 Years. Environ. Int. 2019, 131, 104888. [Google Scholar] [CrossRef]
  25. Wang, R.; Cui, K.; Sheu, H.; Wang, L.; Liu, X. Effects of Precipitation on the Air Quality Index, PM2.5 Levels and on the Dry Deposition of PCDD/Fs in the Ambient Air. Aerosol Air Qual. Res. 2023, 23, 220417. [Google Scholar] [CrossRef]
  26. Song, Z.; Wang, M.; Yang, H. Quantification of the Impact of Fine Particulate Matter on Solar Energy Resources and Energy Performance of Different Photovoltaic Technologies. ACS Environ. Au 2022, 2, 275–286. [Google Scholar] [CrossRef]
  27. Liu, Z.; Shen, L.; Yan, C.; Du, J.; Li, Y.; Zhao, H. Analysis of the Influence of Precipitation and Wind on PM2.5 and PM10 in the Atmosphere. Adv. Meteorol. 2020, 2020, 5039613. [Google Scholar] [CrossRef]
  28. Zhang, X.; Xu, H.; Liang, D. Spatiotemporal Variations and Connections of Single and Multiple Meteorological Factors on PM2.5 Concentrations in Xi’an, China. Atmos. Environ. 2022, 275, 119015. [Google Scholar] [CrossRef]
  29. Instituto de Ciencias de la Atmósfera y Cambio Climático. Episodios de Muy Alta Contaminación con Contingencias Ambientales en la Megalópolis y Lecciones por Aprender. 2024. Available online: https://www.gob.mx/cms/uploads/attachment/file/1009971/39._Episodios_muy_alta_contaminacion_con_contingencias_ambientales_Megalopolis.pdf (accessed on 15 January 2025).
  30. Pan, L.; Xu, J.; Tie, X.; Mao, X.; Gao, W.; Chang, L. Long-Term Measurements of Planetary Boundary Layer Height and Interactions with PM2.5 in Shanghai, China. Atmos. Pollut. Res. 2019, 10, 989–996. [Google Scholar] [CrossRef]
  31. Orellana, R.; Espadas Manrique, C.; Nava, F. Climas. In Biodiversidad y Desarrollo Humano en Yucatán; Duran, R., Méndez, M., Eds.; CICY: Mérida, Mexico, 2010; pp. 10–11. [Google Scholar]
  32. Thermo Fisher Scientific Inc. Thermo Scientific Model 42i NO-NO2-NOx Chemiluminescent Gas Analyzer. 2024. Available online: https://documents.thermofisher.com/TFS-Assets/LSG/Specification-Sheets/EPM-42i-Datasheet.pdf (accessed on 10 December 2024).
  33. Thermo Fisher Scientific Inc. Thermo Scientific Model 43i Sulfur Dioxide Analyzer. 2024. Available online: https://documents.thermofisher.com/TFS-Assets/LSG/Specification-Sheets/EPM-43i-Datasheet.pdf (accessed on 10 December 2024).
  34. Thermo Fisher Scientific Inc. Thermo Scientific Model 48i Carbon Monoxide Analyzer. 2024. Available online: https://documents.thermofisher.com/TFS-Assets/LSG/Specification-Sheets/EPM-48i-Datasheet.pdf (accessed on 10 December 2024).
  35. Thermo Fisher Scientific Inc. Thermo Scientific Model 49i UV Photometric Ozone Analyzer. 2024. Available online: https://documents.thermofisher.com/TFS-Assets/CAD/Specification-Sheets/EPM-49i-Datasheet.pdf (accessed on 10 December 2024).
  36. Thermo Fisher Scientific Inc. Model 5014i Beta Continuous Particulate Monitor. 2025. Available online: https://documents.thermofisher.com/TFS-Assets/CAD/Specification-Sheets/D00882.pdf (accessed on 12 January 2025).
  37. U.S. EPA. Technical Assistance Document (TAD) for the Reporting of Daily Air Quality—The Air Quality Index (AQI); U.S. Environmental Protection Agency, Office of Air Quality Planning and Standards: Durham, NC, USA, 2018; EPA 454/B-18-007.
  38. PurpleAir. How Is Particulate Matter (PM) Measured? 2024. Available online: https://www2.purpleair.com/blogs/blog-home/how-is-pm-measured?#Which (accessed on 15 January 2025).
  39. California Air Resources Board. Outline of Measurement Technologies. Available online: https://ww2.arb.ca.gov/capp-resource-center/community-air-monitoring/outline-of-measurement-technologies#part:~:text=time%20sensitive%20applications.-,Particle%20Counting,-Particles%20in%20air (accessed on 15 January 2025).
  40. PurpleAir Community Q: Can I Calibrate My PurpleAir sensor? Available online: https://community.purpleair.com/t/q-can-i-calibrate-my-purpleair-sensor/844/1 (accessed on 22 June 2022).
  41. National Institute of Ecology. Handbook 5: Air Quality Data Management Protocol. 2010. Available online: https://sinaica.inecc.gob.mx/archivo/guias/5%20-%20Protocolo%20de%20Manejo%20de%20Datos%20de%20la%20Calidad%20del%20Aire.pdf (accessed on 15 September 2024).
  42. Tian, P.; Zhang, L.; Ma, J.; Tang, K.; Xu, L.; Wang, Y.; Cao, X.; Liang, J.; Ji, Y.; Jiang, J.H.; et al. Radiative Absorption Enhancement of Dust Mixed with Anthropogenic Pollution over East Asia. Atmos. Chem. Phys. 2018, 18, 7815–7825. [Google Scholar] [CrossRef]
  43. Drăgoi, L.; Cazacu, M.-M.; Breabăn, I.-G. Analysis of the PM2.5/PM10 Ratio in Three Urban Areas of Northeastern Romania. Atmosphere 2025, 16, 720. [Google Scholar] [CrossRef]
  44. Fan, H.; Zhao, C.; Yang, Y.; Yang, X. Spatio-Temporal Variations of the PM2.5/PM10 Ratios and Its Application to Air Pollution Type Classification in China. Front. Environ. Sci. 2021, 9, 692440. [Google Scholar] [CrossRef]
  45. Xu, G.; Jiao, L.; Zhang, B.; Zhao, S.; Yuan, M.; Gu, Y.; Liu, J.; Tang, X. Spatial and Temporal Variability of the PM2.5/PM10 Ratio in Wuhan, Central China. Aerosol Air Qual. Res. 2017, 17, 741–751. [Google Scholar] [CrossRef]
  46. Choudhary, A.; Kumar, P.; Sahu, S.K.; Pradhan, C.; Joshi, P.K.; Singh, S.K.; Kumar, P.; Mezoue, C.A.; Singh, A.K.; Tyagi, B. Health Risk Appraisal Associated with Air Quality over Coal-Fired Thermal Power Plants and Coalmine Complex Belts of Urban–Rural Agglomeration in the Eastern Coastal State of Odisha, India. Atmosphere 2022, 13, 2064. [Google Scholar] [CrossRef]
  47. CONAGUA. Monthly Rainfall and Temperature Summaries. 2024. Available online: https://smn.conagua.gob.mx/es/climatologia/temperaturas-y-lluvias/resumenes-mensuales-de-temperaturas-y-lluvias (accessed on 10 January 2025).
  48. Bracho, R.; Flores-Espino, F.; Morgenstein, J.; Aznar, A.; Castillo, R.; Settle, E. Evaluación Energética de la Península de Yucatán: Vías para un Sistema Energético Limpio y Sustentable; Laboratorio Nacional de Energía Renovable: Golden, CO, USA, 2021; NREL/TP-7A40-81142. Available online: https://www.nrel.gov/docs/fy21osti/81142.pdf (accessed on 10 January 2025).
  49. Diksha, N.; Kumari, M.; Mishra, V.N.; Kumar, D.; Kumar, P.; Abdo, H.G. Unveiling Pollutants in Sonipat District, Haryana: Exploring Seasonal, Spatial and Meteorological Patterns. Phys. Chem. Earth 2024, 135, 103678. [Google Scholar] [CrossRef]
  50. Wang, L.; Qin, K.; Zhao, B. Spatiotemporal Variations in the Association between PM2.5 and Ozone in the Yangtze River Economic Belt: Impacts of Meteorological and Emissions Factors. Atmos. Environ. 2024, 329, 120534. [Google Scholar] [CrossRef]
  51. Kumar, P.; Pratap, V.; Kumar, A.; Choudhary, A.; Prasad, R.; Shukla, A.; Singh, R.; Singh, A.K. Assessment of Atmospheric Aerosols over Varanasi: Physical, Optical and Chemical Properties and Meteorological Implications. J. Atmos. Sol.-Terr. Phys. 2020, 209, 105424. [Google Scholar] [CrossRef]
  52. Wang, J.; Ogawa, S. Effects of Meteorological Conditions on PM2.5 Concentrations in Nagasaki, Japan. Int. J. Environ. Res. Public Health 2015, 12, 9089–9101. [Google Scholar] [CrossRef] [PubMed]
  53. Gupta, A.K.; Nag, S.; Mukhopadhyay, U.K. Characterisation of PM10, PM2.5 and Benzene Soluble Organic Fraction of Particulate Matter in an Urban Area of Kolkata, India. Environ. Monit. Assess. 2006, 115, 205–222. [Google Scholar] [CrossRef]
  54. Feng, X.; Wang, S. Influence of Different Weather Events on Concentrations of Particulate Matter with Different Sizes in Lanzhou, China. J. Environ. Sci. 2012, 24, 665–674. [Google Scholar] [CrossRef]
  55. Zhou, X.; Cao, Z.; Ma, Y.; Wang, L.; Wu, R.; Wang, W. Concentrations, Correlations and Chemical Species of PM2.5/PM10 Based on Published Data in China: Potential Implications for the Revised Particulate Standard. Chemosphere 2015, 144, 518–526. [Google Scholar] [CrossRef] [PubMed]
  56. Zha, H.; Wang, R.; Feng, X.; An, C.; Qian, J. Spatial Characteristics of the PM2.5/PM10 Ratio and Its Indicative Significance Regarding Air Pollution in Hebei Province, China. Environ. Monit. Assess. 2021, 193, 92. [Google Scholar] [CrossRef] [PubMed]
  57. Chu, H.; Huang, B.; Lin, C. Modeling the Spatio-Temporal Heterogeneity in the PM10–PM2.5 Relationship. Atmos. Environ. 2014, 102, 176–182. [Google Scholar] [CrossRef]
  58. Bamola, S.; Goswami, G.; Dewan, S.; Goyal, I.; Agarwal, M.; Dhir, A.; Lakhani, A. Characterising Temporal Variability of PM2.5/PM10 Ratio and Its Correlation with Meteorological Variables at a Sub-Urban Site in the Taj City. Urban Clim. 2023, 53, 101763. [Google Scholar] [CrossRef]
  59. Spandana, B.; Rao, S.S.; Upadhya, A.R.; Kulkarni, P.; Sreekanth, V. PM2.5/PM10 Ratio Characteristics over Urban Sites of India. Adv. Space Res. 2021, 67, 3134–3146. [Google Scholar] [CrossRef]
  60. SDS. SDS Monitoring Station Report June 23–25 2020; Yucatán State Government: Mérida, México, 2020.
  61. Cortez-Huerta, M.; Echeverría, R.S.; García, G.F.; Durán, R.A.; Álvarez, P.S.; Magaña, V.; Retama, A. Influence of Particulate Matter on Air Quality Due to “Nortes” Events in the Gulf of Mexico. Atmos. Pollut. Res. 2023, 14, 101889. [Google Scholar] [CrossRef]
  62. Kabiraj, S.; Gavli, N. Impact of SARS-CoV-2 Pandemic Lockdown on Air Quality Using Satellite Imagery with Ground Station Monitoring Data in Most Polluted City Kolkata, India. Aerosol Sci. Eng. 2020, 4, 320–330. [Google Scholar] [CrossRef]
  63. Aladag, E. The Nexus between Air Pollution and the COVID-19 Pandemic in Turkey: Further Insights from Wavelet Coherence Analysis. Aerosol Sci. Eng. 2024, 8, 108–119. [Google Scholar] [CrossRef]
  64. Lara, R.; Megido, L.; Suárez-Peña, B.; Negral, L.; Fernández-Nava, Y.; Rodríguez-Iglesias, J.; Marañón, E.; Castrillón, L. Impact of COVID-19 Restrictions on Hourly Levels of PM10, PM2.5 and Black Carbon at an Industrial Suburban Site in Northern Spain. Atmos. Environ. 2023, 304, 119781. [Google Scholar] [CrossRef] [PubMed]
  65. Jin, Q.; Luo, Y.; Meng, X.; Feng, M.; Huang, C. Short- and Long-Term Impacts of the COVID-19 Epidemic on Urban PM2.5 Variations: Evidence from a Megacity, Chengdu. Atmos. Environ. 2022, 294, 119479. [Google Scholar] [CrossRef] [PubMed]
  66. Al-Hemoud, A.; Al-Khayat, A.; Al-Dashti, H.; Li, J.; Alahmad, B.; Koutrakis, P. PM2.5 and PM10 during COVID-19 Lockdown in Kuwait: Mixed Effect of Dust and Meteorological Covariates. Environ. Chall. 2021, 5, 100215. [Google Scholar] [CrossRef]
  67. CONAGUA. Reseña de la Tormenta Tropical “Cristóbal” del Océano Atlántico (1 al 10 de Junio de 2020). 2020. Available online: https://smn.conagua.gob.mx/tools/DATA/Ciclones%20Tropicales/Ciclones/2020-Cristobal%20.pdf (accessed on 10 January 2025).
  68. Belenio, L.; Colegial, J.; Barrera, M. Correlación entre el Flujo Vehicular, el PM2.5 y Variables Meteorológicas, un Estudio de Caso al Oriente de Bucaramanga (Colombia). BISTUA Rev. Fac. Cienc. Básicas 2020, 18, 15–25. [Google Scholar]
  69. Cheng, Z.; Li, L.; Liu, J. Identifying the Spatial Effects and Driving Factors of Urban PM2.5 Pollution in China. Ecol. Indic. 2017, 82, 61–75. [Google Scholar] [CrossRef]
  70. Domínguez, D. Merida Roads Are Saturated. Yucatan News Paper, 12 February 2024. Available online: https://www.yucatan.com.mx/merida/2024/02/12/vialidades-de-merida-saturadas.html (accessed on 10 January 2025).
  71. Cortes-Telles, A.; Ortiz-Farías, D.L.; Pou-Aguilar, Y.N.; Almeida-de-la-Cruz, L.; Perez-Padilla, J.R. Clinical Impact of Obesity on Respiratory Diseases: A Real-Life Study. Lung India 2021, 38, 321–325. [Google Scholar] [CrossRef] [PubMed]
  72. Mancilla-Hernández, E.; Barnica, R.; González-Solórzano, E.; Peregrina, J.A.; Zecua-Nájera, Y.; Soberanes-Rivas, G.A.; Jiménez-Sandoval, J.O. Prevalencia de Rinitis Alérgica y Factores Asociados en Estudiantes Mexicanos. Un Estudio Multicéntrico. Rev. Alerg. Méx. 2021, 68, 101–111. [Google Scholar] [CrossRef]
Figure 1. Fixed source classification and action radius for the station and sensors.
Earth 06 00133 g001
Figure 2. PM2.5 monthly (a) and hourly (b) trends through 2018 to 2021.
Earth 06 00133 g002
Figure 3. Pearson correlation for PM2.5, relative humidity (RH%), solar radiation (Solar rad.), temperature (T), average wind speed (Avg. wind spd.). p in red = significant correlations. The blue squares represent the data distribution.
Earth 06 00133 g003
Figure 4. Average year PM2.5 concentration clustered by season from 2018 to 2021.
Earth 06 00133 g004
Figure 5. Average monthly concentration of PM10 (a) and PM2.5 (b) for ten months in 2023.
Earth 06 00133 g005
Figure 6. Hourly average calculated concentrations of PM10 (a) and PM2.5 (b) for ten months in 2023.
Earth 06 00133 g006
Figure 7. Pearson correlation for the sensor’s PM2.5 and PM10 and ambient parameters: average humidity (Avrg. humidity), precipitation, solar radiation, average temperature (Avrg. Temp.), and maximum wind speed (Max. wind spd.). p in red = significant correlations. The blue squares represent the data distribution.
Earth 06 00133 g007
Figure 8. Principal components bi-graphic for PM10 and PM2.5 behavior considering interest variables. S.R.: solar radiation; V.M: maximum wind speed; Pres: precipitation; H: relative humidity; T: average daily temperature. Green circles represent the data clustering by similarity according to Euclidean distance.
Earth 06 00133 g008
Figure 9. MSD analysis of sensor locations and the season of the year. LL = rainy, S = dry, N = cold.
Earth 06 00133 g009
Figure 10. Distribution of PM2.5 and PM10 calculated concentration by season: (a) rainy, (b) cold, and (c) dry.
Earth 06 00133 g010
Figure 11. PM2.5/PM10 ratios for the four sample sites. The red dotted lines indicate the PM2.5/PM10 ratios of 0.4 and 0.6, respectively.
Earth 06 00133 g011
Figure 12. (a) Average hourly wind speed from 2018 to 2022 in SDS01 station. (b) Average wind direction between 16:00 and 18:00.
Earth 06 00133 g012
Figure 13. Spatial distribution in 2022 for the annual average daily traffic (AADT) and heavy-duty diesel vehicles (HDDV) for the SCT data.
Earth 06 00133 g013
Table 1. Sensor location.
Sensor IDLocationCoordinates (Decimal Degrees)Land Use
PALACIOGovernment palace20.9676, −89.6232Downtown historic monuments zone
SEDERSecretary of Rural Development20.9276, −89.6799Industrial zone
FISCALIAAttorney General’s Office of the State of Yucatán20.9581, −89.6991Urban development
IYEMYucatecan Institute of Entrepreneurs21.0529, −89.6400Urban development
Table 2. Reference concentrations of PM2.5 from the Mexican regulations.
PollutantConcentration (μg m−3)Monitoring Time
PM2.54124 h
10Annual
Note: Mexican regulation NOM-025-SSA1-2021; criteria for evaluating ambient air quality with respect to PM10 and PM2.5 suspended particles.
Table 3. Compliance of NOM-025-SSA1-2021 through the years.
PollutantConcentration Limit/
Monitoring Time
2018201920202021
PM2.541 μg m−3 (24 h)39609044
10 μg m−3 (Annual)19232118
Note: PM2.5 values in bold are above the regulatory limit.
Table 4. Krustal–Wallis test for the sensors’ PM2.5 and PM10 calculated concentrations.
FactorPM2.5PM10
SeasonH = 54.57
p-value = 1.40 × 10⁻¹²
H = 55.95
p-value = 0
Wind directionH = 63.12
p-value = 3.29 × 10⁻⁸
H = 60.44
p-value = 9.81 × 10⁻⁸
Fixed pollution sources in the radius of influenceH = 55.87
p-value = 4.45 × 10⁻¹²
H = 56.94
p-value = 2.63 × 10⁻¹²
Relative humidityH = 30.44
p-value = 3.42 × 10⁻⁸
H = 31.48
p-value = 2.01 × 10⁻⁸
Sensor locationH = 55.87
p-value = 4.45 × 10⁻¹²
H = 56.94
p-value = 2.63 × 10⁻¹²
TemperatureH = 23.44
p-value = 1.28 × 10⁻⁶
H = 16.90
p-value = 3.92 × 10⁻⁵
PrecipitationH = 16.49
p-value = 4.86 × 10⁻⁵
H = 16.90
p-value = 3.92 × 10⁻⁵
K: Kruskal–Wallis statistic.
Disclaimer/Publisher’s Note: The statements, opinions and data contained in all publications are solely those of the individual author(s) and contributor(s) and not of MDPI and/or the editor(s). MDPI and/or the editor(s) disclaim responsibility for any injury to people or property resulting from any ideas, methods, instructions or products referred to in the content.