Article

Event-Driven Shoreline Dynamics of the Nile, Indus, and Yellow River Deltas: A 50-Year Analysis of Trends and Responses

1
Marine, Earth and Atmospheric Sciences Department, North Carolina State University, Raleigh, NC 27695, USA
2
Center for Geospatial Analytics, NC State University, Raleigh, NC 27695, USA
*
Author to whom correspondence should be addressed.
Earth 2025, 6(4), 120; https://doi.org/10.3390/earth6040120
Submission received: 9 July 2025 / Revised: 25 September 2025 / Accepted: 26 September 2025 / Published: 9 October 2025

Abstract

The Nile, Indus, and Yellow River deltas are historically significant and have experienced extensive shoreline changes over the past 50 years, yet the roles of human interventions and natural events remain unclear. In this study, the Net Shoreline Movement and End Point Rate (EPR) were calculated to quantify the erosion and accretion of the shoreline, respectively. Subsequently, linear trend analysis was employed to identify potential directional shifts in shoreline behavior. These measures are combined with segment-scale cumulative area and the EPR trend to reveal where erosion or accretion intensifies, weakens, or reverses through time. Results show distinct, system-specific trajectories, the Nile lost ~27 km2 from 1972 to1997 as a result of the dam construction and sediment reduction, and lost only ~3 km2 more from 1997 to 2022, with local stabilization. The Indus switched from intermittent gains before 1990s to sustained loss after that, totaling ~300 km2 of cumulative land loss mainly due to upstream dam constructions and storm events. The Yellow River gained ~500 km2 from 1973 to 1996 then lost ~200 km2 after main-channel relocation and reduced sediment supply despite active-mouth management. These outcomes indicate that deltas are very vulnerable to system wide human activities and natural events. Combined, satellite-derived metrics can help prioritize locations, guide feasible interventions, establish annual monitoring and trigger action. A major caveat of this study is that yearly shoreline rates and 5–10-yearaverages can mask short-lived or very local shifts. Targeted field surveys and finer-scale modeling (hydrodynamics, subsidence monitoring, bathymetry) are therefore needed to refine the design and inform better policy choices.

1. Introduction

Coastal and deltaic regions are crucial for biodiversity, agriculture, and human settlements. These regions are shaped by dynamic natural processes such as waves, tides, and sediment deposition, making them vulnerable to changes from both natural forces and human activities [1,2]. Understanding the dynamics of deltaic regions is essential for sustainable management, particularly with increasing human pressures and climate change. Historical data provide insights into the evolution of these regions, which is essential for predicting future changes and developing strategies to mitigate adverse impacts [3,4]. Nearly half (47.9%) of coastal areas globally are under significant human impact, while only 15.5% of coastal regions, particularly those in high latitudes, remain relatively undisturbed or intact [5]. In comparison, deltas, which are typically more densely populated and heavily utilized for agriculture and industry, tend to experience even greater levels of degradation. In most countries, more than half of their coastal regions, including deltas, show clear signs of environmental stress and degradation. Deltas in particular, are some of the world’s most densely populated locations covering about 0.57% of the Earth’s total land, however they are home for about 4.5% of the global population in 2017 with a total area of about 847,936 km2, and occupied area of about 710,187 km2 which is around 84% as habitable land [6].

1.1. Study Area

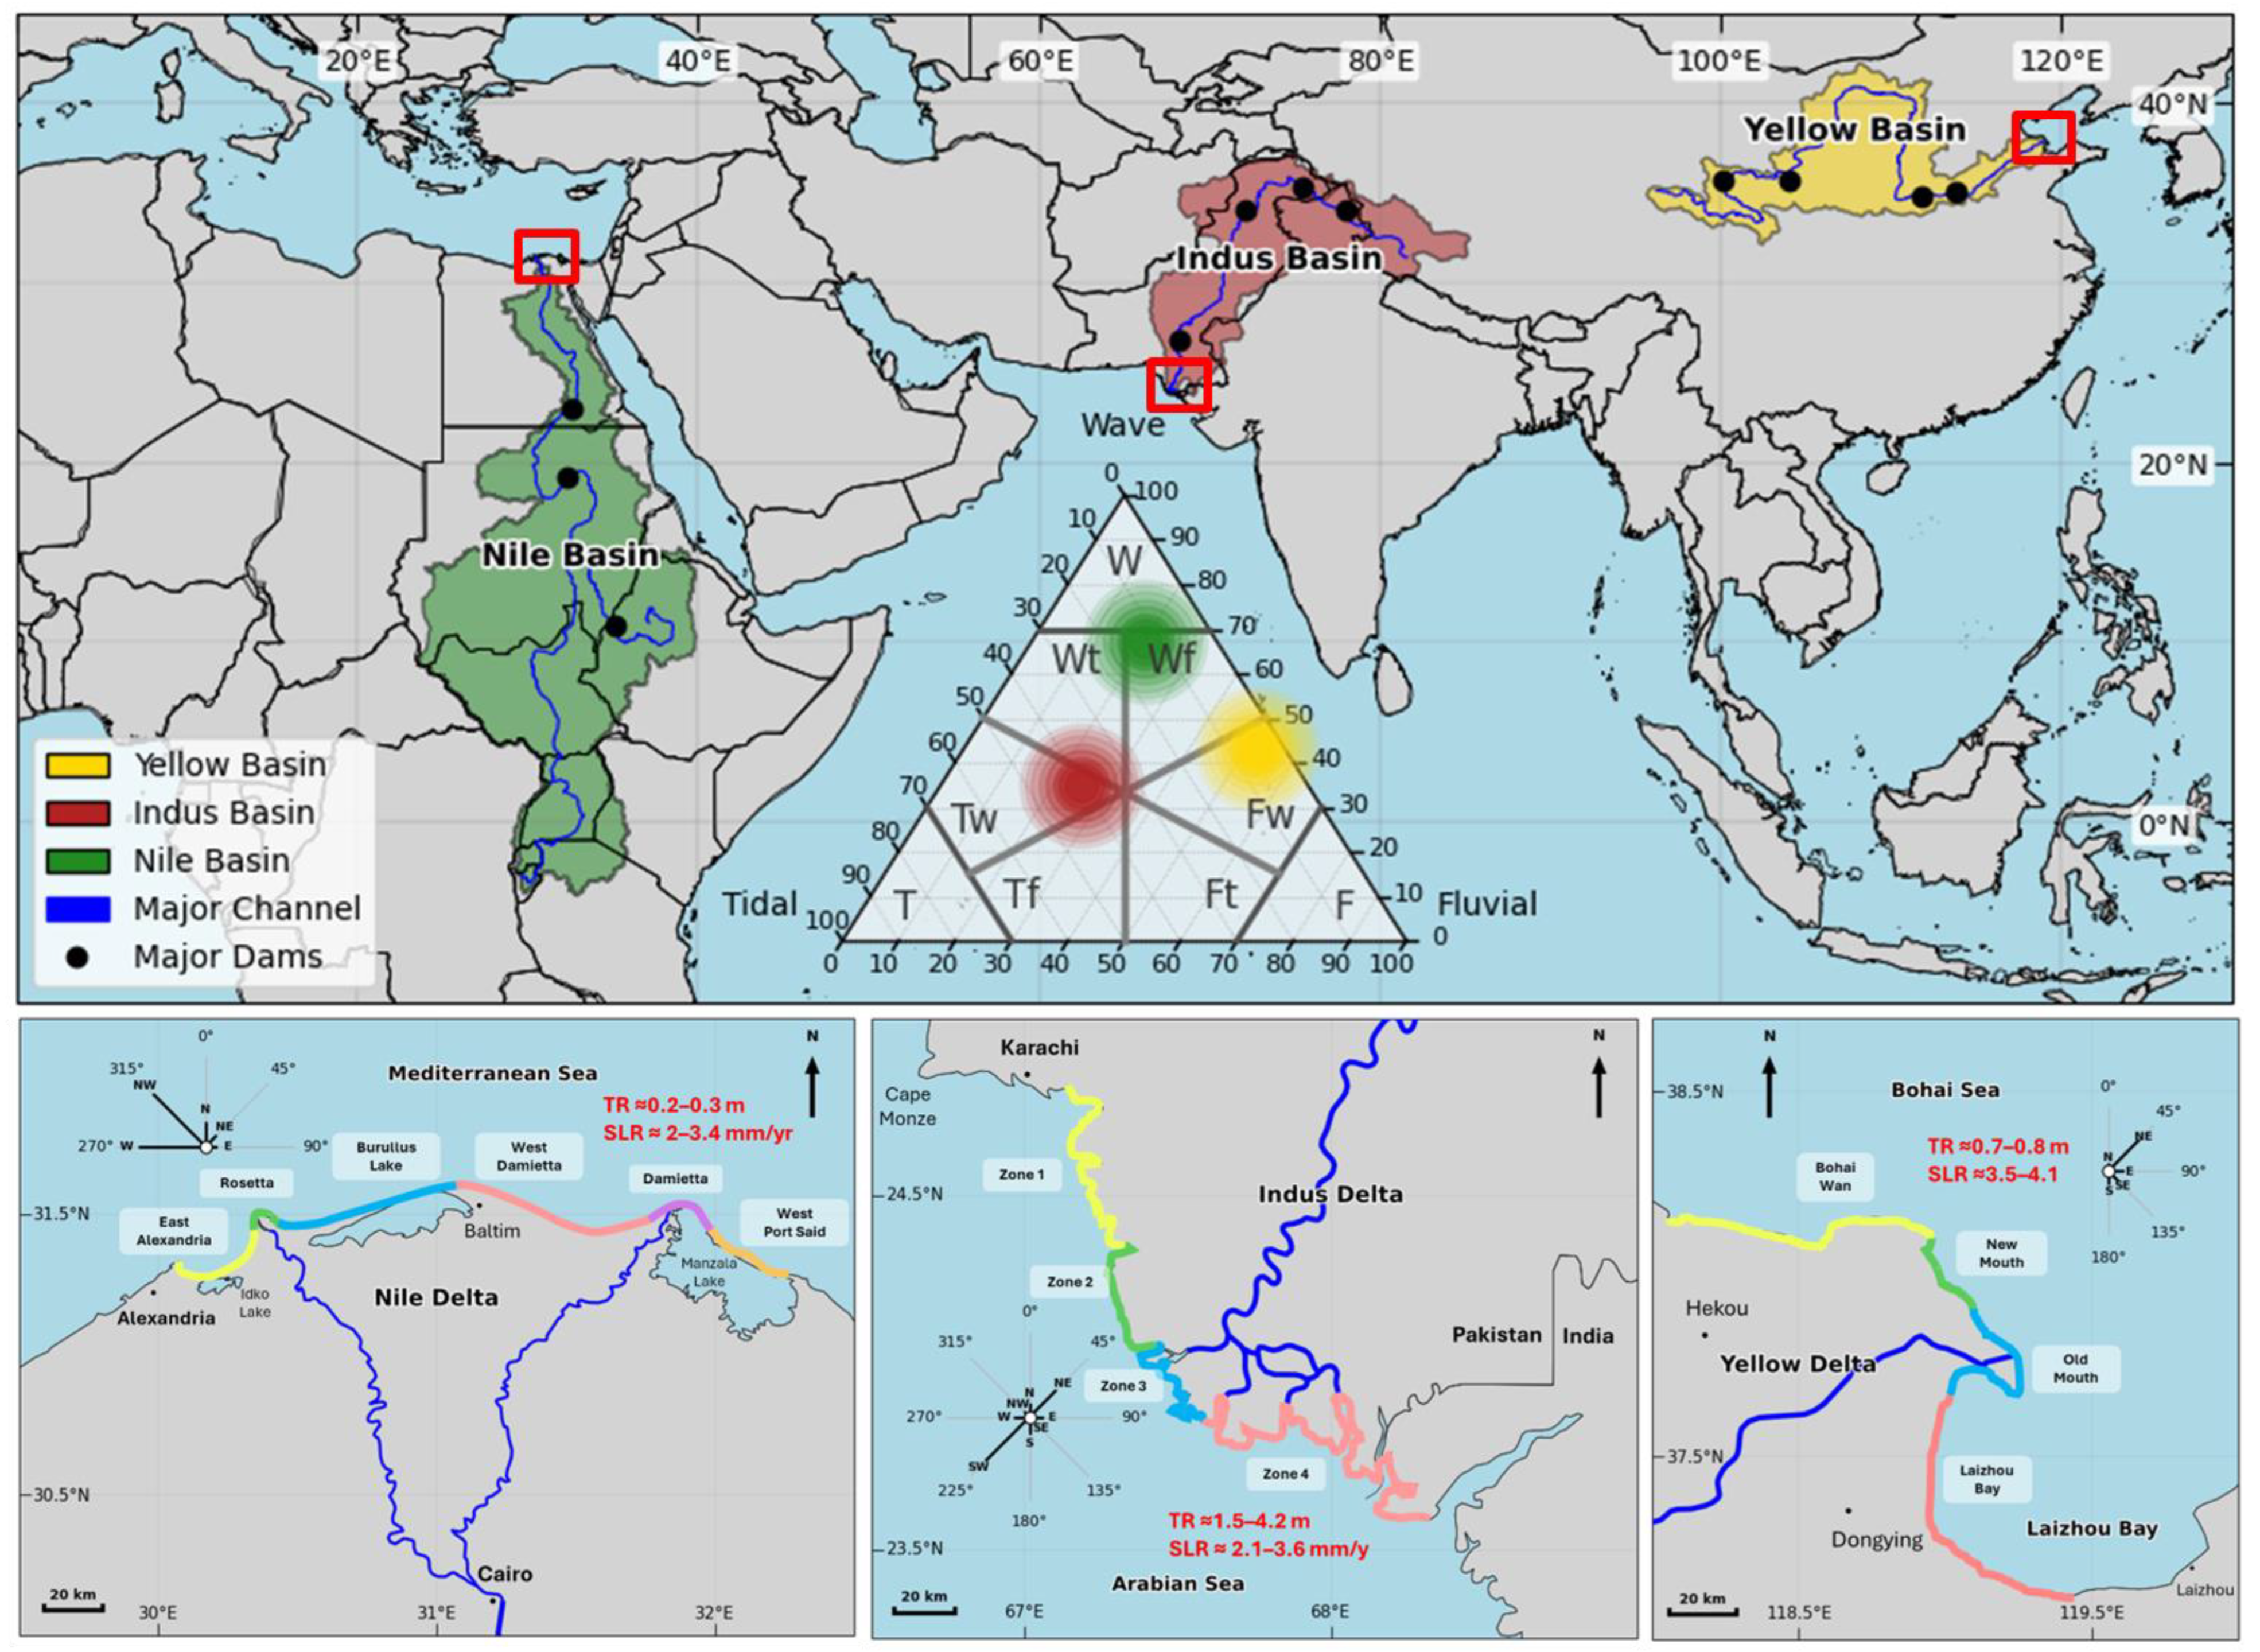
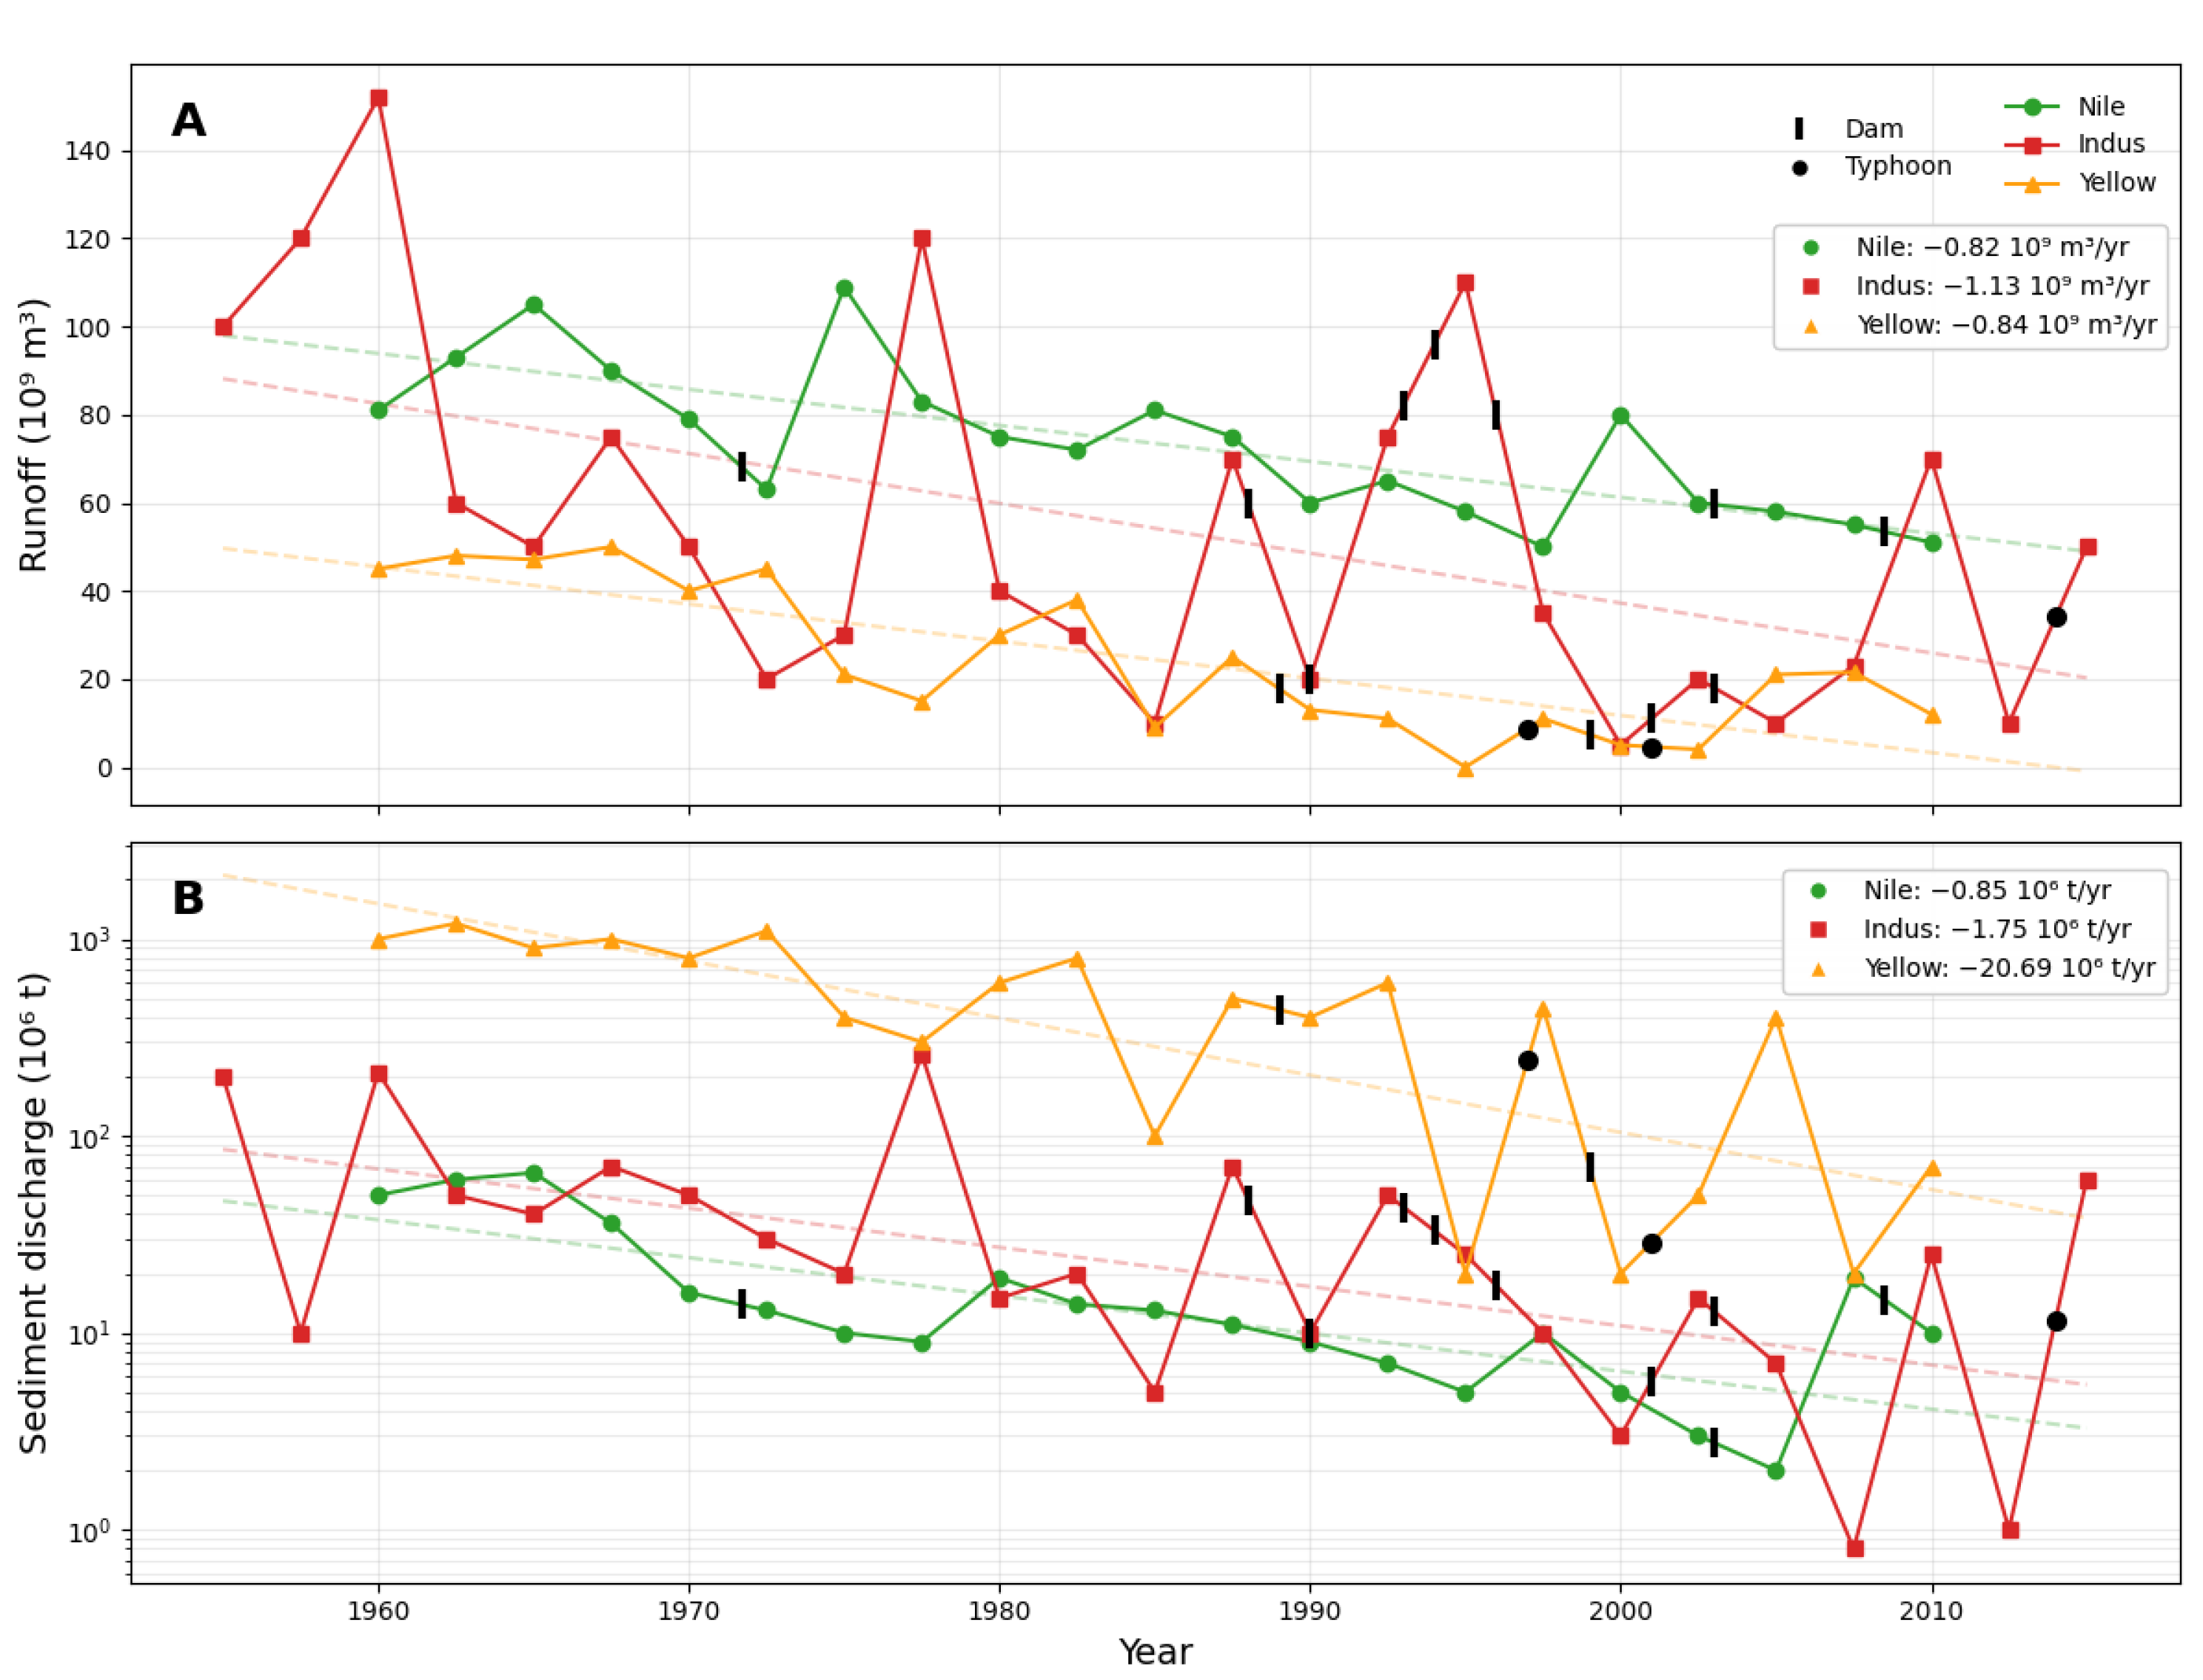
This study focuses on the Nile, Indus, and Yellow River deltas (Figure 1). Despite their geographic differences, all three show long-term reductions in river runoff and sediment delivery (Figure 2), and they are also exposed to regional sea-level rise and high population pressure as documented in prior studies [7,8,9,10,11,12,13,14]. The Nile Delta is located between approximately 30.0° and 31.5° N latitude and 29.5° to 32.5° E longitude, along Egypt’s Mediterranean coast. The Indus Delta lies along the northern Arabian Sea, from about 23.5° to 25.0° N and 67.0° to 69.5° E, and contains one of the largest tidal networks in the region. The Yellow River Delta spans roughly 37.5° to 38.5° N and 118.0° to 119.5° E, extending along the southern coast of the Bohai Sea in eastern China [15]. These deltas were chosen due to their significant roles in supporting human populations and economies, as well as their exposure to both natural and human-induced changes. By analyzing the historical changes in these deltas, our goal is to capture sustained shoreline behavior rather than single-event effects.
Human activities like agriculture and dam construction have significant impacts on river systems, particularly deltas. These activities disrupt natural river flows, trap sediments behind dams, and reduce sediment deposition in deltas which is one of the main similarities between the three deltas [16]. The Nile Delta, for example, has experienced a drastic reduction in sediment load due to the Aswan High Dam, which has led to major coastal erosion [17]. Similarly, the Indus Delta is affected by extensive upstream water withdrawals and irrigation systems, resulting in decreased water and sediment discharge [18]. The Yellow River Delta has been impacted by reduced sediment discharge due to dam construction and water management practices, leading to coastal erosion [19].
The Nile, Indus, and Yellow Rivers supported the rise of ancient civilizations in Egypt, Pakistan, and China by providing fertile floodplains and reliable water. Today these systems face reduced sediment supply, regional sea-level rise, and strong human pressures. In this paper these factors serve as context for case selection and interpretation; the quantitative results come solely from Landsat-derived shorelines [20,21,22,23]. On the other hand, while the Nile, Indus, and Yellow River deltas share similarities, present unique differences have been shaped by their distinct geographical and hydrological features. The classification of deltas into river, wave, and tide-dominated types based on [24], who developed a model to categorize deltas based on the relative influence of fluvial, wave, and tidal processes, helps in understanding the formation and evolution of different deltaic systems, which was modified by [25] to include nine subclasses developed based on combined influence on deltas. The Nile Delta is primarily wave-dominated, influenced by Mediterranean currents that redistribute sediments along its coastline. The Indus Delta is tide-dominated, characterized by strong tidal forces that shape its extensive network of tidal channels and influence sediment distribution. The Yellow River Delta is river-dominated, known for its historically high sediment load, contributing to rapid delta growth into the Sea [15].
The selection of the Nile, Indus, and Yellow River deltas in this study is deliberate. These deltas are not only historically significant and agriculturally critical, but they also represent a spectrum of dominant coastal processes of wave, tide, and fluvial-dominated regimes, respectively. All three are located in arid to semi-arid regions and are considered among the few large megadeltas globally that operate under such climatic constraints [26,27,28]. These regions are characterized by low annual rainfall, high evapotranspiration rates, heavy dependence on upstream flow regulation, and a high sensitivity to sediment supply loss [29,30,31,32,33].
Figure 1. Basins and deltas of the Nile, Indus, and Yellow Rivers with major channels and dams. Colored polygons show basin extents; delta plain boundaries are outlined and segments are labeled as follows: Nile Delta (East Alexandria, Rosetta, Burullus Lake, Damietta, West Damietta, West Port Said), Indus Delta (Zones 1–4), and Yellow River Delta (Bohai Wan, New Mouth, Old Mouth, Laizhou Bay). Insets map each delta at the same scale with labeled graticules and north arrows. Wave-rose diagrams summarize the mean annual wave approach for each delta [34]. Red labels report representative tidal range (TR): Nile ≈ 0.2–0.3 m, Indus ≈ 1.5–4.2 m, Yellow ≈ 0.7–0.8 m; green labels report relative sea level rise (SLR): Nile ≈ 2.0–3.4 mm yr−1, Indus ≈ 2.1–3.6 mm yr−1, Yellow ≈ 3.5–4.1 mm yr−1 [18,35,36,37,38,39]. The ternary diagram classifies shoreline dynamics based on the relative dominance (uppercase letters) or influence (lowercase letters) of fluvial (F, f), wave (W, w), and tidal (T, t) processes, with plotted points for each delta [15,25].
Earth 06 00120 g001

1.2. Background

Sea-level rise and wave-driven processes have impacted the Nile, Indus, and Yellow River deltas in distinct but measurable ways. In the Nile Delta, sea-level rise has led to shoreline retreat in low-lying areas such as Rosetta and Damietta, where elevation is often below 2 m [40,41]. Wave and longshore current activity along the delta coast, primarily moving from west to east, continues to redistribute limited sediment seaward from Alexandria to Port Said due to the near-total upstream sediment retention by the Aswan High Dam [42,43]. In the Indus Delta, monsoon-driven coastal currents alternate direction seasonally, influencing sediment transport along an already sediment-starved coast. These hydrodynamic forces, combined with subsidence and an 88% rate of seawater intrusion into deltaic lands, have led to salinization and loss of mangrove cover, particularly since the 1990s [11,44]. The Yellow River Delta faces accelerated relative sea-level rise caused by human-induced subsidence exceeding 200 mm/year in places such as Laizhou Bay [45]. This, together with reduced sediment delivery from upstream diversions and seasonally reversing residual currents in the Bohai Sea, continues to drive erosion and alter delta morphology [46,47].
Figure 2. Temporal changes in annual runoff and sediment discharge for the Nile, Indus and Yellow basins. Panel (A) shows annual runoff as dotted lines (109 m3) with dashed linear regression trend lines; Panel (B) shows sediment discharge as dotted lines (106 t) on a log10 y-axis with log10-linear trend fits. Major dam-construction events and cyclone/typhoon events are marked directly on the curves. Slope boxes report fitted slopes (runoff: absolute change in 109 m3 yr−1; sediment: absolute change in 106 t yr−1). All three basins exhibit negative trends in both runoff and sediment discharge over the period shown. Time series were compiled from published sources and averaged to annual values [48,49,50,51,52,53,54,55,56,57,58].
Earth 06 00120 g002
Although wave dynamics, sea-level rise, and subsidence are known to influence long-term shoreline evolution, this study does not directly analyze these continuous processes. Their rates of change are gradual and persistent over recent decades for the 3 rivers, making short-term effects hard to isolate from annual, satellite-derived shorelines. Given these challenges, the analysis focuses on quantifiable, event-driven impacts. On the natural side, we treat cyclones, river-mouth shifts, and flood years as events; broad pressures such as sea-level rise, long-term wave climate, and gradual subsidence are treated as background and not analyzed as separate time series because they behave similarly across the three deltas [11,47,59,60,61,62,63]. On the human side, we examine dams and flow regulation, coastal defenses, and restoration or engineering projects, rather than population and basin-wide land-cover change. In all three systems, the dominant land-cover trend is increased urbanization [15,64,65,66,67,68,69,70]. By emphasizing episodic disturbances that alter sediment delivery or nearshore processes, the study captures the more spatially variable drivers of shoreline change that are detectable at the temporal resolution of Landsat and DSAS. This event-focused framing lets us track where erosion or accretion trends strengthen, weaken, or reverse through time, while avoiding single-factor attribution and remaining aligned with management needs. Building on this framing, we ask whether the direction and pace of shoreline change over decades are shaped more by clusters of episodic events than by any single factor. Our goal is to quantify long term change and to pinpoint where erosion or accretion strengthens, weakens, or reverses through time. We use the multidecadal satellite record to follow trajectories at the segment scale and to compare successive periods to detect these shifts. Beyond our study deltas, the U.S. Geological Survey Digital Shoreline Analysis System (DSAS) has been used widely worldwide. Recent examples include Mohammedia on Morocco’s Atlantic coast, the Bakırçay Delta in Türkiye, estuarine coasts of the Río de la Plata in Argentina, and the Yancheng Coast in China, where DSAS combined with satellite archives quantified spatial patterns of erosion and accretion [71,72,73,74].
What makes this work different is that it goes beyond showing where erosion or accretion happened. It looks at how these processes are changing direction over time. Some places still show land gain, but at a slower rate or a weakening accretion trend of how they used to show. Other places continue to erode, but erosion is slowing down, which might point to some stabilization. These trends are not clear if we only look at net shoreline change. By adding trend analysis, the study helps reveal underlying shifts that are often missed.
This study does not attempt to separate or quantify how much each factor such as dam construction, sea-level rise, or climate contributed to the shoreline change. That kind of decomposition requires detailed hydrodynamic or sediment transport models, which are beyond the scope of this work. Instead, the goal here is to trace how the direction of shoreline change is evolving over time in different segments. Some areas show erosion slowing down, others show accretion weakening. These changes are often missed when looking at net shoreline change alone. By using long-term satellite imagery, the analysis focuses on how deltaic shorelines are shifting under overlapping human and natural pressures, even if those pressures cannot be fully isolated.

2. Materials and Methods

The methodologies applied in this study were selected for their effectiveness in analyzing the dynamics of deltaic systems. Landsat satellite imagery was used due to its comprehensive and consistent global coverage, making it ideal for historical shoreline analysis [75]. The Digital Shoreline Analysis System (DSAS) v5.1 and ArcMap 10.8.1 were utilized for precise calculations of erosion and accretion areas, allowing a detailed evaluation of shoreline changes. To capture geographic variability, we divided each delta into segments using geomorphic and engineered boundaries visible in the 1972–2022 Landsat sequence and high-resolution basemaps. Boundaries were placed at stable breaks in sediment regime such as river mouths and jetties, lagoon entrances, headlands and promontories, and documented training works. We cross-checked these boundaries against published morphodynamic syntheses and prior shoreline studies, and we kept the segmentation consistent with longshore transport cells indicated by the wave roses in Figure 1. These ancillary sources inform interpretation only; they are not inputs to the shoreline calculations. Across all three deltas we use one consistent workflow to trace the direction of shoreline change through time. We select cloud-free Landsat scenes, enhance land–water contrast with NDWI, and digitize annual shorelines. From a fixed baseline with uniformly spaced transects, we compute NSM and EPR, aggregate EPR in the time windows, and summarize by segment. Direction is the sign of EPR (negative erosion, positive accretion); change in direction comes from the slope of the segment-mean EPR across successive windows. We also compute cumulative area change from polygons between successive shorelines to report net outcomes.
For the Nile Delta, we use six segments, East Alexandria, Rosetta, Burullus Lake, West Damietta, Damietta, and West Port Said, bounded by the two mouths, the Burullus lagoon shore, and sectors with concentrated coastal defenses and port infrastructure. This six-segment division follows established coastal cells along the Alexandria to Port Said coast and documented engineering at Rosetta and Damietta [15,76]. For the Indus Delta, we adopt the four-zone framework used in recent shoreline work, Zones 1 to 4 increasing eastward, which separates the macrotidal outer delta from the fluvially influenced sector near the active mouth [77]. For the Yellow River Delta, we separate Bohai Wan, the New Mouth, the Old Mouth, and Laizhou Bay. This scheme reflects the 1996 main channel diversion from the Old Mouth to the New Mouth and subsequent training works and water–sediment regulation that reorganized shoreline trajectories [78,79].

2.1. Dataset

The primary data source is USGS Landsat imagery. We used Collection 2 Level-1 terrain-corrected scenes from TM, ETM+, OLI, and OLI-2. Multispectral native resolution is 30 m for TM, ETM+, OLI, and OLI-2 and 60 m for MSS, as summarized in Supplementary Table S1. This study analyzes shoreline positions from Landsat only for 1972–2022. No river-discharge or sediment-load time series were processed or modeled. Scenes were screened visually for a clear shoreline and minimal cloud or haze and chosen as close as possible to the target time windows. All images were obtained from the USGS Global Visualization Viewer (GloVis) platform (https://glovis.usgs.gov/app) (accessed on 30 November 2022). Landsat data provided by the USGS is in the public domain and may be freely used without copyright restrictions. A total of 43 images from 1972 to 2022 were selected and divided into intervals to ensure capturing a representative temporal resolution: 1972–1982, 1982–1992, 1992–1997, 1997–2002, 2002–2007, 2007–2012, 2012–2017, and 2017–2022. Because the Indus delta is macrotidal, shoreline position at the time of imaging is sensitive to tidal phase. To reduce phase bias we selected, for each target year, paired scenes near the new moon and the full moon and digitized the shoreline in both images. This brackets the intertidal position and reduces the chance that a single low- or high-water scene governs the mapped shoreline for that year [80]. This approach ensures that tidal conditions are accurately represented in the analysis.

2.2. Data Preprocessing

To quantify both magnitude and direction through time, we use cumulative area change (ΔA) derived from shoreline-to-shoreline polygons, and trend in EPR defined as the slope of segment-mean EPR across analysis windows. Historical shorelines were manually extracted from Landsat images using ArcMap to reduce potential errors from automated classification. The Normalized Difference Water Index (NDWI) was applied to enhance water visibility and improve shoreline detection [20]. NDWI uses the reflectance difference between the green and near-infrared (NIR) bands to separate water from land [15,81]. Since the band assignments vary between satellite generations, the following Equations (1) and (2) were used.
For Landsat 5 and 7:
N D W I = B a n d 2 B a n d 4 B a n d 2 + B a n d 4
For Landsat 8 and 9:
N D W I = B a n d 3 B a n d 5 B a n d 3 + B a n d 5
These NDWI layers were calculated in ArcGIS Pro and visually inspected. Manual digitization of shoreline boundaries was then performed to ensure accuracy, especially in turbid coastal zones. Higher NDWI values typically represent water bodies, which can help in precise shoreline tracing (Figure 3).
We did not apply additional atmospheric filtering, radiometric normalization, or mosaicking. Images were reprojected to the appropriate UTM zone for each delta, and when resampling was needed we used nearest-neighbor to preserve shoreline edges. NDWI was then computed to enhance water–land contrast, which is especially helpful in the Yellow River delta where suspended sediment is high.

2.3. Historical Shoreline Data Analysis

Shoreline change was analyzed with a baseline and transect workflow applied to the annual shoreline chronology. We implemented this workflow using the U.S. Geological Survey DSAS (version 5.1) in ArcGIS Desktop (ArcMap 10.8.1). The DSAS setup created a geodatabase with the historical shorelines, a reference baseline, and regularly spaced transects following the DSAS v5.1 user guide [82]. We use time windows to reduce short-term variability. This design smooths sudden changes; the reported trends reflect the cumulative influence of overlapping natural and human drivers over multi-year periods. Each dataset was projected to its respective Universal Transverse Mercator (UTM) zone: Zone 36N for the Nile Delta, Zone 42N for the Indus Delta, and Zone 50N for the Yellow River Delta. Transects were projected at 1000-m intervals along the shoreline to measure changes between successive shorelines. The Nile Delta included 273 transects across six zones, the Indus Delta had 390 transects across four zones, and the Yellow River Delta had 290 transects across four zones.
Following DSAS conventions, Net Shoreline Movement (NSM) is the distance between the oldest and the youngest shoreline, and the End Point Rate (EPR) equals NSM divided by elapsed time, EPR Equation (3) and, NSM Equation (4) were calculated to quantify shoreline changes. Each shoreline polyline was assigned a ±10 m positional uncertainty in the DSAS uncertainty field to represent digitizing and georegistration tolerance, consistent with the DSAS v5.1 guidance for mixed historical shorelines. Because the mapped shoreline is a vector feature rather than a pixel boundary, positional tolerance is specified explicitly in DSAS rather than inferred from sensor pixel size. Using these per-shoreline values, DSAS computes for each analysis window the endpoint-rate uncertainty (EPRunc); with our window lengths and ±10 m tolerance, EPRunc is 0.28 m/yr. The EPR trend is later calculated from the slope of the each individual segment-mean EPR through successive windows [82,83]. A negative trend with positive area therefore indicates that net accretion persists but is weakening in later windows, and the converse holds for positive trend with negative area. Two summaries are reported in the tables. Total area change (ΔA, km2) is computed from change polygons between successive shorelines and summed over the full study period within each segment. The dominant process label is based on the sign of ΔA (accretion if ΔA > 0, erosion if ΔA < 0). Separately, we report the EPR trend, defined as the slope through time of the segment-mean EPR across successive analysis windows. A positive EPR trend indicates movement toward advance (either increasing accretion or decreasing erosion). A negative EPR trend indicates movement toward retreat (either increasing erosion or decreasing accretion). Because ΔA is an integral over the entire record and the trend is a temporal derivative, their signs need not match.
The Formulas (3) and (4) below follow DSAS definitions; they are shown for explanation only, and all values are computed within DSAS.
E P R = ( S t 2 S t 1 ) ( t 2 t 1 )
N S M = ( S t 2 S t 1 )
where (St2) is the shoreline position at the most recent time (t2), (St1) is the shoreline position at the oldest time t1 and (t2t1) is the time interval in years.
Trend analysis was calculated using linear regression on the EPR values for each period as shown in Equation (5):
E P R = m × P e r i o d + b
where (m) represents the slope of the regression line (indicating the trend), and (b) is the intercept. Positive slopes (m > 0) indicate shoreline increase in the accretion or reduction in erosion values (advancement), while negative slopes (m < 0) indicate increase in the erosion or reduction in the accretion values (retreat). The mean trend for each segment was calculated using Equation (6):
M e a n   T r e n d = i = 1 n m i n
where (mi) is the slope of the (i transect number) within the segment, and (n) is the number of transects in the segment. Because DSAS propagates per-shoreline positional uncertainty into EPR uncertainty and into confidence intervals for regression rates, rates such are presented with their DSAS-reported uncertainty, which reflects both shoreline spacing and the analysis time span.
Area change was computed from polygon geometry in ArcGIS. For each segment and time window the two shoreline polylines (t1 and t2) were converted to closed ‘change polygons’ using Feature To Polygon, with short closure lines at segment boundaries. All layers were in the appropriate UTM zone, so areas are reported in metric units. We calculated polygon area with Add Geometry Attributes and summed areas by segment, converting m2 to km2. Polygons seaward of the older shoreline and landward of the newer shoreline were coded as accretion (positive), and the opposite configuration as erosion (negative). Delta-scale totals are the sum of segment values; cumulative curves sum successive windows. To compare segments within each delta we used a one-way ANOVA with segment as the factor and transect-level EPR values as observations pooled over the study period. Post hoc comparisons used Tukey HSD. Statistical significance is reported as p < 0.05 [84].

3. Results

In the Nile Delta, a mix of erosion and accretion was observed across various segments during 1972–2022. East Alexandria showed initial accretion followed by erosion, while Rosetta experienced consistent severe erosion, particularly during 1972–1992. Burullus Lake, West Damietta, and Damietta displayed dynamic shifts between erosion and accretion, with Damietta showing significant accretion during 1997–2007. West Port Said predominantly experienced erosion with varying rates. By 2017–2022, most segments showed milder erosion or slight accretion (see Supplementary Figure S1 and Table S2). Across all deltas, segment-mean EPR magnitudes are typically several m/yr and cumulative area changes reach tens of hundreds of km2. EPRunc = 0.28 m/yr is therefore an order of magnitude smaller than the signal.
Trend analysis revealed relatively stable conditions in all segments except Rosetta. While most areas showed slight positive or negative trends, Rosetta exhibited a notable high positive trend (+6.37 m/year). This is particularly significant as Rosetta had consistently been the most severely eroding segment, indicating that despite continued erosion, the rates have significantly reduced over time. The cumulative area changes along the Nile Delta shoreline from 1972 to 2022 show a clear spatial pattern, with erosion predominantly occurring in the western segments and accretion concentrated in the east. Rosetta, located in the west, experienced the most severe erosion, with a total land loss of −24.26 km2, followed by Burullus Lake with −9.83 km2. In contrast, Damietta, located in the eastern part of the delta, showed significant accretion, gaining +10.60 km2 of land. East Alexandria and West Damietta, both on the western side, also recorded erosion, though to a lesser extent, with losses of −0.24 km2 and −3.24 km2, respectively. This spatial distribution highlights the distinct dynamics between the western and eastern parts of the delta, with erosion dominating the west and accretion shaping the east (Figure 4, Table 1).
A one-way ANOVA on transect-level EPR showed significant differences among the six segments (p < 0.05). Post hoc comparisons indicated that Rosetta differs from every other segment, which matches its stronger retreat relative to nearby sectors.
In Table 1, Table 2 and Table 3, (Dominant Process) reflects the sign of total area change over the full period, while (EPR trend) is the slope through time of segment-mean EPR.
In the Indus Delta, the shoreline exhibited frequent and significant fluctuations between erosion and accretion across all zones during 1972–2022. Zone 1 experienced large-scale accretion in the earlier periods (1972–1979), followed by substantial erosion from 1992 onwards, with moderate recovery in periods such as 1997–2002. Zones 2, 3, and 4 showed similar variability patterns, with notable increases in erosion rates starting from 1992, though some periods showed temporary accretion. By the study’s end, Zone 3 displayed signs of stabilization after 2012, while Zone 4 exhibited relatively mild erosion (see Supplementary Figure S2 and Table S3).
The long-term EPR trends were consistently negative across all zones, ranging from −6.01 m/year in Zone 3 to −3.00 m/year in Zone 2. This persistent negative trend, observed throughout the 50-year period, indicates the delta remains highly vulnerable to ongoing erosive processes, with no segments showing a clear shift towards sustained accretion.
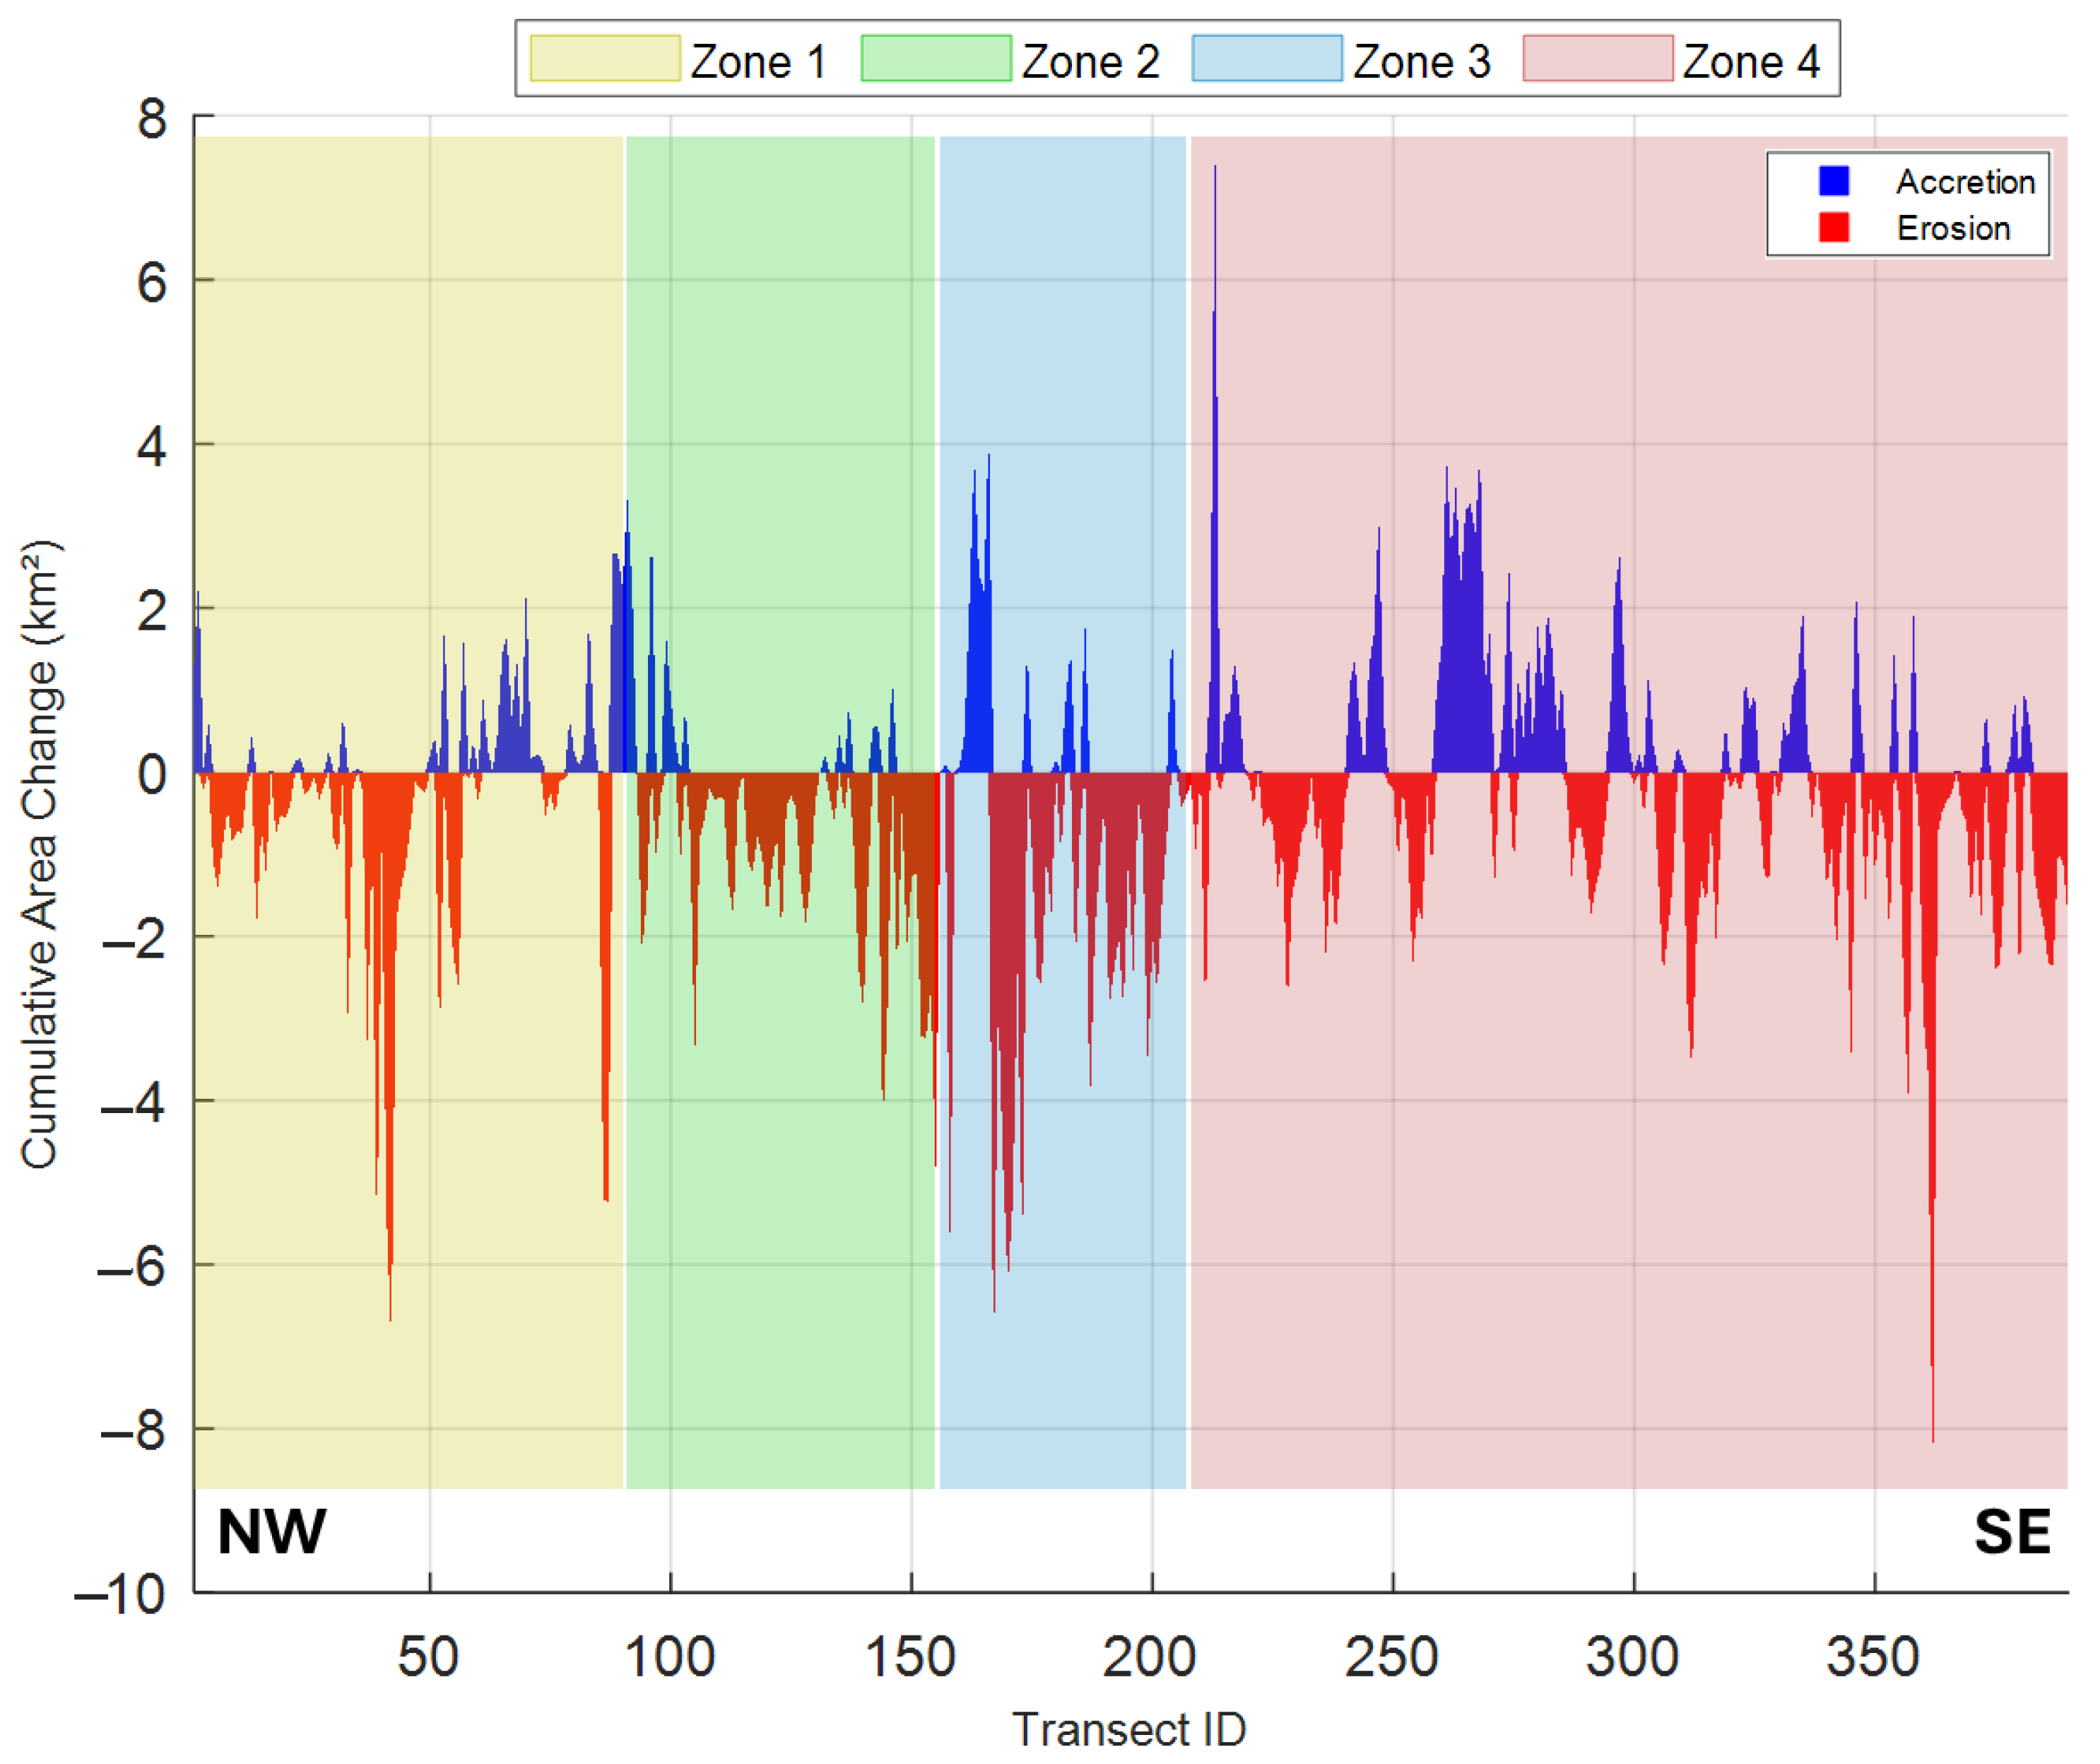
The cumulative area changes along the Indus Delta from 1972 to 2022 reveal significant erosion across all segments, with no areas showing net accretion. Zone 3 experienced the most substantial land loss, with a total area change of −64.68 km2, followed by Zone 2 and Zone 4, which lost −53.71 km2 and −45.16 km2, respectively. Zone 1, while also impacted by erosion, recorded a total area loss of −38.79 km2. These figures indicate that erosion has dominated the shoreline dynamics of the Indus Delta over the past 50 years, with all zones showing negative cumulative area changes (Figure 5, Table 2).
The ANOVA on EPR across the four zones was significant (p < 0.05). Post hoc comparisons showed that Zone 3 differs from Zones 1, 2, and 4, reflecting the distinct regime near the active mouth.
The Yellow River Delta exhibited significant shifts in shoreline dynamics across its segments over time. Between 1973 and 1983, all segments experienced substantial accretion, particularly the Old Mouth. From 1982 to 1997, most segments transitioned to erosion, while Laizhou Bay maintained accretion. From 1997 onwards, the delta showed frequent lateral switches between erosion and accretion. By 2017–2022, the New Mouth and Bohai Wan experienced mild accretion, while the Old Mouth continued to erode significantly (see Supplementary Figure S3 and Table S4).
Long-term trends showed negative EPR values across all segments, with the Old Mouth showing the steepest decline (−129.49 m/year). Laizhou Bay and the New Mouth also exhibited substantial negative trends (−34.56 and −40.09 m/year, respectively), while Bohai Wan showed more moderate erosion (−10.34 m/year). These trends indicate that despite occasional accretion periods, erosion has increasingly dominated the delta’s dynamics, particularly in the Old Mouth segment.
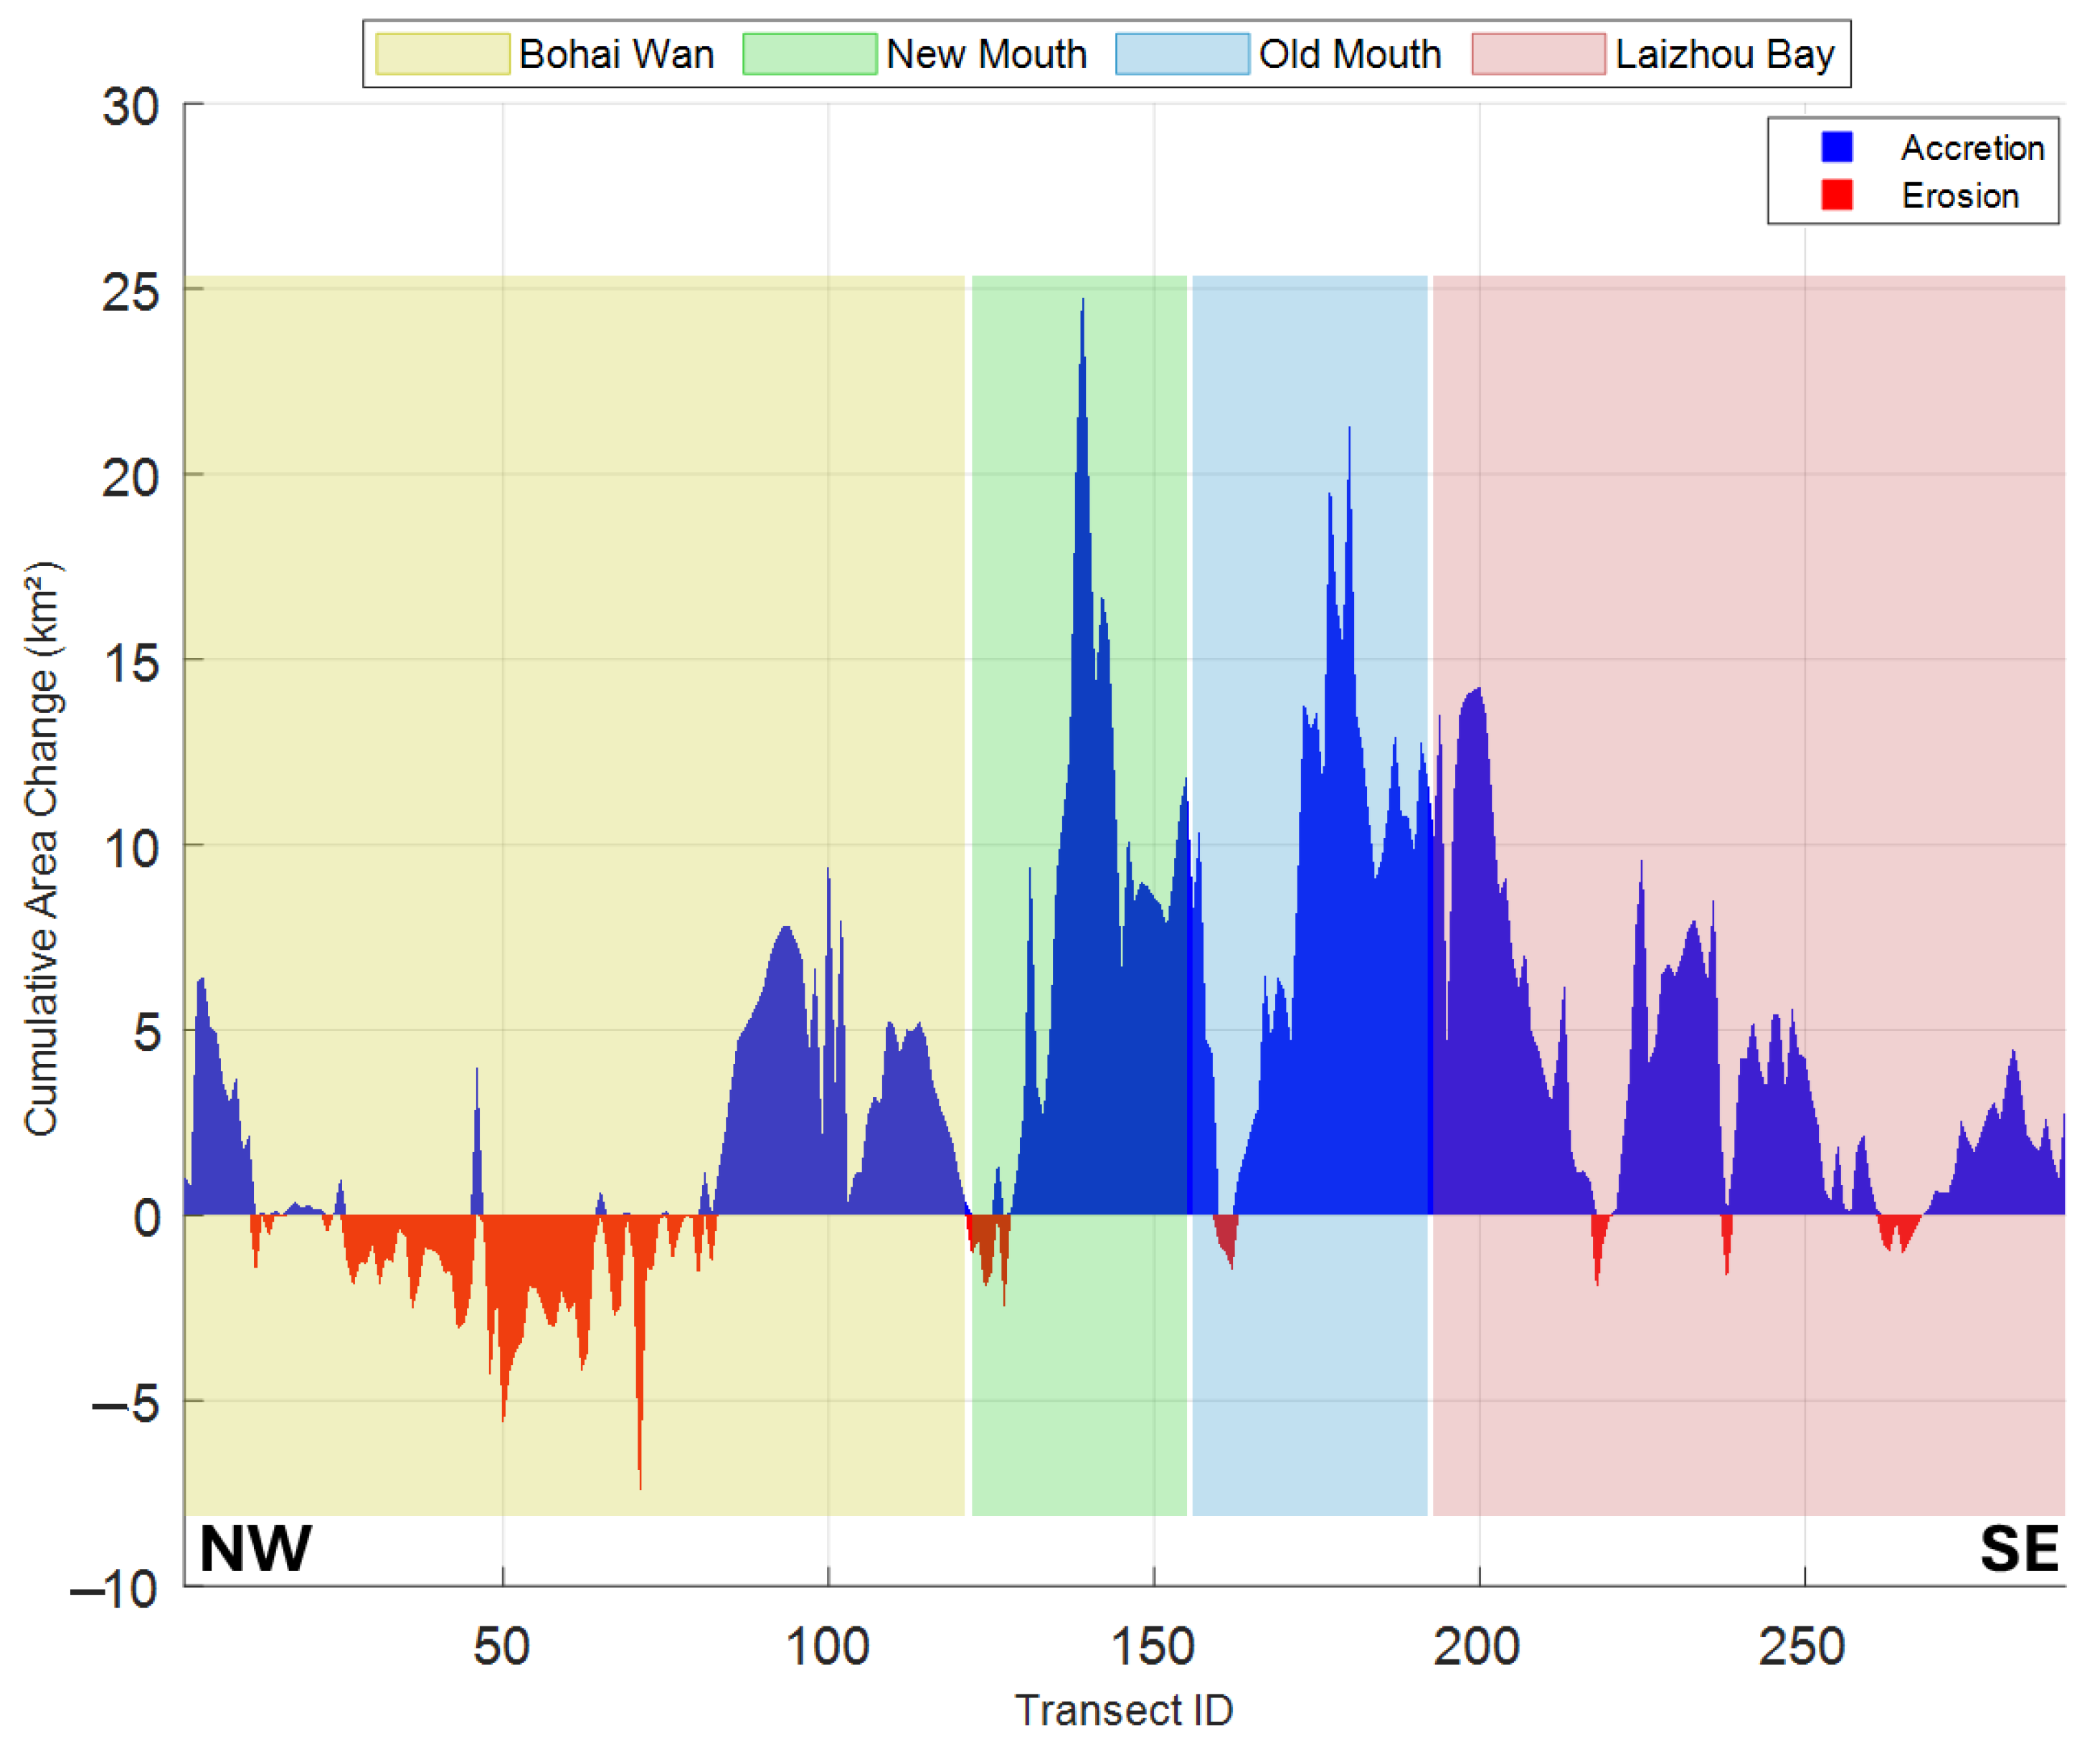
The cumulative area changes along the Yellow River Delta from 1973 to 2022 indicate overall accretion across all segments, amounting to a total gain of 1009.5 km2. Laizhou Bay recorded the largest increase in land area with +392.49 km2, followed by the Old Mouth, New Mouth segments, and Bohai Wan with accretions of +331.05, +274.97 and +111.03 km2, respectively (Figure 6, Table 3). However, when comparing these values to the period from 1973–1983, which showed a total accretion of 2132.5 km2 across all segments, the significant reduction in the overall land gain over time is evident. This highlights a dramatic slowdown in accretion rates in the later years, suggesting that although the delta remains an accreting system, the pace of land growth has considerably declined over the past several decades.
The ANOVA on EPR among segments was significant (p < 0.05). Post hoc comparisons indicated that Bohai Wan and the Old Mouth have lower mean EPR than the New Mouth, consistent with the divergence after the channel relocation.

4. Discussion

Historical shoreline changes in the Nile, Indus, and Yellow River deltas appear to reflect both natural processes and human activities. Figure 7 shows temporal associations between events and changes in morphology at segment and delta scales. Interpretations are based on visual inspection of segment-level and aggregate curve responses that co-occur with annotated events and are presented as descriptive observations, not as formal statistical detections. The figure is provided for context and does not imply direct causal attribution. Individual interventions or storms might act locally, counteract one another, or combine to amplify change; at this resolution the focus is on persistent, multi-year directions of change.
Our results are consistent with the hypothesis that multiyear shoreline direction may be shaped by clusters of episodic drivers rather than by any single factor. Shifts in Figure 7 often occur at times when several controls changed together, for example, dam completions, mouth training, and major storms. The mid 1990s to early 2000s divergence in the Yellow River Delta coincides with a channel shift, typhoons, and new reservoirs and may reflect their combined influence. The early 1990s reversal on the Indus coincides with upstream dam construction and could be related to reduced sediment supply. In the Nile, local stabilization after coastal defenses in the 1990s to 2000s appears alongside basin scale negative trends that suggest continuing net retreat elsewhere. These timing relationships are suggestive but do not prove causation. The analysis shows where erosion or accretion strengthens, weakens, or reverses over time, but further process-based studies are needed to test specific drivers.
In the Nile Delta, sediment supply dropped by more than 90% following the construction of the Aswan High Dam in 1964, a decline that is consistent with the observed shift from accretion to erosion along much of the delta front [98,99]. In the Indus Delta, annual sediment discharge declined from over 200 million tons per year in the early 20th century to less than 30 million tons following the construction of major dams like Tarbela and Mangla [100,101,102]. This reduction in sediment availability is likely to limit the delta’s ability to offset wave-driven erosion and natural subsidence. In the Yellow River Delta, sediment diversion projects and controlled flow regulation since the 2000s have tended to redirect deposition to specific outlets, especially the New Mouth, while older abandoned outlets have experienced steady erosion. These patterns are consistent with broader observations of sediment re-distribution and shifting coastal inputs across the Bohai region [35,103,104]. These sediment deficits can reduce land-building potential and increase exposure to coastal erosion, sea level rise, and human impacts [105,106,107].
The shoreline dynamics of the Nile Delta from 1972 to 2022 are consistent with complex interactions between coastal defense measures and upstream dam constructions. The completion of the Aswan High Dam in 1971 substantially reduced sediment supply, which is consistent with the shift toward accelerated erosion and the sharp decline in the cumulative area change curve. By the late 1980s and 1990s, coastal protection projects including the Rosetta Breakwaters (1988) and the Rosetta Sea Wall (1991) coincide with slowed land loss in some places, particularly Rosetta, although these interventions did not fully halt erosion. The late 1990s and early 2000s saw additional protection efforts with the Baltim Breakwaters (1998), Lake Manzala Coastal Protection Project (2000), Alexandria coastal protection projects completion by 2001, and the Damietta Sea Wall (2003), which were associated with a slowdown in erosion and with some segments (for example Damietta) showing accretion [108,109,110]. The 2005 Rosetta Groins construction corresponds with noticeable stabilization in that segment, as reflected in its curve (Figure 7). The early 2010s saw further upstream developments, including the Merowe Dam (2009), the Grand Ethiopian Renaissance Dam (GERD) (2011), and the heightening of the Roseires and Sennar Dams (2013) [111,112]. These projects coincide with further reductions in sediment supply and with the resumed downward trajectory of the cumulative area change curve after ~2012. By 2022, the cumulative loss was about 30 km2, with roughly 27 km2 lost from 1972 to 1997 and a further ~3 km2 from 1997 to 2022.
The shoreline dynamics of the Indus Delta from 1972 to 2022 are consistent with a mix of natural variability and major upstream interventions (Figure 7). While early decades show a gradual net gain in some zones, the record indicates a sharp reversal in the early 1990s. A series of dam constructions including the Janauri Dam (1988), Damsal Dam (1990), Chohal and Perch Dams (1993), Chamera I Dam (1994), Saleran Dam (1995), and Mirzapur Dam (1996) coincide with reduced sediment delivery to the delta (100–102). Based on the cumulative area change results from this study, the delta moved from a net gain of approximately 75 km2 to a net loss of about 70 km2 between 1992 and 1997, a change that appears abrupt in the record. A brief period of accretion followed after 1997, but the longer term pattern remains dominated by erosion and lower sediment availability. This recovery was short lived; subsequent projects such as the Ranjit Sagar Dam (2001) and Chamera II Dam (2003) may have contributed to renewed reductions in sediment supply and further erosion [113]. The early 2010s brought additional dam projects and natural events that coincide with further erosion. The Cyclone Nilofar (2014) and Indus flood–river avulsion events occurred alongside notable erosion in Zones 2 and 3 [114,115], Upstream works like the Nimoo Bazgo and Parbati III Dams (2014) coincide with continued reductions in sediment delivery. Restoration efforts such as the Mangrove Rehabilitation Project (2010) appear to have contributed to some localized slowing of decline [116], with stabilization signals between 2010 and 2018. By 2022, the record shows substantial cumulative land loss of about 300 km2 despite localized stabilization efforts.
The dynamics of the Yellow River Delta from 1973 to 2022 reflect interactions among large-scale dam constructions, water-sediment regulation schemes, and natural events (Figure 7). The initial phase of widespread accretion slowed after the Longyangxia Dam (1989), particularly in Bohai Wan and the New Mouth, as indicated by a flattening of the cumulative area curve in the late 1980s and early 1990s [117]. A significant shift occurred in the mid-1990s with the Main Channel Shift (1996) and Typhoon Winnie (1997). These events, combined with the construction of Xiaolangdi Dam (1999), Wanjiazhai Dam (2000), and Typhoon Rusa (2001), triggered notable segment divergence, with the Old Mouth and Laizhou Bay experiencing reduced accretion and an overall decrease in accretion continuing until 2014. The early 2010s saw Wetland Restoration Programs could be one of reasons of the localized stabilization [118,119], particularly in Laizhou Bay. he muted (typhoon-only) signature likely reflects aggregation rather than absence of impact. Winnie and Rusa fall within a six-year cluster of major changes that could have reorganized shoreline erosion; in annual and long-term views the curves capture that combined regime shift. Typhoon Lekima might be responsible for a localized loss in Laizhou Bay (~40 km2 in the three years after 2019), while other segments remained near steady, which is thought to reflect strong spatial control by mouth training and restoration [120]. By 2022, while the delta showed a substantial cumulative land gain of about 1009.5 km2 (less than half the gain between 1973 and 1983), the last 26 years (1996–2022) were dominated by erosion with an overall land loss of about 200 km2, reflecting continued challenges despite management efforts.
In comparison, the three deltas differ in apparent resilience, which may reflect energy setting, sediment supply, and management. The Indus is macrotidal with a high tidal range and frequent cyclones, and it shows the steepest declines in runoff and sediment (Figure 2). With little new sediment to offset strong tidal energy, zones tend to lose area. The Nile is wave-dominated with a very low tidal range. After the Aswan High Dam, sediment delivery fell sharply, and defenses such as the Rosetta sea wall and groins appear to have redistributed sand alongshore rather than reversed regional loss. The Yellow River may appear more resilient because active mouth training and water and sediment regulation routed supply to selected outlets. Wetland restoration may have aided local stability, although recent years suggest rising erosion risk. Natural events act on these altered baselines. Where coasts are sediment-starved, storms can magnify losses (as on the Indus). Where training and restoration concentrate supply, storm impacts may be more localized (as on the Yellow). Along the Nile, defenses can create updrift gains and downdrift losses, so wave-driven transport redistributes rather than adds material. These patterns are consistent with the direction shifts in Figure 7 and help explain why clusters of events may matter more than isolated ones.
Patterns here are consistent with global evidence that upstream storage and regulation reduce sediment delivery to deltas, which can increase exposure to marine energy and shorten the window for natural recovery. Two practical points follow. First, energy setting matters. Macrotidal, sediment-poor systems like the Indus may be hardest to stabilize once losses begin. Actively managed outlets in the Yellow River can prolong local gains but may not offset a system-wide decline in supply. Second, structures that only redistribute sand, as along the Nile, are not a substitute for new sediment. A limitation of our design is scale and aggregation. With the five-to ten-year windows, clusters of reinforcing events are detectable, but a single short event may not register at the delta scale. Opposing events in the same window can cancel and yield little net signal. The slope-based trend summarizes the direction of change through time and can downplay short local excursions, although cumulative area in a segment still records the net effect. These choices focus the analysis on sustained, long-term behavior rather than individual episodes.

5. Conclusions

This multidecadal shoreline analysis shows how long-term change across the Nile, Indus, and Yellow River deltas reflects interacting human and natural drivers. By combining segment-scale area change with EPR trends, the study identifies where erosion or accretion strengthens, weakens, or reverses through time rather than only where it occurs.
Across the three systems, both the magnitudes and the timings differ. In the Nile Delta the shoreline lost about 27 km2 from 1972 to 1997 and a further 3 km2 by 2022, indicating that early coastal defenses tempered but did not reverse sediment-starved retreat. The Indus Delta shifted from intermittent gains to persistent loss after the early 1990s and now totals roughly 300 km2 of cumulative land loss. The Yellow River Delta accrued land rapidly before the mid-1990s, then lost about 200 km2 after the main-channel relocation, despite continued management at the active mouth. These trajectories suggest that management may influence where change occurs and its pace, while basin-scale sediment supply appears to set the envelope for possible recovery. Trend analysis highlights this notable variability across these deltas.
The indicators developed here support three practical decisions: where to prioritize action, what mix of measures is feasible, and how to monitor success. For the Nile, prioritize segments with persistent negative cumulative area and weakly positive EPR trends (signs of slowing retreat, not recovery). Use targeted nourishment that recycles littoral sand, sediment bypassing at jetties, and dune and wetland restoration to add roughness and storage in front of hard structures. For the Indus, prioritize sediment and habitat: set environmental flow targets to deliver sand and silt to the delta plain, expand mangrove and tidal-marsh corridors, and apply cyclone-resilient setback lines for new development. For the Yellow River, continue mouth training and the water-and-sediment regulation scheme, plan for accommodation at abandoned outlets, and sustain wetland creation in Laizhou Bay to retain gains while limiting exposure.
Policy should follow observed responses in each delta and the primary constraint of sediment supply. In the Nile, local defenses slowed but did not reverse system-wide decline; prioritize targeted nourishment, sediment bypassing at jetties, and maintain harbor and navigation protections, with new hard works only where essential. In the Indus, mangrove rehabilitation reduced retreat, but durable recovery requires environmental-flow targets that deliver sand and silt to the delta plain and risk-aware siting away from rapidly retreating shores. In the Yellow River, continue mouth training and the water-and-sediment regulation scheme, accept contraction at abandoned mouths, sustain wetland creation in Laizhou Bay, and use setback zones to reduce exposure. Track progress annually with the satellite indicators used here: segment cumulative area and the EPR trend.
Implementation must be tied to measurable performance. Segment cumulative area and the EPR trend are management indicators that can be updated annually from satellite shorelines. Agencies can rank segments by risk and benefit, set targets (for example, flattening a negative trend), and use thresholds to trigger action if trends do not improve.
Time-aggregated shorelines and windowed analysis emphasize sustained behavior and can mute short, local excursions from single storms or localized works; opposing drivers within the same window may also cancel. These choices suit regional planning, while finer-scale studies that couple shoreline mapping with hydrodynamic modeling, subsidence measurements, and bathymetric change will be valuable for detailed design.

Supplementary Materials

The following supporting information can be downloaded at: https://www.mdpi.com/article/10.3390/earth6040120/s1. Figure S1. EPR and area change patterns along the Nile Delta (1972–2022). Each plot shows EPR (m/year) on the left y-axis and area change (km2) on the right y-axis for various transect IDs, showing the spatial and temporal changes in shoreline positions across different segments. Figure S2. EPR and area change patterns along the Indus Delta (1972–2022). Each plot shows EPR (m/year) on the left y-axis and area change (km2) on the right y-axis for various transect IDs, showing the spatial and temporal changes in shoreline positions across different segments. Figure S3. EPR and area change patterns along the Yellow Delta (1973–2022). Each plot shows EPR (m/year) on the left y-axis and area change (km2) on the right y-axis for various transect IDs, showing the spatial and temporal changes in shoreline positions across different segments. Table S1. Landsat dataset resolution, source, and years used in the research. Table S2. Mean EPR in (m/year) by Region and Time Period along Nile Delta. Table S3. Mean EPR in (m/year) by Region and Time Period along Indus Delta. Table S4. Mean EPR in (m/year) by Region and Time Period along Yellow Delta.

Author Contributions

Conceptualization, M.R. and P.L.; methodology, M.R. and P.L.; software, M.R.; validation, M.R.; formal analysis, M.R.; investigation, M.R.; resources, M.R.; data curation, M.R.; writing—original draft preparation, M.R.; writing—review and editing, M.R. and P.L.; visualization, M.R.; supervision, P.L. All authors have read and agreed to the published version of the manuscript.

Funding

This research received no external funding.

Data Availability Statement

The raw data used in this study consists of publicly available Landsat satellite imagery. The data were accessed through the USGS Global Visualization Viewer (GloVis) covering the Nile, Indus, and Yellow Delta regions between 1972 and 2022.

Acknowledgments

The authors would like to thank the editor and three reviewers for the detailed and constructive suggestions.

Conflicts of Interest

The authors declare no conflicts of interest.

References

  1. Zhang, W.; Xu, Y.J.; Guo, L.; Lam, N.S.-N.; Xu, K.; Yang, S.; Yao, Q.; Liu, K.-B. Comparing the Yangtze and Mississippi River Deltas in the light of coupled natural-human dynamics: Lessons learned and implications for management. Geomorphology 2022, 399, 108075. [Google Scholar] [CrossRef]
  2. Angamuthu, B.; Darby, S.E.; Nicholls, R.J. Impacts of natural and human drivers on the multi-decadal morphological evolution of tidally-influenced deltas. Proc. R. Soc. A Math. Phys. Eng. Sci. 2018, 474, 20180396. [Google Scholar] [CrossRef] [PubMed]
  3. Ciavola, P.; Mantovani, F.; Simeoni, U.; Tessari, U. Relation between river dynamics and coastal changes in albania: An assessment integrating satellite imagery with historical data. Int. J. Remote Sens. 1999, 20, 561–584. [Google Scholar] [CrossRef]
  4. Woodroffe, C.D.; Murray-Wallace, C.V. Sea-level rise and coastal change: The past as a guide to the future. Quat. Sci. Rev. 2012, 54, 4–11. [Google Scholar] [CrossRef]
  5. Williams, B.A.; Watson, J.E.; Beyer, H.L.; Klein, C.J.; Montgomery, J.; Runting, R.K.; Roberson, L.A.; Halpern, B.S.; Grantham, H.S.; Kuempel, C.D.; et al. Global rarity of intact coastal regions. Conserv. Biol. 2022, 36, e13874. [Google Scholar] [CrossRef]
  6. Edmonds, D.A.; Caldwell, R.L.; Brondizio, E.S.; Siani, S.M. Coastal flooding will disproportionately impact people on river deltas. Nat. Commun. 2020, 11, 4741. [Google Scholar] [CrossRef]
  7. Oestigaard, T. Water Scarcity and Food Security Along the Nile: Politics, Population Increase and Climate Change; Nordiska Afrikainstitutet: Uppsala, Sweden, 2012; Volume 1. Available online: https://www.files.ethz.ch/isn/152248/FULLTEXT01-5.pdf (accessed on 18 August 2022).
  8. Kalhoro, N.A.; He, Z.; Li, L.; Xu, D.; Jun, W.; Zeb, A.; Khaskheli, N. Spatial and temporal variations of hydrodynamics and sediment dynamics in Indus River Estuary, Pakistan. Glob. Nest J. 2021, 23, 572–580. [Google Scholar]
  9. Miao, C.; Ni, J.; Borthwick, A.G. Recent changes of water discharge and sediment load in the Yellow River basin, China. Prog. Phys. Geogr. 2010, 34, 541–561. [Google Scholar] [CrossRef]
  10. Shi, L.; Wang, Y. Evolution characteristics and driving factors of negative decoupled rural residential land and resident population in the Yellow River Basin. Land Use Policy 2021, 109, 105685. [Google Scholar] [CrossRef]
  11. Solangi, G.S.; Siyal, A.A.; Siyal, P. Indication of subsurface seawater intrusion into the Indus delta, Sindh, Pakistan. Mehran Univ. Res. J. Eng. Technol. 2023, 42, 9–16. [Google Scholar] [CrossRef]
  12. Shi, Y.; Zhu, J.; Xie, Z.; Ji, Z.; Jiang, Z.; Yang, G. Prediction and prevention of the impacts of sea level rise on the Yangtze River Delta and its adjacent areas. Sci. China Ser. D Earth Sci. 2000, 43, 412–422. [Google Scholar]
  13. El Sayed Frihy, O.; Deabes, E.A.; Shereet, S.M.; Abdalla, F.A. Alexandria-Nile Delta coast, Egypt: Update and future projection of relative sea-level rise. Environ. Earth Sci. 2010, 61, 253–273. [Google Scholar] [CrossRef]
  14. El-Asmar, H.M.; Hereher, M.E. Change detection of the coastal zone east of the Nile Delta using remote sensing. Environ. Earth Sci. 2011, 62, 769–777. [Google Scholar] [CrossRef]
  15. Risha, M. Coastal Evolution of the Nile, Indus, and Yellow River Deltas: Historical Analysis, and Machine Learning Prediction for Future Shoreline. Master’s Thesis, NC State University, Raleigh, NC, USA, 20 August 2024. [Google Scholar]
  16. Risha, M.; Liu, P. Shoreline Prediction Models: A Review of the Evolution from Empirical to AI Machine Learning Approaches. Preprint 2025. [Google Scholar] [CrossRef]
  17. Syvitski, J.P.M.; Kettner, A.J.; Overeem, I.; Hutton, E.W.H.; Hannon, M.T.; Brakenridge, G.R.; Day, J.; Vörösmarty, C.; Saito, Y.; Giosan, L.; et al. Sinking deltas due to human activities. Nat. Geosci. 2009, 2, 681–686. [Google Scholar] [CrossRef]
  18. Inam, A.; Clift, P.D.; Giosan, L.; Alizai, A.; Kidwai, S.; Shahzad, M.I.; Zia, I.; Nazeer, M.; Khan, M.J.; Ali, S.S. The Geographic, Geological, and Oceanographic Setting of the Indus River—An Update. In Large Rivers: Geomorphology and Management, 2nd ed.; John Wiley and Sons: Hoboken, NJ, USA, 2022; pp. 488–520. [Google Scholar]
  19. Kuenzer, C.; Heimhuber, V.; Huth, J.; Dech, S. Remote sensing for the quantification of land surface dynamics in large river delta regions—A review. Remote Sens. 2019, 11, 1985. [Google Scholar] [CrossRef]
  20. Khan, S.I.; Adams, T.E. Indus River Basin: Water Security and Sustainability; Elsevier: Amsterdam, The Netherlands, 2019. [Google Scholar]
  21. Zhu, Z.; Giordano, M.; Cai, X.; Molden, D. Yellow River Comprehensive Assessment Basin Features and Issues; Working Paper 57; IWMI: Colombo, Sri Lanka, 2003. [Google Scholar]
  22. Giordano, M.; Zhu, Z.; Cai, X.; Hong, S. Water Management in the Yellow River Basin: Background, Current Critical Issues and Future Research Needs; IWMI: Colombo, Sri Lanka, 2004; Volume 3. [Google Scholar]
  23. Noaman, M.N.; El Quosy, D. Hydrology of the nile and ancient agriculture. In Irrigated Agriculture in Egypt Past, Present and Future; Springer International Publishing: Cham, Switzerland, 2017; pp. 9–28. [Google Scholar]
  24. Galloway, W.E. Process framework for describing the morphologic and stratigraphic evolution of deltaic systems. In Deltas: Models for Exploration; Houston Geological Society: Houston, TX, USA, 1975; pp. 87–98. [Google Scholar]
  25. Nyberg, B.; Howell, J.A. Global distribution of modern shallow marine shorelines. Implications for exploration and reservoir analogue studies. Mar. Pet. Geol. 2016, 71, 83–104. [Google Scholar] [CrossRef]
  26. Li, H.; Zhang, Q.; Singh, V.P.; Shi, P.; Sun, P. Hydrological effects of cropland and climatic changes in arid and semi-arid river basins: A case study from the Yellow River basin, China. J. Hydrol. 2017, 549, 547–557. [Google Scholar] [CrossRef]
  27. Forsythe, N.; Fowler, H.J.; Blenkinsop, S.; Burton, A.; Kilsby, C.G.; Archer, D.R.; Harpham, C.; Hashmi, M.Z. Application of a stochastic weather generator to assess climate change impacts in a semi-arid climate: The Upper Indus Basin. J. Hydrol. 2014, 517, 1019–1034. [Google Scholar] [CrossRef]
  28. Abd-Elaty, I.; Sallam, G.A.H.; Straface, S.; Scozzari, A. Effects of climate change on the design of subsurface drainage systems in coastal aquifers in arid/semi-arid regions: Case study of the Nile delta. Sci. Total Environ. 2019, 672, 283–295. [Google Scholar] [CrossRef] [PubMed]
  29. Zhao, F.; Ma, S.; Wu, Y.; Qiu, L.; Wang, W.; Lian, Y.; Chen, J.; Sivakumar, B. The role of climate change and vegetation greening on evapotranspiration variation in the Yellow River Basin, China. Agric. For. Meteorol. 2022, 316, 108842. [Google Scholar] [CrossRef]
  30. Liaqat, U.W.; Choi, M.; Awan, U.K. Spatio-temporal distribution of actual evapotranspiration in the Indus Basin Irrigation System. Hydrol. Process. 2015, 29, 2613–2627. [Google Scholar] [CrossRef]
  31. Bastiaanssen, W.G.M.; Cheema, M.J.M.; Immerzeel, W.W.; Miltenburg, I.J.; Pelgrum, H. Surface energy balance and actual evapotranspiration of the transboundary Indus Basin estimated from satellite measurements and the ETLook model. Water Resour. Res. 2012, 48. [Google Scholar] [CrossRef]
  32. Gebrehiwot, S.G.; Ellison, D.; Bewket, W.; Seleshi, Y.; Inogwabini, B.; Bishop, K. The Nile Basin waters and the West African rainforest: Rethinking the boundaries. Wiley Interdiscip. Rev. Water 2019, 6, e1317. [Google Scholar] [CrossRef]
  33. Yates, D.N.; Strzepek, K.M. Modeling the Nile Basin under climatic change. J. Hydrol. Eng. 1998, 3, 98–108. [Google Scholar] [CrossRef]
  34. Hersbach, H.; Bell, B.; Berrisford, P.; Biavati, G.; Horányi, A.; Sabater, J.M.; Nicolas, J.; Peubey, C.; Radu, R.; Rozum, I. ERA5 hourly data on single levels from 1940 to present. Copernicus Clim. Chang. Serv. Clim. 2023, 10. [Google Scholar] [CrossRef]
  35. Wu, X.; Bi, N.; Xu, J.; Nittrouer, J.A.; Yang, Z.; Saito, Y.; Wang, H. Stepwise morphological evolution of the active Yellow River (Huanghe) delta lobe (1976–2013): Dominant roles of riverine discharge and sediment grain size. Geomorphology 2017, 292, 115–127. [Google Scholar] [CrossRef]
  36. Wu, L.; Yuan, J.; Wu, Z.; Hu, L.; Zhang, J.; Sun, J. An Updated Analysis of Long-Term Sea Level Change in China Seas and Their Adjacent Ocean with T/P: Jason-1/2/3 from 1993 to 2022. J. Mar. Sci. Eng. 2024, 12, 1889. [Google Scholar] [CrossRef]
  37. El-Geziry, T.M.; El-Wakeel, Y.M. A decadal sea-level variability in Port-Said Harbour (Egypt). Egypt. J. Aquat. Res. 2023, 49, 33–39. [Google Scholar] [CrossRef]
  38. Khan, F.A.; Khan, T.M.A.; Ahmed, A.N.; Afan, H.A.; Sherif, M.; Sefelnasr, A.; El-Shafie, A. Complex extreme sea levels prediction analysis: Karachi coast case study. Entropy 2020, 22, 549. [Google Scholar] [CrossRef]
  39. Tonbol, K.; Shaltout, M. Tidal and non-tidal sea level off Port Said, Nile Delta, Egypt. JKAU Mar. Sci. 2013, 24, 69–83. [Google Scholar] [CrossRef]
  40. El-Sayed, M.K. Rising sea-level and subsidence of the Northern Nile delta: A case study. In Sea-Level Rise and Coastal Subsidence: Causes, Consequences, and Strategies; Springer: Berlin/Heidelberg, Germany, 1996; pp. 215–233. [Google Scholar]
  41. Abdrabo, M.A.; Hassaan, M.A. Economic valuation of sea level rise impacts on agricultural sector: Damietta Governorate, Egypt. J. Environ. Prot. 2014, 5, 52012. [Google Scholar] [CrossRef]
  42. Stanley, D.J. Nile delta: Extreme case of sediment entrapment on a delta plain and consequent coastal land loss. Mar. Geol. 1996, 129, 189–195. [Google Scholar] [CrossRef]
  43. Frihy, O.E.; Stanley, J.D. The Modern Nile Delta Continental Shelf, with an Evolving Record of Relict Deposits Displaced and Altered by Sediment Dynamics. Geographies 2023, 3, 416–445. [Google Scholar] [CrossRef]
  44. Ijaz, M.W.; Mahar, R.B.; Siyal, A.A.; Anjum, M.N. Geospatial analysis of creeks evolution in the Indus Delta, Pakistan using multi sensor satellite data. Estuar. Coast. Shelf Sci. 2018, 200, 324–334. [Google Scholar] [CrossRef]
  45. Zhang, J.; Wan, S.; Clift, P.D.; Huang, J.; Yu, Z.; Zhang, K.; Mei, X.; Liu, J.; Han, Z.; Nan, Q. History of Yellow River and Yangtze River delivering sediment to the Yellow Sea since 3.5 Ma: Tectonic or climate forcing? Quat. Sci. Rev. 2019, 216, 74–88. [Google Scholar] [CrossRef]
  46. Wu, X.; Xu, J.; Wu, H.; Bi, N.; Bian, C.; Li, P.; Wang, A.; Duan, H.; Wang, H. Synoptic variations of residual currents in the Huanghe (Yellow River)-derived distal mud patch off the Shandong Peninsula: Implications for long-term sediment transport. Mar. Geol. 2019, 417, 106014. [Google Scholar] [CrossRef]
  47. Zhang, X.-L.; Li, P.-Y. Regional natural disaster risk of coastal wetland in Yellow River Delta. Ziran Zaihai Xuebao/J. Nat. Disasters 2006, 15, 159–164. [Google Scholar]
  48. Gupta, H.; Kao, S.J.; Dai, M. The role of mega dams in reducing sediment fluxes: A case study of large Asian rivers. J. Hydrol. 2012, 464–465, 447–458. [Google Scholar] [CrossRef]
  49. Kalhoro, N.A.; He, Z.; Xu, D.; Faiz, M.; Yafei, L.V.; Sohoo, N.; Bhutto, A.H. Vulnerability of the indus river delta of the North Arabian Sea, Pakistan. Glob. Nest J. 2016, 18, 599–610. [Google Scholar]
  50. Shalash, S. Effects of sedimentation on the storage capacity of the High Aswan Dam reservoir. Hydrobiologia 1982, 91, 623–639. [Google Scholar] [CrossRef]
  51. Haq, B.U.; Milliman, J.D. Perilous Future for River Deltas. GSA Today 2023, 33, 4–12. [Google Scholar] [CrossRef]
  52. Khan, M.Z.; Akbar, G. In the Indus Delta it is No More the Mighty Indus. In River Conservation and Management; John Wiley and Sons: Hoboken, NJ, USA, 2012; pp. 69–78. [Google Scholar]
  53. Wang, J.; Dai, Z.; Fagherazzi, S.; Lou, Y.; Mei, X.; Ma, B. Large-scale sedimentary shift induced by a mega-dam in deltaic flats. Sedimentology 2024, 71, 1084–1112. [Google Scholar] [CrossRef]
  54. Kravtsova, V.I.; Mikhailov, V.N.; Efremova, N.A. Variations of the hydrological regime, morphological structure, and landscapes of the Indus River delta (Pakistan) under the effect of large-scale water management measures. Water Resour. 2009, 36, 365–379. [Google Scholar] [CrossRef]
  55. Fu, Y.; Bellerby, R.G.J.; Ji, H.; Chen, S.; Fan, Y.; Li, P. Impacts of Riverine Floods on Morphodynamics in the Yellow River Delta. Water 2023, 15, 1568. [Google Scholar] [CrossRef]
  56. Bianchi, T.S. Saving the Deltas. In Deltas and Humans; Oxford University Press: Oxford, UK, 2016; p. 112. [Google Scholar]
  57. Woodward, J.C.; MackLin, M.G.; Krom, M.D.; Williams, M.A.J. The River Nile: Evolution and environment. In Large Rivers Geomorphology Management; John Wiley and Sons: Hoboken, NJ, USA, 2022; pp. 388–432. [Google Scholar]
  58. Halim, Y.; Morcos, S.A.; Rizkalla, S.; El-Sayed, M.K. The Impact of the Nile and the Suez Canal on the Living Marine Resources of the Egyptian Mediterranean Waters (1958–1986); FAO: Rome, Italy, 1995. [Google Scholar]
  59. Wilson, M.D.; Pittma, E.D. Authigenic Clays in Sandstones: Recognition and Influence on Reservoir Properties and Paleoenvironmental Analysis. SEPM J. Sediment. Res. 1977, 47, 3–31. [Google Scholar]
  60. Bastian, L.; Mologni, C.; Vigier, N.; Bayon, G.; Lamb, H.; Bosch, D.; Kerros, M.E.; Colin, C.; Revel, M. Co-variations of climate and silicate weathering in the Nile Basin during the Late Pleistocene. Quat. Sci. Rev. 2021, 264, 107012. [Google Scholar] [CrossRef]
  61. Gelete, G.; Gokcekus, H.; Gichamo, T. Impact of climate change on the hydrology of Blue Nile basin, Ethiopia: A review. J. Water Clim. Chang. 2020, 11, 1539–1550. [Google Scholar] [CrossRef]
  62. Archer, D.R.; Fowler, H.J. Spatial and temporal variations in precipitation in the Upper Indus Basin, global teleconnections and hydrological implications. Hydrol. Earth Syst. Sci. 2004, 8, 47–61. [Google Scholar] [CrossRef]
  63. Jiang, D.; Fu, X.; Wang, K. Vegetation dynamics and their response to freshwater inflow and climate variables in the Yellow River Delta, China. Quat. Int. 2013, 304, 75–84. [Google Scholar] [CrossRef]
  64. Ma, Y.; Huang, H.Q.; Nanson, G.C.; Li, Y.; Yao, W. Channel adjustments in response to the operation of large dams: The upper reach of the lower Yellow River. Geomorphology 2012, 147, 35–48. [Google Scholar] [CrossRef]
  65. Zhou, X.; Polcher, J.; Dumas, P. Representing human water management in a land surface model using a supply/demand approach. Water Resour. Res. 2021, 57, e2020WR028133. [Google Scholar] [CrossRef]
  66. Zhao, T.; Richards, K.S.; Xu, H.; Meng, H. Interactions between dam-regulated river flow and riparian groundwater: A case study from the Yellow River, China. Hydrol. Process. 2012, 26, 1552–1560. [Google Scholar] [CrossRef]
  67. Syvitski, J.P.M.; Brakenridge, G.R. Causation and avoidance of catastrophic flooding along the Indus River, Pakistan. GsA today 2013, 23, 4–10. [Google Scholar] [CrossRef]
  68. Syvitski, J.P.M.; Vörösmarty, C.J.; Kettner, A.J.; Green, P. Impact of humans on the flux of terrestrial sediment to the global coastal ocean. Science 2005, 308, 376–380. [Google Scholar] [CrossRef]
  69. El Din, S.H.S. Effect of the Aswan High Dam on the Nile flood and on the estuarine and coastal circulation pattern along the Mediterranean Egyptian coast. Limnol. Oceanogr. 1977, 22, 194–207. [Google Scholar] [CrossRef]
  70. Elsanabary, M.H.; Ahmed, A.T. Impacts of Constructing the Grand Ethiopian Renaissance Dam on the Nile River. Handb. Environ. Chem. 2019, 79, 75–93. [Google Scholar]
  71. Abderrahmane, J.; Sghiouri, A.; Elhanchaoui, Y.; Boumeaza, T.; Saidi, J. The Role of Digital Coast Analysis Technology (DSAS) in Coastal Assessment—East Coast Case of the City of Mohammedia-Morocco. Int. J. Ocean Coast. Eng. 2024, 6, 2450001. [Google Scholar] [CrossRef]
  72. Kılar, H.; Kömüşcü, A.Ü. Temporal analysis of the coastal erosion and accretion on the shoreline of Bakırçay Delta of Türkiye by Digital Shoreline Analysis System (DSAS). Int. J. Environ. Geoinformatics 2024, 11, 47–57. [Google Scholar] [CrossRef]
  73. López, L.; Cellone, F.; Guardo, N.; Carol, E. Semi-automated shoreline extraction applied to estuarine coasts: A case study in the Río de la Plata estuary, Argentina. Estuar. Coast. Shelf Sci. 2025, 314, 109142. [Google Scholar] [CrossRef]
  74. Shen, Z.; Wang, C.; Chen, H.; Zhang, Z.; Wang, B.; Xia, Y.; Zhang, Q.; Wu, X.; Li, Q.; Peng, T. Spatiotemporal evolution of typical silt-muddy coastlines and tidal flats and their response to human activities: A case study of the Yancheng Coast, China. Ocean Coast. Manag. 2025, 269, 107851. [Google Scholar] [CrossRef]
  75. Mitri, G.; Nader, M.; Dagher, M.A.; Gebrael, K. Investigating the performance of sentinel-2A and Landsat 8 imagery in mapping shoreline changes. J. Coast. Conserv. 2020, 24, 40. [Google Scholar] [CrossRef]
  76. Negm, A.; Masria, A.; Iskander, M.; Saavedra, O.C. Towards a Sustainable Stability of Coastal Zone at Rosetta Promontory/Mouth, Egypt. Oceanography 2015, 3, 2. [Google Scholar] [CrossRef]
  77. Siyal, A.A.; Solangi, G.S.; Siyal, Z.U.A.; Siyal, P.; Babar, M.M.; Ansari, K. Shoreline change assessment of Indus delta using GIS-DSAS and satellite data. Reg. Stud. Mar. Sci. 2022, 53, 102405. [Google Scholar] [CrossRef]
  78. Han, S.; Rice, S.; Tan, G.; Wang, K.; Zheng, S. Geomorphic evolution of the Qingshuigou channel of the Yellow River Delta in response to changing water and sediment regimes and human interventions. Earth Surf. Process. Landforms 2020, 45, 2350–2364. [Google Scholar] [CrossRef]
  79. Wu, X.; Wang, H.; Bi, N.; Nittrouer, J.A.; Xu, J.; Cong, S.; Carlson, B.; Lu, T.; Li, Z. Evolution of a tide-dominated abandoned channel: A case of the abandoned Qingshuigou course, Yellow River. Mar. Geol. 2020, 422, 106116. [Google Scholar] [CrossRef]
  80. Rybczyk, J.M.; Day, J.W.; Yáñez-Arancibia, A.; Cowan, J.H. Global Climate Change and Estuarine Systems. In Estuarine Ecology; John Wiley and Sons: Hoboken, NJ, USA, 2012; pp. 497–518. [Google Scholar]
  81. McFeeters, S.K. The use of the Normalized Difference Water Index (NDWI) in the delineation of open water features. Int. J. Remote Sens. 1996, 17, 1425–1432. [Google Scholar] [CrossRef]
  82. U.S. Geological Survey. Digital Shoreline Analysis System (DSAS) User Guide. US Geological Survey, 2021. Available online: https://www.usgs.gov/media/images/dsas-user-guide-v51 (accessed on 20 August 2022).
  83. Thangaraj, K.; Karthikeyan, S. Assessment of shoreline positional uncertainty using remote sensing and GIS techniques: A case study from the east coast of India. J. Geogr. Inst. Jovan Cvijić SASA 2021, 71, 249–263. [Google Scholar] [CrossRef]
  84. Underwood, A.J. Experiments in Ecology: Their Logical Design and Interpretation Using Analysis of Variance; Cambridge University Press: Cambridge, UK, 1997. [Google Scholar]
  85. Frihy, O.E.; Debes, E.A.; El Sayed, W.R. Processes reshaping the Nile delta promontories of Egypt: Pre and post-protection. Geomorphology 2003, 53, 263–279. [Google Scholar] [CrossRef]
  86. Ghoneim, E.; Mashaly, J.; Gamble, D.; Halls, J.; AbuBakr, M. Nile Delta exhibited a spatial reversal in the rates of shoreline retreat on the Rosetta promontory comparing pre-and post-beach protection. Geomorphology 2015, 228, 1–14. [Google Scholar] [CrossRef]
  87. Pacini, N.; Donabaum, K.; de Villeneuve, P.H.; Konecny, R.; Pineschi, G.; Pochon, Y.; Salerno, F.; Schwaiger, K.; Tartari, G.; Wolfram, G. Water-quality management in a vulnerable large river: The Nile in Egypt. Int. J. River Basin Manag. 2013, 11, 205–219. [Google Scholar] [CrossRef]
  88. Elagib, N.A.; Basheer, M. Would Africa’s largest hydropower dam have profound environmental impacts? Environ. Sci. Pollut. Res. 2021, 28, 8936–8944. [Google Scholar] [CrossRef] [PubMed]
  89. Khaki, M.; Awange, J.; Forootan, E.; Kuhn, M. Understanding the association between climate variability and the Nile’s water level fluctuations and water storage changes during 1992–2016. Sci. Total Environ. 2018, 645, 1509–1521. [Google Scholar] [CrossRef]
  90. Chandio, N.H.; Anwar, M.M.; Mallah, Q.H. Impacts of climate change on coast line of Arabian Sea: A case study of Indus River Delta, Pakistan. Sindh Univ. Res. J.-SURJ (Sci. Ser.) 2018, 50, 147–152. [Google Scholar] [CrossRef]
  91. Thakur, K.V.S. Regulation of waters of rivers ravi, beas and sutlej. Water Eenrgy Int. 2004, 61, 65–77. [Google Scholar]
  92. Zafar, S.; Masood, W.; Haque, S.U.; Arslan, M.; Zia, I. Migration of Indigenous Coastal Communities due to Coastal Flooding in Indus Delta After Nanuk Tropical Cyclone. In Proceedings of the IGARSS 2019—2019 IEEE International Geoscience and Remote Sensing Symposium (IEEE 2019), Yokohama, Japan, 28 July–2 August 2019; pp. 4715–4718. [Google Scholar]
  93. Rendle, E.J.; Rive, N.A.; Zafar, A.A. COASTAL Resilience in the Indus Delta; Upscaling Nature-Based Solutions. Coast. Eng. Proc. 2020, 39. [Google Scholar] [CrossRef]
  94. Wang, H.; Wu, X.; Bi, N.; Li, S.; Yuan, P.; Wang, A.; Syvitski, J.P.M.; Saito, Y.; Yang, Z.; Liu, S.; et al. Impacts of the dam-orientated water-sediment regulation scheme on the lower reaches and delta of the Yellow River (Huanghe): A review. Glob. Planet. Change 2017, 157, 93–113. [Google Scholar] [CrossRef]
  95. Yue, S.; Zhang, X.; Xu, S.; Liu, M.; Qiao, Y.; Zhang, Y.; Liang, J.; Wang, A.; Zhou, Y. The super typhoon Lekima (2019) resulted in massive losses in large seagrass (Zostera japonica) meadows, soil organic carbon and nitrogen pools in the intertidal Yellow River Delta, China. Sci. Total Environ. 2021, 793, 148398. [Google Scholar] [CrossRef]
  96. Kong, D.; Miao, C.; Wu, J.; Borthwick, A.G.L.; Duan, Q.; Zhang, X. Environmental impact assessments of the Xiaolangdi Reservoir on the most hyperconcentrated laden river, Yellow River, China. Environ. Sci. Pollut. Res. 2017, 24, 4337–4351. [Google Scholar] [CrossRef]
  97. Kong, D.; Miao, C.; Borthwick, A.G.L.; Duan, Q.; Liu, H.; Sun, Q.; Ye, A.; Di, Z.; Gong, W. Evolution of the Yellow River Delta and its relationship with runoff and sediment load from 1983 to 2011. J. Hydrol. 2015, 520, 157–167. [Google Scholar] [CrossRef]
  98. Stanley, D.J.; Warne, A.G. Nile delta in its destruction phase. J. Coast. Res. 1998, 14, 794–825. [Google Scholar]
  99. Randazzo, G.; Stanley, D.J.; Di Geronimo, S.I.; Amore, C. Human-induced sedimentological changes in Manzala lagoon, Nile delta, Egypt. Environ. Geol. 1998, 36, 235–258. [Google Scholar] [CrossRef]
  100. Syvitski, J.P.M.; Kettner, A.J.; Overeem, I.; Giosan, L.; Brakenridge, G.R.; Hannon, M.; Bilham, R. Anthropocene metamorphosis of the Indus Delta and lower floodplain. Anthropocene 2013, 3, 24–35. [Google Scholar] [CrossRef]
  101. Kidwai, S.; Ahmed, W.; Tabrez, S.M.; Zhang, J.; Giosan, L.; Clift, P.; Inam, A. The Indus delta—Catchment, River, Coast, and People. In Coasts and Estuaries; Elsevier: Amsterdam, The Netherlands, 2019; pp. 213–232. [Google Scholar]
  102. Prerna, R.; Pandey, D.K.; Mahender, K. Longitudinal profiling and elevation-relief analysis of the Indus. Arab. J. Geosci. 2018, 11, 343. [Google Scholar] [CrossRef]
  103. Zhou, L.; Liu, J.; Saito, Y.; Zhang, Z.; Chu, H.; Hu, G. Coastal erosion as a major sediment supplier to continental shelves: Example from the abandoned Old Huanghe (Yellow River) delta. Cont. Shelf Res. 2014, 82, 43–59. [Google Scholar] [CrossRef]
  104. Zhang, Y.; Wang, K.; Song, J.; Liu, P.; Xia, C.; Risha, M.; Qiu, X.; Xu, Y.; Lv, M.; Gao, K. Geochemistry and Provenance of Loess on the Miaodao Islands, China. Atmosphere 2024, 15, 261. [Google Scholar] [CrossRef]
  105. Titus, J.G. Greenhouse effect, sea level rise and land use. Land Use Policy 1990, 7, 138–153. [Google Scholar] [CrossRef]
  106. Stephens, S.A.; Paulik, R.; Reeve, G.; Wadhwa, S.; Popovich, B.; Shand, T.; Haughey, R. Future changes in built environment risk to coastal flooding, permanent inundation and coastal erosion hazards. J. Mar. Sci. Eng. 2021, 9, 1011. [Google Scholar] [CrossRef]
  107. Hernández-Delgado, E.A. Coastal restoration challenges and strategies for small island developing states in the face of sea level rise and climate change. Coasts 2024, 4, 235–286. [Google Scholar] [CrossRef]
  108. Masria, A.; Iskander, M.; Negm, A. Coastal protection measures, case study (Mediterranean zone, Egypt). J. Coast. Conserv. 2015, 19, 281–294. [Google Scholar] [CrossRef]
  109. Hassan, R.M. Coastal Protection and Development of Alexandria. WIT Trans. Ecol. Environ. 2002, 58, 435–444. [Google Scholar]
  110. Esmail, M.; Mahmod, W.E.; Fath, H. Assessment and prediction of shoreline change using multi-temporal satellite images and statistics: Case study of Damietta coast, Egypt. Appl. Ocean Res. 2019, 82, 274–282. [Google Scholar] [CrossRef]
  111. Omran, E.-S.E.; Negm, A. Environmental Impacts of the GERD Project on Egypt’s Aswan High Dam Lake and Mitigation and Adaptation Options. In Grand Ethiopian Renaissance Dam Versus Aswan High Dam: A View from Egypt; Springer: Berlin/Heidelberg, Germany, 2019; pp. 175–196. [Google Scholar]
  112. Ali, Y.S.A. The Impact of Soil Erosion in the Upper Blue Nile on Downstream Reservoir Sedimentation; IHE Delft Institute for Water Education: Delft, The Netherlands, 2014. [Google Scholar]
  113. Yasar, A.; Fawad, A.; Fateha, A.; Amna, I.; Zainab, R. River Ravi potentials, pollution and solutions: An overview. World Environ. 2010, 39, 39–40. [Google Scholar]
  114. Inam, A.; Clift, P.D.; Giosan, L.; Tabrez, A.R.; Tahir, M.; Rabbani, M.M.; Danish, M. The Geographic, Geological and Oceanographic Setting of the Indus River. In Large Rivers: Geomorphology and Management; John Wiley and Sons: Hoboken, NJ, USA, 2007; pp. 333–346. [Google Scholar]
  115. Sarker, M.A. Cyclone hazards in the Arabian sea—A numerical modelling case study of Cyclone Nilofar. Water Environ. J. 2017, 31, 284–295. [Google Scholar] [CrossRef]
  116. Mukhtar, I.; Hannan, A. Constrains on mangrove forests and conservation projects in Pakistan. J. Coast. Conserv. 2012, 16, 51–62. [Google Scholar] [CrossRef]
  117. Peng, J.; Chen, S.; Dong, P. Temporal variation of sediment load in the Yellow River basin, China, and its impacts on the lower reaches and the river delta. Catena 2010, 83, 135–147. [Google Scholar] [CrossRef]
  118. Cui, B.; Yang, Q.; Yang, Z.; Zhang, K. Evaluating the ecological performance of wetland restoration in the Yellow River Delta, China. Ecol. Eng. 2009, 35, 1090–1103. [Google Scholar] [CrossRef]
  119. Zhou, R.; Li, Y.; Wu, J.; Gao, M.; Wu, X.; Bi, X. Need to link river management with estuarine wetland conservation: A case study in the Yellow River Delta, China. Ocean Coast. Manag. 2017, 146, 43–49. [Google Scholar] [CrossRef]
  120. Li, J.; Mo, D.; Li, R.; Hou, Y.; Liu, Q. Establishing a Risk Assessment Framework for Marine Assets and Assessing Typhoon Lekima Storm Surge for the Laizhou Bay Coastal Area of the Bohai Sea, China. J. Mar. Sci. Eng. 2022, 10, 298. [Google Scholar] [CrossRef]
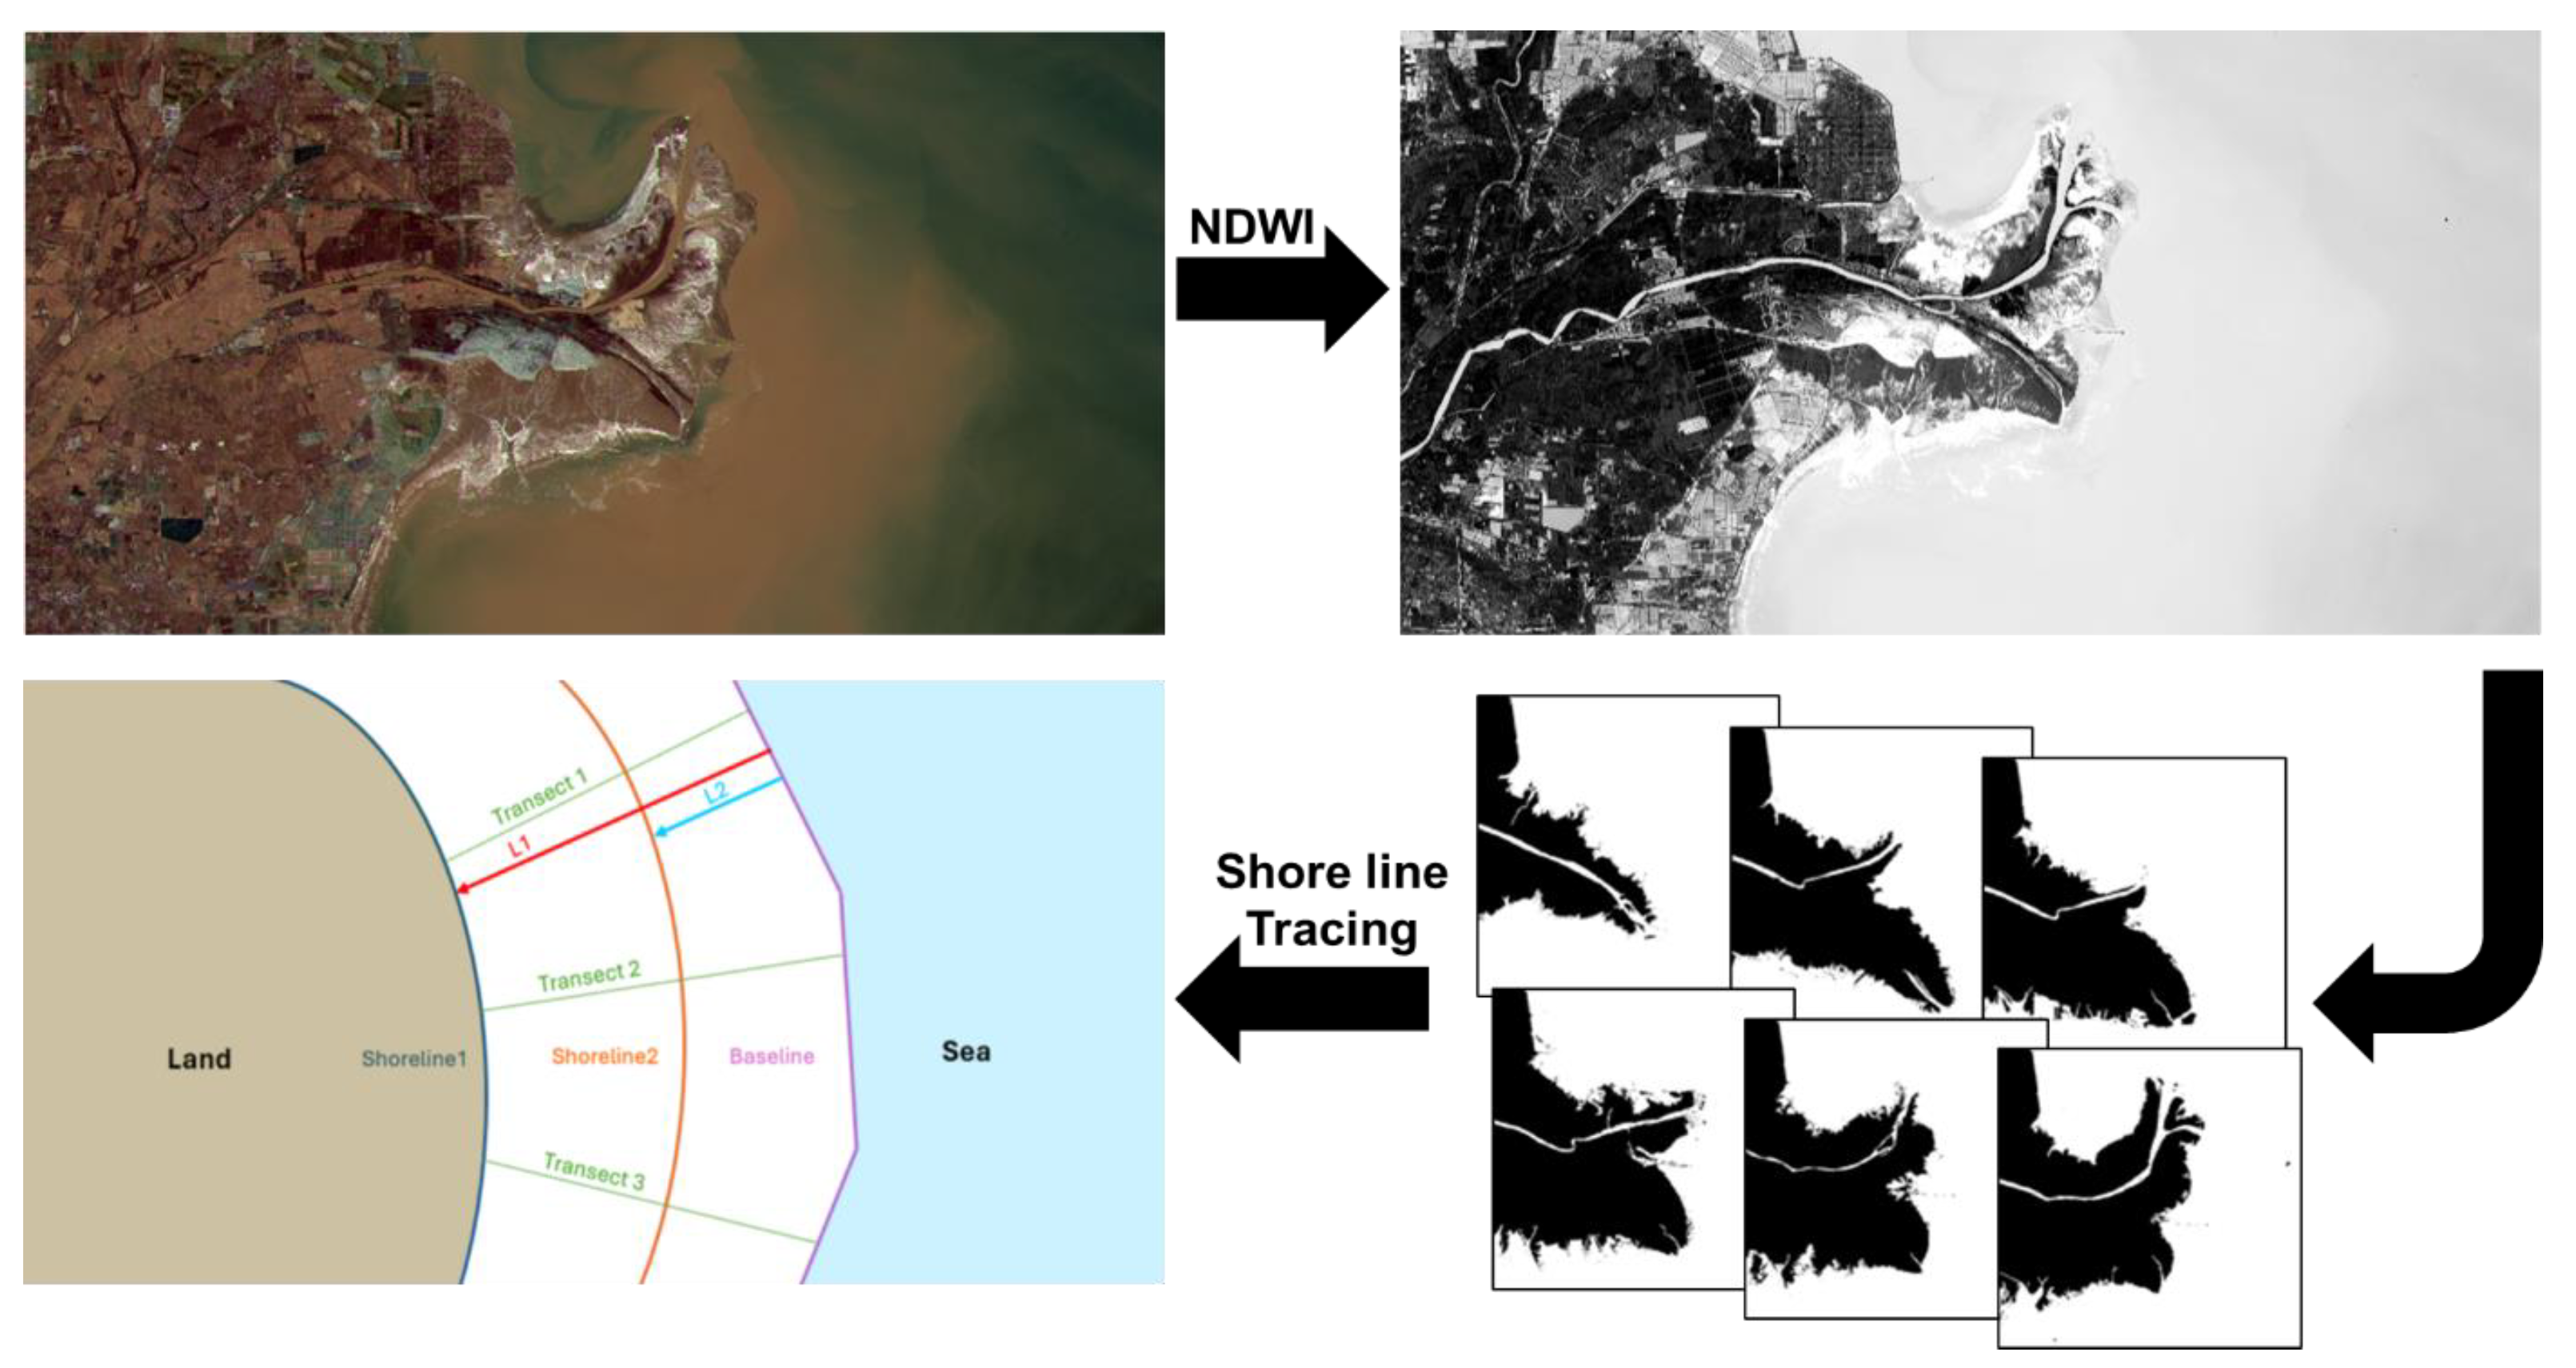
Figure 3. Shoreline analysis workflow example in the Yellow River Delta. The top left shows a raw Landsat image highlighting the sediment-rich coastal zone. The top right displays the NDWI-processed grayscale image used for water boundary detection. The bottom left illustrates the DSAS method with a schematic showing transects cast perpendicular to a baseline, where distances L1 and L2 measure shoreline movement, brown area is land, and blue area is sea. The bottom right shows binary NDWI images from multiple years used to extract historical shorelines. All images were obtained from the USGS Global Visualization Viewer (GloVis) platform (https://glovis.usgs.gov/app) (accessed on 30 November 2022). Landsat data provided by the USGS is in the public domain.
Earth 06 00120 g003
Figure 4. Cumulative area changes along the Nile Delta Shoreline from 1972 to 2022 from West (W) to East (E). The plot illustrates the overall accretion and erosion trends across transects over the 50-year period, with blue indicating accretion and red indicating erosion. Colored vertical bands mark the study subareas and the legend above the plot shows which color corresponds to each segment and its transect range.
Earth 06 00120 g004
Figure 5. Cumulative area changes along the Indus Delta Shoreline from 1972 to 2022 from Northwest (NW) to Southeast (SE). The plot illustrates the overall accretion and erosion trends across transects over the 50-year period, with blue indicating accretion and red indicating erosion. Colored vertical bands mark the study subareas and the legend above the plot shows which color corresponds to each segment and its transect range.
Earth 06 00120 g005
Figure 6. Cumulative area changes along the Yellow Delta Shoreline from 1973 to 2022 from Northwest (NW) to Southeast (SE). The plot illustrates the overall accretion and erosion trends across transects over the 49-year period, with blue indicating accretion and red indicating erosion. Colored vertical bands mark the study subareas and the legend above the plot shows which color corresponds to each segment and its transect range.
Earth 06 00120 g006
Figure 7. Cumulative Area Change across the Nile (A), Indus (B), and Yellow (C) River Delta segments from 1972 to 2022. These panels show the cumulative area change for individual segments and overall trends in each delta, with key anthropogenic and natural events annotated on the timelines. Events are grouped to show concurrent timing and the labels are contextual and do not imply attribution to one single event. Discrete observations are shown as dotted lines, and the continuous curves are smoothed as dotted lines for presentation and do not imply measurements between sampled points. (A) The Nile Delta segments include Rosetta, Damietta, Burullus Lake, East Alexandria, West Damietta, and West Port Said, showing varying patterns of erosion and accretion across the 50-year period. Key events are referenced in [85,86,87,88,89]. (B) The Indus Delta includes Zones 1 to 4, which exhibit strong temporal variability, particularly after 1992. Annotated events highlight the influence of dams, restoration projects, and cyclones. Key events are referenced in [67,90,91,92,93]. (C) The Yellow River Delta includes Bohai Wan, New Mouth, Old Mouth, and Laizhou Bay, with notable phases of expansion followed by contraction after 1996. Annotated changes reflect the impact of water diversion projects and sediment regulation policies. Key events are referenced in [94,95,96,97].
Earth 06 00120 g007
Table 1. Area change, EPR trend, and dominant process for Nile Delta segments (1972–2022).
SegmentTotal Area Change (km2)EPR Trend (m/year)Dominated Process
East Alexandria−0.24−1.17Erosion
Rosetta−24.26+6.37Erosion
Burullus Lake−9.83+0.37Erosion
West Damietta−3.24+0.70Erosion
Damietta+10.60+0.12Accretion
West Port Said−0.33−0.16Erosion
Table 2. Area change, EPR trend, and dominant process for Indus Delta segments (1972–2022).
SegmentTotal Area Change (km2)EPR Trend (m/year)Dominated Process
Zone 1−38.79−4.38Erosion
Zone 2−53.71−3.00Erosion
Zone 3−64.68−6.01Erosion
Zone 4−45.16−4.58Erosion
Table 3. Area change, EPR trend, and dominant process for Yellow Delta segments (1973–2022).
SegmentTotal Area Change (km2)EPR Trend (m/year)Dominated Process
Bohai Wan+111.03−10.34Accretion
New Mouth+274.97−40.09Accretion
Old Mouth+331.05−129.49Accretion
Laizhou Bay+392.49−34.56Accretion
Disclaimer/Publisher’s Note: The statements, opinions and data contained in all publications are solely those of the individual author(s) and contributor(s) and not of MDPI and/or the editor(s). MDPI and/or the editor(s) disclaim responsibility for any injury to people or property resulting from any ideas, methods, instructions or products referred to in the content.