Abstract
The water–energy–food (WEF) nexus provides a critical framework for addressing the interconnected challenges of resource scarcity and sustainability in the face of global population growth and climate variability. This study investigates the application of a WEF nexus approach within the operation and management of a hydroponic greenhouse unit in Central Greece, with the aim of enhancing the unit’s energy autonomy and resource sufficiency. Hydroponics, a soilless cultivation method, optimizes water and land use but relies heavily on energy inputs, necessitating integrated solutions. Through the case study approach, we analyze the unit’s resource dynamics per hectare of water (68 MWh equivalent from desalination), energy (125 MWh or 321 GJ/ha plus 74.5 GJ/ha for fertigation), and food production (~295 tons, which contains 50,250,000 kcal and corresponds to 210 GJ) and propose technical solutions: photovoltaic panels as greenhouse coverings and water rain harvesting regulated with a small reservoir. These innovations could reduce external energy dependency by 90–95% and water use by 25–35%. Energy efficiency is quantified using the energy ratio (ER) and net energy gain (NEG), while resilience is assessed via system reliability under resource variability. Conclusively, this study illustrates how a nexus-based approach can effectively upgrade systems into climate-resilient, resource-efficient models as the abundance or scarcity of one source affects the availability or limitation of the others. Overall, the approach presented in this study could also be used to safeguard the supply chains in megacities.
1. Introduction
The global challenges of food security, water scarcity, and energy demand necessitate integrated resource management strategies. The water–energy–food (WEF) nexus framework recognizes the interdependencies among these resources, advocating for cross-sectoral solutions to optimize use while ensuring long-term sustainability [1,2,3]. Hydroponics, a soilless cultivation method, optimizes water and land use but relies heavily on energy inputs, making it an ideal candidate for WEF nexus analysis [4].
The shaping of modern civilization into cities, i.e., large clusters [5], which could be considered as “food deserts” [6], creates vulnerabilities and dependencies on complex supply chains, management networks, and the economy [7,8]. In contrast to that, a resilient social structure could rely on self-sufficiency, which is generally absent due to the lack of food production within cities. Larger land areas are needed to supply cities with resources [9,10], but the WEF nexus remains unstable due to stochastic dynamics of resources [11] and factors like biodiversity changes [12].
Finding appropriately adapted solutions for food production in controlled environments, independent of climate variations [13,14,15,16,17,18] and other environmental parameters [19], is a critical issue that ensures social cohesion by establishing a resource production framework that is not dependent on geopolitical issues and disruptions of supply chains [20,21,22].
According to the Food and Agriculture Organization (FAO), understanding the complex interactions of WEF is essential for achieving the United Nations’ sustainable development goals [23]:
- Water: Water is the first element of the nexus, critical for both food production and energy generation. Globally, freshwater availability is limited, with less than 1% of the planet’s water resources readily accessible [24]. Agriculture consumes approximately 70% of this, while energy production and industrial uses account for 20%, leaving 10% for domestic purposes [25]. Challenges include rising demand, climate-induced variability, water quality degradation, and competition among sectors;
- Energy: Energy drives water management and food production processes. Energy-intensive activities like water pumping and greenhouse climate control are vital in hydroponics. The International Energy Agency (IEA) highlights the arising issues in global energy demand. Renewable energy sources, while promising, often require water for production (e.g., biofuel crops), complicating nexus dynamics [26,27];
- Food: Food production is the largest consumer of freshwater and a significant energy user across its value chain, and as the global population rises, food security is at risk [28,29]. Constraints include limited arable land, climate impacts, and resource-intensive practices, necessitating innovative systems like hydroponics.
Agriculture is sensitive to environmental conditions (floods, droughts, heatwaves, and frost) and a mass failure in production could cause severe social issues, not only economic, but also vital. Hydroponics offers controlled environments that reduce water use by up to 90% compared to CA and eliminate soil dependency, enabling cultivation in non-arable areas such as cities [30,31], deserts [32], and even in space [33].
Hydroponic systems advance sustainable food production by maximizing yield per unit with techniques like the Nutrient Film Technique (NFT) [34], Deep Water Technique (DWT), and Deep Flow Technique (DFT) [35], exemplifying resource efficiency [36]. These systems enhance climate resilience by mitigating exposure to environmental parameters, ensuring consistent production in controlled greenhouse environments, further optimized by smart technologies like IoT sensors [37]. Additionally, hydroponics contributes to emissions reduction and integrates renewable energy sources, while CO2 enrichment in greenhouses [38,39], sourced from industrial byproducts, boosts photosynthesis, aligning with sustainable development goals [40].
Hydroponics, while water-efficient, relies heavily on energy for climate control and nutrient delivery, as noted by Barbosa et al. [41]. To address this, renewable energy integration has been proposed. Bathaei et al. [42] explored the potential of solar photovoltaic (PV) systems in agriculture, while IRENA [43] emphasized the role of renewables in food production.
The WEF nexus has been extensively studied as a framework to address the interconnected challenges of resource management. Bazilian et al. [44] explored the energy–water nexus, highlighting the energy intensity of water management processes, such as desalination and pumping, which are critical in hydroponic systems.
Recent research has applied the WEF nexus to agricultural systems, including greenhouses. Qiong et al. [45] analyzed energy–water trade-offs in controlled-environment agriculture, highlighting the potential of renewable energy integration. Trépanier et al. [46] explored thermal energy management in greenhouses, underscoring the need for energy-efficient technologies. In this context, significant efforts are being made by Abedi et al. and Tan et al. [47,48] to optimize resource management in controlled environments, aiming for maximum efficiency, while innovative approaches are proposed to enhance resource utilization.
The quality of water used in hydroponics is critical to its success, as it directly affects nutrient delivery, plant health, and the quality of the production:
- Rainwater harvesting offers a sustainable water source for hydroponics but requires careful quality management. Campisano et al. [49] noted that rainwater is generally low in dissolved solids, making it suitable for hydroponics, but it may contain atmospheric pollutants, particularly in urban areas, necessitating filtration. Sucozhañay et al. [50] highlighted that rainwater’s quality must be tested before nutrient addition to ensure compatibility with hydroponic nutrient solutions [51];
- Desalinated water, often produced via reverse osmosis, provides a clean and consistent water source for hydroponics. Abedi et al. studied the optimization of the desalination process for water production [52]. Kumar et al. [53] noted that desalination processes must be optimized to remove all salts and potential pathogens to prevent adverse effects on hydroponic crops. Antolinos et al. [54] emphasized that desalinated water may slightly affect the quality of products (tomatoes). However, Antolinos et al. noted that this slight difference would not compromise consumer acceptance, but its pH may require stabilization.
In conclusion, both water sources (rainwater harvesting and desalination), when properly managed, support the water quality standards required for hydroponics, enhancing system efficiency within the WEF nexus, even if additional quality measurements and water quality adjustments may be required.
This study evaluates a hydroponic greenhouse unit (HGU) in Central Greece, focusing on resilience within the WEF nexus, and proposes technical innovations to enhance self-sufficiency [55] using indicators for energy efficiency (energy ratio, net energy gain) and resilience (system reliability under resource variability for HGU). It reveals that integrating PV and rainwater harvesting into an HGU in Central Greece will significantly enhance its resilience and self-sufficiency within the WEF nexus by reducing external energy dependency on the grid to 90% and water use by 25–35% while improving food production efficiency.
This paper is structured as follows: Section 2 outlines the methodology, including data collection, evaluation indicators, mathematical models, and optimization methods. Section 3 presents conventional agriculture (CA) compared to the HGU of the case study, detailing the dynamics of resources. Section 4 discusses the optimization of the resources and resilience outcomes, comparing hydroponics with CA. Section 5 presents the conclusions with practical recommendations and future research directions.
2. Methodology
This study analyzed the WEF nexus by comparing CA with an HGU used for lettuce production in Central Greece. To ensure scalability, all measurements were standardized on a per-hectare basis. A systematic, multi-step approach was employed to evaluate resource dynamics and identify opportunities for optimization.
Figure 1 illustrates the research gaps addressed in this study by comparing three scenarios within the WEF nexus framework. These scenarios highlight the transition from CA to the current HGU and its optimized version with renewable energy and water harvesting. Each step represents a progression in addressing key gaps: Figure 1a illustrates CA, where the water needs are covered from irrigation system, and the energy inputs are oil for machinery and fertilizers. Figure 1b illustrates HGU; water needs (circulation, cooling systems) are covered with energy inputs from the grid, and additional energy inputs are estimated for fertigation. Figure 1c illustrates HGU optimization with water harvesting and PV panels.
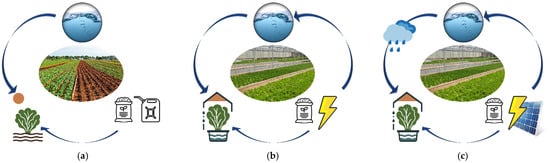
Figure 1.
Research gaps addressed in three scenarios within the WEF nexus: (a) CA with water needs met through irrigation and energy inputs from oil for machinery and fertilizers; (b) HGU with water needs (circulation, cooling) met through grid energy and additional energy for fertigation; (c) optimized HGU with rainwater harvesting and PV panels to enhance self-sufficiency and resilience.
2.1. Data Collection and the Interactions of WEF
- Data Collection (1 January–31 December 2024, 365 days): Daily operational data from the HGU were gathered throughout 2024, encompassing water consumption (e.g., nutrient solution volumes), energy use (e.g., lighting, climate control), and food production outputs (e.g., crop yields in tons) [56]. These metrics provided a baseline for resource flows of the HGU within the WEF nexus;
- Environmental Data Acquisition: Local climate data, including air temperature and precipitation, were sourced from a nearby meteorological station at a daily resolution. These data contextualized the HGU’s environmental interactions;
- Energy production data from a local PV park were collected;
- The operation of the WEF nexus in the current state of the HGU was described.
2.2. Optimization of WEF
- Water Demand Analysis: Daily precipitation data were compared with the HGU’s water consumption. Assuming a rainwater harvesting surface sufficient to meet baseline water needs, we accounted for rainfall’s intermittent nature. To regulate water flow in HGU, a reservoir simulation model determined the function of the optimal storage capacity to partially offset HGU’s demands, improving the duration of the availability of water and enhancing self-sufficiency (Figure 1c).In order to describe the function of the reservoir, we use a model, considering that the water consumption is dependent on the availability of the storage [57]. The process is described in Equations (1) and (2):where T is time, is the stock in the reservoir, is the inflow, is the withdrawal considered proportional to the stock, a is a constant determining the release, and K is the storage capacity;
- Energy Supply Evaluation: HGU is a consumer of energy for maintaining multiple functions (water circulation, cooling, etc.). Energy production data from a local PV park were compared with the HGU’s energy requirements, and we ran scenarios of covering a part of HGU with PV, also estimating the needed batteries for self-sufficiency (Figure 1c);
- Given the non-renewable nature of groundwater—attributed to overextraction surpassing natural recharge rates—the water supply was instead modeled as being sourced from desalination, aligning with sustainable practices in water-scarce settings. To meet these combined needs—operational energy plus desalination—a revised PV installation capacity was calculated, ensuring sufficient renewable energy generation to offset both baseline and incremental loads (Figure 1c).
2.3. Evaluation of WEF, Standardization, and Indexes
- Energy-Based Standardization: All resource inputs and outputs—energy (electricity, heating), water, and food—were expressed in energy units (MJ) for consistent analysis within the WEF nexus framework. Food production was converted into energy units (kcal and MJ) to quantify nutritional output;
- Evaluation Indicators: The evaluation of collected data focused on comparing energy performance indexes (net energy gain, energy ratio) for HGU with and without the integration of PV panels.Energy ratio (ER) is the energy we gain from the produced cultivation to the input energy that is provided to the produced cultivation. It is calculated by Equation (3):Net energy gain (NEG) (in MJ/ha) is the energy we gain from the produced cultivation minus the energy input. It is calculated by Equation (4):
2.4. Evaluation of the Resilience of HGU
To achieve self-sufficiency, the HGU must minimize external resource dependency. The following solutions address water efficiency, energy autonomy, and food productivity within the WEF nexus framework.
Resilience (R) is assessed as the percentage of days the system meets water and energy needs without external inputs.
It is calculated by Equation (5):
where Dmet is days with sufficient resources, and Dtotal is total days of the studied period (one year, 365 days), which is calculated for all of the different scenarios.
3. Case Study: Agriculture in Central Greece
3.1. Conventional Agriculture Practice in Central Greece
In CA, the land is plowed and cultivated, the plants are sown and irrigated, and production is awaited [58]. However, this production is dependent on environmental conditions, happens once to a maximum of two times annually, and it is not guaranteed. In hydroponics, plants are grown in water enriched with nutrients and nitrogen-based fertilizers within a controlled environment (greenhouses) that is independent of external environmental factors, thus ensuring consistent agricultural production. In CA practices [41], the area is planted with ~110,000–130,000 plants/ha. The needs per ha for each cultivation period in CA are as follows: irrigation: 3000–5000 m3/ha; energy: 50–100 L oil equal to 19–38 GJ (1 L equal to 38 MJ); and fertilizers (NH3) 200–300 kg/ha equivalent to 12–21 GJ/ha of energy.
3.2. Hydroponic Greenhouse Agricultural Practice in Central Greece
Compared to CA (Figure 2a), hydroponics (Figure 2b) enables year-round production in controlled environments. Figure 2a shows weeds that hinder growth surrounding the lettuce in CA. Weeds are typically managed with pesticides that prevent their growth, but these chemicals often compromise the quality of the products. In hydroponics (Figure 2b), where the environment is fully controlled and the plant does not meet soil, such issues are nonexistent, and the use of pesticides is almost eliminated.
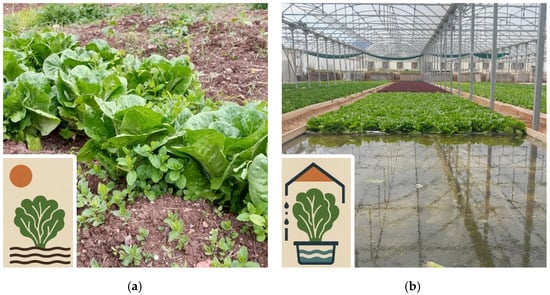
Figure 2.
(a) Conventional agriculture; (b) hydroponic greenhouse farming.
The Markatos HGU in Oinofyta (total area of the unit is 1.4 ha) (Figure 3), Central Greece, has operated since the late 1990s in a semi-arid region with an annual precipitation of 450–500 mm and high summer temperatures, posing challenges for water and energy management. Its proximity to the Asopos River and a natural gas pipeline provides resource access, but groundwater exploitation necessitates sustainable water sourcing strategies, such as rainwater harvesting.
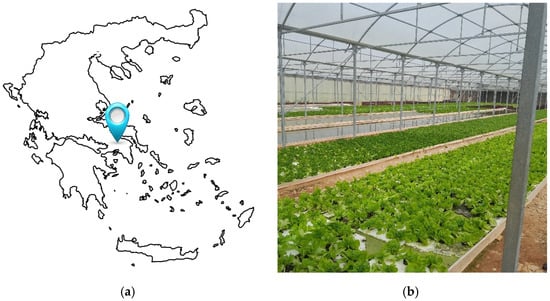
Figure 3.
(a) Greece; landmark: the location of the case study; (b) the interior of the greenhouse used for the case study.
- Water Management: The HGU consumes approximately 13,725 m3 (9804 m3/ha) of water annually for fertigation and 5560 m3 (3970 m3/ha) for cooling panels;
- Energy Consumption: The operational energy needs are 125,000 kWh (89,300 kWh/ha or 321,480 MJ/ha), driven by lighting, climate control, water pumping from the underground aquifer, and water circulation. Current reliance on grid electricity highlights the need for renewable integration;
- Fertilizers as Energy: The production of fertilizers is an energy-intensive process; therefore, Kirkmalis et al. [59] argued that fertilizers could be used as energy storage. Fertilizers could be considered as an additional energy source and, according to their technical characteristics of production, are estimated as equivalent to 74,531 (53,235 MJ/ha) of energy;
- Food Production: The facility produces lettuces, a high-yield crop, with minimal land use, achieving a productivity rate of approximately 300 tons/ha/year. The land use of the production is cumulatively ~1,200,000 plants/ha, with production occurring all year round.
The consumption of water (13,725 m3/ha) is for two main functions:
- Water for the hydroponic tanks and the fertigation of plants (9805 m3/ha or 71% of the total water consumption);
- Water for the cooling panels (3970 m3/ha or 29% of the total water consumption).
Figure 4 illustrates water and fertilizer inputs with air temperature for the case study area in 2024. The upper section of the diagram presents the annual temperature profile, highlighting seasonal variations. The lower section depicts the water consumption profiles for the hydroponic tanks and cooling systems. Notably, cooling water demand correlates with days of elevated temperatures, reflecting increased evaporative cooling needs. Additionally, the diagram captures fertilizer consumption (expressed in MJ), which exhibits a clear correlation with water use in the hydroponic tanks, underscoring the interdependencies within the WEF nexus.
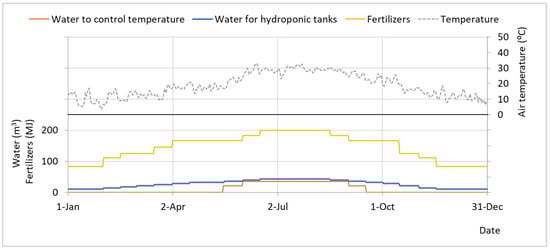
Figure 4.
Top: Air temperature during 2024. Bottom: The consumption of water and fertilizers (daily step).
The hydroponic farm growing lettuce typically consumes a substantial amount of energy, depending on the type of hydroponic system; whether it is indoor, in a greenhouse, or open air; and how much automation, lighting, and climate control are involved. The energy needs of the case study’s hydroponic cultivation are covered by the grid (89.3 MWh/ha or 321 GJ/ha), and the profile of energy needs is depicted in Figure 5.
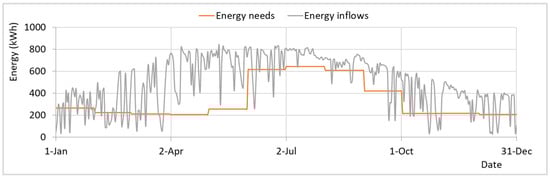
Figure 5.
The profiles of energy production by PVs (0.1 ha) (grey line) and energy needs by hydroponic cultivation (1 ha) (orange line) (daily step).
In an effort to achieve self-sufficiency, we assume the installation of flexible PV panels by replacing nylon coverings, generating electricity while allowing light penetration for photosynthesis. According to the data from an existing PV park in the area [60], covering 10% of a 1-hectare greenhouse roof with semi-transparent PVs with a nominal power of ~150 kWp produces 183 MWh annually, meeting the HGU’s energy needs. Even if the profile of the production by PV panels synchronizes with daily needs (as the consumption happens in daytime), it is still not adjusted to the consumption profile, and demand is not met for 40 days (Figure 5, grey line inflows by PV is below the orange line—needs for 40 days). Equation (5) indicates that R is equal to 90 with PV installation.
The production of food depends on the expected values of the market; thus, the expected production varies. The typical product is a lettuce weighing 0.25 kg/piece, which contains 42 kcal or 0.18 MJ of energy [61].
Figure 6 illustrates the progression of crop growth and yield over time, alongside the corresponding production expressed in energy units (kcal). This visualization highlights the energy embedded in food outputs, reflecting the HGU’s productivity within the WEF nexus framework.
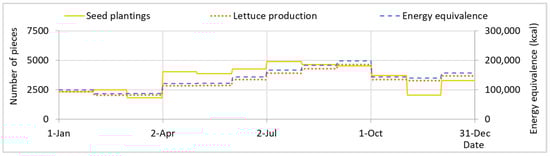
Figure 6.
The number of seeds used and of lettuces produced by the hydroponic farm, and the equivalence to energy (daily step).
4. Results and Discussion
4.1. Water Use: Consumption Patterns and Optimization Strategies
The precipitation in the area is 450–500 mm annually [62] (Figure 7). To enhance water resilience, for an HGU with an area of 1 ha, we need more than 3 ha to harvest water from rain (about 13,630 m3) to cover the water needs. However, without a balancing reservoir for water flow regulation, only the 880 m3 could be used, and according to Equation (5), R is estimated to be 13%. Modeling with Equations (1) and (2), a balancing reservoir of 1000 m3 is estimated for water flow, and according to Equation (5), R is increased to 43% (Figure 7, bottom, yellow line). Considering that the water harvesting area is the same area as HGU (1 ha), without a reservoir, R is estimated to be 9.5%, and with a reservoir of 1000 m3, R is estimated to be 28% (Figure 7, bottom, blue line).
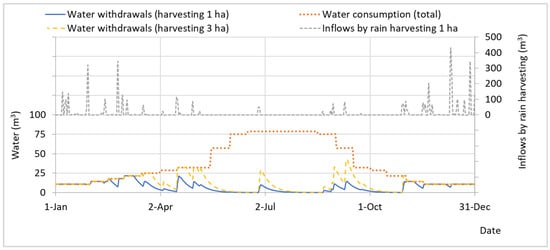
Figure 7.
Top: Water inflows from rainwater harvesting over 1 ha. Bottom: Total water consumption (orange line) and water withdrawals are shown for 3 hectares (yellow line) and 1 hectare (blue line) on a daily time step regulated using a 1000 m3 reservoir.
Since the water demand profile is not correlated with the availability of water resources (i.e., rainfall), achieving 100% coverage of needs leads to disproportionately large and evidently non-feasible infrastructures.
Figure 8 correlates the total energy requirements of the HGU, disaggregated into operational needs (e.g., lighting, climate control, water circulation) and fertilizer inputs. Additionally, it presents the production output standardized in energy units (MJ), enabling a direct comparison between energy inputs and outputs.
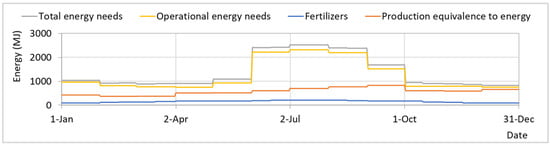
Figure 8.
Total energy needs (operational and fertilizers), operational energy needs, fertilizers, and the production equivalence to energy (daily step).
Figure 9 quantifies the total energy requirements of the HGU of one hectare under a scenario where 0.1 hectares of PV systems without batteries are installed. Energy inputs are limited to fertilizer production and grid electricity, with the latter supplementing demand when PV generation is insufficient. Additionally, it presents the production output standardized in energy units (MJ) and correlated with Figure 8; this visualization highlights the contribution of renewables to operational sustainability.
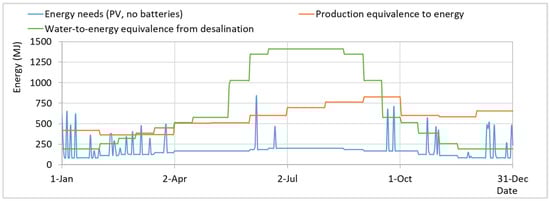
Figure 9.
Energy needs from the fertilizers and grid (after the installation of 0.1 ha PV without batteries); production in energy units and water as energy for desalination (daily step).
Given that groundwater is considered a non-renewable resource due to overexploitation exceeding natural recharge rates [63], an alternative water sourcing strategy was assumed. In Figure 9, water supply was modeled as derived from desalination (an imaginary scenario as the case study area is far from the sea) to reflect sustainable practices in water-scarce contexts. Hence, water consumption is expressed as the equivalent energy required for seawater desalination, estimated at 3–5 kWh/m3 [64].
To meet the combined needs—operational energy plus desalination—a revised PV installation capacity is calculated, ensuring sufficient renewable energy generation to offset both baseline and incremental loads. The analysis shows that with 0.1 ha PVs, R will be equal to 72 (Figure 10a), and with 0.2 ha PVs, R will be equal to 97 (Figure 10b). An important note is that the profile of the production of energy by PV corresponds to the profile of the operational needs.
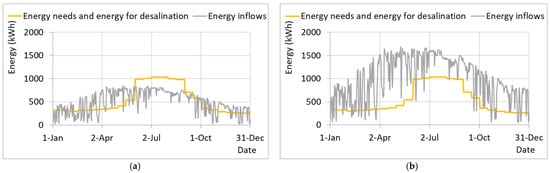
Figure 10.
The cumulative energy needs (operational and for desalinated water for 365 days) compared to the following: (a) 0.1 ha PVs, R equal to 72; (b) 0.2 ha PVs, R equal to 97 (daily step).
4.2. Energy Optimization: Addressing Needs, Enhancing Self-Sufficiency, and Improving Performance Metrics
In order to achieve self-sufficiency, after the installation of PV, we install a storage system of energy for regulating the energy flows. With a 100 kWh battery, the needs are not met for about 8 days (Equation (5) indicates that R is equal to 97), and to be a totally reliable system (Equation (5) indicates that R must be equal to 100), a battery of 200 kWh would be needed. Without batteries, the energy not used will be 183 MWh (production)–89.3 MWh/ha (consumption), equal to 93.7 MWh, and for the regulation of the consumption in a battery of 100 kWh and 200 kWh, 2385 kWh and 2948 kWh should be used, respectively (Figure 11).
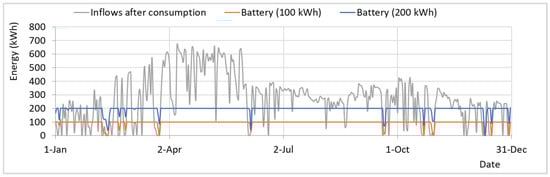
Figure 11.
The unused energy by PVs and the use of a battery with energy storage at 100 kWh (daily step).
The energy indices used for this study are energy ratio and net energy gain [65,66,67]. To estimate these indices in the present operation compared with the supported operation by 0.1 ha of PV, we convert the energy input to MJ and the energy output also to MJ (Equations (3) and (4)). As energy needs and production vary, the indices will also vary (Figure 12).
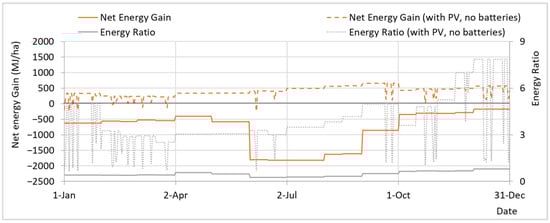
Figure 12.
Energy indices: energy ratio and net energy gain (daily step).
The diagrams in Figure 12 reveal a seasonal variation in energy indices, with notably poor performance during summer months and improved outcomes in winter. It also illustrates that the net energy gain (NEG) increased from a daily average of −800 MJ/ha to 400 MJ/ha, while the energy ratio (ER) improved from an average of 0.5 to 3.9, underscoring the transformative impact of renewable energy within the WEF nexus.
4.3. Evaluation of Food Production
Wheat serves as a reliable benchmark, given that wheat is a staple of human diets and has historically been used to measure technological advancement, efficiency, quality of life, prosperity, and wealth [3,68]. Therefore, wheat cultivation will serve as the reference for comparing the technical solutions being evaluated.
Analysis of the average efficiency indices reveals that the integration of PV systems significantly enhances them, making HGU with PV much more efficient than the CA practice of lettuce and wheat (Figure 13). One hectare of CA cultivation of lettuce produces food equivalent to 44,000–52,000 MJ, and one hectare of wheat cultivation produces food equivalent to 49,000–56,000 MJ [11]. One hectare of hydroponic cultivation with leafy greens, such as lettuce, produces food equivalent to 210,000 MJ.
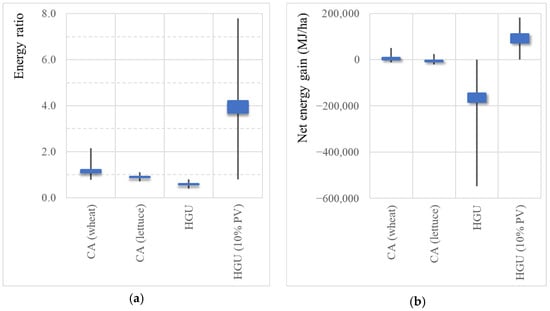
Figure 13.
Energy indices comparing the cultivation of wheat, the cultivation of lettuce (conventional agriculture practice), the cultivation of lettuce in HGU, and the cultivation of lettuce in HGU covered with 10% PV panels: (a) energy ratio; (b) net energy gain (annually).
The survival caloric needs for an adult are 1800–3000 kcal/day or 7.53–12.5 MJ/day [69]. While people do not consume energy, theoretically, one hectare of CA cultivations of lettuce or wheat produces food sufficient for the energy needs of approximately 10–20 people, whereas one hectare of HGU with lettuce produces food sufficient for the energy needs of approximately 50–80 people.
The caloric content of each lettuce (250 g) is about 42.5 kcal or 0.2 MJ. The energy needed for each seed to grow in CA is estimated to be about 0.11–0.26 MJ, while in HUG, it is estimated to be 0.32 MJ. The water needed for each seed to grow in CA is about 30–50 L, while in HUG, it is 10 L. Within a single year, the same plot of land is reused multiple times for crop cultivation. According to this perspective, the land use in CA is 0.04–0.05 m2/piece, while in HUG, it is 0.008 m2/piece (Table 1).

Table 1.
The summary of the results for one lettuce (250 g) with a caloric content of 42.5 kcal or 0.2 MJ.
Hydroponics delivers significantly higher energy output per unit area compared to CA. However, it also demands substantially more energy for food production (Figure 13). Despite this, the potential to replace conventional energy sources with PV panels highlights hydroponics’ promise for optimizing food production. Achieving sustainability, however, requires significant investment in infrastructure [70,71], energy inputs, nutrient delivery systems, and water management—underscoring the need for integration of renewable energy sources.
It is worth noting that the lettuce produced is not consumed locally (i.e., in Oinofyta) but in urban centers. In order to estimate the energy needed for the transformation of the production, we use a typical fully loaded truck as an example, which consumes 35 L of diesel per 100 km and carries 5500 kg or 22,200 pieces of lettuce.
In Figure 14, the grey triangles represent the diesel consumed by a truck based on travel distance; the orange dashed line illustrates the energy allocated per lettuce, while the blue line shows the transport energy as a percentage of the production energy (all in relation to distance traveled).
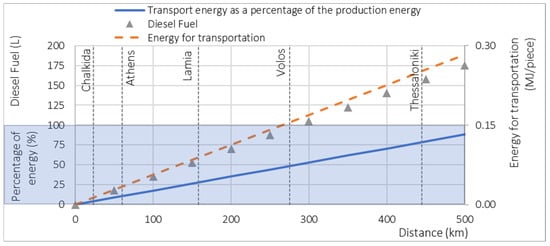
Figure 14.
Energy needs for the transportation of the HGU’s production.
Depending on the distance the product needs to travel to reach the market, more diesel will be consumed, as shown in Figure 14 by the grey triangular markers. Accordingly, the longer the distance the truck travels, the more energy is allocated per lettuce, as indicated by the orange dashed line on the secondary vertical axis.
The main vertical axis, shown with a blue line in Figure 14, illustrates that delivering lettuce to Athens requires an additional 10% of the energy used for its production; reaching Volos requires 50% more, and transporting it beyond Kavala (~600 km) requires as much energy as was used to produce it.
5. Conclusions
This study reveals the interconnections of the WEF nexus in a closed system HGU in Central Greece, demonstrating that the scarcity or abundance of any one of these three critical resources affects the others, either undermining or strengthening resilience accordingly.
By analyzing resource dynamics—water (13,725 m3/ha, equivalent to 68 MWh or 245 GJ via desalination), energy (125 MWh/ha or 321 GJ/ha plus 74.5 GJ/ha for fertigation), and food production (50,250,000 kcal, equivalent to 210,000 MJ/ha)—we identified critical interdependencies and proposed technical solutions to enhance self-sufficiency and resilience. The integration of 0.1 hectares of PV panels and rainwater harvesting by the cover area of the HGU with a balancing reservoir of 1000 m3 could reduce external energy dependency on the grid to 90% and water uses by 25–35%, respectively.
Key findings underscore hydroponics’ superior energy output (210,000 MJ/ha) compared to CA cultivations of lettuce (44,000–52,000 MJ/ha) and wheat (49,000–56,000 MJ/ha), highlighting its capacity to bolster food security in resource-constrained settings. However, high energy demands for climate control necessitate renewable energy adoption to mitigate trade-offs within the WEF nexus. As the energy needs are synchronized with resource profiles (e.g., PV generation with operational needs), the energy ratio and net energy gain indicate significant efficiency.
Although the examined systems focus on large-scale economies, it is worth exploring whether small-scale hydroponic cultivation could be implemented in urban open spaces in further research. For instance, if 10% of Athens’ total area (34,500 hectares) [72] consists of rooftops suitable for hydroponic systems, such cultivation could produce enough food to meet the nutritional energy needs of approximately 170,000–275,000 residents or about 5% of the population. While this would not address the city’s food requirements, it would significantly enhance urban resilience by mitigating the impacts of potential disruptions in supply chains.
Overall, this case study illustrates that HGUs, when guided by nexus-based approaches, can serve as resilient, resource-efficient models for sustainable food production, contributing to global efforts to address resource scarcity.
Author Contributions
Conceptualization, G.-F.S.; Methodology, G.-F.S.; Software, G.-F.S.; Validation, E.M. and N.M.; Formal Analysis, G.-F.S.; Investigation, G.-F.S. and E.M.; Resources, E.M. and N.M.; Data Curation, G.-F.S., E.M. and N.M.; Writing—Original Draft Preparation, G.-F.S., E.M., N.M. and T.I.; Writing—Review and Editing, G.-F.S., E.M., N.M. and T.I.; Visualization, G.-F.S. All authors have read and agreed to the published version of the manuscript.
Funding
This research received no external funding but was motivated by the scientific curiosity of the authors.
Data Availability Statement
The data sets used have been retrieved from the sources described in detail in the text.
Acknowledgments
This study constitutes preparatory research for the WATERSENS-Development of Innovative Decentralized Technologies and new Co-Created Governance Models for Water Sensitive Communities, Horizon-2020 (No. 101181779), scheduled to commence in September 2025.
Conflicts of Interest
The authors declare no conflict of interest.
References
- Hoff, H. Understanding the Nexus. In Proceedings of the Bonn2011 Conference: The Water, Energy and Food Security Nexus, Stockholm, Sweden, 6–18 November 2011. [Google Scholar]
- FAO. The Water-Energy-Food Nexus: A New Approach in Support of Food Security and Sustainable Agriculture; Food and Agriculture Organization of the United Nations: Rome, Italy, 2014; Available online: https://openknowledge.fao.org/server/api/core/bitstreams/86fe97cc-4a38-4511-a37f-8eb8ea8fe941/content (accessed on 1 August 2025).
- Sargentis, G.-F. Issues of Prosperity: Stochastic Evaluation of Data Related to Environment, Infrastructures, Economy and Society. Ph.D. Thesis, National Technical University of Athens, Athens, Greece, 2022. [Google Scholar]
- Al-Chalabi, M. Vertical farming: Skyscraper sustainability? Sustain. Cities Soc. 2015, 18, 74–77. [Google Scholar] [CrossRef]
- Sargentis, G.-F.; Iliopoulou, T.; Sigourou, S.; Dimitriadis, P.; Koutsoyiannis, D. Evolution of Clustering Quantified by a Stochastic Method-Case Studies on Natural and Human Social Structures. Sustainability 2020, 12, 7972. [Google Scholar] [CrossRef]
- United Nations. World Urbanization Prospects: The 2018 Revision. Department of Economic and Social Affairs, Population Division. 2018. Available online: https://population.un.org/wup/assets/WUP2018-Report.pdf (accessed on 1 August 2025).
- Sargentis, G.-F.; Kougkia, M. Vulnerabilities of water-energy and food nexus in cities of digital era. Insight-Civ. Eng. 2024, 7, 608. [Google Scholar] [CrossRef]
- Sargentis, G.-F.; Koutsoyiannis, D. The Function of Money in Water–Energy–Food and Land Nexus. Land 2023, 12, 669. [Google Scholar] [CrossRef]
- Chatzimpiros, P.; Lagos, G.; Sargentis, G.-F. Man and City. Myth and vision. In Proceedings of the 10th International Conference on Environmental Science and Technology, Kos Island, Greece, 5–7 September 2007. [Google Scholar] [CrossRef]
- Tian, G.; Li, J.; Wu, Z.; Zhao, Q.; Xia, Q.; Zhang, J.; Niu, X. Unveiling the resilience of the water-energy-food nexus: A context-specific framework and evolutionary insights for the Yellow River Basin. Agric. Water Manag. 2025, 315, 109514. [Google Scholar] [CrossRef]
- Sargentis, G.-F.; Markantonis, D. Water-energy-food nexus and its stochastic dynamics: Case study Greece. Discov. Sustain. 2024, 5, 511. [Google Scholar] [CrossRef]
- Sargentis, G.-F.; Ioannidis, R. The impacts of altering biodiversity to the Water–Energy–Food nexus: Case study North Euboea, Greece. Discov. Water 2024, 4, 105. [Google Scholar] [CrossRef]
- Koutsoyiannis, D. When Are Models Useful? Revisiting the Quantification of Reality Checks. Water 2025, 17, 264. [Google Scholar] [CrossRef]
- Iliopoulou, T.; Koutsoyiannis, D. Have Rainfall Patterns Changed? A Global Analysis of Long-Term Rainfall Records and Re-Analysis Data. The Heritage Foundation. 10 January 2025. Available online: https://www.heritage.org/environment/report/have-rainfall-patterns-changed-global-analysis-long-term-rainfall-records (accessed on 1 August 2025).
- Koutsoyiannis, D.; Iliopoulou, T. Understanding Climate: Gifts from the Nile; The Heritage Foundation: Washington, DC, USA, 2024; 60p, SR 301. [Google Scholar]
- Koutsoyiannis, D.; Iliopoulou, T.; Koukouvinos, A.; Malamos, N.; Mamassis, N.; Dimitriadis, P.; Tepetidis, N.; Markantonis, D. In Search of Climate Crisis in Greece Using Hydrological Data: 404 Not Found. Water 2023, 15, 1711. [Google Scholar] [CrossRef]
- Vicente-Serrano, S.M.; Tramblay, Y.; Reig, F.; González-Hidalgo, J.C.; Beguería, S.; Brunetti, M.; Kalin, K.C.; Patalen, L.; Kržič, A.; Lionello, P.; et al. High temporal variability not trend dominates Mediterranean precipitation. Nature 2025, 639, 658–666. [Google Scholar] [CrossRef]
- Serdar, M.Z.; Lahlou, F.-Z.; Al-Ansari, T. Enhancing resilience to climate change: Addressing cascading risks within the energy, water and food nexus. Prog. Disaster Sci. 2024, 24, 100390. [Google Scholar] [CrossRef]
- Huang, D.; Li, Y.; Su, H.; Li, G.; Zhuang, J. Operationalizing food-energy-water nexus toward carbon neutrality. Front. Eng. Manag. 2025, 12, 208–218. [Google Scholar] [CrossRef]
- Sargentis, G.-F.; Lagaros, N.D.; Cascella, G.L.; Koutsoyiannis, D. Threats in Water–Energy–Food–Land Nexus by the 2022 Military and Economic Conflict. Land 2022, 11, 1569. [Google Scholar] [CrossRef]
- Sargentis, G.-F. Entropy and War, Toy Models. Recent Prog. Sci. Eng. 2025, 1, 007. [Google Scholar] [CrossRef]
- Sargentis, G.-F. Fragility in Human Progress. A Perspective on Governance, Technology and Societal Resilience. Front. Complex Syst. 2025. Available online: https://www.frontiersin.org/journals/complex-systems/articles/10.3389/fcpxs.2025.1609467/abstract (accessed on 1 August 2025).
- Food and Agriculture Organization of the United Nations. The State of Food and Agriculture 2020: Overcoming Water Challenges in Agriculture; FAO: Rome, Italy, 2020; Available online: https://www.fao.org/documents/card/en/c/cb1447en (accessed on 1 August 2025).
- Grey, D.; Sadoff, C.W. Sink or Swim? Water security for growth and development. Water Policy 2007, 9, 545–571. [Google Scholar] [CrossRef]
- FAO. “Water Use”. AQUASTAT-FAO’s Global Information System on Water and Agriculture. 2021. Available online: https://www.fao.org/aquastat/en/overview/methodology/water-use (accessed on 1 August 2025).
- Rodriguez, D.J.; Delgado, A.; DeLaquil, P.; Sohns, A. Thirsty Energy; Water Papers; World Bank: Washington, DC, USA, 2013. [Google Scholar]
- IEA (International Energy Agency). World Energy Outlook 2021; OECD Publishing: Paris, France, 2021; Available online: https://www.iea.org/reports/world-energy-outlook-2021 (accessed on 1 August 2025).
- FAO; IFAD; UNICEF; WFP; WHO. The State of Food Security and Nutrition in the World 2021: Transforming Food Systems for Food Security, Improved Nutrition and Affordable Healthy Diets for All; FAO: Rome, Italy, 2021. [Google Scholar]
- Searchinger, T.; Waite, R.; Hanson, C.; Ranganathan, J. Creating a Sustainable Food Future: A Menu of Solutions to Feed Nearly 10 Billion People by 2050; World Resources Institute: Washington, DC, USA, 2019. [Google Scholar]
- Taylor, R.; Carandang, J.S.; Alexander, C.; Calleja, J.S. Making Global Cities Sustainable: Urban Rooftop Hydroponics for Diversified Agriculture in Emerging Economies. OIDA Int. J. Sustain. Dev. 2012, 5, 11–28. Available online: https://ssrn.com/abstract=2192203 (accessed on 1 August 2025).
- Touliatos, D.; Dodd, I.C.; McAinsh, M. Vertical farming increases lettuce yield per unit area compared to conventional horizontal hydroponics. Food Energy Secur. 2016, 5, 184–191. [Google Scholar] [CrossRef]
- Zhu, Z.; Yogev, U.; Keesman, K.J.; Rachmilevitch, S.; Gross, A. Integrated hydroponics systems with anaerobic supernatant and aquaculture effluent in desert regions: Nutrient recovery and benefit analysis. Sci. Total Environ. 2023, 904, 166867. [Google Scholar] [CrossRef]
- Nguyen, M.T.; Knowling, M.; Tran, N.N.; Burgess, A.; Fisk, I.; Watt, M.; Escribà-Gelonch, M.; This, H.; Culton, J.; Hessel, V. Space farming: Horticulture systems on spacecraft and outlook to planetary space exploration. Plant Physiol. Biochem. 2023, 194, 708–721. [Google Scholar] [CrossRef]
- Gillani, S.A.; Abbasi, R.; Martinez, P.; Ahmad, R. Comparison of Energy-use Efficiency for Lettuce Plantation under Nutrient Film Technique and Deep-Water Culture Hydroponic Systems. Procedia Comput. Sci. 2023, 217, 11–19. [Google Scholar] [CrossRef]
- Vega, I.; Bien-Amié, D.; Augustin, G.; Heiden, W.; Heiden, N. Intermittent circulation of simplified deep flow technique hydroponic system increases yield efficiency and allows application of systems without electricity in Haiti. Agric. Food Secur. 2023, 12, 18. [Google Scholar] [CrossRef]
- Jones, J.B. Hydroponics: A Practical Guide for the Soilless Grower, 2nd ed.; CRC Press: Boca Raton, FL, USA, 2014. [Google Scholar]
- Shareef, U.; Rehman, A.U.; Ahmad, R. A Systematic Literature Review on Parameters Optimization for Smart Hydroponic Systems. AI 2024, 5, 1517–1533. [Google Scholar] [CrossRef]
- Wang, A.; Lv, J.; Wang, J.; Shi, K. CO2 enrichment in greenhouse production: Towards a sustainable approach. Front. Plant Sci. 2022, 13, 1029901. [Google Scholar] [CrossRef]
- Seginer, I.; Angel, A.; Kantz, D. Optimal CO2 enrichment strategy for greenhouses: A simulation study. J. Agric. Eng. Res. 1986, 34, 285–304. [Google Scholar] [CrossRef]
- Newell, R.; Newman, L.; Dickson, M.; Vanderkooi, B.; Fernback, T.; White, C. Hydroponic fodder and greenhouse gas emissions: A potential avenue for climate mitigation strategy and policy development. Facets 2021, 6, 334–357. [Google Scholar] [CrossRef]
- Barbosa, G.L.; Gadelha, F.D.A.; Kublik, N.; Proctor, A.; Reichelm, L.; Weissinger, E.; Wohlleb, G.M.; Halden, R.U. Comparison of Land, Water, and Energy Requirements of Lettuce Grown Using Hydroponic vs. Conventional Agricultural Methods. Int. J. Environ. Res. Public Health 2015, 12, 6879–6891. [Google Scholar] [CrossRef]
- Bathaei, A.; Štreimikienė, D. Renewable Energy and Sustainable Agriculture: Review of Indicators. Sustainability 2023, 15, 14307. [Google Scholar] [CrossRef]
- IRENA. Renewable Energy for Agri-food Systems: Towards Sustainable Development Goals and the Paris Agreement. Available online: https://www.irena.org/events/2021/Nov/Renewable-Energy-for-Agrifood-Systems (accessed on 1 August 2025).
- Bazilian, M.; Rogner, H.; Howells, M.; Hermann, S.; Arent, D.; Gielen, D.; Steduto, P.; Mueller, A.; Komor, P.; Tol, R.S.; et al. Considering the energy, water and food nexus: Towards an integrated modelling approach. Energy Policy 2011, 39, 7896–7906. [Google Scholar] [CrossRef]
- Yue, Q.; Guo, P. Managing agricultural water-energy-food-environment nexus considering water footprint and carbon footprint under uncertainty. Agric. Water Manag. 2021, 252, 106899. [Google Scholar] [CrossRef]
- Trépanier, M.P.; Gosselin, L.; Jørgensen, B.N. Best combinations of energy-efficiency measures in greenhouses considering energy consumption, yield, and costs: Comparison between two cold climate cities. Appl. Energy 2025, 382, 125163. [Google Scholar] [CrossRef]
- Abedi, M.; Tan, X.; Klausner, J.; Benard, A. Integrated Greenhouse for Food and Water Production. In Proceedings of the ASME 2023 Heat Transfer Summer Conference Collocated with the ASME 2023 17th International Conference on Energy Sustainability, Washington, DC, USA, 10–12 July 2023. V001T01A005. [Google Scholar] [CrossRef]
- Tan, X.; Abedi, M.; Klausner, J.F.; Bénard, A. Modeling and experimental validation of light-splitting semi-transparent solar water heater using NIR cut-off film as the rooftop of a greenhouse for arid regions. Appl. Energy 2024, 368, 123489. [Google Scholar] [CrossRef]
- Campisano, A.; Butler, D.; Ward, S.; Burns, M.J.; Friedler, E.; DeBusk, K.; Fisher-Jeffes, L.N.; Ghisi, E.; Rahman, A.; Furumai, H.; et al. Urban rainwater harvesting systems: Research, implementation and future perspectives. Water Res. 2017, 115, 195–209. [Google Scholar] [CrossRef] [PubMed]
- Sucozhañay, A.; Pesántez, J.; Guerrero-Coronel, R.; Guerrero-Coronel, R.; Peña, D.; Célleri, R. Rainwater harvesting as a sustainable solution for the production of urban hydroponic crops. Water Reuse 2024, 14, 177–189. [Google Scholar] [CrossRef]
- Portman, M.E.; Vdov, O.; Schuetze, M.; Gilboa, Y.; Friedler, E. Public perceptions and perspectives on alternative sources of water for reuse generated at the household level. Water Reuse 2022, 12, 157–174. [Google Scholar] [CrossRef]
- Abedi, M.; Tan, X.; Klausner, J.F.; Bénard, A. Solar desalination chimneys: Investigation on the feasibility of integrating solar chimneys with humidification–dehumidification systems. Renew. Energy 2023, 202, 88–102. [Google Scholar] [CrossRef]
- Kumar, R.; Ahmed, M.; Bhadrachari, G.; Thomas, J.P. Desalination for agriculture: Water quality and plant chemistry, technologies and challenges. Water Supply 2018, 18, 1505–1517. [Google Scholar] [CrossRef]
- Antolinos, V.; Sánchez-Martínez, M.J.; Maestre-Valero, J.F.; López-Gómez, A.; Martínez-Hernández, G.B. Effects of Irrigation with Desalinated Seawater and Hydroponic System on Tomato Quality. Water 2020, 12, 518. [Google Scholar] [CrossRef]
- Sargentis, G.-F.; Ioannidis, R.; Dimitriadis, P.; Malamos, N.; Lyra, O.; Kitsou, O.; Kougkia, M.; Mamassis, N.; Koutsoyiannis, D. Energy Self-Sufficiency in Rural Areas, Case Study: North Euboea, Greece. Adv. Environ. Eng. Res. 2024, 5, 2766–6190. [Google Scholar] [CrossRef]
- Markatos, E. Operational Data Logs from Markatos Hydroponics; Personal communication. 2025. [Google Scholar]
- Nikolinakou, M.; Moraiti, K.; Siganou, A.; Markantonis, D.; Sargentis, G.-F.; Iliopoulou, T.; Dimitriadis, P.; Meletopoulos, I.T.; Mamassis, N.; Koutsoyiannis, D. Investigating the water supply potential of traditional rainwater harvesting techniques used-A case study for the Municipality of Western Mani. In Proceedings of the European Geosciences Union General Assembly, Vienna, Austria, 23–27 May 2022. EGU22-3063. [Google Scholar] [CrossRef]
- Sargentis, G.-F.; Mamassis, N.; Kitsou, O.; Koutsoyiannis, D. The role of technology in the water–energy–food nexus. A case study: Kerinthos, North Euboea, Greece. Front. Water 2024, 6, 1343344. [Google Scholar] [CrossRef]
- Kirkmalis, G.; Sargentis, G.-F.; Ioannidis, R.; Markantonis, D.; Iliopoulou, T.; Dimitriadis, P.; Mamasis, N.; Koutsoyiannis, D. Fertilizers as batteries and regulators in the global Water-Energy-Food equilibrium. In Proceedings of the EGU General Assembly 2023, Vienna, Austria, 24–28 April 2023. EGU23-11915. [Google Scholar] [CrossRef]
- Malamos, N. Operational Data Logs for a Photovoltaic Park, 2012–2024; Personal communication. 2025. [Google Scholar]
- U.S. Department of Agriculture, Agricultural Research Service. Download Food Data Central Data. Available online: https://fdc.nal.usda.gov/download-datasets.html (accessed on 1 August 2025).
- Meteorological Data. Available online: https://oinofytaweather.gr/datasummary.html (accessed on 1 August 2025).
- Koutsoyiannis, D. Scale of water resources development and sustainability: Small is beautiful, large is great. Hydrol. Sci. J. 2011, 56, 553–575. [Google Scholar] [CrossRef]
- Ghaffour, N.; Missimer, T.M.; Amy, G.L. Technical review and evaluation of the economics of water desalination: Current and future challenges for better water supply sustainability. Desalination 2013, 309, 197–207. [Google Scholar] [CrossRef]
- Ansari, R.; Liaqat, M.U.; Khan, H.I.; Mushtaq, S. Energy Efficiency Analysis of Wheat Crop under Different Climate- and Soil-Based Irrigation Schedules. Proceedings 2018, 2, 184. [Google Scholar] [CrossRef]
- Moradi, M.; Nematollahi, M.A.; Mousavi Khaneghah, A.; Pishgar-Komleh, S.H.; Rajabi, M.R. Comparison of energy consumption of wheat production in conservation and conventional agriculture using DEA. Environ. Sci. Pollut. Res. 2018, 25, 35200–35209. [Google Scholar] [CrossRef]
- Ziaei, S.M.; Mazloumzadeh, S.M.; Jabbary, M. A comparison of energy use and productivity of wheat and barley (case study). J. Saudi Soc. Agric. Sci. 2015, 14, 19–25. [Google Scholar] [CrossRef]
- Sargentis, G.-F.; Defteraios, P.; Lagaros, N.D.; Mamassis, N. Values and Costs in History: A Case Study on Estimating the Cost of Hadrianic Aqueduct’s Construction. World 2022, 3, 260–286. [Google Scholar] [CrossRef]
- Berners-Lee, M.; Kennelly, C.; Watson, R.; Hewitt, C.N. Current global food production is sufficient to meet human nutritional needs in 2050 provided there is radical societal adaptation. Elem. Sci Anthr. 2018, 6, 52. [Google Scholar] [CrossRef]
- Sargentis, G.-F.; Ioannidis, R.; Iliopoulou, T.; Dimitriadis, P.; Koutsoyiannis, D. Landscape Planning of Infrastructure through Focus Points’ Clustering Analysis. Case Study: Plastiras Artificial Lake (Greece). Infrastructures 2021, 6, 12. [Google Scholar] [CrossRef]
- Markantonis, D.; Sargentis, G.-F.; Dimitriadis, P.; Iliopoulou, T.; Siganou, A.; Moraiti, K.; Nikolinakou, M.; Meletopoulos, I.T.; Mamassis, N.; Koutsoyiannis, D. Stochastic Evaluation of the Investment Risk by the Scale of Water Infrastructures—Case Study: The Municipality of West Mani (Greece). World 2023, 4, 1–20. [Google Scholar] [CrossRef]
- Sargentis, G.-F.; Ioannidis, R.; Karakatsanis, G.; Sigourou, S.; Lagaros, N.D.; Koutsoyiannis, D. The Development of the Athens Water Supply System and Inferences for Optimizing the Scale of Water Infrastructures. Sustainability 2019, 11, 2657. [Google Scholar] [CrossRef]


Disclaimer/Publisher’s Note: The statements, opinions and data contained in all publications are solely those of the individual author(s) and contributor(s) and not of MDPI and/or the editor(s). MDPI and/or the editor(s) disclaim responsibility for any injury to people or property resulting from any ideas, methods, instructions or products referred to in the content. |
© 2025 by the authors. Licensee MDPI, Basel, Switzerland. This article is an open access article distributed under the terms and conditions of the Creative Commons Attribution (CC BY) license (https://creativecommons.org/licenses/by/4.0/).