Article

National Multi-Scenario Simulation of Low-Carbon Land Use to Achieve the Carbon-Neutrality Target in China

1
School of Geography and Tourism, Anhui Normal University, Wuhu 241002, China
2
Key Laboratory of Jianghuai Arable Land Resources Protection and Eco-Restoration, Hefei 230088, China
*
Author to whom correspondence should be addressed.
Earth 2025, 6(3), 85; https://doi.org/10.3390/earth6030085 (registering DOI)
Submission received: 11 May 2025 / Revised: 9 July 2025 / Accepted: 18 July 2025 / Published: 1 August 2025

Abstract

Refining the land use structure can boost land utilization efficiency and curtail regional carbon emissions. Nevertheless, prior research has predominantly concentrated on static linear planning analysis. It has failed to account for how future dynamic alterations in driving factors (such as GDP and population) affect simulation outcomes and how the land use spatial configuration impacts the attainment of the carbon-neutrality goal. In this research, 1 km spatial resolution LULC products were employed to meticulously simulate multiple land use scenarios across China at the national level from 2030 to 2060. This was performed by taking into account the dynamic changes in driving factors. Subsequently, an analysis was carried out on the low-carbon land use spatial structure required to reach the carbon-neutrality target. The findings are as follows: (1) When employing the PLUS (Patch—based Land Use Simulation) model to conduct simulations of various land use scenarios in China by taking into account the dynamic alterations in driving factors, a high degree of precision was attained across diverse scenarios. The sustainable development scenario demonstrated the best performance, with kappa, OA, and FoM values of 0.9101, 93.15%, and 0.3895, respectively. This implies that the simulation approach based on dynamic factors is highly suitable for national-scale applications. (2) The simulation accuracy of the PLUS and GeoSOS-FLUS (Systems for Geographical Modeling and Optimization, Simulation of Future Land Utilization) models was validated for six scenarios by extrapolating the trends of influencing factors. Moreover, a set of scenarios was added to each model as a control group without extrapolation. The present research demonstrated that projecting the trends of factors having an impact notably improved the simulation precision of both the PLUS and GeoSOS-FLUS models. When contrasted with the GeoSOS-FLUS model, the PLUS model attained superior simulation accuracy across all six scenarios. The highest precision indicators were observed in the sustainable development scenario, with kappa, OA, and FoM values reaching 0.9101, 93.15%, and 0.3895, respectively. The precise simulation method of the PLUS model, which considers the dynamic changes in influencing factors, is highly applicable at the national scale. (3) Under the sustainable development scenario, it is anticipated that China’s land use carbon emissions will reach their peak in 2030 and achieve the carbon-neutrality target by 2060. Net carbon emissions are expected to decline by 14.36% compared to the 2020 levels. From the perspective of dynamic changes in influencing factors, the PLUS model was used to accurately simulate China’s future land use. Based on these simulations, multi-scenario predictions of future carbon emissions were made, and the results uncover the spatiotemporal evolution characteristics of China’s carbon emissions. This study aims to offer a solid scientific basis for policy-making related to China’s low-carbon economy and high-quality development. It also intends to present Chinese solutions and key paths for achieving carbon peak and carbon neutrality.

1. Introduction

Global climate change poses a major challenge to human society in the 21st century. As the world’s second-largest economic power, China is currently in a stage of rapid economic growth, which is likely to result in considerable carbon dioxide emissions. In 2020, China put forward its “dual carbon” objectives, with the intention of reaching a carbon peak around 2030 and achieving carbon neutrality around 2060 [1]. Attaining these goals is not only a primary concern that all levels of government in China need to focus on but also a significant hurdle in future land space planning. To accomplish this aim, it is essential to comprehensively assess the influence of land use alterations on carbon emissions. By studying the characteristic variations and key factors driving land use-related carbon emissions, a robust theoretical basis can be laid for formulating efficient and scientifically sound low-carbon reduction policies. This approach will not merely foster the harmonious advancement of China’s economy and ecological surroundings; it will also contribute to the long-term and high-standard growth of the nation’s economy.
In prior research, both within the country and abroad, land use simulation models frequently utilized encompass the CA (cellular automata), CLUE-S (Conversion of Land Use and its Effects at Small Region Extent), and FLUS (Future Land Use Simulation) models. For example, Gu and colleagues made use of a system dynamics model to mimic the urbanization process in China spanning from 2013 to 2050 across various scenarios. They were able to scientifically anticipate the saturation point of urbanization [2]. Furthermore, Niu and others utilized the CLUE-S model in combination with logistic regression. This approach was employed to examine the elements that impact land use alterations in Kunming City. In this way, they predicted the future trends of land use and provided useful perspectives for the rational expansion of urban agglomerations [3]. Liang and co-workers put forward the PLUS model. This model integrates cellular automata with patch generation strategies, substantially boosting the ability to simulate at a fine scale and the predictive precision of actual landscape patterns [4]. In addition, certain scholars have combined the PLUS model with carbon emission computations. For example, Bohao Wei and colleagues integrated the PLUS model with a gray back-propagation neural network and integrated it into carbon emission accounting models. They employed this configuration to simulate four different scenarios of land use alteration in the northern Tianshan urban cluster for the year 2030. In this way, they projected the corresponding carbon emissions, presenting useful references for multi-scenario carbon emission predictions [5].
Accounting for carbon emissions related to land use is crucial for formulating scientifically sound carbon emission reduction strategies. Consequently, scholars both at home and abroad have carried out comprehensive research on this subject. Academic communities categorize land use carbon emission accounting methods into direct and indirect ones. Direct land use carbon emission accounting involves computing the carbon emissions arising from land use and land cover alterations [6]. In the 1990s, the IPCC released the “IPCC National Greenhouse Gas Inventory Guidelines.” These guidelines provided parameter benchmarks and direct carbon emission calculation techniques for land use, serving as an authoritative basis for present-day research. For example, Meiyappan and colleagues utilized climate models to forecast land use carbon emissions in deforestation situations. They evaluated the overall carbon emission levels over different years and varying forest cover percentages [7]. Arneth and others calculated land use carbon emissions by means of dynamic global vegetation models (DGVMs). Their research indicated that carbon dioxide emissions caused by land use changes were substantially underestimated, and that terrestrial ecosystems might possess a greater carbon sequestration capacity in the future [8]. On the other hand, indirect carbon emission accounting measures the carbon emissions produced by human activities on diverse land types. This approach mainly focuses on the emissions stemming from the burning of fossil fuels. For instance, Raupah et al. and Ghosh et al. [9,10] have used this approach. Zhao and his research group combined two kinds of nighttime light data, specifically NPP-VIIRS and DMSP-OLS data, to investigate the spatial alterations in carbon emissions generated by urban residents in China and examine the factors that have an impact on these emissions [11].
Nonetheless, existing research on land use simulation is deficient in precise approaches for large-scale simulations. Furthermore, it does not carry out analyses from the perspective of the dynamic changes in the factors that influence future land use patterns and carbon emissions [12,13,14]. Additional investigations are necessary to enhance the precision of large-scale land use simulations and make dynamic predictions of future multi-scenario carbon emissions. To address these disparities in knowledge, this research made use of the PLUS framework. It analyzed the expansion patterns of real-world land use in China, relying on data from 2000, 2010, and 2020. By combining diverse remote-sensing datasets and setting parameters reasonably, accurate simulations of China’s land use data were carried out for the years 2030, 2040, 2050, and 2060 under multiple future scenarios. Subsequently, a comprehensive analysis was performed on the changing features of the current land use development model within these scenarios. Drawing on the results of the simulation, a comprehensive and in-depth assessment, encompassing both qualitative and quantitative aspects, was carried out on the carbon sources and carbon sinks arising from future alterations in land use. This investigation probed into the temporal and spatial development of carbon emissions across various future scenarios. The findings of this research propose pertinent recommendations and actions for the sustainable growth of China’s economy and ecological environment. Moreover, they provide data-driven backing for attaining China’s “dual carbon” goals.

2. Data Sources and Processing

The research data mainly comprises land use data, the elements affecting land use change, and carbon density data (Table 1). The land use raster data is sourced from the annual China Land Cover Dataset (CLCD, 30 m), which was generated by Huang Xin and colleagues from Wuhan University. This dataset depends on the Landsat images available on the Google Earth Engine (GEE) platform. A random forest classifier is utilized for classifying land cover. When compared with existing thematic products, the data shows excellent consistency, and the overall accuracy after visual analysis reaches as much as 80%. The dataset was generated by the Research Institute of Geography and Natural Resources under the Chinese Academy of Sciences, through human–computer interactive interpretation of the Landsat images. The overall accuracy of the three datasets surpasses 90%, and the classification precision meets the requirements of this research. Due to the constraints in the processing ability of individual machines and the non-availability of some high-resolution auxiliary data, the original 30 m resolution land use data was re-sampled to a 1 km resolution for this study. Based on the categorization standards established by the Institute of Geography and Natural Resources Research under the Chinese Academy of Sciences, land utilization types were categorized into farmlands, woodlands, pastures, water bodies, building areas, and barren lands.
Drawing upon prior research, the data regarding influencing factors are classified into two categories: climatic and environmental factors, and socioeconomic factors. Climatic and environmental factors consist of the proximity to water bodies, digital elevation model (DEM), terrain slope, soil classification, mean annual temperature, and mean annual precipitation. Socioeconomic factors cover population size, gross domestic product (GDP), the separation from railway tracks, the gap to express highways, the span to primary thoroughfares, and the interval to secondary roadways. Information on nature reserves acts as one of the restrictive elements in land use simulations. Data on carbon density is crucial for carbon emission accounting models. The correlation coefficient for direct carbon emissions was determined by examining a vast array of references. Data on China’s energy consumption for indirect carbon emissions was sourced from the publicly accessible data of the National Bureau of Statistics of China.

3. Methods

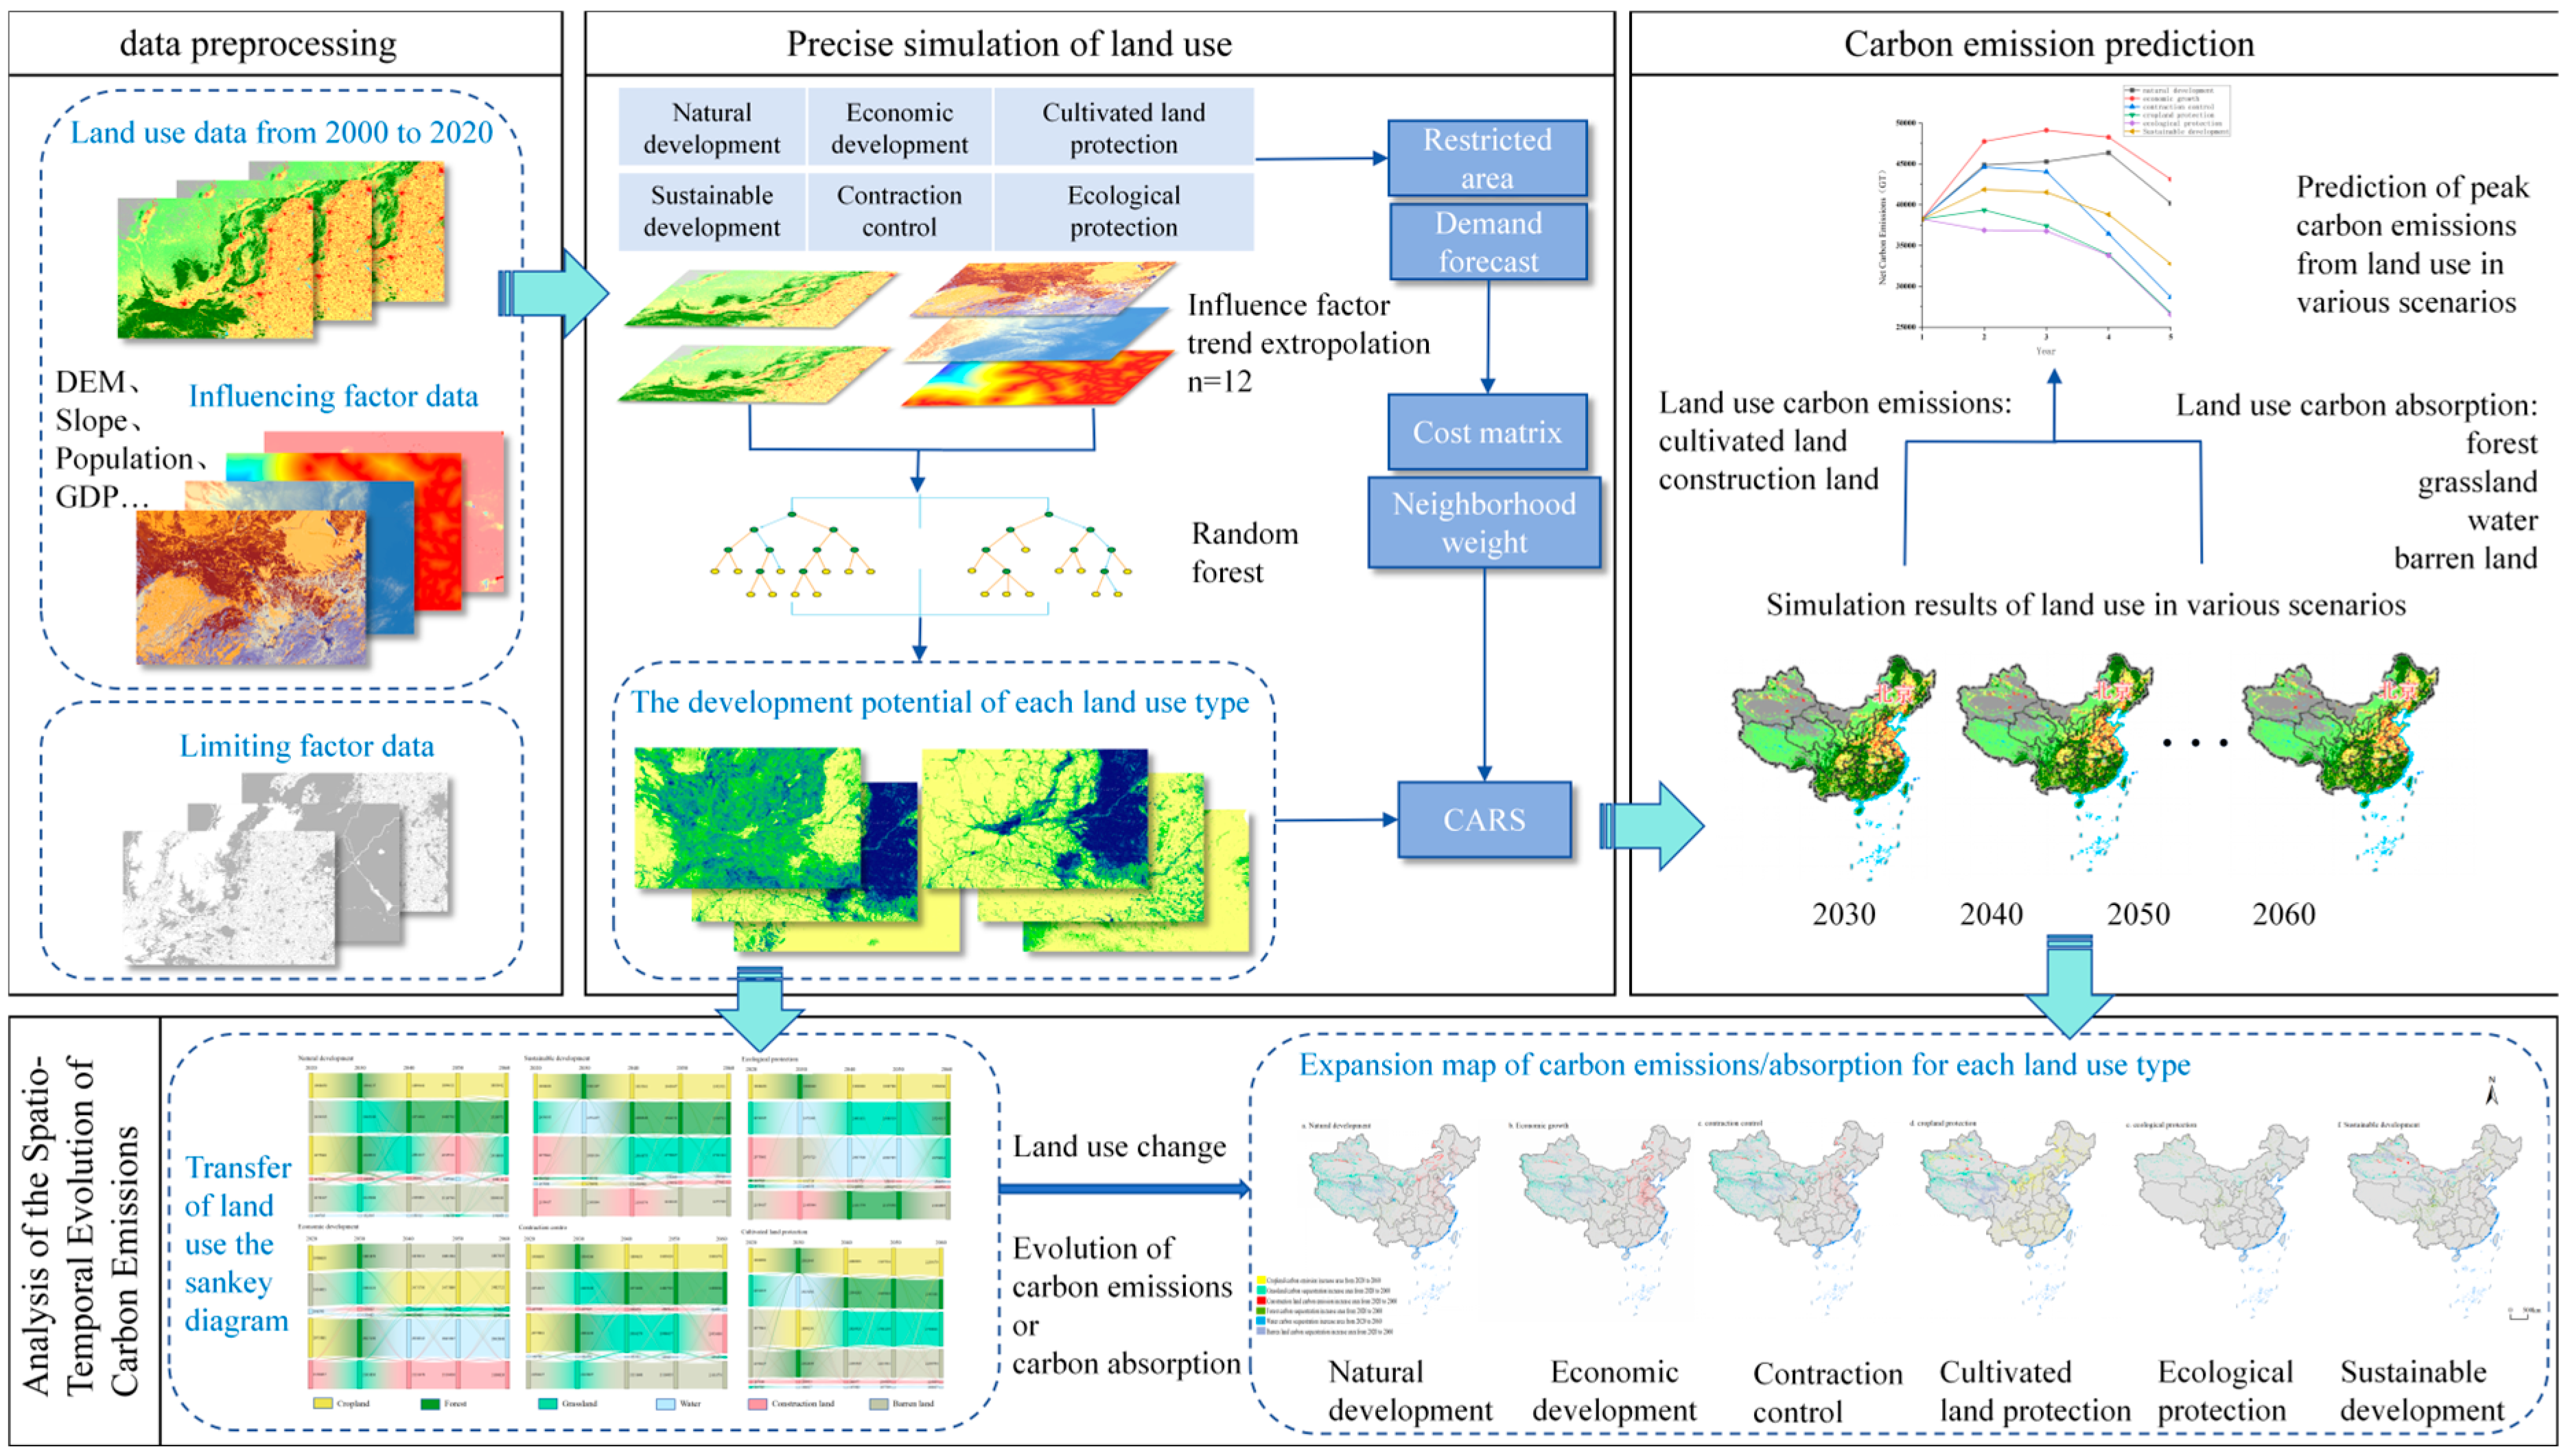
3.1. Research Framework

This study makes use of the PLUS model (Figure 1). Initially, the expansion segment of land use data spanning the years 2010 and 2020 is retrieved and fed into the LEAS module. Relevant climate and environmental elements, along with socioeconomic factors from the corresponding periods that exert a substantial influence on land use alterations, are carefully chosen. Subsequently, the logistic regression approach is employed to quantitatively compute the suitability probability distribution for each type of land use. The aforementioned development probabilities, together with the starting simulation year of 2020, are introduced into the CARS module. This step is integrated with the constraint factors determined by the development regulations of each scenario. Spatial autocorrelation neighborhood weights and a cost matrix based on transition probabilities are also incorporated. Through a process of random sampling and multiple iterative computations, the simulation outcomes for the spatial distribution of land use between 2030 and 2060 under different scenarios are finally produced.

3.2. Land Use Simulation Based on the PLUS Model

3.2.1. PLUS Model

The PLUS model, also known as the Land Use Change Simulation Model, is a cutting-edge instrument designed for simulating alterations in land use. The creation was carried out by the Laboratory for High-Efficiency Spatial Computational Intelligence at the China University of Geosciences. When juxtaposed with conventional geographic cellular automaton models, the PLUS model demonstrates superior capabilities in pinpointing the driving forces behind land use change and simulating fine-grained, patch-level variations. The LEAS component in the PLUS framework employs a random forest computational method. It trains the model by randomly choosing sample data. Through this process, it conducts a quantitative analysis of the factors driving land use expansion and computes the contribution of each factor. As a result, it generates potential development maps for diverse land use types. The CARS module takes advantage of these potential maps. A cellular automaton model is integrated with multiple-type random patch seeds to mimic the spatiotemporal patterns of alterations in land use. Furthermore, the PLUS model incorporates methods for predicting demand, such as Markov chains and linear regression. These methods enable the generation of land use simulation outcomes under a variety of scenarios. In general, this model presents a scientific foundation for the administration and design of land resources [4].

3.2.2. Parameter Settings

Accurately simulating land use hinges significantly on establishing the parameter settings of the PLUS model. This process mainly encompasses the setup and refinement of three key modules: the demand forecasting module, the cost matrix module, and the neighborhood weight module [4]. The demand forecasting module leverages the Markov chain to compute the overall pixel count for each land use category in upcoming years. It anticipates future pixel values and generates diverse land use types in the background. The cost matrix module serves to describe the complexity of converting between different land use types. It imposes constraints on conversion rules and makes dynamic adjustments according to historical data and policy stipulations. The module related to neighborhood weight exerts a direct influence on the spatial arrangement of every land use category. It achieves this by gauging the expansion intensity of these categories. Moreover, the model incorporates a regional module. This module restricts conversions between land use types and sets boundaries on the conversion of non-convertible areas within the simulation scope.
In accordance with China’s development actualities and policy frameworks, this study modifies the parameters of the PLUS model based on relevant investigations. In the demand prediction module, the quantity of pixels for each land use category in the projected year, as estimated by the Markov chain, is tailored according to the development traits of diverse scenarios. This goal is achieved by modifying the transformation probabilities of each individual land use category generated in the model’s backdrop. The likelihood of conversion to other land use types can either be increased or decreased. At the same time, the development probabilities of other land use types are weighted according to the average probability value of their respective proportions. This ensures a rational adjustment of the demand prediction while keeping the total number of land use grids constant. Such an adjustment facilitates the attainment of development results that are more in line with the real situation. The cost matrix incorporates the development model of each scenario to restrict the transition rules between particular land use types [12,13,14,15]. The neighborhood weight is determined by the expansion area ratio of each type in historical land expansion maps. It is further refined with the help of expert insights and significant research results in the field [16].
The demarcation of restricted zones is carried out in accordance with the specific aims of each situation. For example, when the primary development objectives of a scenario encompass the safeguarding of farmland and the ecological surroundings, high-grade cultivated land or ecologically vulnerable land is demarcated as restricted areas in line with crucial national policy papers. This is carried out to guarantee the safeguarding and preservation of these vital regions [17,18,19]. Regarding other parameters in the PLUS model, a series of repeated adjustments and backward-looking verifications are carried out. These activities are combined with historical land use data to pinpoint the combination of parameters that results in the highest fitting precision under various scenarios. Subsequently, this optimized set of parameters is chosen for conducting future multi-scenario simulations.

3.3. GeoSOS-FLUS Model

The GeoSOS-FLUS model, formulated by Liu Xiaoping and colleagues, adheres to the tenets of the FLUS model and the Geographical Simulation and Optimization System (GeoSOS). It is engineered to conduct multi-scenario simulations of future land utilization on both global and local scales. The fundamental mechanisms of this model consist of calculating suitability probabilities, engaging in adaptive inertia competition, and performing spatial iterative simulations. To begin with, the neural network grasps the non-linear correlation between alterations in land use and influencing factors, thereby generating the suitability probability distribution for every land use category. Subsequently, the adaptive inertia mechanism modifies the threshold for land use transformation in a dynamic manner. At the spatially explicit level, the roulette wheel selection approach is employed to bring about competitive shifts in the cellular state. Eventually, via numerous rounds of iteration and adjustments to scenario parameters, the model simulates diverse development strategies under different scenarios. This study evaluates the precision of the land use simulation for the year 2020 carried out with the PLUS model. Additionally, a control group experiment involving the GeoSOS-FLUS model is incorporated to validate the benefits of the PLUS model in multi-scenario land use simulations [18].

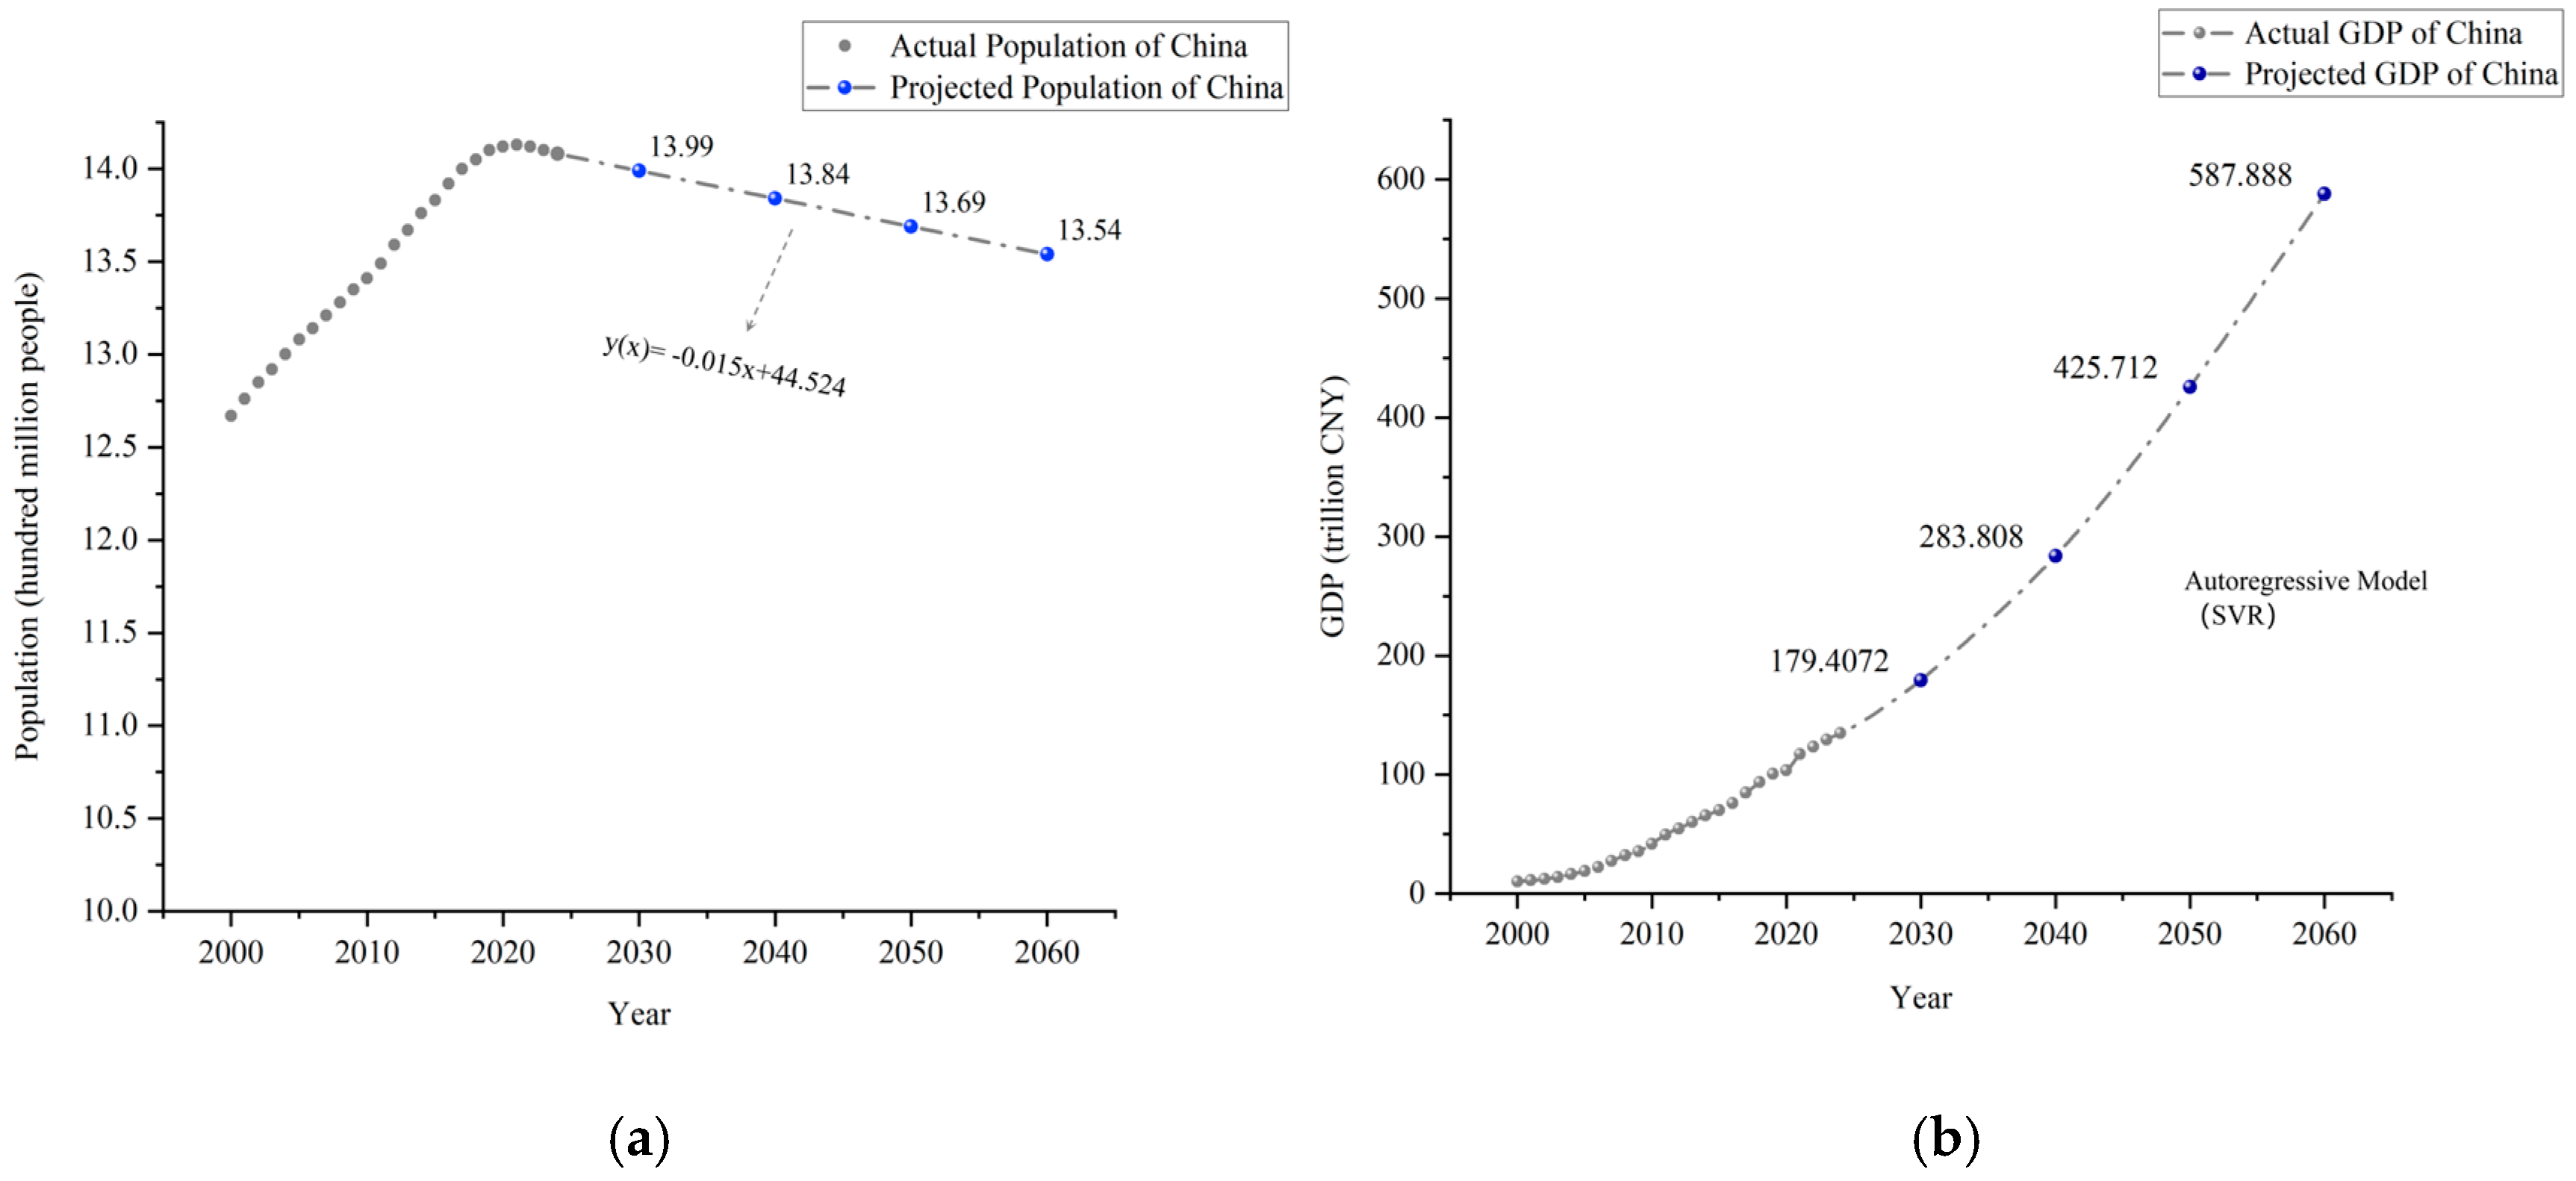
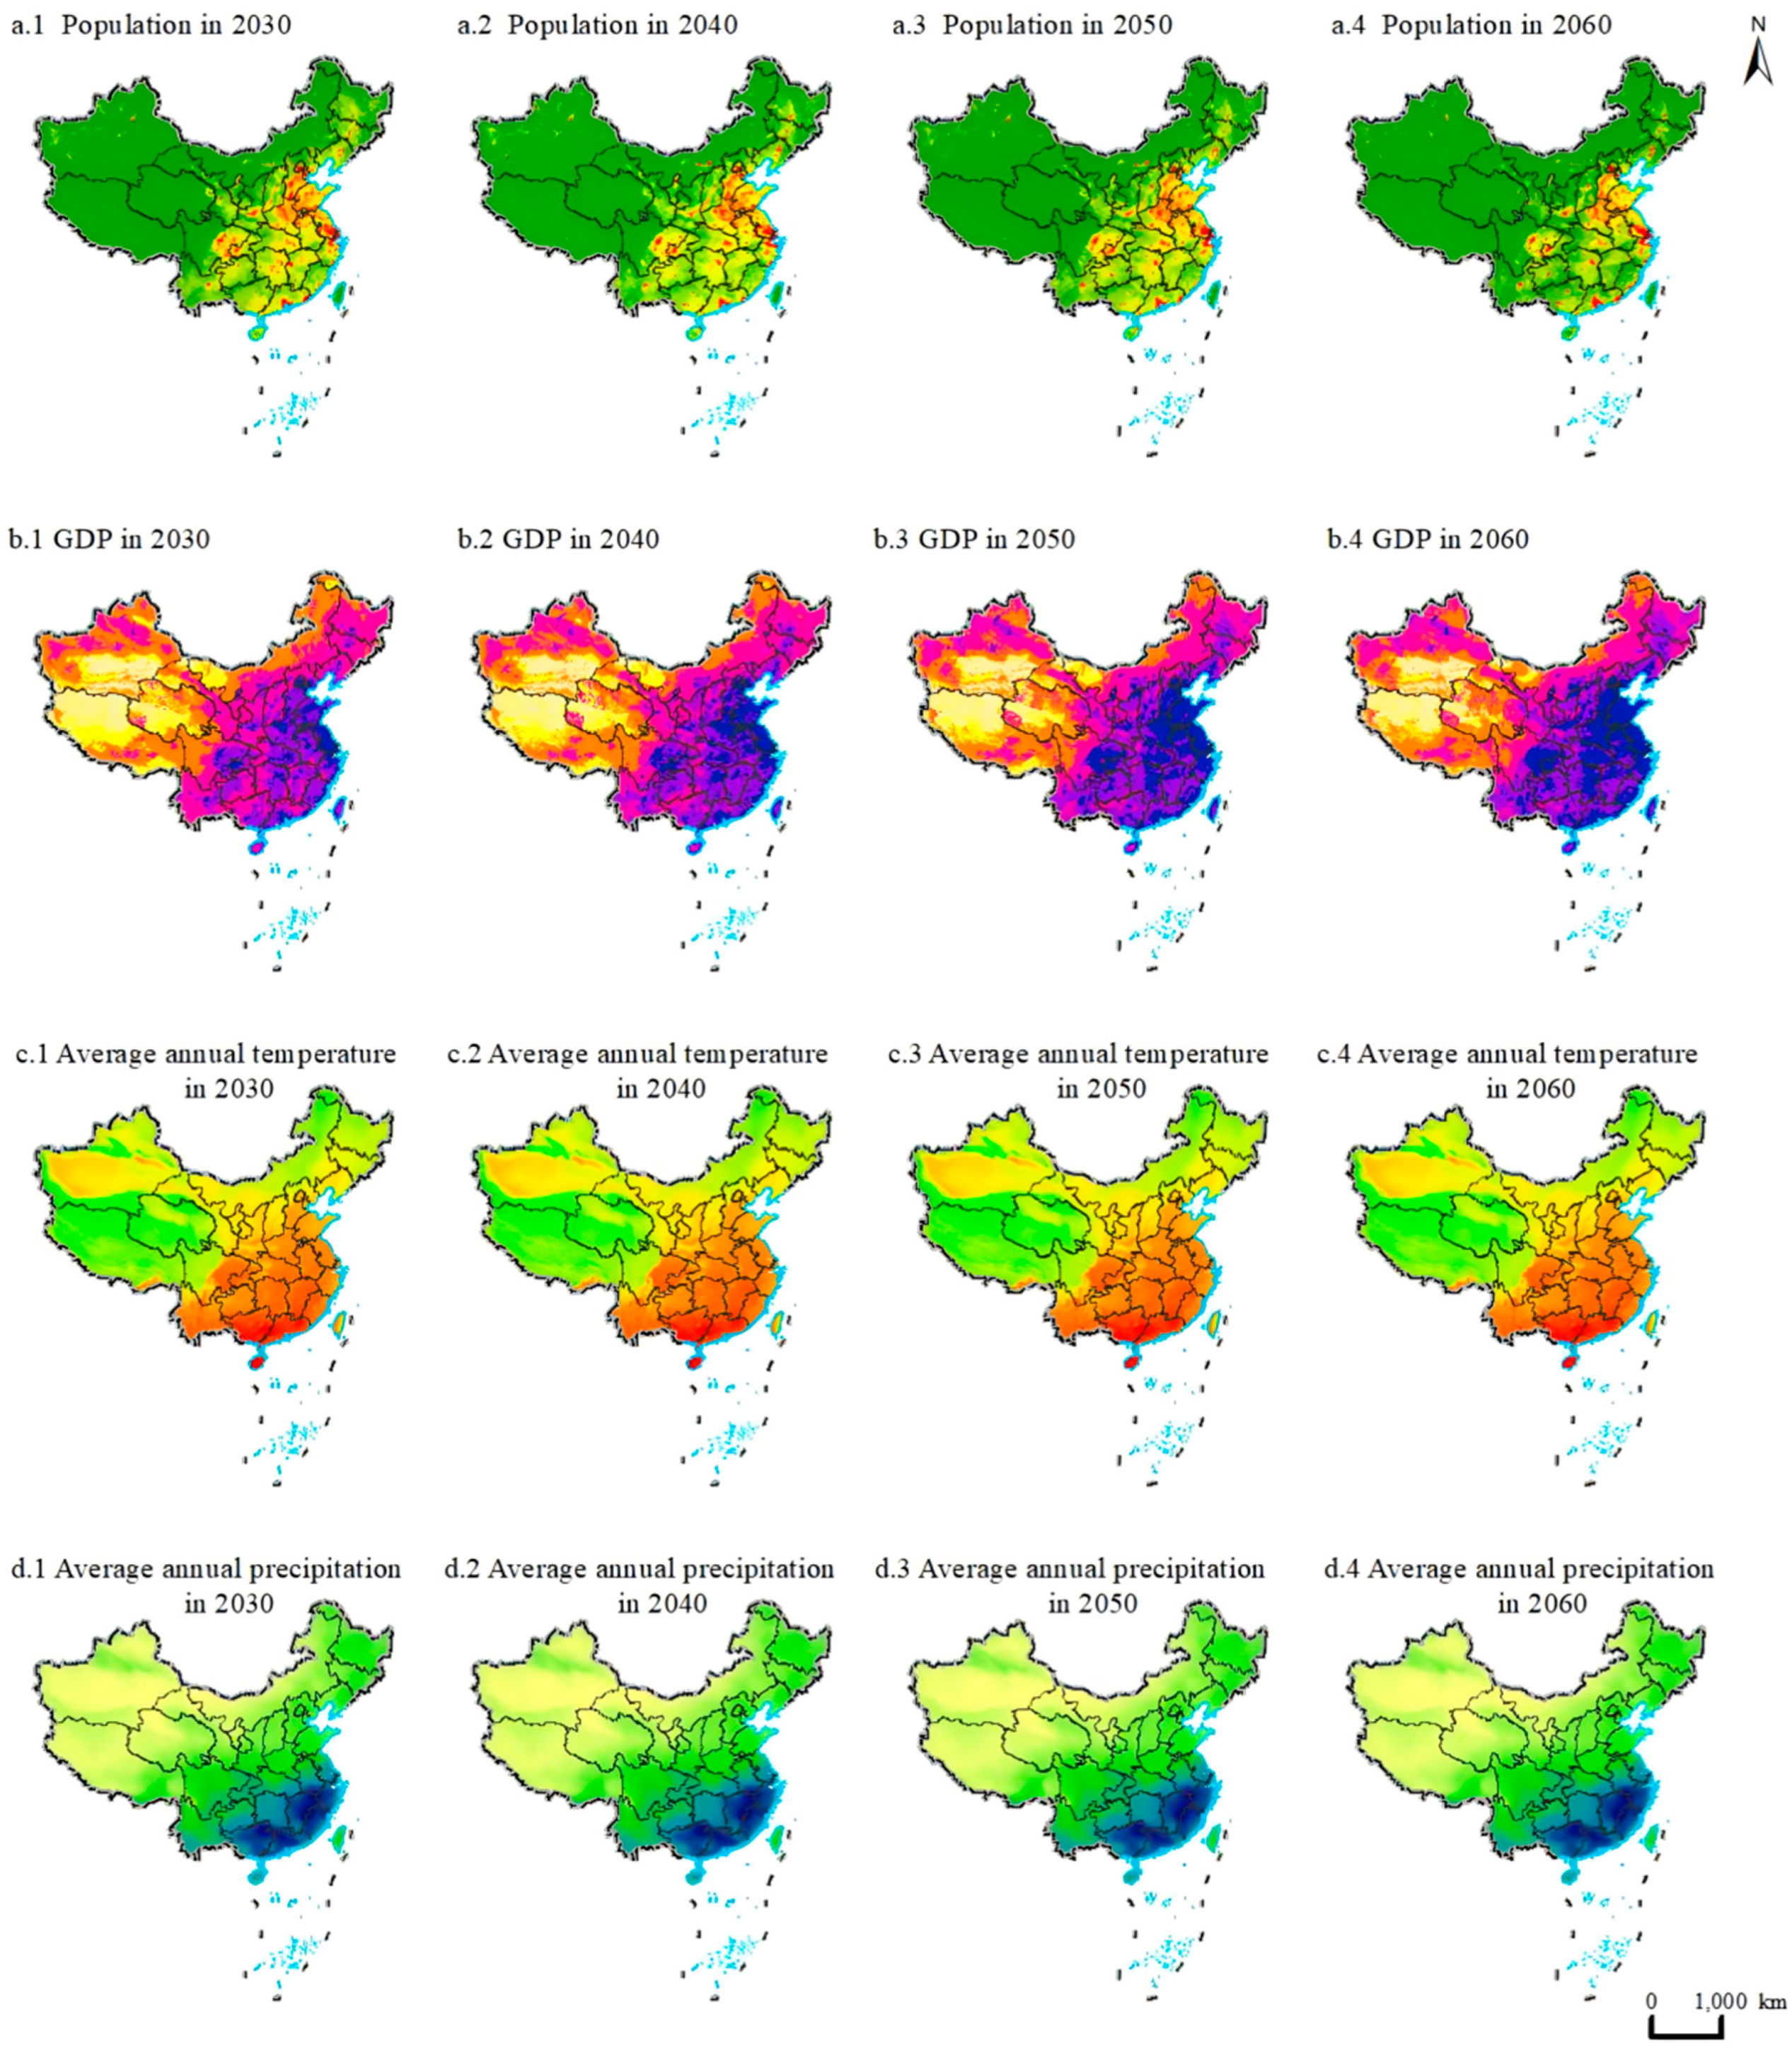
3.4. Extrapolation of Trends in Influencing Factors from 2030 to 2060

When dealing with factors that are likely to vary over time, such as population, gross domestic product (GDP), annual mean temperature, and annual mean precipitation, a fitting function is formulated using multi-period historical data. In recent years (from 2021 to 2024), China has witnessed a gradual transition of its population towards negative growth. Taking into account the population trend during this time frame, a segmented linear regression approach is employed for fitting. Regarding the GDP forecast, it relies on the national income statistics released by the National Bureau of Statistics of China spanning from 2000 to 2024. An autoregressive model, specifically the Support Vector Regression (SVR), is utilized to project future trends [20]. In contrast, the trends of annual mean temperature and annual mean precipitation are relatively steady, with only minor overall fluctuations. Therefore, unit linear regression is applied to extrapolate their future values. Figure 2 presents the trends of population and GDP data from 2030 to 2060 following trend extrapolation.
A grid map (Figure 3) was created by performing spatial analysis on the projected data of population, gross domestic product (GDP), mean annual temperature, and annual precipitation spanning from 2030 to 2060. This grid map was then used to substitute the relevant influencing factors in the land use simulations for each interval between 2030 and 2060. Subsequently, it played a part in the simulation of future land use changes, leveraging the data from future projections.

3.5. Scenario Settings

Within the realm of land use research, policy direction serves as a fundamental element propelling land use alterations. This investigation is firmly based on China’s policies and primary objectives for protected land use. It builds upon a substantial body of excellent research conducted by prior scholars [21,22,23,24,25,26,27,28]. At the data-setting stage, it comprehensively incorporates the national policy development trends and formulates six development scenarios: natural progression, economic advancement, contraction management, cultivated land safeguarding, ecological conservation, and sustainable growth. These scenarios present a more varied viewpoint for policy selection. They offer a well-rounded and scientifically sound theoretical framework along with practical guidance for refining China’s land use protection and planning. The specific settings for each scenario are detailed in Table 2.
The scenario of natural development denotes the perpetuation of the historical law of development. Specifically, it is the mode of evolution for the land use pattern under stable policy conditions. This scenario reflects the inherent, spontaneous evolutionary law of land use in the absence of policy interference. The economic development scenario takes economic construction as its main driving factor. It models the clustering effect of construction land and predicts its spatial expansion tendencies. The contraction control scenario places emphasis on enhancing land use intensity. It simulates the characteristics of land use change as urban development nears its saturation point. Within the context of cultivated land safeguarding, areas where restrictions are imposed on cultivated land are demarcated. According to relevant documents like “The Letter of the Ministry of Natural Resources on Conducting the Demarcation of the ‘Three Zones and Three Lines’ Nationwide”, land with a slope of less than 25°, land that is concentrated and continuous in distribution, and land outside ecological protection zones are selected. This selection is made to support the restoration and supplementation of cultivated land. The ecological protection scenario identifies ecological restriction areas. These include water bodies and primary river regions larger than 10 square kilometers, terrain areas with an elevation above 950 m (3800 m in the western regions) and a slope greater than 25°, as well as areas within the boundaries of national and provincial nature reserves as of 2022. The sustainable development scenario simulation gives priority to the coordinated safeguarding of ecological and cultivated land resources. It comprehensively takes into account the land conversion rules and restricted areas from the other scenarios.

3.6. Model Simulation Accuracy Evaluation

Numerous scholars, both from within the country and abroad, have employed the kappa coefficient and overall accuracy (OA) to assess the precision of land use simulation outcomes. Nevertheless, in large-scale regional simulations, when the area of land use alteration accounts for only a minor portion of the entire study area, conventional evaluation approaches relying on confusion matrices, like the kappa coefficient and OA, frequently struggle to precisely represent the authenticity of the simulation results. To tackle this problem, this research devises a multi-index collaborative evaluation system. Besides keeping the kappa coefficient and OA, the quality factor (figure of merit, FoM) is incorporated. FoM assesses the model’s simulation performance by quantifying the congruence between actual change patterns and the simulation results, presenting a more all-encompassing evaluation of simulation precision. The FoM value lies between 0 and 1. Although the majority of studies suggest that this value is generally low (below 0.3), it is more responsive to the simulation accuracy of change areas and can more efficiently reflect a model’s capacity to capture land use changes [29,30,31,32,33].

3.7. Carbon Emission Calculation

3.7.1. Direct Carbon Emission Accounting Model for Land Use

Direct carbon emissions mainly stem from the carbon source and carbon sink impacts of various land use categories. These emissions are computed by employing the carbon emission coefficient approach:
C i = e i = S i × δ i
In the formula, C i represents the total direct carbon emissions.
e i represents the carbon emissions associated with different land use types.
S i represents the area of different land use types.
δ i represents the carbon emission coefficient of different land use types.
Considering the influence of regional features and land utilization management strategies, and referring to past studies, the Table 3 below shows the carbon emission factors for different land use categories [34,35,36].

3.7.2. Indirect Carbon Emission Accounting Model for Land Use

The carbon emissions stemming from construction land mainly arise from the growth of secondary and tertiary industries, which devour substantial quantities of energy (Table 4) [37]. This research indirectly gauges these emissions by relying on the energy utilization of construction land. The formula is presented as follows:
C j = i = 1 n M i × E i × Q i
In the formula, C j represents the indirect carbon emissions.
M i represents energy consumption.
E i represents the standard coal conversion factor of the main energy source.
Q i represents the carbon emission coefficient of various energy sources.

3.7.3. Land Use Net Carbon Emission Accounting

The total carbon emissions resulting from land use are equivalent to the aggregate of its direct and indirect carbon emissions [38,39,40]. The corresponding formula is presented below:
C = C i + C j
In the formula, C represents the net carbon emissions from land use.
C i represents the direct carbon emissions from land use.
C j represents the indirect carbon emissions from land use.

4. Results

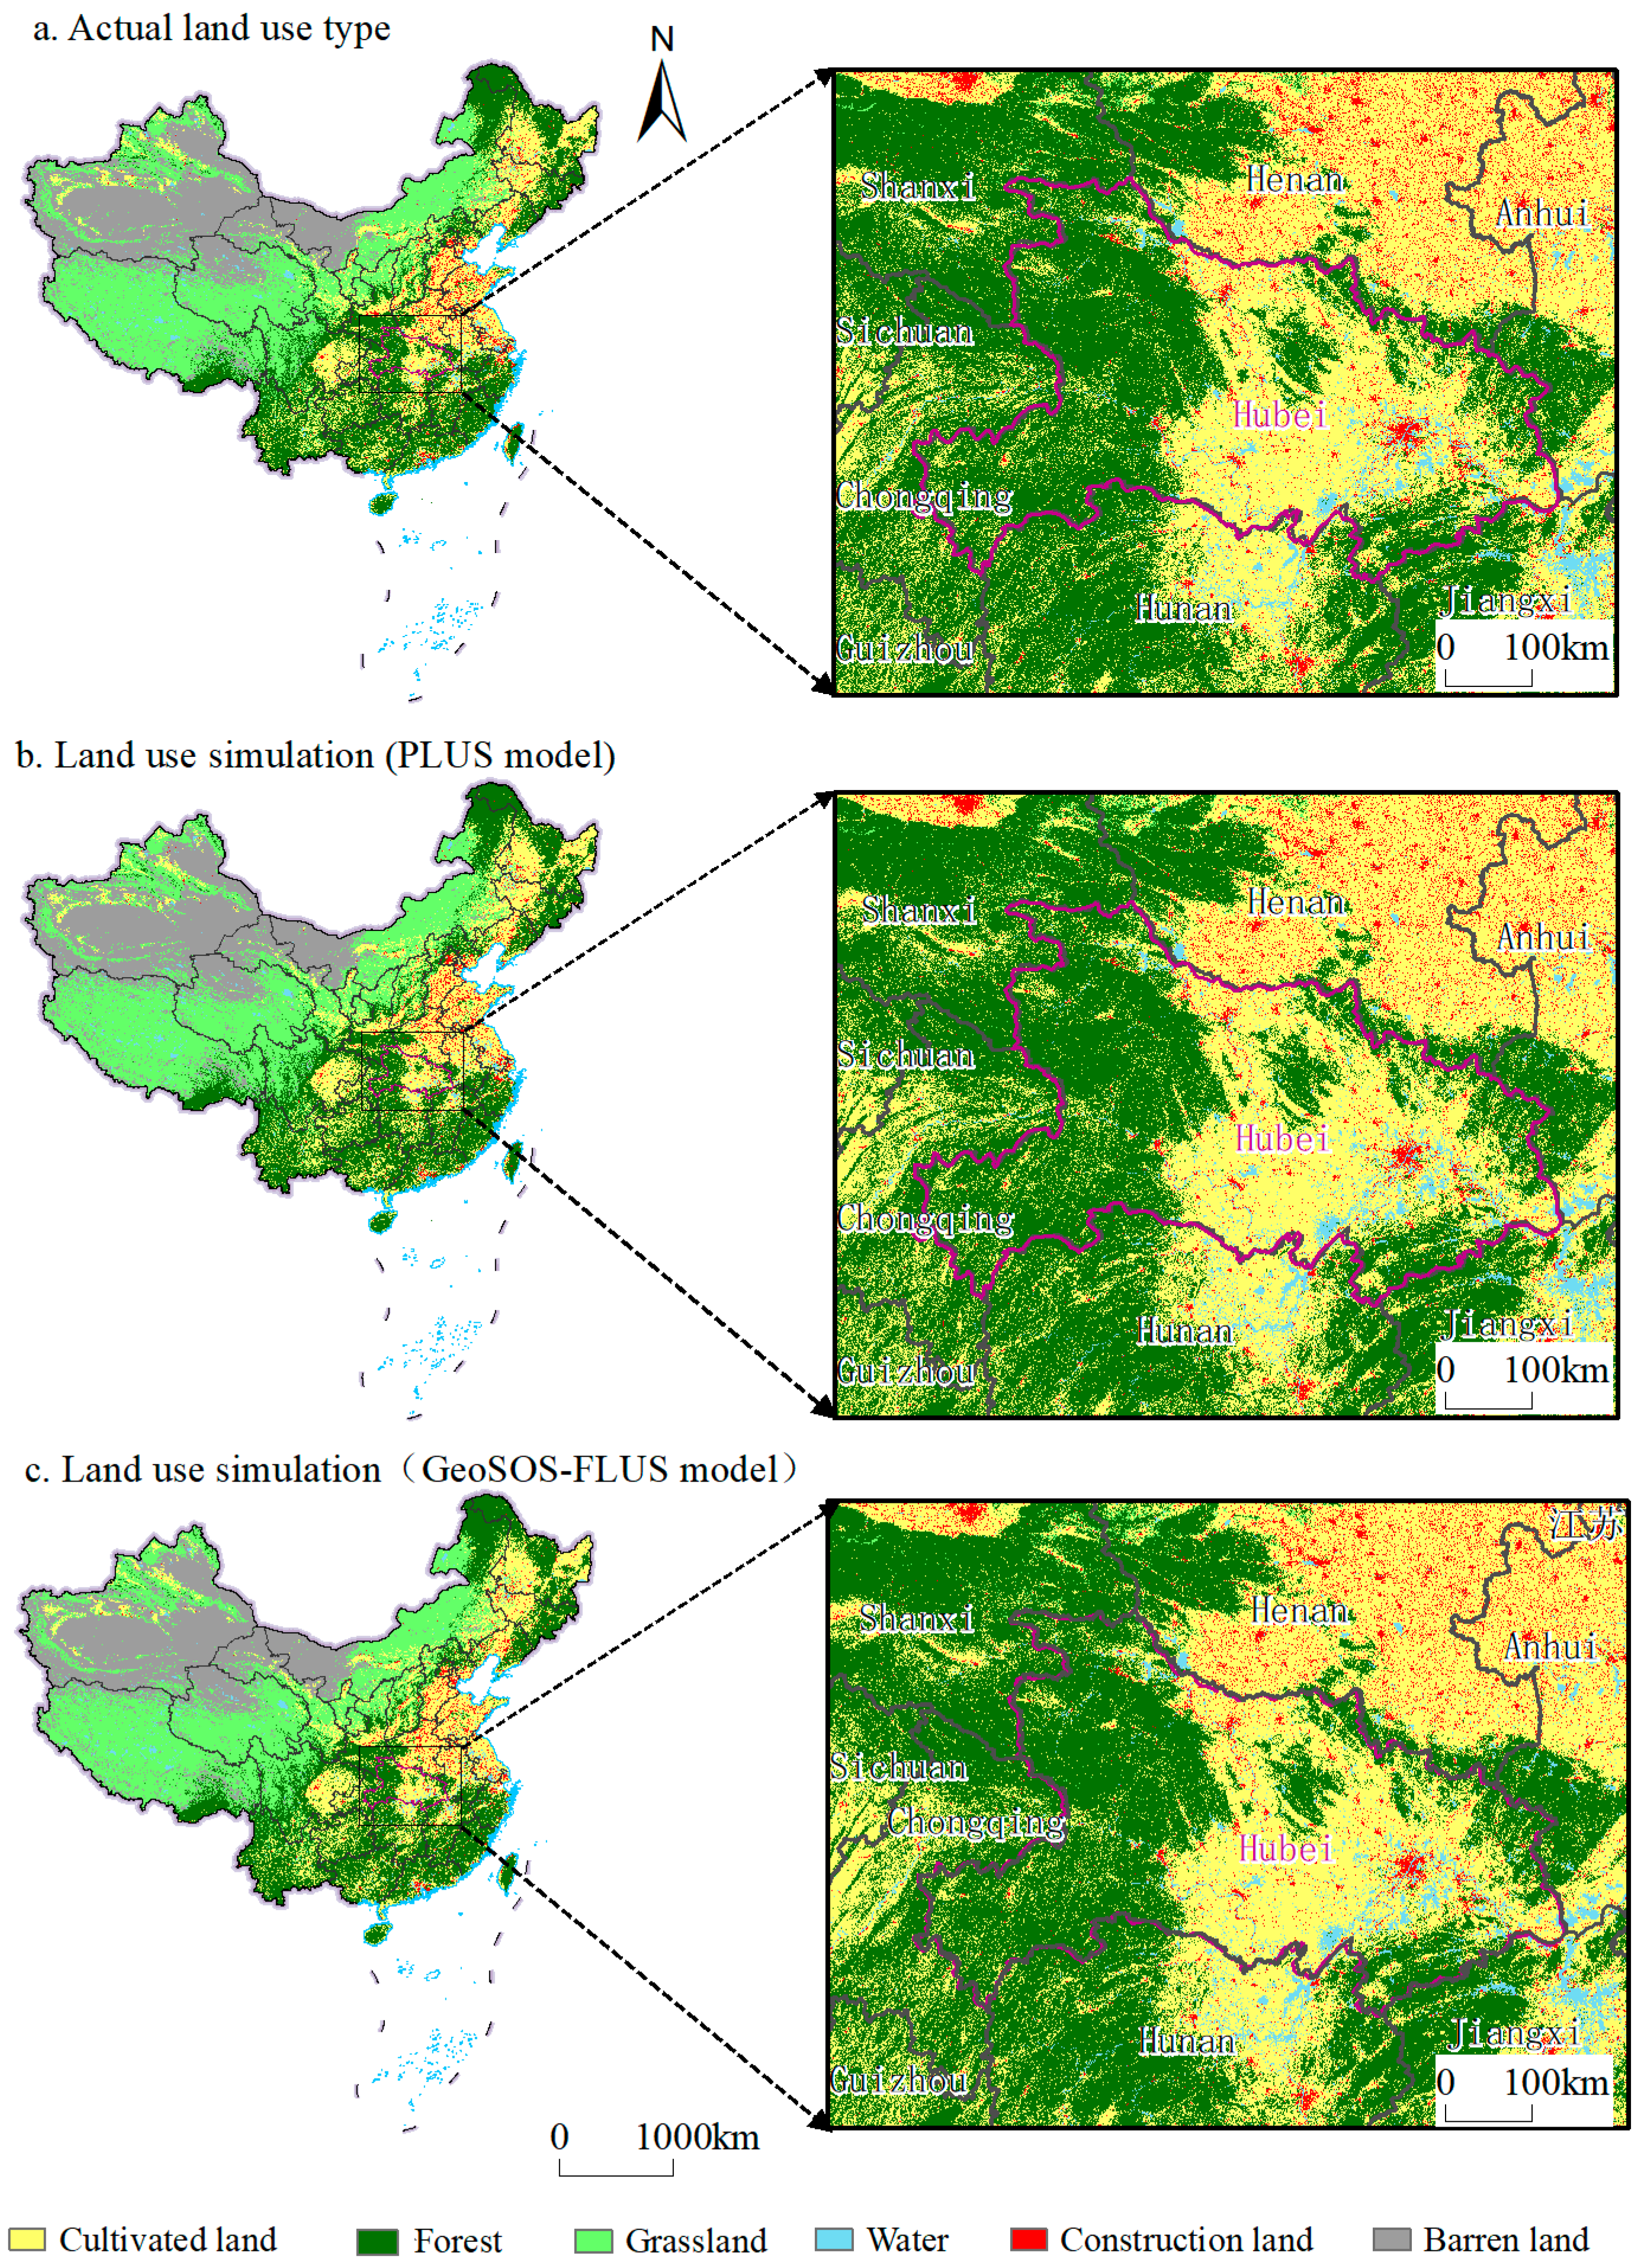
4.1. Accuracy Evaluation

In this research, the land use outcomes of six scenarios generated by the PLUS and GeoSOS-FLUS models in 2020 are contrasted with the real land use data for the same year. Moreover, a control group was incorporated, which did not employ the impact-factor prediction approach. This specific group incorporated the 2010 data regarding population, gross domestic product (GDP), average annual temperature, and average annual precipitation into the 2020 land use simulation; this is referred to as the fixed-impact-factor group. The other configurations of the models were maintained consistent with those of the natural development scenario devoid of policy intervention. This arrangement aimed to verify the precision of the land use simulation amidst the dynamic changes in the influencing factors (Table 5).
In this research, the land use outcomes of six scenarios generated by the PLUS and GeoSOS-FLUS models in 2020 are contrasted with the real land use data for the same year. Moreover, a control group was incorporated. This group did not employ the impact factor prediction approach. Rather, it input the 2010 data regarding population, the total value of all goods and services produced within a country (GDP), the average annual temperature, and the average annual rainfall into the 2020 land use simulation (referred to as the fixed impact factor group). The remaining model configurations were kept in line with those of the natural development scenario without policy interference. This action was carried out to verify the precision of the land use simulation amidst the dynamic fluctuations of the influencing factors.
The findings indicate that when the influencing factors are incorporated into the model as projected values, the three accuracy metrics—the values of the Overall Precision (OP), Cohen’s kappa statistic, and Measure of Excellence (MoE)—of the PLUS and GeoSOS-FLUS models in each scenario are notably superior to those of the fixed influencing factor group without the prediction approach. In the six scenarios of the PLUS model, the OA surpasses 90%, the kappa coefficient is greater than 0.88, and the FoM value is above 0.35. When compared to the GeoSOS-FLUS model, the PLUS model has an OA that is 0.94% to 6.61% greater and an FoM value that is 2.93% to 3.95% higher. This clearly shows that the PLUS model exhibits more excellent accuracy indicators. Moreover, by comparing the comprehensive and partial maps of China’s land use simulation outcomes in the 2020 sustainable development scenario with the actual land use situations (Figure 4), Evidently, the PLUS model demonstrates a greater capacity for precise simulation and outperforms the GeoSOS-FLUS model when it comes to land use simulation. In the evaluation index system chosen for this research, the simulation results of the two models under the sustainable development scenario present better numerical manifestations compared to other development scenarios, suggesting a more practical and beneficial development model.
In conclusion, the PLUS model demonstrates a higher degree of applicability when compared to the GeoSOS-FLUS model. This is achieved by utilizing a trend extrapolation approach for the influencing factors. It can more accurately predict the trends of land use changes in the research area. Furthermore, the spatial distribution patterns of various land utilization categories are in close alignment with the actual real-world data. Consequently, the subsequent part of this paper will center on a land use simulation strategy. This strategy takes into account the dynamic variations in influencing factors and employs the PLUS model. It will carry out multi-scenario simulations of China’s future land use from 2030 to 2060. Additionally, it will analyze the spatiotemporal evolution features of carbon emissions.

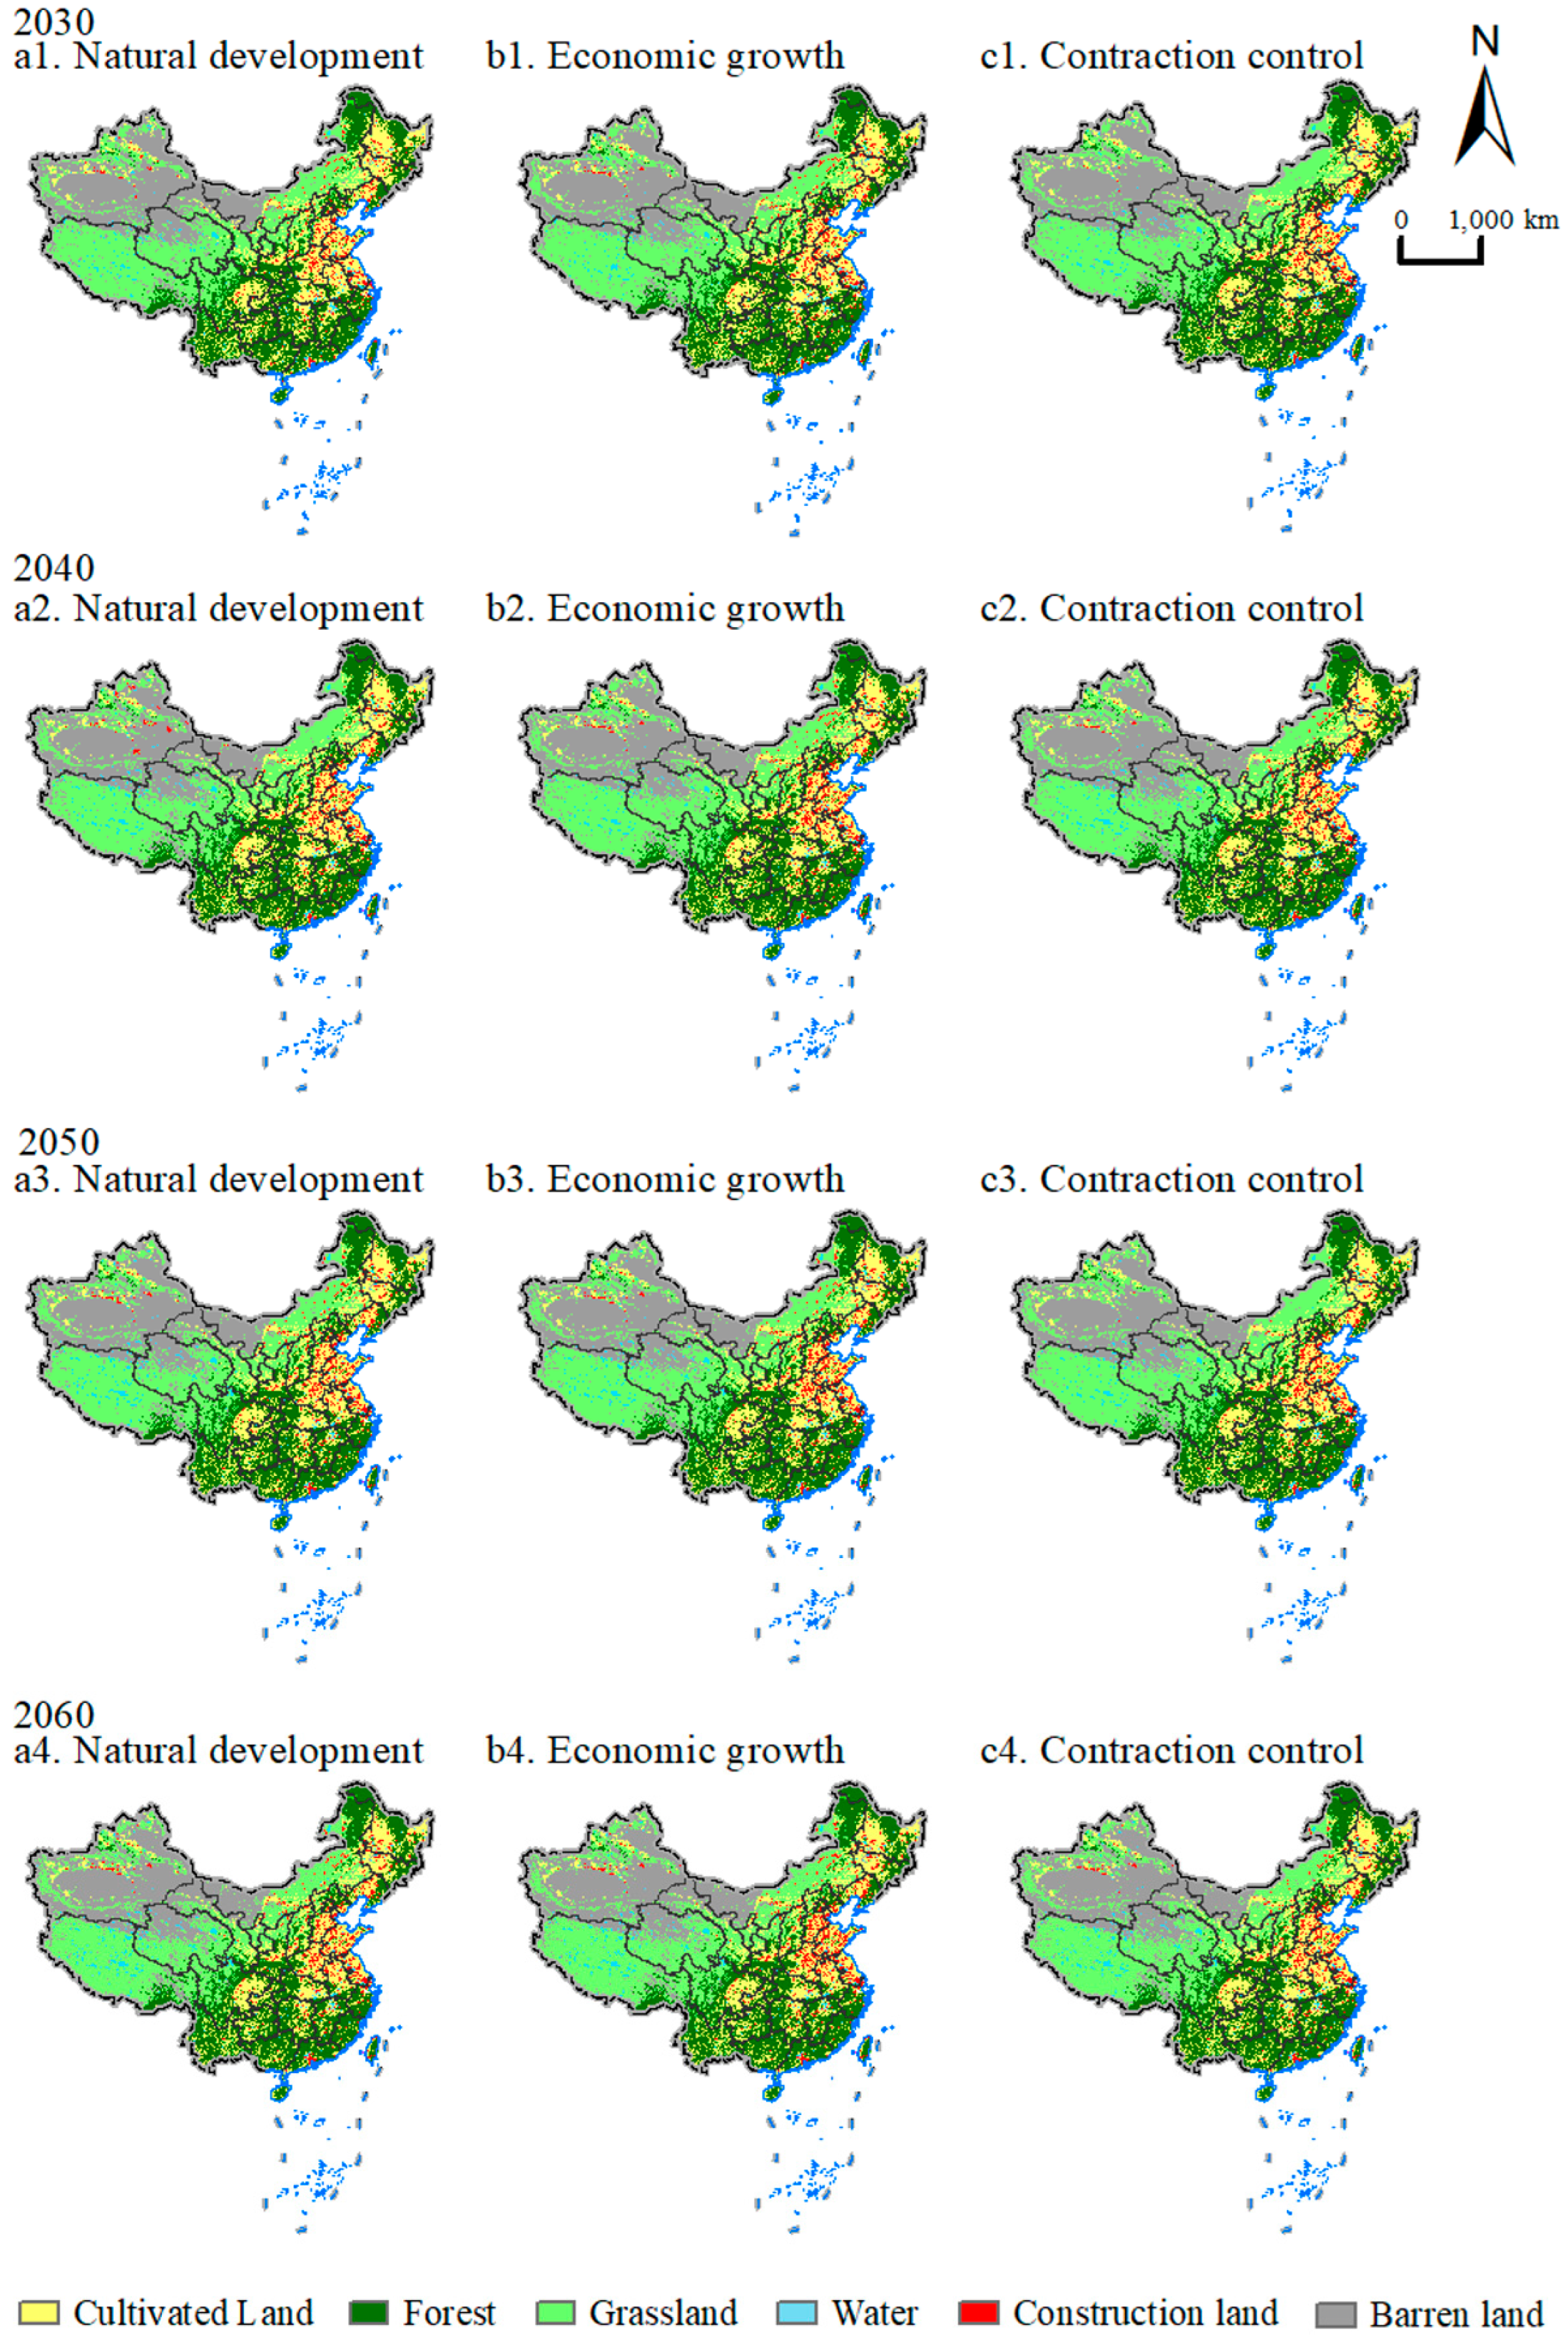
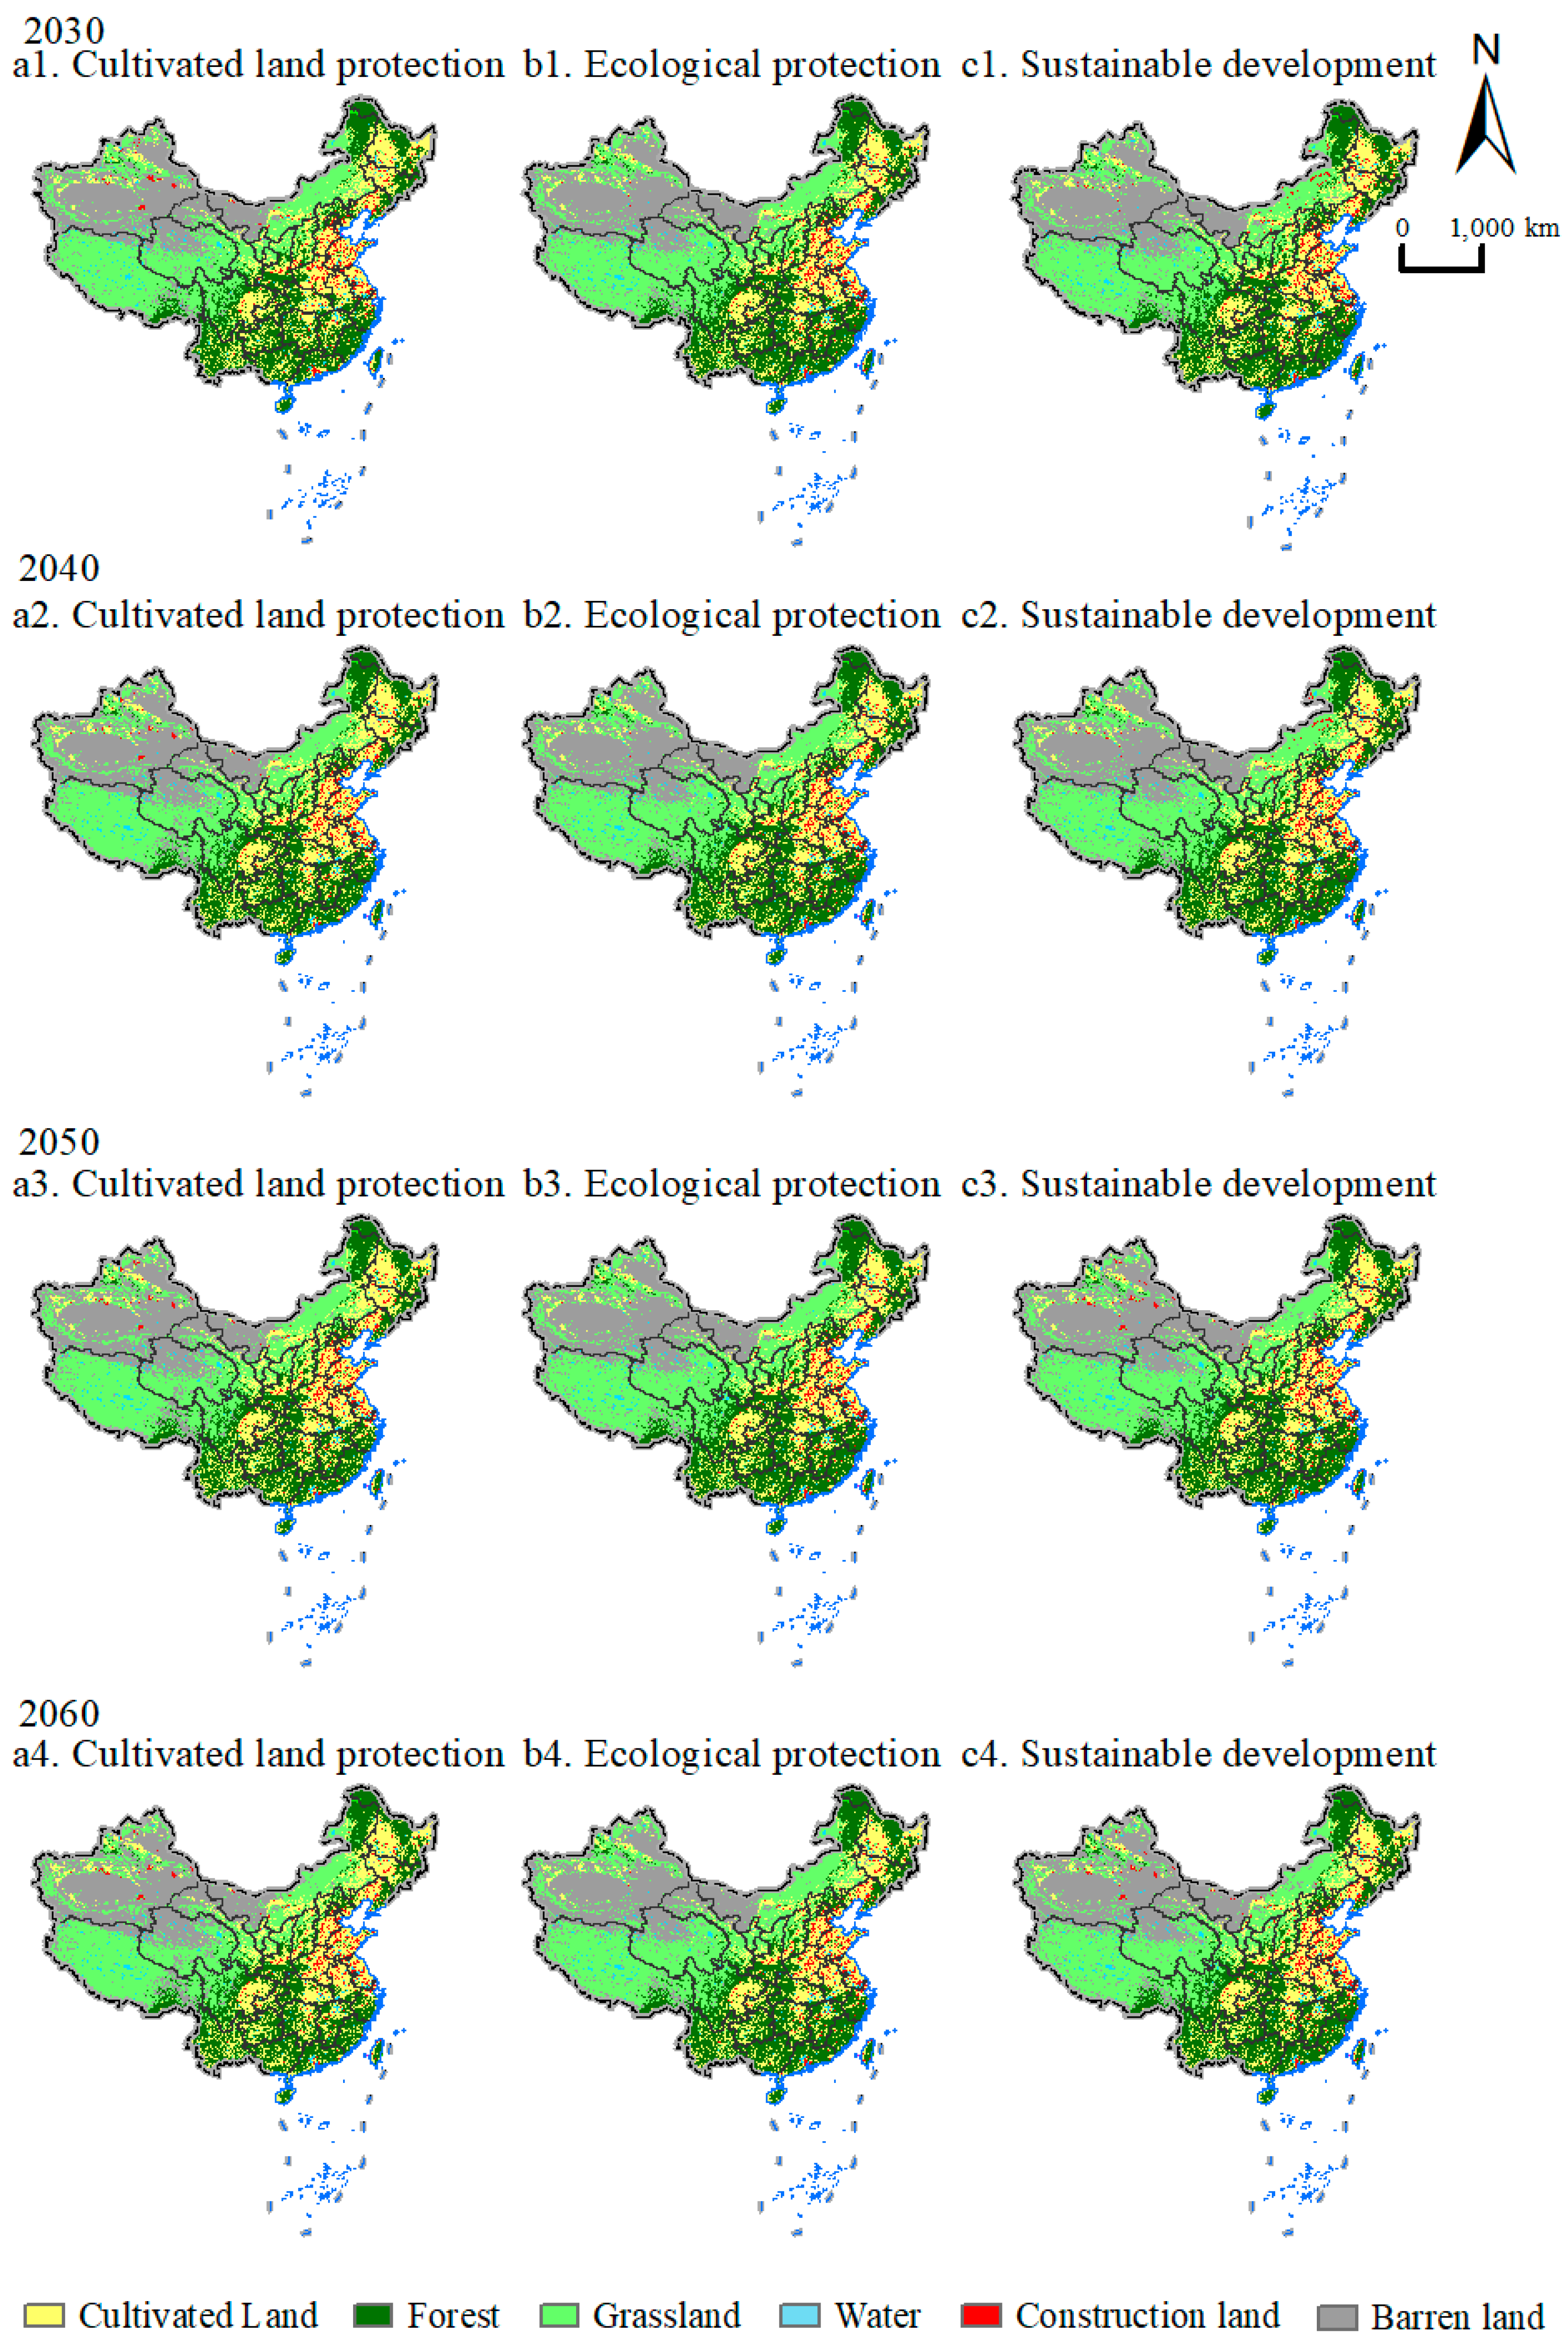
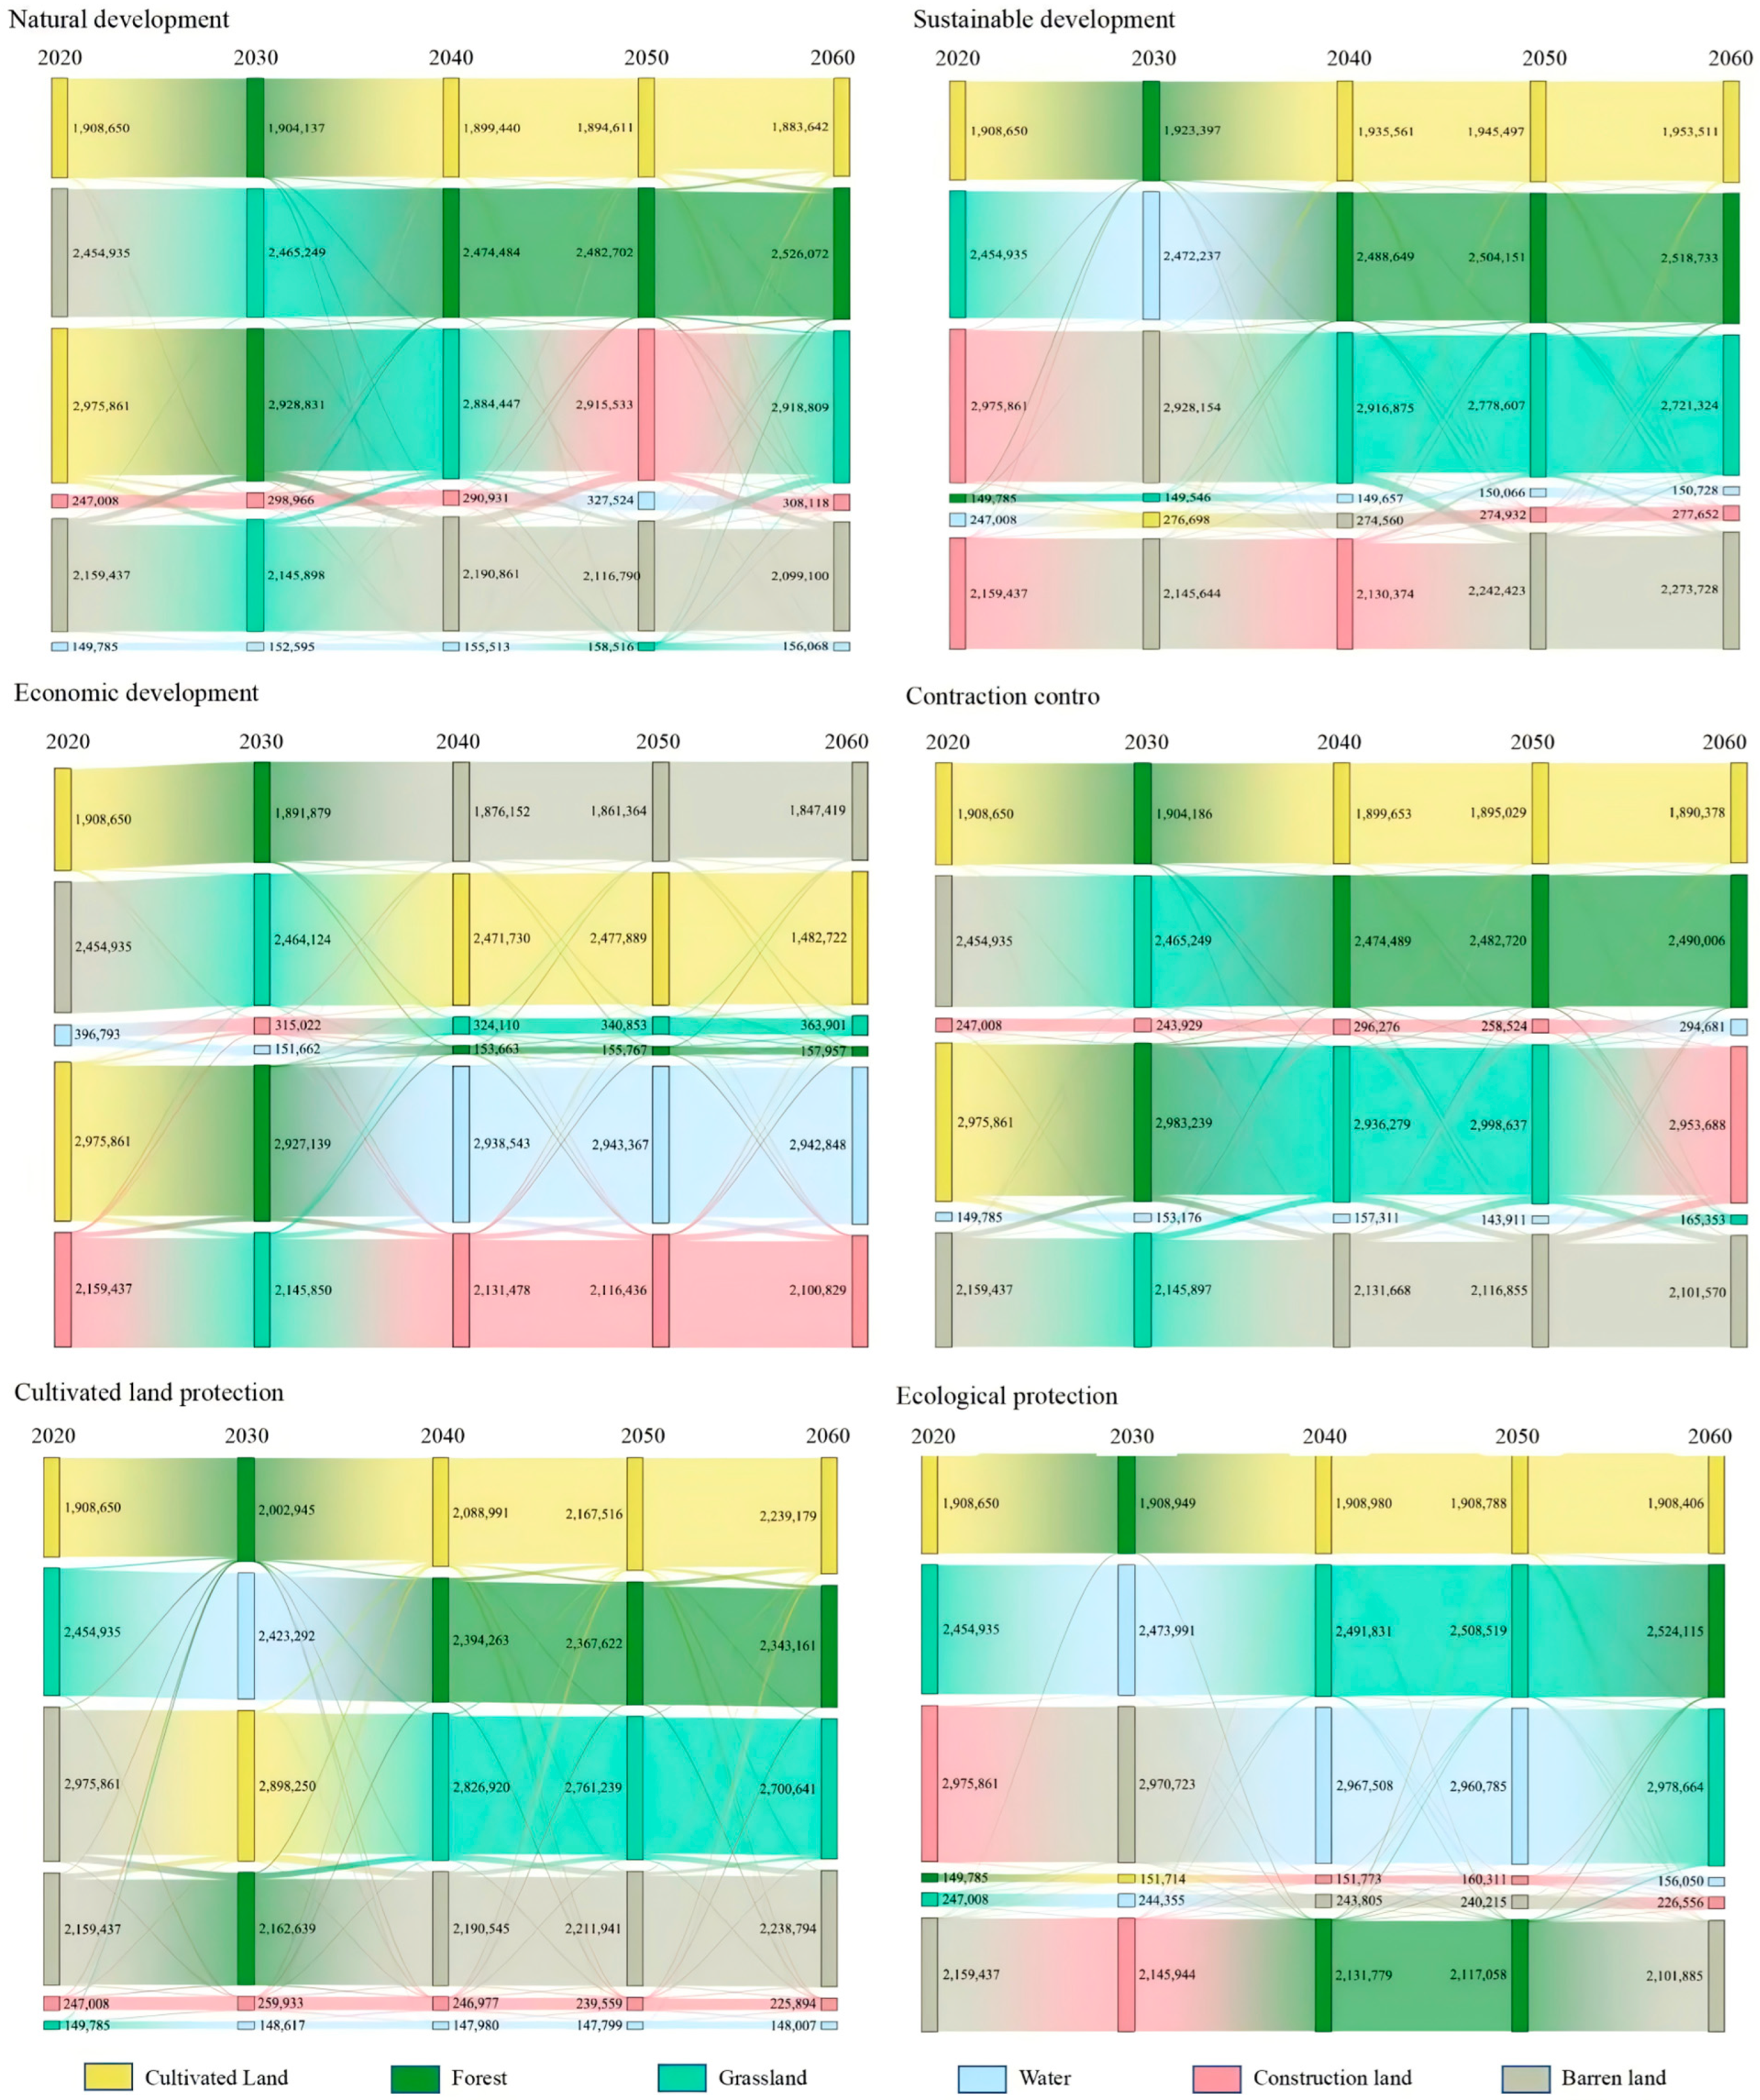
4.2. Analysis of the Spatiotemporal Evolution Characteristics of Land Use from 2030 to 2060

Figure 5 and Figure 6 showcase the outcomes of simulations conducted using the PLUS model across six distinct scenarios: natural progression, economic advancement, shrinkage regulation, arable land safeguarding, ecological preservation, and sustainable growth. To visualize the simulation results for each of these scenarios from 2030 to 2060, Sankey diagrams were generated with the help of Origin 2022 software. These diagrams are depicted in Figure 7.
In the natural development model, the unconstrained spread of built-up areas has caused a notable decline in productive and ecological land categories like farmland, woodland, pasture, and water bodies. This invasion of the pre-existing ecological setting and farmland directly endangers the long-term viability of the ecosystem. Within the framework of the economic development paradigm, the extensive expansion of developed land results in the extensive disappearance of agricultural land, pasture, and barren land. Although this model brings substantial gains in boosting economic growth and enhancing infrastructure, it also imposes significant stress on the ecological environment and farmland resources. Conversely, the contraction control model follows a trend of low-impact urban development suitable for the new era. The extent of built-up land is effectively curbed, the ecological environment is markedly enhanced, and urban space is optimized. Nevertheless, the reduction in built-up land may have a short-term adverse effect on economic growth. In the farmland protection model, spurred by conservation policies, more land is allocated to restoration work, guaranteeing the stability or a slight increase in the area of farmland. This model offers considerable advantages in safeguarding farmland resources and ensuring food supply, yet It additionally presents difficulties for the ecological surroundings and the urban development process. In the ecological protection model, ecological areas such as forests and grasslands expand significantly, while the growth of built-up land is restricted. This model provides substantial benefits for improving the ecological environment and conserving farmland resources. However, the necessary improvements in social management place significant pressure on economic growth. In the sustainable development model, the spatial transformation of land use types mainly shows a steady expansion of built-up land. At the same time, farmland and ecological resources are effectively protected. The changes in land use types display a favorable equilibrium, ensuring resource conservation and regional sustainability, which can effectively promote the balance among economic advancement, agricultural land safeguarding, and ecological conservation.
In the natural development context, the key feature of land use alteration is the transformation between arable land and built-up land. Over time, both arable land and wasteland steadily decline, whereas built-up land shows a consistent upward trend. Under the economic development situation, land use conversion mainly takes place among arable land, wasteland, and built-up land. A significant portion of the decreased area of arable and wasteland is reallocated to built-up land, which undergoes substantial expansion. In the contraction control scenario, the land area of reduced built-up land is predominantly converted into arable land, forest, and water bodies. This conversion helps alleviate the large-scale depletion of arable and ecological land brought about by economic development. In the context of arable land safeguarding, the significant growth in arable areas primarily stems from the transformation of grassy areas and developed land. For the ecological protection scenario, the growth of forest areas mainly stems from the transformation of built-up land and wasteland. Under the sustainable development scenario, land use conversion is mainly manifested as the reciprocal exchange between arable land and forest. Thanks to the “in-out balance” system for arable land protection, the area fluctuations of these two land use categories remain relatively stable, guaranteeing a certain degree of protection.

4.3. Analysis of the Spatiotemporal Evolution Characteristics of Land Use Carbon Emissions in China from 2000 to 2060

4.3.1. Dynamics of Land Use Carbon Emissions in China from 2000 to 2020

Utilizing the land use carbon emission calculation method, the carbon emissions, carbon sequestration, and net carbon emissions in China during the years 2000, 2010, and 2020 were calculated. The outcomes are presented in Table 6. The results indicate that China’s net carbon emissions have shown a consistent upward trend from 2000 to 2020. In 2000, the net carbon emissions were 177.14 Gt (Gt, where 1 Gt equals 109 tonnes), and this figure climbed to 382.48 Gt in 2020, representing a 1.16-fold increment. The growth in net carbon emissions was notably rapid between 2000 and 2010, registering a 73.66% rise. However, from 2010 to 2020, the growth rate decelerated significantly, with only a 24.33% increase. Throughout the research period, China’s total carbon sources continuously expanded. In 2000, the total carbon source was 19,274.53 Gt, and it reached 39,834.14 Gt in 2020, a cumulative increase of 106.67%. The most substantial growth took place from 2000 to 2010, at 67.80%, and the growth rate dropped to 23.16% after 2010. When considering various land use categories, the carbon emissions stemming from farmland showed a progressive decrease. In the year 2000, the amount of carbon emissions released by farmland reached 910.08 gigatons, and this value decreased to 882.51 Gt in 2020, a reduction of 3.03%. In contrast, the volume of carbon emissions originating from construction sites witnessed a dramatic upsurge, rising from 18,364.45 Gt to 38,951.63 Gt. By 2020, emissions from construction land constituted 97.78% of the total carbon source, highlighting its preeminent position in China’s carbon emission pattern. In the context of carbon sinks, China’s carbon sequestration marginally increased. In 2000, the carbon absorption was 1560.46 Gt, and it reached 1585.92 Gt in 2020, a 1.63% rise. Forests were the main carbon sink, accounting for 95.83% of the total carbon absorption, followed by grasslands at 3.86%. In 2020, the carbon absorption of grasslands was 61.16 Gt, a 1.47% decrease compared to 2000. Meanwhile, forests absorbed 1519.73 Gt, an increase of 26.00 Gt (or 1.74%) compared to 2000.

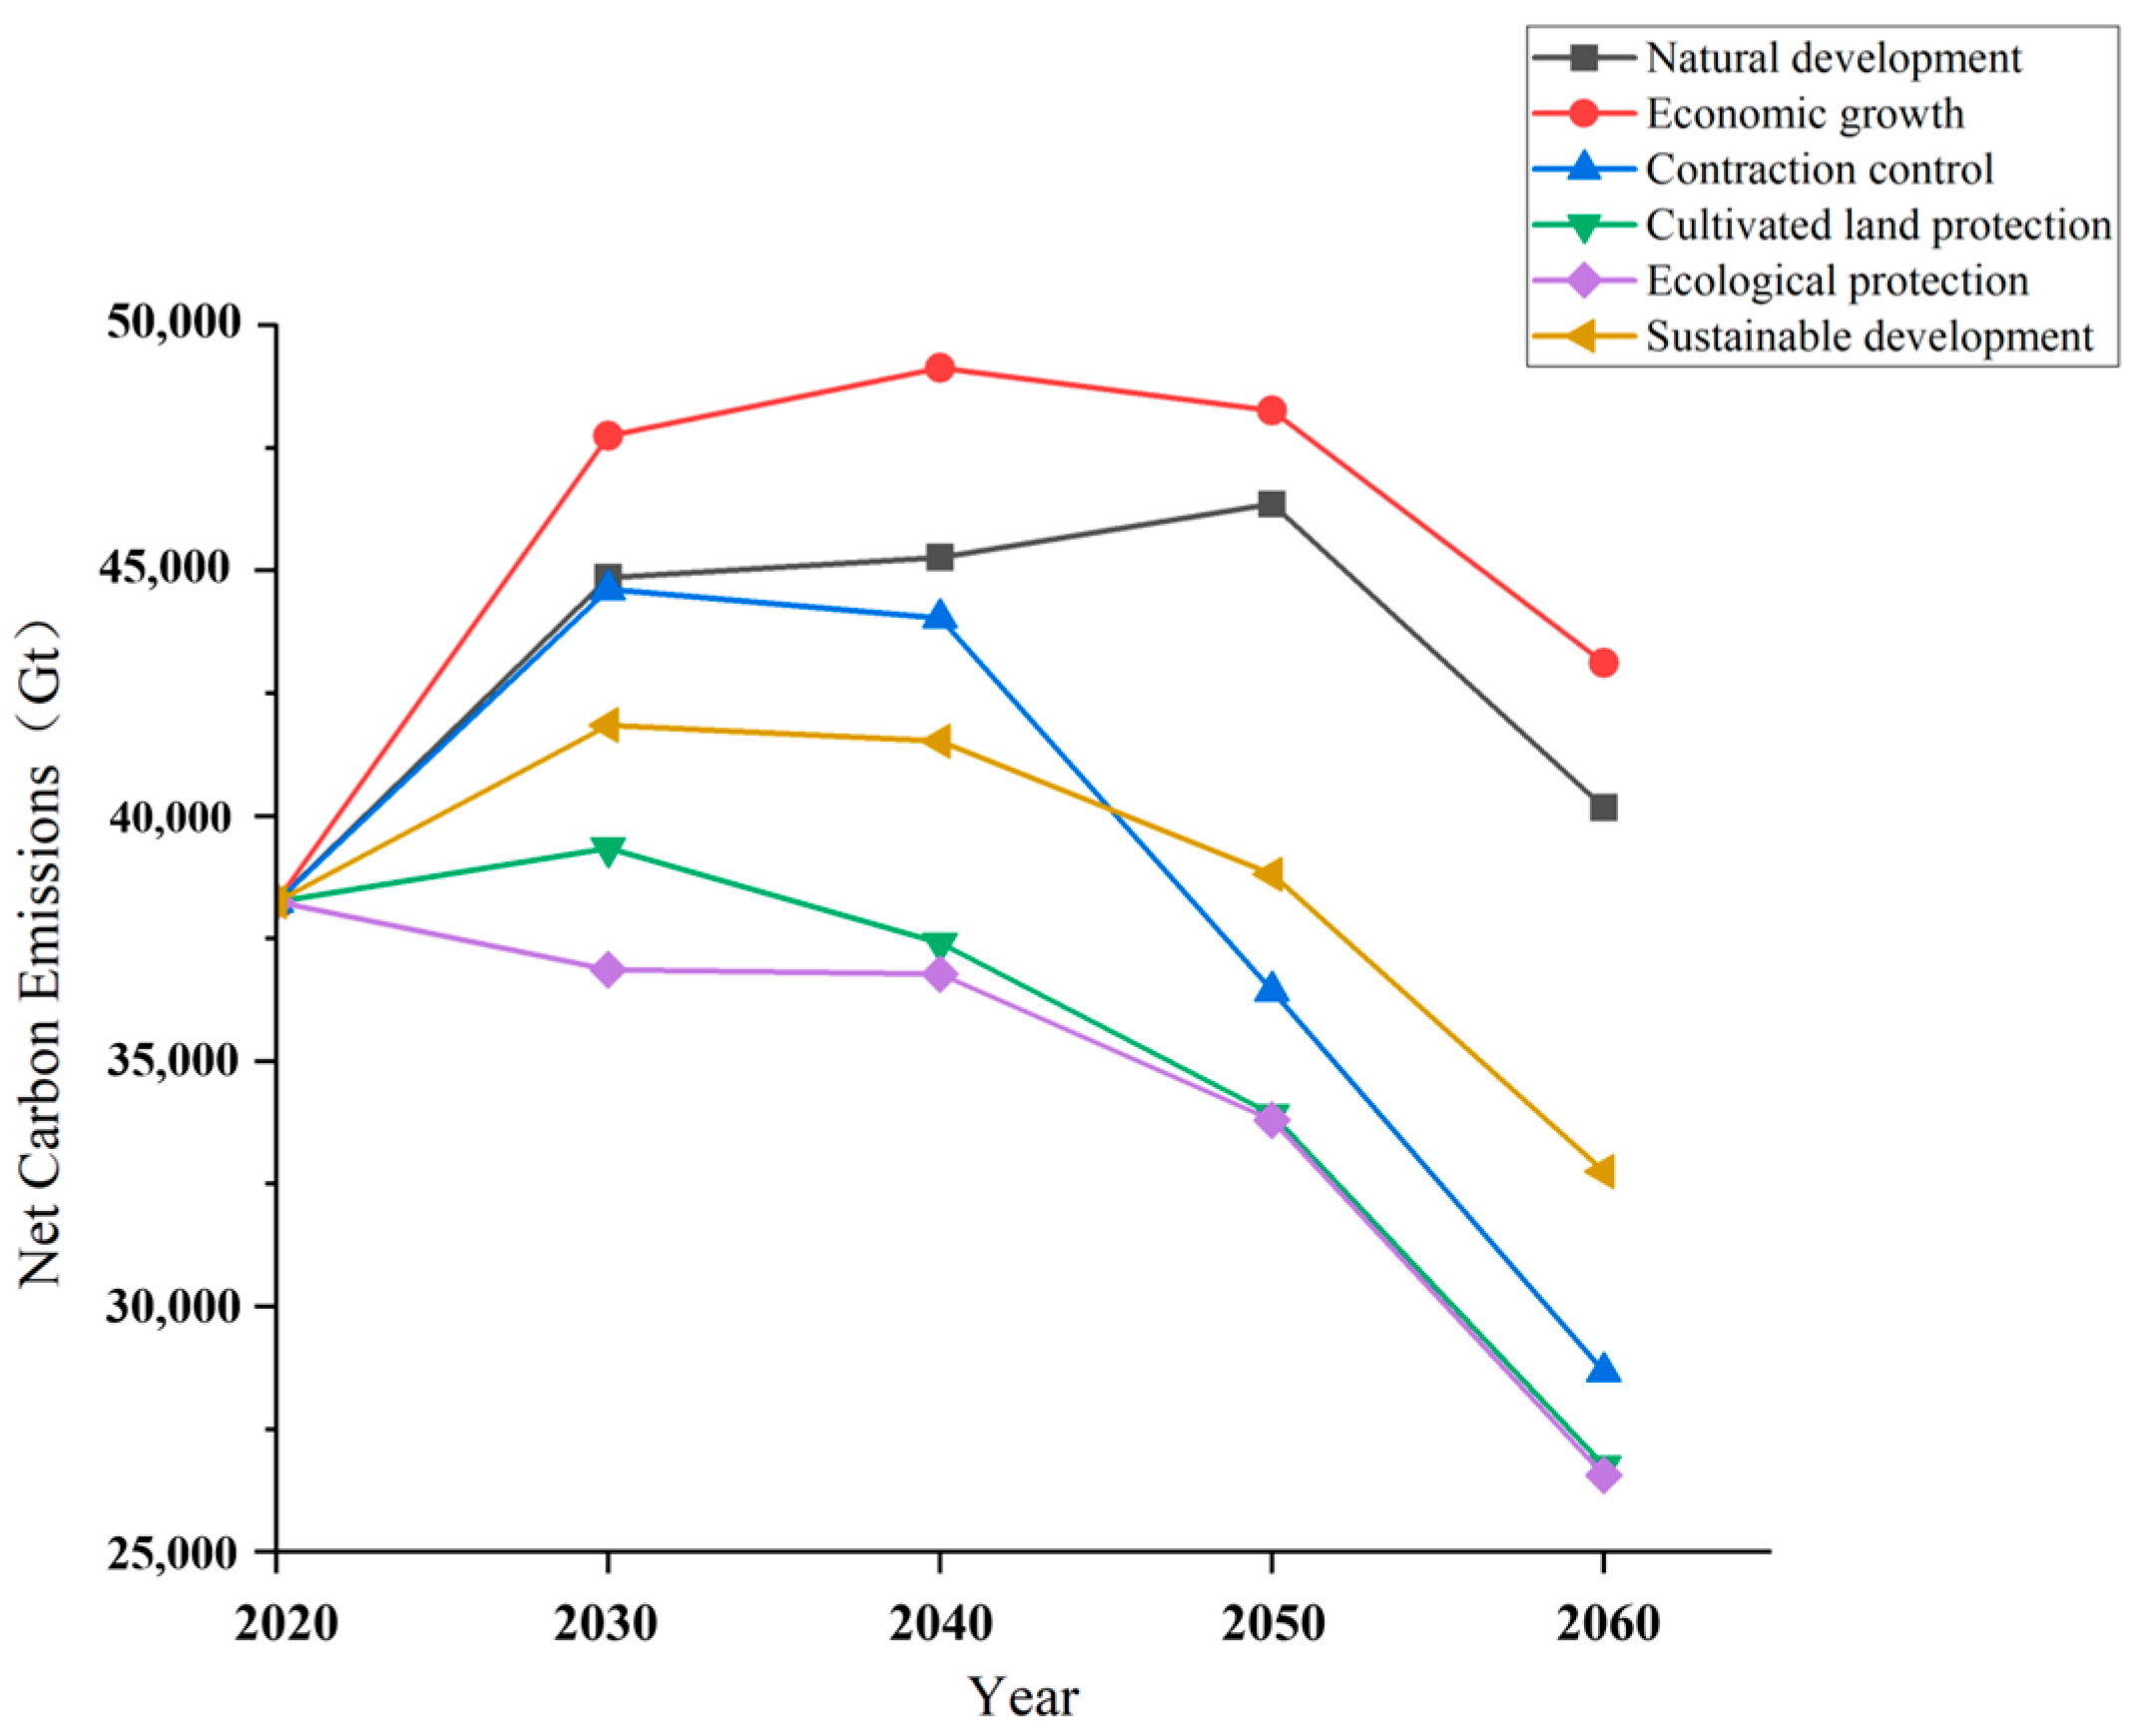
4.3.2. Dynamics of Land Use Carbon Emissions in China from 2030 to 2060

Table 7 showcases the projected outcomes of China’s net carbon emissions across diverse scenarios spanning from 2030 to 2060. These projections are founded on the computations of carbon emissions from cultivated land, forests, grasslands, water areas, and barren lands. In accordance with China’s “dual carbon” objectives, the nation intends to achieve a carbon peak prior to 2030. Subsequently, carbon emissions will gradually decline on an annual basis. Taking China’s net carbon emissions in 2020 as a benchmark and factoring in the overall net carbon emissions under the six scenario—based development models for the 2030–2060 period, Figure 8 depicts the predicted trends of carbon emission peaks across multiple scenarios.
When examining the years in which net carbon emissions reach their peaks across different scenarios, it becomes evident that the scenario of economic development registers the greatest emissions. Specifically, emissions under this scenario soar to 49,129.03 gigatons. This is followed by the natural development and contraction control scenarios. On the contrary, the ecological protection scenario exhibits the lowest net carbon emissions, hitting a peak of 38,248.21 gigatons in 2020. In the economic development scenario, China’s net carbon emissions are set to peak at 49,129.03 gigatons in 2040. This figure surpasses the peak emissions in the natural development scenario, which reaches 46,359.65 gigatons in 2050, and the peak in the contraction control scenario, which stands at 44,618.97 gigatons in 2030. There are multiple situations, specifically the scenarios of arable land safeguarding, ecological preservation, and sustainable advancement., prove effective in curbing total carbon emissions during their respective peak years. For instance, the cultivated land protection scenario reaches a peak of 39,347.88 gigatons in 2030. This amount is 7011.77 gigatons less than the peak emissions in the natural development scenario. Similarly, the sustainable development scenario is anticipated to peak at 41,859.07 gigatons in 2030, which is 4500.58 gigatons lower than the peak emissions in the natural development scenario.

4.3.3. Analysis of the Spatiotemporal Characteristics of Land Use Carbon Emissions in China from 2030 to 2060

Utilizing the results of the land use simulation and using the spatial arrangement of China’s net carbon emissions in 2020 as a reference point, Figure 9 depicts the computed spatial distributions of new carbon emission or absorption zones for each land use category across six scenarios. These scenarios are natural progression, economic advancement, contraction regulation, arable land safeguarding, ecological conservation, and sustainable growth.
This research uncovers the distribution traits of carbon sources and sinks in diverse regions via spatial analysis. In the natural development scenario, the eastern region and the western region of the People’s Republic of China are the main regions for new land use associated with carbon sources and sinks. Regarding carbon sinks, the newly added forest areas with carbon-absorbing capabilities are mostly situated in the southwestern part of the country, particularly in Sichuan. Meanwhile, carbon sinks like grasslands and water bodies are concentrated in western China, presenting continuous or strip-shaped patterns. When it comes to carbon sources, the newly added emission areas of construction land are mainly spread across regions such as eastern Hebei, Shandong, and Jiangsu, exhibiting a pattern of “concentrated and contiguous along with sporadic and scattered”.
In the context of economic development, there are marked disparities in the distribution of newly emerged carbon sink and carbon source regions between eastern and western China. Upon analyzing the carbon emissions and sequestration related to various land use types, the most significant spatial growth in carbon emissions is observed in urban or built-up areas. Concerning carbon sinks, the newly added areas capable of carbon absorption in grasslands, water bodies, and barren lands are mainly clustered in the western part of the country, presenting strip-shaped or planar patterns. Nevertheless, the newly added area is considerably smaller than that in the scenario of natural progression. As for carbon sources, the substantial reduction in arable land causes the spatial features of new carbon emissions from farmland to be less distinct. On the other hand, the robust economic development gives rise to more prominent new carbon emissions from built-up land, which have an impact on both eastern and western China. In the western region, these emissions are spread around provincial capitals. In the eastern region, they are concentrated in the central and eastern areas, encompassing the provinces of Hebei, Shandong, Jiangsu, Henan, and Anhui. The rapid economic expansion in coastal areas leads to a substantial rise in carbon emissions.
In the contraction control situation, the newly established carbon sink zones are predominantly concentrated in the western portion of the area. Conversely, when juxtaposed with both the natural progression and economic advancement scenario, there is a substantial decrease in the newly formed carbon source regions. Concerning carbon sinks, the most prominent rise in carbon uptake takes place in grasslands and wastelands, mainly situated in the western region. Meanwhile, the newly added areas where forests and water bodies absorb carbon are dispersed throughout the eastern region and Sichuan Province. Regarding carbon sources, in this scenario, the issue of cultivated land loss remains largely unresolved. As a result, there is merely a marginal rise in the newly produced carbon emissions stemming from cultivated land. Simultaneously, the execution of urban reduction policies in this scenario leads to a significant decline in the newly added carbon emission areas of construction land compared to the natural development scenario. These emissions are spread along the coastlines of Liaoning, Hebei, Shandong, and Jiangsu.
Within the framework of the scenario for protecting cultivated land, the newly emerged carbon sink regions continue to be mainly clustered in western China. Nevertheless, there is a substantial growth in carbon source areas in both the eastern and western parts of the country. Among them, the newly added carbon-emitting areas from cultivated land stand out most notably. When it comes to carbon sinks, grasslands and wastelands are the principal types of newly formed carbon-absorbing areas. These areas are predominantly situated in the western region. As for carbon sources, the newly added carbon-emitting areas from construction land are mainly scattered in specific spots within the eastern coastal provinces. Under this scenario, cultivated land resources receive better protection and replenishment. As a result, there is a more significant rise in newly added carbon emissions from cultivated land compared to other scenarios. These newly added emissions are spread across all Chinese provinces. The most substantial increases in cultivated land carbon emissions are witnessed in Northeast China, Inner Mongolia, Hebei, Shanxi, and northern Shaanxi, exceeding those of other provinces.
Within the framework of the ecological conservation scenario, the area of newly incorporated carbon-emitting regions is less extensive compared to other scenarios. Conversely, the area of new carbon absorption in forests shows the most substantial growth. When it comes to carbon sinks, ecological land resources including forests, grasslands, and water bodies experience effective enhancement. In grasslands, the newly added carbon-absorbing areas are mainly located in northern China. In contrast, the carbon-absorbing areas in water bodies are sporadically distributed throughout central China. Compared to scenarios like natural development, the newly added carbon-absorbing areas in forests have increased remarkably. The main concentrations of this growth are in Xinjiang, Sichuan, and Shaanxi provinces, while other provinces witness scattered expansions. Regarding carbon sources, the enforcement of ecological protection policies, like the conversion of cultivated land back to forest, results in a certain amount of loss of cultivated land. This poses challenges to fulfilling the requirements of rapid economic development. Consequently, In the context of the ecological protection scenario, the expansion of carbon-emitting areas related to both arable land and built-up land is strictly restricted.
In the context of the sustainable development scenario, there are distinct spatial distributions of the newly added areas related to carbon emissions and carbon absorption for each land use category. When it comes to carbon sinks, the expanse of newly added carbon-absorbing areas is notably greater than that in the natural development and economic development scenarios. The newly added carbon-absorbing areas in forests exhibit a pattern that is initially concentrated and then generally dispersed. As for grasslands and barren lands, their newly added carbon-absorbing areas are distributed in strip—like formations in Xinjiang and Qinghai provinces. The newly added carbon-absorbing areas in water bodies are sporadically located across Sichuan and Ningxia provinces. In the case of carbon sources, the newly added carbon-emitting areas of cultivated land are primarily scattered but concentrated in regions such as Northeast China, Hebei, and Shanxi. In contrast to the scenarios of cultivated land safeguarding, ecological conservation, and contraction regulation, the sustainable development scenario not only safeguards cultivated land resources but also promotes high-quality economic development in Chinese society and contributes to the construction of a socialist modern nation. The newly added carbon—the zones where construction land emits are primarily concentrated in the central and eastern parts of the country, such as Hebei, Henan, and Jiangsu provinces. Nevertheless, in contrast to the natural development scenario, the newly added carbon—under the sustainable development scenario, the expansion of construction land areas that generate emissions is effectively restrained.

5. Discussion

5.1. Analysis of Carbon Emission Peaks in Multiple Scenarios in China from 2030 to 2060

This research carried out simulations of six development scenarios to assess the influence of diverse land utilization strategies on the timing of China’s carbon emissions peak. In contrast to prior studies [41,42,43,44,45,46], this investigation has delved deeply into the means of achieving dynamic simulations of land use. It has refined the process parameters for land use alterations, upgraded the scenario-setting approach, and accomplished a dynamic and multi-faceted prediction of carbon emissions. This prediction is based on a greater number of more precise scenarios of future land use simulations. The findings reveal that the contraction control, cultivated land conservation, ecological safeguarding, and sustainable development scenarios all have the potential to reach the carbon peak before 2030. Specifically, the ecological safeguarding scenario witnessed the highest carbon emissions in 2020, signifying that it attained the peak target ahead of 2030. For the contraction control, cultivated land conservation, and sustainable development scenarios, China is anticipated to reach its carbon peak in 2030, and the net carbon emissions are expected to decrease in the subsequent years. This implies that all these three scenarios are well—positioned to achieve the carbon peak before 2030. Conversely, the natural development and economic development scenarios suggest that the growth rate of China’s net carbon emissions in 2030 will continue to increase compared to previous years. Under the natural development scenario, China’s net carbon emissions are forecasted to reach their peak in 2050, while under the economic development scenario, the peak is expected in 2040.
In general, it can be noted that within the natural development scenario, which has no regulatory planning for land utilization, and the economic development scenario, which emphasizes centralizing land for robust national economic growth, China will find it difficult to reach the peak of net carbon emissions before 2030. Consequently, attaining China’s “dual carbon” objectives will pose significant challenges. On the other hand, the contraction control, cultivated land preservation, and ecological conservation scenarios are projected to achieve the carbon peak prior to 2030. However, these scenarios will place additional strain on social development. In comparison, the sustainable development scenario, which strikes a balance between the safeguarding of cultivated land, ecological assets, and urban progress, will not only fulfill the carbon peak goal but also offer sustainable impetus for China’s development.

5.2. Policy Suggestions

This research conducts a comprehensive examination of the spatial-temporal trends of land utilization and carbon emissions across various future situations. Its objective is to back China’s endeavors in attaining its “dual carbon” objectives [46]. Drawing on the principal findings and contributions of this research, the subsequent policy suggestions are put forward: (1) Firstly, firmly uphold the sustainable development model. The sustainable development scenario strikes the optimal equilibrium among ecological conservation, farmland steadiness, and economic progress. It stands as the central framework for China’s land use planning. Nevertheless, local authorities ought to customize their approaches according to regional features and the merits of other scenarios. This can be achieved by devising diverse land use policies [47,48]. Secondly, boost carbon sink capabilities and regulate carbon sources. Local governments should consistently enhance the carbon sink function of ecological land utilization. They must stringently oversee the transformation of high-carbon emission land and continuously refine the carbon emission monitoring and policy assessment system. Particular attention should be given to evaluating the carbon emissions resulting from the expansion of construction land [49,50]. Thirdly, reinforce inter-departmental cooperation. The successful execution of sustainable development hinges on the proactive responses and collaborative endeavors of multiple departments, such as the Department of Natural Resources, the Department of Agriculture and Rural Development, and the National Development and Reform Commission. It is crucial to synchronize land use planning and carbon emission targets across these departments to prevent policy contradictions [51,52].

5.3. Advantages, Disadvantages and Prospects

This study presents several notable benefits: Firstly, it employs national 1 km land use data along with the PLUS model. The simulation parameters are refined from a dynamic standpoint. This involves forecasting the crucial influencing factors that may undergo changes, such as population, gross domestic product (GDP), average yearly rainfall and average yearly temperature. The projected values for various years serve as inputs for the model simulation and are incorporated into the land use simulation process for the corresponding time periods. Moreover, limiting factors are established in accordance with policy frameworks, and the carbon emission coefficient for built-up land is modified. This allows for the accurate forecasting of carbon emissions resulting from land use practices across various future situations. Secondly, from a geographical viewpoint, this research comprehensively analyzes the temporal development of China’s carbon emissions from 2020 to 2060 across six scenarios. It assesses net emissions, carbon sources and sinks, and major land use categories in three aspects. The analysis is combined with China’s “dual carbon” objectives, offering an understanding of changes in numerical values and growth rates. It also provides theoretical and data—based assistance for attaining the carbon peak target.
The drawbacks of this research primarily originate from two areas: the data basis and the carbon emission computation process. (1) Firstly, the research employs fundamental data with a 1 km resolution. Although this level of resolution suffices for national-scale investigations, there is room for improvement in data accuracy. Nevertheless, conducting national-scale simulations with higher-resolution data, say, 30 m resolution, would demand exceptionally high-performance computing resources. In the long run, it is advisable to contemplate national-scale land use simulation and forecasting using 30 m resolution data via cloud computing platforms. Secondly, the research only encompasses six land use categories. This limited classification makes it challenging to capture the specific and real-world traits of land use change. Future research should examine the large-scale spatio-temporal evolutionary features of land use carbon emissions using more detailed land use categorization approaches. (2) This research centers on China as the main subject for model simulation and carbon emission projection. However, there are substantial disparities in land use development models and the factors influencing carbon emissions across different spatial scales in China. For instance, the regional distribution of arable land and construction land varies significantly. As a result, indirect carbon emission calculation methods struggle to account for these regional differences. To address these issues, future efforts could involve simulating carbon emissions at the provincial level. Additionally, regional studies focusing on major river basins, functional zones, and regional integration could be carried out. Such an approach would better meet the specific requirements of zoning management and offer more customized perspectives.
This research has achieved significant advancements in forecasting China’s carbon emissions. Nevertheless, elements like data accessibility, constraints in single-machine computational capacity, and possible policy alterations bring about substantial uncertainty regarding the future spatial and temporal patterns of China’s carbon emissions. Consequently, the simulation forecasts may differ from the real-world results. To augment the scientific rigor and practical utility of this study, subsequent research can concentrate on the following aspects: (1) Advancing data precision and computational might: In future investigations, enhancing data resolution and computational resources is of utmost importance, considering the current research is restricted by these factors. Moving ahead, leveraging high-resolution datasets (such as 30 m resolution land use data) on cloud-computing platforms for large-scale simulations of land use changes throughout China presents a promising path. By combining multi-source data integration with high-performance computing techniques, the more detailed features of land use changes can be more precisely identified, thus boosting the credibility of the simulation outcomes. (2) Multi-scale zonal simulation and policy scenario incorporation: A crucial direction for future research is to carry out multi-scale zonal simulations customized to the particular requirements of land use management. Studies can zero in on large-scale river basins, functional zones, and regional integration, examining the driving factors and spatial disparities in land use changes and carbon emissions among different regions. This approach will not only improve local zonal strategies but also offer scientifically sound solutions for global climate-change governance, especially in alignment with China’s “dual-carbon” objectives.

6. Conclusions

This research combines the PLUS model with multi-source data and shows that China’s net carbon emissions from land use witnessed a 1.16-fold growth from 2000 to 2020. However, the rate of increase has decelerated. When conducting simulations of land use patterns, it is necessary to consider the ever-changing nature of the factors that have an impact on it, as this way, it becomes possible to more accurately forecast future shifts in land use patterns. The outcomes of multi-scenario land use simulations based on the dynamic changes in influencing factors indicate that national-scale simulations under the sustainable development scenario have notable advantages over other scenarios (Kappa = 0.9101, OA = 93.15%). In the sustainable development scenario, a modest enlargement of construction-related land areas, coupled with an enhancement of the carbon sequestration ability of forests and grasslands, can result in the achievement of the carbon peak by the year 2030, which is 5–8 years earlier than in the natural development scenario. By 2060, net carbon emissions will decline by 14.36% compared to the levels in 2020. Employing the PLUS model and precise simulation methods that consider the dynamic changes in influencing factors can precisely and effectively uncover the patterns of China’s land use changes and simulate future land use patterns. Different development scenarios are established for future land use simulations, accompanied by carbon emission predictions. This offers multiple viewpoints for realizing China’s “dual carbon” goals and provides robust technical assistance for government policy–making.

Author Contributions

Conceptualization, J.Z., C.H. and W.L.; methodology, C.H. and Q.Y.; software, C.H., Q.Y., L.Z. and Z.W.; validation, C.H. and Q.Y.; formal analysis, C.H., Q.Y., L.Z. and Z.W.; investigation, C.H., Q.Y., W.L., X.F. and H.Z.; resources, J.Z., W.L., X.F. and H.Z.; data curation, J.Z. and C.H.; writing—original draft preparation, C.H.; writing—review and editing, J.Z. and W.L.; visualization, C.H., Q.Y., L.Z. and Z.W.; supervision, J.Z. and W.L.; project administration, J.Z. and W.L.; funding acquisition, J.Z. and W.L. All authors have read and agreed to the published version of the manuscript.

Funding

This work was financed by the Open Fund of the Key Laboratory of Jianghuai Arable Land Resources Protection and Eco-restoration, the Ministry of Natural Resources (No. 2024-ARPE-KF03), the Natural Science Foundation of China (No. 42271060), and the Natural Resources Science and Technology Project of Anhui Province (No. 2023-K-5).

Data Availability Statement

Data are contained within the article.

Conflicts of Interest

The authors declare no conflicts of interest.

References

  1. Yao, X.; Ye, B.; Lan, Y. Diurnal contrast of urban park cooling effects in a “Furnace city” using multi-source geospatial data and optimal parameters-based geographical detector model. Sustain. Cities Soc. 2024, 114, 105765. [Google Scholar] [CrossRef]
  2. Gu, C.; Guan, W.; Liu, H. Chineseurbanization2050: SDmodelingandprocess simulation. Sci. China Earth Sci. 2017, 60, 1067–1082. [Google Scholar] [CrossRef]
  3. Niu, L.D.; Pan, M. Research on dynamic simulation of land use change based on geographical weighted CLUE-S model. Int. J. Environ. Technol. Manag. 2021, 24, 49–61. [Google Scholar] [CrossRef]
  4. Liang, X.; Guan, Q.; Clarke, K.C. Understanding the drivers of sustainable land expansion using a patch-generating land use simulation (PLUS) model: A case study in Wuhan, China. Comput. Environ. Urban Syst. 2021, 85, 101569. [Google Scholar] [CrossRef]
  5. Wei, B.; Kasimu, A.; Reheman, R. Spatiotemporal characteristics and prediction of carbon emissions/absorption from land use change in the urban agglomeration on the northern slope of the Tianshan Mountains. Ecol. Indic. 2023, 151, 110329. [Google Scholar] [CrossRef]
  6. Ye, L.; Zhao, S.; Yang, H. Urban land use simulation and carbon-related driving factors analysis based on RF-CA in Shanghai, China. Ecol. Indic. 2024, 166, 112555. [Google Scholar] [CrossRef]
  7. Meiyappan, P.; Jain, A.K.; House, J.I. Increased influence of nitrogen limitation on CO2 emissions from future land use and land use change. Glob. Biogeochem. Cycles 2015, 29, 1524–1548. [Google Scholar] [CrossRef]
  8. Arneth, A.; Sitch, S.; Pongratz, J. Historical carbon dioxide emissions caused by land-use changes are possibly larger than assumed. Nat. Geosci. 2017, 10, 79–84. [Google Scholar] [CrossRef]
  9. Raupach, M.R.; Rayner, P.J.; Paget, M. Regional variations in spatial structure of nightlights, population density and fossil-fuel CO2 emissions. Energy Policy 2010, 38, 4756–4764. [Google Scholar] [CrossRef]
  10. Ghosh, T.; Elvidge, C.D.; Sutton, P.C. Creating a global grid of distributed fossil fuel CO2 emissions from nighttime satellite imagery. Energies 2010, 3, 1895–1913. [Google Scholar] [CrossRef]
  11. Zhao, J.; Ji, G.; Yue, Y. Spatio-temporal dynamics of urban residential CO2 emissions and their driving forces in China using the integrated two nighttime light datasets. Appl. Energy 2019, 235, 612–624. [Google Scholar] [CrossRef]
  12. Rahman, M.M.; Hasan, J. Evaluating the Impact of Green Spaces on Urban Heat Reduction in Rajshahi, Bangladesh Using the InVEST Model. Land 2024, 13, 1284. [Google Scholar] [CrossRef]
  13. Zhang, C.; Jia, Q.; Liu, Y. Evaluation and multi scenario simulation of ecosystem service value in Zhengzhou Metropolitan Area based on PLUS model. Meas. Sens. 2024, 32, 101079. [Google Scholar] [CrossRef]
  14. Wu, L.; He, Y.; Tan, Q. Land-use simulation for synergistic pollution and carbon reduction: Scenario analysis and policy implications. J. Environ. Manag. 2024, 356, 120603. [Google Scholar] [CrossRef] [PubMed]
  15. Xu, X.; Kong, W.; Wang, L. A novel and dynamic land use/cover change research framework based on an improved PLUS model and a fuzzy multiobjective programming model. Ecol. Inform. 2024, 80, 102460. [Google Scholar] [CrossRef]
  16. Chowdhury, P.K.R.; Brown, D.G. Modeling the effects of carbon payments and forest owner cooperatives on carbon storage and revenue in Pacific Northwest forestlands. Land Use Policy 2023, 131, 106725. [Google Scholar] [CrossRef]
  17. Yang, Y.; Tian, Y.; Zhang, Q. Impact of current and future land use change on biodiversity in Nanliu River Basin, Beibu Gulf of South China. Ecol. Indic. 2022, 141, 109093. [Google Scholar] [CrossRef]
  18. Aponte, C.; Kasel, S.; Nitschke, C.R. Structural diversity underpins carbon storage in Australian temperate forests. Glob. Ecol. Biogeogr. 2020, 29, 789–802. [Google Scholar] [CrossRef]
  19. Stas, M.S.; Le, C.T.; Tran, D.H. Logging intensity drives variability in carbon stocks in lowland forests in Vietnam. For. Ecol. Manag. 2020, 460, 117863. [Google Scholar] [CrossRef]
  20. Xu, F.; Chi, G. Spatiotemporal variations of land use intensity and its driving forces in China, 2000–2010. Reg. Environ. Change 2019, 19, 2583–2596. [Google Scholar] [CrossRef]
  21. Houghton, R.A.; Nassikas, A.A. Global and regional fluxes of carbon from land use and land cover change 1850–2015. Glob. Biogeochem. Cycles 2017, 31, 456–472. [Google Scholar] [CrossRef]
  22. Chen, J.; Gao, M.; Cheng, S. County-level CO2 emissions and sequestration in China during 1997–2017. Sci. Data 2020, 7, 391. [Google Scholar] [CrossRef] [PubMed]
  23. Pata, U.K. Renewable energy consumption, urbanization, financial development, income and CO2 emissions in Turkey: Testing EKC hypothesis with structural breaks. J. Clean. Prod. 2018, 187, 770–779. [Google Scholar] [CrossRef]
  24. Aslam, U.; Termansen, M.; Fleskens, L. Investigating farmers’ preferences for alternative PES schemes for carbon sequestration in UK agroecosystems. Ecosyst. Serv. 2017, 27, 103–112. [Google Scholar] [CrossRef]
  25. Cai, B.; Lu, J.; Wang, J. A benchmark city-level carbon dioxide emission inventory for China in 2005. Appl. Energy 2019, 233, 659–673. [Google Scholar] [CrossRef]
  26. Doll, C.N.H.; Muller, J.P.; Elvidge, C.D. Night-time imagery as a tool for global mapping of socioeconomic parameters and greenhouse gas emissions. AMBIO 2000, 29, 157–162. [Google Scholar] [CrossRef]
  27. Shi, K.; Yu, B.; Zhou, Y. Spatiotemporal variations of CO2 emissions and their impact factors in China: A comparative analysis between the provincial and prefectural levels. Appl. Energy 2019, 233–234, 170–181. [Google Scholar] [CrossRef]
  28. Mallapaty, S. How China could be carbon neutral by mid-century. Nature 2020, 586, 482–483. [Google Scholar] [CrossRef]
  29. Rad, M.R.P.; Toomanian, N.; Khormali, F. Updating soil survey maps using random forest and conditioned Latin hypercube sampling in the loess derived soils of northern Iran. Geoderma 2014, 232–234, 97–106. [Google Scholar] [CrossRef]
  30. Huang, H.; Jia, J.; Chen, D. Evolution of spatial network structure for land-use carbon emissions and carbon balance zoning in Jiangxi Province: A social network analysis perspective. Ecol. Indic. 2024, 158, 111508. [Google Scholar] [CrossRef]
  31. Yang, X.; Liu, X. Path analysis and mediating effects of influencing factors of land use carbon emissions in Chang-Zhu-Tan urban agglomeration. Technol. Forecast. Soc. Change 2023, 188, 122268. [Google Scholar] [CrossRef]
  32. He, J.; Yang, J. Spatial–temporal characteristics and influencing factors of land-use carbon emissions: An empirical analysis based on the GTWR model. Land 2023, 12, 1506. [Google Scholar] [CrossRef]
  33. Yang, J.; Huang, X. The 30 m annual land cover dataset and its dynamics in China from 1990 to 2019. Earth Syst. Sci. Data 2021, 13, 3907–3925. [Google Scholar] [CrossRef]
  34. Guo, R.; Wu, T.; Wu, X. Simulation of urban land expansion under ecological constraints in Harbin-Changchun urban agglomeration, China. Chin. Geogr. Sci. 2022, 32, 438–455. [Google Scholar] [CrossRef]
  35. Lu, C.; Qi, X.; Zheng, Z. PLUS-model based multi-scenario land space simulation of the lower Yellow River region and its ecological effects. Sustainability 2022, 14, 6942. [Google Scholar] [CrossRef]
  36. Viana, C.M.; Pontius, R.G., Jr.; Rocha, J. Four fundamental questions to evaluate land change models with an illustration of a cellular automata-markov model. Ann. Am. Assoc. Geogr. 2023, 113, 2497–2511. [Google Scholar] [CrossRef]
  37. Amir Siddique, M.; Wang, Y.; Xu, N. The spatiotemporal implications of urbanization for urban heat islands in Beijing: A predictive approach based on CA-Markov modeling (2004–2050). Remote Sens. 2021, 13, 4697. [Google Scholar] [CrossRef]
  38. Li, Z.; Luan, W.; Zhang, Z.C. Relationship between urban construction land expansion and population/economic growth in Liaoning province, China. Land Use Policy 2020, 99, 105022. [Google Scholar] [CrossRef]
  39. Liu, S.; Liao, Q.; Liang, Y. Spatio-temporal heterogeneity of urban expansion and population growth in China. Int. J. Environ. Res. Public Health 2021, 18, 13031. [Google Scholar] [CrossRef]
  40. Shi, K.; Yu, B.; Ma, J. Impacts of slope climbing of urban expansion on global sustainable development. Inn. 2023, 4, 100529. [Google Scholar] [CrossRef]
  41. Ou, Y.; Bao, Z.; Ng, S.T. Land-use carbon emissions and built environment characteristics: A city-level quantitative analysis in emerging economies. Land Use Policy 2024, 137, 107019. [Google Scholar] [CrossRef]
  42. Fan, M.; Wang, Z.; Xue, Z. Spatiotemporal evolution characteristics, influencing factors of land use carbon emissions, and low-carbon development in Hubei Province, China. Ecol. Inform. 2024, 81, 102567. [Google Scholar] [CrossRef]
  43. Zhang, T.; Cheng, C.; Wu, X. Mapping the spatial heterogeneity of global land use and land cover from 2020 to 2100 at a 1 km resolution. Sci. Data 2023, 10, 748. [Google Scholar] [CrossRef] [PubMed]
  44. Wang, Z.; Zeng, J.; Chen, W. Impact of urban expansion on carbon storage under multi-scenario simulations in Wuhan, China. Environ. Sci. Pollut. Res. 2022, 29, 45507–45526. [Google Scholar] [CrossRef] [PubMed]
  45. Zhang, L.; Hou, G.; Li, F. Dynamics of landscape pattern and connectivity of wetlands in western Jilin province, China. Environ. Dev. Sustain. 2020, 22, 2517–2528. [Google Scholar] [CrossRef]
  46. Chen, Y.; Li, X.; Liu, X. Modeling urban land-use dynamics in a fast developing city using the modified logistic cellular automaton with a patch-based simulation strategy. Int. J. Geogr. Inf. Sci. 2014, 28, 234–255. [Google Scholar] [CrossRef]
  47. Yang, X.; Li, S.; Zhu, C. Simulating urban expansion based on ecological security pattern: A case study of Hangzhou, China. Int. J. Environ. Res. Public Health 2021, 19, 301. [Google Scholar] [CrossRef]
  48. Han, N.; Yu, M.; Jia, P. Multi-Scenario landscape ecological risk simulation for sustainable development goals: A case study on the central mountainous area of Hainan Island. Int. J. Environ. Res. Public Health 2022, 19, 4030. [Google Scholar] [CrossRef]
  49. Zhu, Z.; Liu, B.; Wang, H. Analysis of the spatiotemporal changes in watershed landscape pattern and its influencing factors in rapidly urbanizing areas using satellite data. Remote Sens. 2021, 13, 1168. [Google Scholar] [CrossRef]
  50. Hu, J.; Zhang, J.; Li, Y. Exploring the spatial and temporal driving mechanisms of landscape patterns on habitat quality in a city undergoing rapid urbanization based on GTWR and MGWR: The case of Nanjing, China. Ecol. Indic. 2022, 143, 109333. [Google Scholar] [CrossRef]
  51. Rong, T.; Zhang, P.; Li, G. Spatial correlation evolution and prediction scenario of land use carbon emissions in the Yellow River Basin. Ecol. Indic. 2023, 154, 110701. [Google Scholar] [CrossRef]
  52. Liu, C.; Hu, S.; Wu, S. County-level land use carbon emissions in China: Spatiotemporal patterns and impact factors. Sustain. Cities Soc. 2024, 154, 105304. [Google Scholar] [CrossRef]
Figure 1. Technical flow chart.
Earth 06 00085 g001
Figure 2. Population and GDP Projections in China from 2030 to 2060. (a) shows the extrapolation of China’s population trend from 2030 to 2060, which predicts the future population changes in China during this period using the piecewise linear regression method; (b) presents the extrapolation of China’s GDP trend from 2030 to 2060, forecasting the future GDP changes in China during this period by applying the autoregressive model (SVR).
Earth 06 00085 g002
Figure 3. Extrapolated trend maps of influencing factors of land use change from 2030 to 2060.
Earth 06 00085 g003
Figure 4. Extrapolated trend chart of influencing factors of land use change from 2030 to 2060.
Earth 06 00085 g004
Figure 5. Results of land use simulations in China under natural development, economic development, and contraction control scenarios in 2030, 2040, 2050 and 2060.
Earth 06 00085 g005
Figure 6. Results of land use simulations in China under cultivated land protection, ecological protection, and sustainable development scenarios in 2030, 2040, 2050 and 2060.
Earth 06 00085 g006
Figure 7. The transfer trajectory of various land use types under different scenarios in China from 2020 to 2060 (Unit: km2).
Earth 06 00085 g007
Figure 8. Projected trend chart of net carbon emissions under different scenarios in China from 2020 to 2060 (Unit: Gt).
Earth 06 00085 g008
Figure 9. Distribution of net carbon emission expansion areas under different scenarios in China from 2020 to 2060.
Earth 06 00085 g009
Table 1. Indicator description and data source.
Data TypeData SubcategoryData DescriptionData Sources
Land useLand use dataThree epochs in 2010, 2015, and
2020 with 30 m resolution
https://earthengine.google.com/ (accessed on 24 October 2024)
Natural
environmental
factors
Distance to waterDistance to water bodies such as
rivers, lakes, reservoirs, etc.
Taken from 2020 land use data
DEM1 km resolution raster datahttps://www.resdc.cn/ (accessed on 30 October 2024)
SlopeDerived from DEM
Soil type1 km resolution raster data
Average annual
temperature
Average temperature from 2010 to 2020
Average annual
precipitation
Average precipitation from 2010 to 2020
Socio-economic
factors
PopulationSpatialized expression of
population density from 2000 to 2020
GDPSpatialized expression of GDP
value from 2000 to 2020
Distance to railwayDistance to railwayOpenStreetMap
Distance to highwayDistance to highway
Distance to primary roadsDistance to primary roads in 2022
Distance to secondary roadsDistance to secondary roads in Z2022
limiting factorsNature reserve datavector data in 2022
Statistical dataEnergy consumption dataProvincial consumption of major
energy sources
China National Bureau of
Statistics
Table 2. Scenario settings.
Development ScenarioRestricted Conversion AreaDemand Forecast AdjustmentCost Matrix SetupRelevant Policies
Natural development////
Economic growth/The probability of conversion from cultivated land, forest, and grassland to construction land increases by 30%.
The probability of conversion from construction land to land types other than cultivated land decreases by 30%.
Restrict the conversion of construction land to other land types.Restrict the conversion of cultivated land and forest to construction land.
Contraction control/The probability of conversion from construction land to land types other than barren land increases by 30%.Restrict the conversion of cultivated land and forest to construction land.Measures such as downsizing development.
Cultivated land protectionCultivated land protection zonesThe probability of conversion from cultivated land to other land types decreases by 50%.Restrict the conversion of cultivated land to other land types.Relevant documents such as the delineation of permanent basic cultivated Land.
Ecological protectionEcological conservation zonesThe probability of conversion from forest and grassland to construction land decreases by 20%.
The probability of conversion from water bodies and cultivated land to construction land decreases by 30%.
The probability of conversion from cultivated land and construction land to forest increases by 10%.
Restrict the conversion of forest and water bodies to other land types.
Only allow grassland to convert to forest and water bodies.
Relevant documents such as the ecological protection red line.
Sustainable developmentIntegrating Cultivated land and ecological conservation zonesThe probability of conversion from cultivated land to other land types, excluding forest and construction land, decreases by 30%.
The probability of conversion from forest, grassland, and water bodies to construction land decreases by 10%.
The probability of conversion from water bodies and grassland to forest increases by 20%.
The probability of conversion from construction land to other land types, excluding cultivated land and forest, decreases by 30%.
Restrict the conversion of cultivated land and forest to construction land.Relevant documents such as low-carbon development, the achievement of the “dual carbon” goals, and sustainable development.
Table 3. Carbon emission coefficient of land use type.
Land Use TypeCarbon Emission Coefficient t/(hm2·a)
Cultivated land0.4595
Forest−0.6125
Grassland−0.0205
Water Bodies−0.0253
Barren land−0.0005
Table 4. Carbon emission coefficient of major energy sources.
Energy TypesStandard Coal Conversion CoefficientCarbon Emission Coefficient
Coal0.71430.7559
Coke0.97140.8550
Crude oil1.42860.6185
Gasoline1.47140.5538
Kerosene1.47140.5714
Diesel oil1.45710.4483
Liquefied Petroleum Gas1.71430.5042
Natural gas1.21430.5921
Table 5. Accuracy assessment of land use simulation using PLUS model under the six scenarios in 2020.
PLUS
model
Accuracy
Indicators
Natural
Development
(Fixed Effects)
Natural
Development
Economic GrowthContraction ControlCultivated Land
Protection
Ecological ProtectionSustainable
Development
Kappa0.82050.9025 0.9042 0.88030.8938 0.9058 0.9101
OA (%)88.3992.5792.7090.2891.9192.8293.15
FoM0.30840.3717 0.3739 0.35190.3538 0.3811 0.3895
GeoSOS-
FLUS model
Kappa0.80140.88020.90890.86310.87310.89670.9028
OA (%)86.2791.6391.6383.6790.5690.6591.70
FoM0.28640.33240.34210.31240.32450.35020.3564
Table 6. Carbon emissions of different land use types in China from 2000–2020.
Carbon Emissions (Gt)200020102020
Carbon SourceCultivated land910.08 884.47 882.51
Construction land18,364.45 31,458.41 38,951.63
Total19,274.53 32,342.87 39,834.14
Carbon SinkForest−1493.73 −1512.71 −1519.73
Grassland−62.07 −62.18 −61.16
Water−3.55 −3.88 −3.95
Barren land−1.11 −1.09 −1.08
Total−1560.46 −1579.87 −1585.92
Net Carbon Emissions17,714.06 30,763.01 38,248.21
Table 7. Statistical results of carbon emissions in China under various scenarios from 2030 to 2060 (unit: Gt).
Development Scenario20202030204020502060
Natural development38,248.21 44,865.38 45,272.08 46,359.65 40,176.34
Economic growth47,743.51 49,129.03 48,262.58 43,118.40
Contraction control44,618.97 44,035.37 36,441.22 28,674.83
Cultivated land protection39,347.88 37,414.11 33,915.83 26,757.12
Ecological protection36,876.28 36,780.85 33,800.58 26,568.24
Sustainable development41,859.07 41,526.03 38,813.88 32,755.43
Disclaimer/Publisher’s Note: The statements, opinions and data contained in all publications are solely those of the individual author(s) and contributor(s) and not of MDPI and/or the editor(s). MDPI and/or the editor(s) disclaim responsibility for any injury to people or property resulting from any ideas, methods, instructions or products referred to in the content.

