Abstract
The ongoing climate crisis and growing water scarcity are exerting increasing pressure on agriculture in Southern and Western Europe, leading to reduced crop yields, greater risk of land abandonment, and deterioration of soil quality. Despite the extensive literature on irrigation and water use in agriculture, the specific relationship between irrigation availability and changes in the type of farming (ToF) remains insufficiently investigated. This study aims to address this gap by analyzing data from the 2010 and 2020 Italian General Agricultural Censuses conducted by ISTAT, in combination with microdata from the Italian Farm Accountancy Data Network (FADN), focusing on irrigated farms in Southern Italy. Descriptive analysis reveals that over 60% of irrigated farms specialize in permanent crops and predominantly adopt efficient irrigation systems such as drip irrigation. Between 2010 and 2020, approximately 23.8% of farms changed their ToF; however, these transitions were not generally associated with improvements in productivity or profitability. Results from logistic regression models suggest that structural variables—including Utilized Agricultural Area (UAA), economic size, and demographic characteristics such as the farmer’s gender—play a more significant role in determining changes in the ToF than the presence of irrigation itself. Moreover, the adoption of organic practices and larger farm sizes are positively associated with ToF changes. These findings suggest that while there has been some shift toward less water-demanding and potentially more sustainable crops, the impact of irrigation on such transitions remains limited. The results underscore the need for more targeted agricultural policies and improved data collection to support effective climate adaptation strategies in the sector.
1. Introduction
The Mediterranean basin, which encompasses the states of Southern Europe and Northern Africa, is a vast region characterized by a unique climate that varies significantly throughout the seasons, creating optimal conditions for the cultivation of specific crops essential for human nutrition. Currently, this area faces environmental challenges due to climate change and climate crises, which, through prolonged periods of drought, water scarcity, and other natural disasters, threaten several crops typical of Mediterranean agriculture. The European Environment Agency report emphasizes that Europe is now the fastest-warming continent and a climate change hotspot, with climate change exacerbating various risks and crises, warming at a rate twice that of the global average since the 1980s. The climatic situation in Southern Europe, including Southern Italy, is marked by alarming trends. In recent decades, this region has experienced a significant increase in average temperatures, a decrease in precipitation in some areas, and an intensification of extreme weather events (EWEs—heatwaves, droughts, heavy rainfall). These factors are expected to make this area one of the most vulnerable regions in the world (Figure 1) [1,2,3].
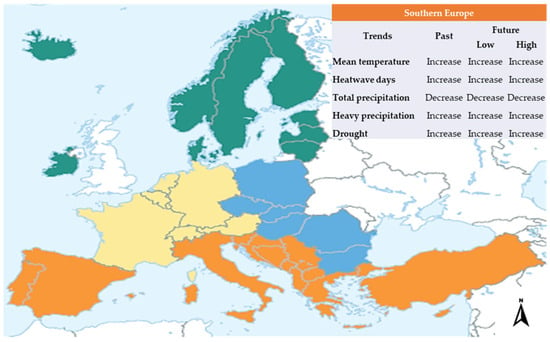
Figure 1.
Trends in key climatic risk drivers in Southern Europe. (The underlying climate variables are heatwaves (days with maximum temperatures above 35 °C), heavy precipitation (maximum 1-day precipitation), and drought (using a standardized precipitation evapotranspiration index over 6 months (SPEI-6, Hargreaves’ method)). The time periods and scenarios include the past (1952–2021), the future until the end of the century (2081–2100 relative to 1995–2014), a low scenario (SSP1-2.6), and a high scenario (SSP3-7.0). Copernicus Climate Change Service (C3S)).
The Global Climate Highlights report confirms that 2023 was the warmest calendar year ever recorded in global temperature data since 1850. Regarding the European continent, the report indicates that the autumn period (September–November 2023) recorded an average temperature of 10.96 °C, which is 1.43 °C above the 1991–2020 average for the same period. This temperature trend continued into January 2024, bringing with it a prolonged lack of precipitation. The European Drought Observatory (EDO), managed by the European Commission’s Joint Research Centre (JRC), reports a return to drought conditions in large parts of the Mediterranean regions. Drought monitoring is based on the analysis of various indicators representing different components of the hydrological cycle (e.g., rainfall, soil moisture, basin levels, river discharge, groundwater levels) or specific impacts (e.g., water stress on vegetation) associated with particular types of drought. Depending on the duration of the rainfall deficit, droughts can be classified as meteorological, agricultural, hydrological, or socio-economic. Prolonged drought periods can also induce or exacerbate water scarcity, meaning the shortage of water to meet the needs of various sectors (drinking, agricultural, industrial), potentially leading to conflicts over water use [4]. Droughts can also have negative impacts on catchment operations dependent on water availability. An increase in temperatures, combined with slower aquifer recharge, can result in both reduced water availability and altered water quality, which may increase operational costs. In its January 2024 report, the observatory notes that above-average temperatures and a prolonged lack of precipitation are adversely affecting soil moisture and vegetation. The consequences are evident along the coastal regions of Spain and in the Mediterranean islands, including Italy (GDO/EDO data up to 20 January 2024). Among other indicators, the Combined Drought Indicator (CDI), which identifies areas at risk of agricultural drought by combining the Standardized Precipitation Index (SPI), the Soil Moisture Index Anomaly (SMA), and the Fraction of Absorbed Photosynthetically Active Radiation (fAPAR) (all indicators that are produced by the Copernicus European Drought Observatory (EDO) to detect and characterize meteorological drought), clearly shows that regions in Spain (southern and eastern), southern France, parts of Poland, Romania, and Greece are in an alert condition. According to the CDI distribution maps, about 20% of the EU territory is currently in an alert condition due to agricultural drought (characterized by reduced soil moisture), while 1% is in an alert condition due to rainfall deficit and reduced soil moisture (Figure 2).
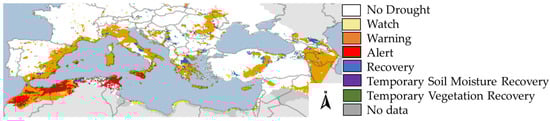
Figure 2.
The Combined Drought Indicator (CDI), based on a combination of indicators of precipitation, soil moisture, and vegetation conditions for mid-January 2024.
The situation clearly shows an increase in meteorological drought conditions (number of days without rain) across almost all of Southern Europe and the Mediterranean basin. This has been accompanied by an increase in the number of days when Southern Europe (including Italy) does not have sufficient water resources to meet its industrial and agricultural needs.
In 2022, Italy experienced a persistent drought that lasted until early 2023, and by 2024, it continued to affect the southern regions of the country. Figure 3 illustrates a map of Italy, highlighting average temperatures for the year 2023, confirming the observed trend of rising temperatures over recent decades. In fact, 2023 ranks as the second hottest year in the series, after 2022, in terms of both average temperature and maximum temperature, while setting a new record for the average annual minimum daily temperature [5]. From a rainfall perspective, the report emphasizes that rainfall was mainly concentrated in short, limited periods and was particularly scarce in the southern regions and islands (Sardegna and Sicilia). In the second half of the year, drought conditions progressively worsened in these areas [6,7].
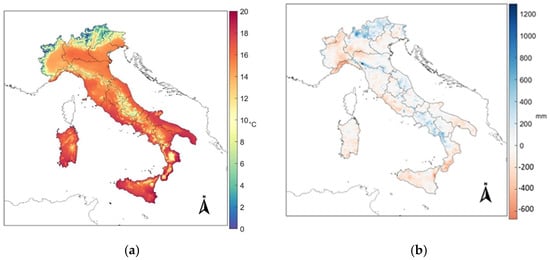
Figure 3.
(a) Average temperatures; (b) Anomaly of the total annual precipitation expressed in mm, compared to the 1991–2020 normal value (2023).
The need for irrigation in Europe is increasing due to climate change, while at the same time, the physical availability of water will be even more at risk. Heat and drought will lead to significant losses in agricultural production across most European regions over the 21st century, ultimately increasing food security risks [1]. To address these challenges, reducing agricultural water consumption through more efficient irrigation systems has been a priority on the political agenda in the Mediterranean, as well as globally.
Research Context
The European Climate Law (Reg. (EU) 2021/1119) [8] requires Member States to make continuous progress toward reducing vulnerability to climate impacts, increasing resilience, and enhancing adaptive capacity. From this perspective, the hypothesis is that climate change has led to a reduction in cultivated areas, with smaller and less structured farms being affected by the water crisis. On the other hand, this has resulted in increased specialization toward less water-demanding crops [9]. The IPCC Sixth Assessment Report [10] highlights the growing impact of climate change on water resources and agriculture. It projects a sharp increase in hydrological risks, including river flooding and extreme agricultural droughts. Crop yield losses could range from 12% to 32% by 2100, mainly due to changes in temperature and precipitation. Although irrigation demand is expected to rise, water availability and quality constraints may limit its expansion, particularly in already water-stressed regions.
Despite existing EU legal frameworks for water protection, agriculture remains a major contributor to water scarcity and pollution. The European Economic and Social Committee (EESC) stresses that agriculture is both a cause and a victim of the water crisis. Its “Blue Deal” calls for a strategic shift in EU policy, aiming to ensure equitable and sustainable water access in agriculture. This includes promoting efficient practices, national monitoring indicators, and targeted support for agri-food system transitions. EU agricultural policy must reduce water use, increase reuse, and prevent pollution. Relevant measures include best agricultural practices, farmer training, and innovation in water management technologies. The CAP 2023–2027 supports these goals through stricter water abstraction rules, enhanced controls, and incentives for practices improving soil health and water retention. It targets 47% of the EU’s farmland. Investments also cover irrigation efficiency, rainwater harvesting, and the use of recycled water.
Yet, transformative shifts toward less water-intensive farming remain limited, particularly in regions facing chronic stress. Implementation of key measures like abstraction control, reuse, and natural retention varies widely among Member States (MS). For example, France has adopted reduction plans. Since 2016, Italy has implemented a structured system to monitor water scarcity through River Basin District Observatories. These bodies assess drought severity using indicators defined by Italian National Institute for Environmental Protection and Research (ISPRA) guidelines [11]. The 2023 Drought Decree (Law No. 68/2023) redefined their role, integrating them into the River Basin Authorities. Each observatory identifies and applies district-scale indicators and parameters to characterize water scarcity scenarios and support water management decisions. The European Court of Auditors notes progress in pricing and pre-authorization systems, though small-scale withdrawals often escape oversight, posing risks to vulnerable water bodies. Low water pricing in agriculture also reduces incentives for efficient use.
Several studies stress the critical role of integrated water and agricultural management. In southern China, Shan Pan et al. [12] show how agricultural droughts result from climate–human interactions. Integrated strategies can reduce their impact. Similarly, Saleem et al. [13] highlight the risk of climate change on productivity, soil, water stress, and pest outbreaks. They call for resilient practices and supportive policies.
Other studies, such as those in Iran [14,15], emphasize the importance of adaptive strategies like planting drought-tolerant varieties of crops and better water governance. Research on West Africa [16] recommends incorporating local knowledge to enhance drought policy effectiveness.
Finally, Khosravi et al. [17] propose an Integrated Drought Index (IDI) using climate data and remote sensing. This tool can guide adaptation in Mediterranean countries like Italy, where drought risks are increasing. Such approaches may enhance water management and support sustainable farming, though uncertainty around their impact suggests the need for ongoing research and policy adjustment. This study aims to investigate the structural and productive transformations of farms in selected Mediterranean areas of Italy, using data from the 2020 Italian Agricultural Census conducted by the Italian National Institute of Statistics (ISTAT). Specifically, it explores whether the type of farming (ToF), as defined by Regulation (EU) 2020/1652 [18], has shifted since 2010 toward more sustainable production systems and less water-intensive crops. The analysis also examines whether these changes have resulted in improved farm income and productivity and to what extent they may have been influenced by agricultural and environmental policies aimed at water resource protection.
The rest of the paper is structured as follows: The Materials and Methods section outlines the methodological approach, the data sources (particularly the ISTAT census and the Farm Accountancy Data Network (FADN) database), and the analytical tools employed. This is followed by a description of the study area, focusing on Italian Mediterranean regions that are particularly vulnerable to water scarcity and agricultural pressure. The subsequent section presents an analysis of FADN data, evaluating the economic and productive performance of farms according to the ToF, with special attention to irrigation practices. An econometric model is then used to assess the impact of structural, territorial, and policy-related variables on changes in the type of farming. The paper concludes with a discussion of the findings in relation to current agricultural and environmental policies, highlighting implications for the sustainability of rural areas in Mediterranean contexts.
2. Materials and Methods
2.1. Methodology and Data Sources
The methodology consists of examining data from the seventh Italian agricultural census conducted by ISTAT in 2020, which is the latest general survey available on Italian farms [19] and includes a total of 1,133,006 farms. The analysis focuses on farms located in Southern Italy, specifically in the following regions: Campania, Puglia, Basilicata, Calabria, Sicilia, and Sardegna (see Figure 4). They amount to 599,002 farms, of which 145,712 have irrigated areas (for an irrigated area equal to 578,088 hectares) and represent the sample of our interest.
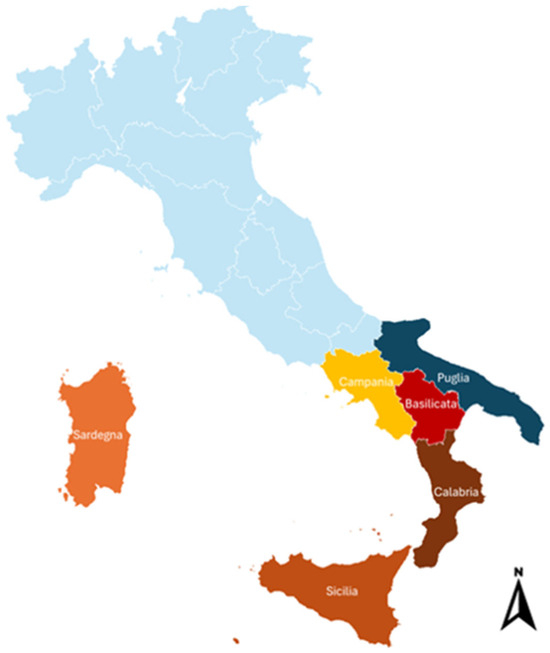
Figure 4.
Italy and the Italian regions examined in the study.
The data was processed using official information sources and presented in tabular and graphical form. An initial descriptive analysis was used to examine the classification of irrigated farms based on the ToF. It represents a standardized classification established at the EU level to analyze the structural characteristics and economic performance of the farms. The ToF helps to better understand the agricultural sector’s structure, farming practices, costs, revenues, sustainability, and competitiveness. The data collected supports agricultural policies and decision-making at both national and regional levels, promoting targeted strategies to improve efficiency, innovation, and resilience in agricultural enterprises. Additionally, it contributes to the planning of investments in infrastructure, technologies, and services that support the sector.
The contribution of each agricultural production activity to the overall standard production of the farm determines its ToF, which is classified according to general, main, or specific ToFs [18]. As already stated, after the descriptive analysis of the irrigated farms, we examined changes in the ToF over time. To do this, we also used data from the previous agricultural census conducted by ISTAT in 2010, and we identified farms that appeared in both censuses by using the personal identifiers of individual farmers. In this way, we identified 402,377 farms in Southern Italy regions that completed both surveys, and 96,237 are irrigated farms. After this, we verified which have remained in the same ToF and how many have changed, attempting to explain this phenomenon.
Furthermore, to provide a more comprehensive picture of the information, including economic data, we also used data from the Italian Farm Accountancy Data Network (FADN) [20]. The FADN is an early sample survey carried out by EU Member States and represents an important source of information that has been widely used over the years to study the agricultural sector [21,22,23,24,25,26]. As the provider of microeconomic data based on harmonized bookkeeping principles, the FADN offers valuable insights into the EU’s commercial farms. The methodology ensures that the data is representative across three categories: region, economic size, and type of farming. It provides detailed, standardized information on the financial results of agricultural activities, including income, costs, and profitability, allowing for an in-depth assessment of farm sustainability and competitiveness. By monitoring farms that meet the minimum threshold of Standard Output (SO), which in Italy is 8000 euros (farms in Italy with a Standard Output (SO) of less than €8000 are classified as hobby farms and are therefore excluded from all types of analysis), the FADN offers valuable insights into the structural characteristics of farms, the economic viability of various farming systems, and the impact of agricultural policies. This threshold is defined at the level of each EU country with respect to the coverage of the total national SO. This means that in Italy, the FADN survey includes all farms with at least 8000 euros of SO and covers 90% of the total national SO (for more information: https://rica.crea.gov.it/index.php?lang=en (accessed on 20 November 2024)). The reference population used to define the FADN sample is represented by farms surveyed by the Census of Agriculture, which is updated periodically with farm structure surveys. Therefore, since the FADN is a subsample of the agricultural census, and in Italy it is made up of approximately 11,000 farms, we tried to identify the farms present in the two censuses that are also detected by the FADN survey. For these, we analyzed some economic indices to better define their performance. Again, to match the two different databases, we used the unique farm identifier, and, in this way, we identified 455 farms in both the 2010 and 2020 FADN surveys and performed our analysis of ToF changes on these farms. It should be noted, however, that the FADN sample is not a panel, but every year, 25% of farms change, so considering a 10-year period in our analysis, we did not expect to find a very high number of farms. Moreover, we have not applied any kind of weight to the results obtained since the FADN sample is not initially constructed to be representative for these purposes, and the results shown are sample only.
Finally, we carried out a regression analysis employing the logit model, which is a binary choice model (coded as 0 and 1).
The choice to adopt a logit model lies in its ability to model the probability of a binary event as a logistic function of a linear combination of explanatory variables. This model is particularly suitable when the objective is to estimate the probability that an observation falls into one of the two categories (change/no change in the ToF) [27]. The theoretical advantages of using a logit model are as follows:
- Logistic distribution of the error, which is symmetric and with heavier codes than the normal distribution of the probit model. This makes the logit more robust to outliers and more flexible in some empirical applications [28].
- Interpretability of the coefficients in terms of odds ratios, facilitating the marginal analysis of the effect of the explanatory variables.
- Numerical stability over timescales with moderate or large sample sizes.
Comparing it with the probit model that assumes a standard normal distribution for the error, the logit model is preferred for its greater computational simplicity and for its direct interpretability through odds ratios [29]. On the other hand, panel logit or random/fixed effects logit models are useful extensions when longitudinal data (panel data) are available and unobserved heterogeneity between statistical units is to be controlled. However, they require more stringent assumptions and are computationally more complex. The simple logit model, therefore, represents a robust and theoretically sound initial choice, especially in the presence of cross-section data. The logit model has been widely applied in agricultural research [19,20,21] to examine the factors influencing the adoption of innovative farming practices. It is expressed as follows [22]:
where:
- ✓
- p represents the probability of the event of interest occurring (change in the type of farming);
- ✓
- β0, β1, β2, …, βn are the model coefficients;
- ✓
- X1, X2, …, Xn denote the independent variables.
The logit model employs the logistic function to ensure that probability p remains within the [0, 1] range. The logistic function is defined as follows:
where:
P(Y = 1|X) represents the probability that the dependent variable (Y) equals 1 given the set of predictors (X), and β0, β1, β2, …, βn are the model parameters.
The ratio of the probability of success and probability of failure is termed the logarithm of the odds ratio, reflecting the logit function. A higher odds ratio suggests a greater likelihood that the dependent variable (adoption of organic farming) takes the value of 1.
Explanatory variables are used to estimate the log-probabilities of the binary outcome, with the outcome variable representing the predicted or inferred probability. To identify the size of the impact of the explanatory variables on the outcome variable, marginal effects are estimated.
In this research, we aimed to analyze the situation of farms and rural areas within the investigated region and assess whether the type of farming in specific zones has shifted towards more sustainable production and less water-demanding cultivars since 2010. To achieve this, we applied a logistic regression model, utilizing the extensive information available in the Italian FADN database.
The dependent variable, which captures whether a farm has changed its type of farming, was constructed by comparing the type of farming of the same farm across the two agricultural censuses used in the analysis. It is a binary (dummy) variable that takes the value 1 if the farm changed its type of farming between the two censuses and 0 if it maintained the same type of farming. This dummy variable was then used as the dependent variable in the logistic regression model.
To define the set of independent variables used in the logistic regression, we employed a typical backward stepwise selection approach (also known as backward elimination) [30,31,32]. This method begins with a fully saturated model that includes all available explanatory variables. The model is then iteratively refined by evaluating the statistical significance of each coefficient and removing the variable with the least significance (i.e., the highest p-value above a pre-defined threshold). After each elimination, the regression is re-estimated, and the process is repeated until no further variables can be removed without significantly compromising the model’s explanatory power. The outcome of this iterative process is a more parsimonious model that best fits the data.
The independent variables incorporated in the model are summarized in Table 1.

Table 1.
Description of the variables used in the logit and regression models.
To test the quality of the model, we applied the Hosmer–Lemeshow (HL) test [33], a chi-square-based measure of model fit.
Furthermore, the model’s discrimination capacity—its ability to correctly distinguish between different outcome categories—was examined. This assessment was conducted using the Receiver Operating Characteristic (ROC) curve, a graphical tool for evaluating the predictive power of the logistic model. The model’s predictive ability improves as sensitivity increases for a given level of specificity. The area under the ROC curve (Area Under the Curve—AUC) ranges from 0 to 1, where an AUC of 0.5 indicates poor predictive capability (represented by a diagonal line connecting the origin to the point (1,1)), while an AUC of 1 signifies excellent predictive accuracy.
2.2. The Study Area
The Mediterranean region is highly susceptible to perturbations due to the increased frequency of droughts, with forecasts indicating drier summers and wet winters, which negatively affect crop yields. In Italy, there is a noticeable trend toward aridity, with recorded yield declines of just over 5% [34]. Numerous studies have confirmed that certain plant species in the Mediterranean region have experienced shifts in phenology and contractions in their production range [35]. This is particularly true for olive oil and wine production, sectors that are extremely vulnerable to the impacts of climate change [36]. The European Environment Agency has estimated that rising temperatures could cause olive trees in southern Italy to flower 10 to 34 days earlier by 2100, along with higher water demand and increased water stress due to scarcity, all of which would affect crop production [37,38].
Irrigated agriculture, especially in the Mediterranean basin regions, is a key component of the economy, particularly in Italy. In the southern regions, increasingly long periods of drought and high temperatures make irrigation a crucial factor in agricultural productivity. Through a detailed analysis of census data collected by ISTAT, it is possible to provide an overview of water resource use and irrigated areas in various Italian regions, highlighting regional differences.
3. Results
3.1. Irrigated Farms According to the Agricultural Census
Our focus is on farms located in Southern Italy, specifically irrigated farms in the following regions: Campania, Puglia, Calabria, Basilicata, Sicilia, and Sardegna, focusing on the production of irrigated crops. To achieve the objectives of the proposed analysis, we used data collected from the seventh Italian General Agricultural Census (2020). The survey includes a total of 1,133,006 farms, of which 599,002 are located in the Southern regions, and 145,712 have irrigated areas (for an irrigated area equal to 578,088 hectares). These farms represent the sample of interest for our study.
Table 2 shows the distribution of analyzed farms and irrigated areas by region. The Puglia region has the highest number of irrigated farms (30.6%), with 44,613 farms, followed by Sicilia (23.9%) and Campania (17.1%). These regions have the greatest need for irrigation due to their drier climatic conditions. The Basilicata region appears to be the least irrigated, both in terms of the number of farms and the area, which could indicate lower agricultural intensity or a greater availability of natural water resources.
Table 2.
The Southern Italy farms and hectares (ha) of irrigated land.
Census data confirms that irrigation remains a widespread practice in the agricultural areas of Southern Italy, playing a crucial role in ensuring crop continuity. The availability of water for irrigation is closely linked to the types of water infrastructure present in the country (e.g., reservoirs, irrigation canals, pumping systems, and supply systems), as well as the soil type and irrigation systems used [39]. Figure 5 shows the irrigated area by crop type.
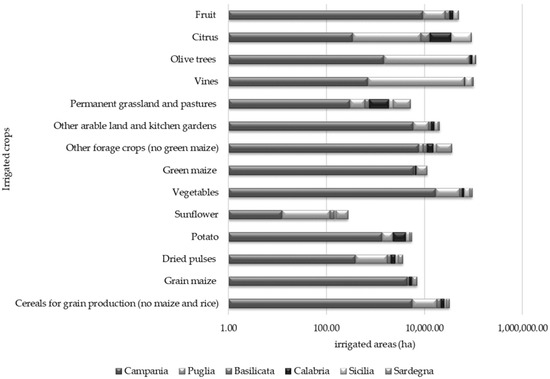
Figure 5.
Irrigated area by crop type (ha).
Among the regions analyzed, Puglia exhibits the highest irrigation rate, accounting for 40% of the total irrigated area covered in the study. The primary crops benefiting from irrigation in the region are olive trees, vineyards, and vegetables. Despite increasing pressure on water resources and intense competition among different uses, the adoption of micro-irrigation systems is steadily rising.
Sicilia, due to its geographic features and semi-arid climate, heavily relies on irrigation (23%). The crops most commonly irrigated are citrus fruits, vegetables, and vines. The water supply in the region is supported by numerous artificial reservoirs, which require structural improvements and substantial investments for modernization. Areas at risk of desertification are encouraging local farms to adopt more efficient water usage practices, such as micro-irrigation and sub-irrigation systems.
The Calabria region (11%) is intersected by numerous waterways but faces challenges related to infrastructure management and canal maintenance. The main irrigated crops in Calabria include orchards, citrus fruits, and vegetables, with sprinkler and micro-irrigation systems being the most prevalent.
The Campania region, with an irrigated area of just over 60,000 hectares (10%), is characterized by the prevalence of vegetables, orchards, and vines as the main irrigated crops. One of the largest irrigated areas is the Sele Valley, where vegetables destined for both national and international markets are grown. In the region, irrigation water is primarily managed by the drainage corporation; however, interventions are needed to improve irrigation efficiency.
Irrigated agriculture in Sardegna (10%) represents both a challenge and an opportunity for the agricultural sector. The agricultural areas are mainly concentrated in the fertile plains of Campidano and Nurra. The region’s high-value irrigated crops, such as vegetables (artichokes, tomatoes, and zucchini), citrus fruits, orchards (peaches, apricots, and almonds), as well as cereals and fodder, require irrigation, primarily from artificial reservoirs influenced by rainfall. Drip irrigation, used in vegetables and orchards, is widespread; however, it is still common for cereals to use less efficient methods compared to modern irrigation systems.
The Basilicata region (5%) is characterized by flat terrain with natural water resources, particularly in the Bradano, Agri, and Basento River Valleys, as well as artificial sources. Vegetables (tomatoes, potatoes, and peppers) make up a significant portion of the region’s agricultural production, along with orchards (peaches, apricots, and plums). These orchards are primarily irrigated using drip systems (Figure 5) [40].
According to the census data, the aqueduct, irrigation consortium, or other entities and groundwater within the farm are the most common water sources across these regions, with variations depending on the type of crop and the specific region. Surface water and other sources are also used but to a lesser extent. Figure 6a represents the distribution of different irrigation systems used for various crops across Southern Italy. Submersion is the most common irrigation method for grain crops, especially in Campania and Sardegna; micro-irrigation is highly prevalent for vegetable crops, particularly in Basilicata, Sicilia, and Sardegna. Surface sliding and lateral infiltration are also significant, especially for vegetable crops in Campania and Calabria.
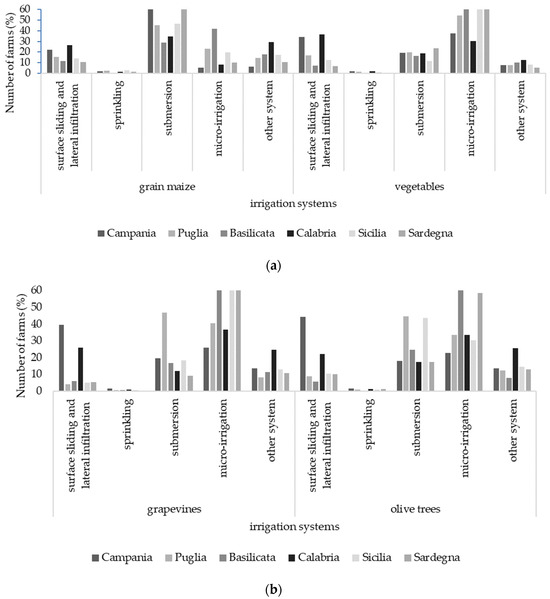
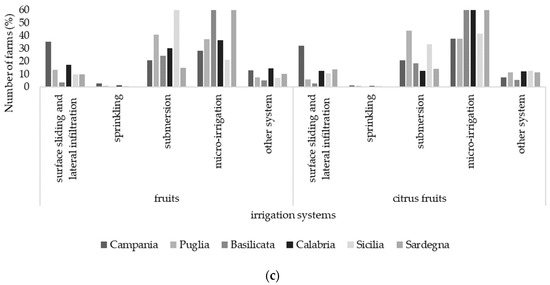
Figure 6.
(a). Farming categorized by irrigation systems (grain, maize, and vegetables). (b). Irrigation systems categorized by irrigated crops (grapevines and olive trees). (c). Irrigation systems categorized by irrigated crops (fruits and citrus fruits).
Figure 6b highlights the regional preferences and practices in irrigation systems for grapevines and olive trees, reflecting the adaptation to local conditions and crop requirements. Micro-irrigation is the most prevalent system for both grapevine and olive trees, especially in regions like Basilicata and Sardegna. Submersion is also widely used, particularly in Puglia for grapevines and in Sicilia for olive trees. Surface sliding and lateral infiltration are notably significant in Campania and Calabria for both crops. Sprinkling is the least used method across all regions and crops.
Finally, Figure 6c highlights regional preferences and practices in irrigation systems for fruits and citrus fruits. Micro-irrigation is the most prevalent method for both fruits and citrus fruits across most regions, particularly in Basilicata and Sardegna. Submersion is also widely used, especially in Sicilia for fruits and in Puglia for citrus fruits. Surface sliding, lateral infiltration, and sprinkling are less commonly used methods.
Figure 7 represents the distribution of irrigated farms by Utilized Agricultural Area (UAA) class, and it shows that 42% of irrigated agricultural farms fall within the UAA class ranging from 1 to 4.99 hectares. This class constitutes a significant portion of the total irrigated farms, ranging from 27.7% in Sardegna to 48.3% in Calabria. Other UAA classes show interesting distribution patterns. For instance, in Sardegna, the 20–49.99 hectare class represents 16.8% of the farms, suggesting a notable presence of medium-sized farms. The prevalence of small irrigated farms may influence water management practices and the irrigation technologies adopted. Smaller farms may have different needs compared to larger ones. The data indicates the need for targeted agricultural policies that support small farms, particularly in terms of access to resources and technologies for efficient irrigation.
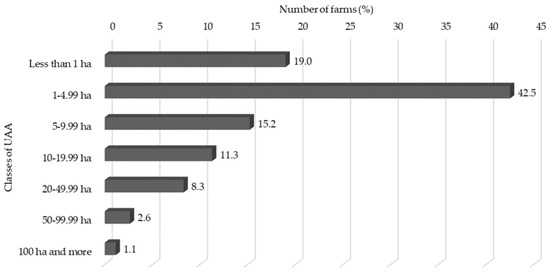
Figure 7.
Distribution of irrigated farms by class of UAA (%).
Figure 8 illustrates the distribution of irrigated farms categorized by their SO classes. A predominance of lower SO classes (below 15,000 euros) indicates a prevalence of small-scale farming operations with limited economic output. These farms are mainly located in Calabria, Campania, and Puglia. On the other side, the Sicilia region shows a diverse distribution with significant percentages in the 4000–8000 (13.7%) and 25,000–50,000 (15.4%) classes, reflecting a mix of small to medium-sized farms.
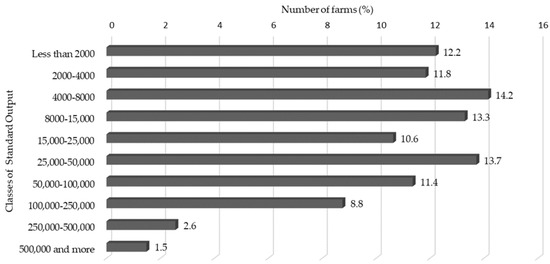
Figure 8.
Distribution of irrigated farms by class of Standard Output (%).
3.2. Type of Farming (ToF) Analysis
Regarding the distribution by ToF (Figure 9), a clear concentration of farms in Southern Italy is observed in permanent crops, which generally represent over 60% of the total, followed by arable/field crops. This indicates a strong emphasis on crops such as olives, grapes, and citrus fruits, which are typical of Mediterranean agriculture. Puglia stands out with an overwhelming 78.5% of farms specializing in permanent crops, followed by Calabria (70.7%) and Sicilia (69.9%). Sardegna shows a more diverse distribution, with notable percentages in specialist grazing livestock (22.2%) and specialist field crops (20.8%), reflecting the region’s mixed agricultural practices. Calabria demonstrates a strong focus on permanent crops (70.7%) and lower percentages in other specializations. The regional variation in agricultural specializations highlights the need for customized technological solutions. Investigating advanced irrigation systems, precision agriculture, and climate-smart practices is crucial to addressing the distinct requirements of each region.
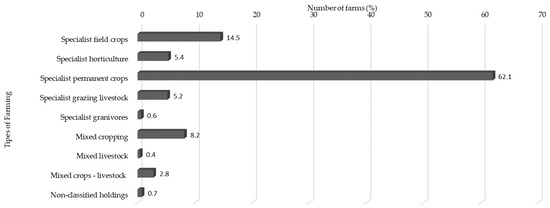
Figure 9.
Distribution of irrigated farms by ToF (%).
This data highlights the regional differences in agricultural practices across Italy. Puglia stands out with a high number of farms specializing in permanent crops and polyculture, indicating a strong focus on these agricultural practices. Sardegna shows a significant number of farms specializing in herbivores, reflecting its emphasis on livestock farming. Campania also has a notable number of mixed farms, suggesting a diverse agricultural approach in this region.
Table 3 shows the number of farms in the 2010 and 2020 censuses by ToF. The data provides a comparative analysis of the distribution of irrigated farms across various specializations in the years 2010 and 2020. The specializations include field crops, horticulture, permanent crops, grazing livestock, granivores, mixed cropping, mixed livestock, mixed crops–livestock, and non-classified holdings.
Table 3.
Number of farms in the 2010 and 2020 censuses by ToF.
The change in the distribution of farms by the ToF reflects a significant evolution in the agricultural sector. A comparison of the 2010 and 2020 data shows a shift in production choices and the adaptation of farms to new market demands, agricultural policies, and environmental challenges.
The increase in specialized farms, particularly those dedicated to permanent crops, is notable, with numbers rising from 1692 in 2010 to 61,967 in 2020. This trend indicates a move toward long-term crops, such as vineyards, orchards, and olive groves, which require higher initial investments but offer stable and sustainable returns in the long term, even in arid conditions. Farms specializing in horticulture (including fruits, vegetables, and flowers) have also grown considerably, increasing from 769 in 2010 to 4317 in 2020.
Mixed crop–livestock farms have also seen a significant rise, growing from 328 in 2010 to 1916 in 2020. This shift reflects a growing emphasis on integrating agricultural activities, allowing farms to diversify income sources and enhance economic resilience. Furthermore, combining crop cultivation with livestock farming promotes more sustainable resource management and efficient use of natural resources.
In general, farms in Southern Italy, due to the region’s climatic conditions and water limitations, tend to focus more on efficient irrigation methods, such as drip irrigation, to optimize the use of available water resources. However, the specific systems adopted vary significantly depending on the unique circumstances of each farm.
3.3. FADN Data Analysis
Starting from the irrigated farms present in the two agricultural censuses of 2010 and 2020, we also identified the farms collected in the FADN survey that are common between the two census surveys. These are 455 farms, of which 26.4% changed their ToF over the 10 years considered, while the remaining farms remained stable. For these shared farms, we analyzed some performance indicators, in particular the Gross Production (GP) and the Net Income (NI) in relation to the UAA, measured in ha, and the Annual Working Units (AWUs). An Annual Working Unit (AWU) represents the equivalent of one person engaged in full-time employment on a farm over the course of a year. Full-time work, in this context, is defined as at least 1800 h annually, typically calculated as 225 working days of 8 h each.
In terms of productivity and profitability of the land (Figure 10), contrary to what one might have expected, the performances of the farms that did not change their ToF in the period considered are better. In fact, both the GP per hectare and the NI per hectare are higher for the farms that continued to do the same activity compared to those that changed their ToF. The situation is common to all the regions considered, with the exception of Campania, where the performance of farms that changed their ToF is better than those that remained stable in their activity. This result can be attributed to a combination of structural, institutional, and environmental factors specific to the region. These elements have encouraged the adoption of more innovative and sustainable agricultural practices, improving the resilience and profitability of the farms. In particular, in Campania, the introduction of multifunctional agricultural advisory services has played a crucial role in facilitating change in the ToF. These services have provided farmers with skills and tools to adopt more diversified and sustainable agricultural practices, improving their decision-making and adaptive capacity. Therefore, farms in Campania have benefited from a favorable context characterized by institutional support, technological innovation, adaptation to environmental challenges, and a change-oriented entrepreneurial culture. These factors have contributed to improving their performance compared to those that have maintained traditional practices.
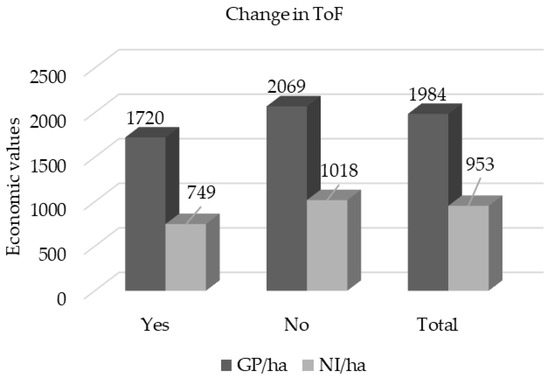
Figure 10.
Values of GP/ha and NI/ha according to the ToF change.
Even in the case of labor productivity and profitability, farms that have remained stable in their ToF over the 10 years considered have higher values of GP per AWU and NI per AWU than farms that have moved towards other ToFs (Figure 11). The change in the ToF reflects a complex set of motivations, such as market factors, institutional incentives, entrepreneurial orientation, and farm strategies [31,32]. Recent studies also highlight how external events—such as economic crises, generational renewal, or regulatory and policy changes—lead to the adoption of new agricultural activities [41,42].
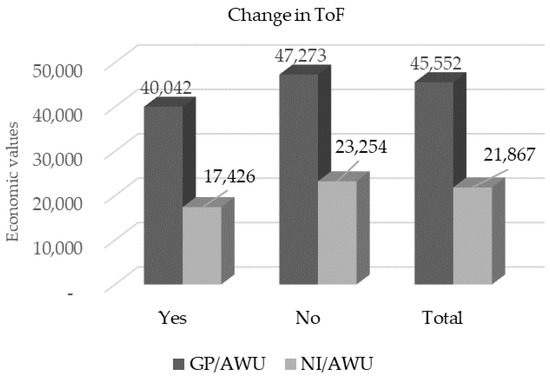
Figure 11.
Values of GP/AWU and NI/AWU according to the ToF change.
3.4. Regression Analysis
In this study, a logistic regression model was employed to examine changes in the ToF of farms and to analyze the relationship between the dependent variable (i.e., change in the ToF) and various independent (explanatory) variables influencing farmers’ decisions.
The validity and reliability of the logit model used in this study were assessed using the Hosmer–Lemeshow test (for goodness of fit) and the Variance Inflation Factor (VIF) to check for multicollinearity. The results of these tests indicated no significant issues that could compromise the model’s reliability, confirming its robustness for this analysis. The presence of irrigation within the farm does not influence the change in ToF since its statistical significance was over 40%, and therefore, we excluded it from the final model. Although the presence of on-farm irrigation infrastructure is theoretically relevant for explaining changes in the productive orientation of farms—given its potential to influence crop diversification and production strategies—the variable was excluded from the final logit regression model. Its coefficient consistently lacked statistical significance across multiple specifications, even after adjusting for potential confounding factors. This result may be due to the low variability of irrigation access within certain subgroups of farms or to collinearity with other structural variables such as farm size, location, or type of production, which already capture part of its effect [26,27,28]. Moreover, following the principle of model parsimony [43], only variables with a statistically significant and robust marginal contribution were retained. The exclusion of irrigation from the final specification did not affect the direction or magnitude of the key explanatory variables nor the overall explanatory power of the model.
The findings revealed several factors that, to varying degrees and in different ways, influence changes in farming types. The main results of the logistic regression model are presented in Table 4.
Table 4.
Results of the logistic regression model.
The findings of the logistic regression analysis underscore that farmers’ decisions to change their ToF are predominantly influenced by two key variables: the initial ToF and the farmer’s gender. Additionally, structural characteristics such as the farm’s physical size (measured as the UAA) and its economic size class appear to play a secondary role in shaping these decisions. Other explanatory variables that emerged as relevant include the farm’s legal status and the presence of livestock farming. While the inclusion of organic farming practices initially seemed to support adaptive behavior, the statistical analysis reveals only a weak association with ToF change. Specifically, the variable shows a negative coefficient with marginal statistical significance (p ≈ 0.10), suggesting a reduced likelihood of change among organic farms—an outcome that challenges prior assumptions about the transformative potential of organic agriculture.
A further point of interest concerns the role of economic indicators. Notably, none of the economic variables included in the initial specification of the model exerted a statistically or substantively significant effect on the probability of changing the ToF. In all cases, their odds ratios approximated unity, indicating a negligible influence on the dependent variable. Consequently, these variables were omitted from the final model specification due to their lack of explanatory power.
Among the farmer-specific characteristics evaluated—namely, gender, age, and educational attainment—only gender emerged as statistically significant. Detailed insights into the most influential variables are as follows:
- -
- Gender: The coefficient for gender is positive and statistically significant (0.678, p < 0.01), suggesting that male farmers (coded as 1) are significantly more likely to alter their production orientation. The odds ratio of 1.97 indicates that men are nearly twice as likely to change their ToF compared to women.
- -
- Initial ToF: This variable exerts a strong and highly significant influence on the probability of change (p < 0.001). An odds ratio of 1.267 implies that each unit increase in the initial farming type index is associated with a 26.7% rise in the likelihood of transitioning to a different production orientation. This result highlights the path-dependent nature of agricultural decision-making.
- -
- Legal Form: A negative and significant coefficient (p < 0.05), with an odds ratio of 0.346, indicates that farms operating under more formal legal entities (e.g., corporations, cooperatives) exhibit a markedly lower propensity to change their ToF compared to individual or family-run operations.
- -
- Livestock Units (LSUs): The presence of livestock farming is associated with a slight but statistically significant decrease in the likelihood of change (p < 0.05). The odds ratio of 0.993 suggests that increasing livestock intensity marginally reduces the probability of altering the farming system, potentially due to greater asset specificity and sunk costs in livestock enterprises.
- -
- Organic Farming: Although this variable exhibits a negative coefficient, its significance is marginal (p ≈ 0.10), and the odds ratio of 0.698 points toward a lower likelihood of ToF change among organic producers. This finding appears to contrast with common narratives regarding the dynamic and innovative nature of organic systems.
- -
- UAA and Economic Size Class: Neither variable is statistically significant (p > 0.10). While UAA displays a positive coefficient, the odds ratios for both variables are near 1, suggesting their limited influence on the dependent variable.
Finally, the model’s goodness of fit, as measured by the McFadden pseudo R2, is 0.0559 (approximately 5.6%). Although relatively low, this is consistent with expectations for logistic regression models in the context of complex, behaviorally driven phenomena such as agricultural transition decisions. The value of the model thus lies not in its overall explanatory power but in the significance and interpretability of the identified predictors, which collectively offer insights into the structural and socio-economic dimensions shaping farm-level strategic change.
4. Conclusions
- Research Findings
This study analyzed a comprehensive dataset of 145,712 irrigated farms located in Southern Italy, derived from the seventh Italian General Agricultural Census. The findings reveal that more than 60% of these farms are specialized in permanent crops, typical of Mediterranean agriculture. The farms show a marked preference for efficient irrigation systems, particularly drip irrigation, underscoring their adaptation to water scarcity and the need for sustainable resource management.
A comparison of the 2010 and 2020 agricultural censuses demonstrates a significant shift in farming strategies and market orientation, indicating an adaptive response to environmental and economic pressures. However, analysis of FADN data suggests that changes in the ToF have not translated into improvements in productivity or profitability, either in terms of land or labor.
Logistic regression analysis indicates that structural characteristics such as UAA, farm economic size, and farmer demographics—especially gender—are significant determinants of changes in the ToF. Notably, the adoption of organic farming practices and larger farm sizes are positively associated with a shift in the ToF. Conversely, economic variables such as income and farm economic size do not directly drive these changes.
- Policy Implications
Agriculture heavily depends on water resources, which face challenges like over-extraction and pollution from agricultural activities. In the European Union, increasing water stress and scarcity are worsened by climate change, especially in Southern Europe. The European Commission is addressing these issues through the European Water Resilience Strategy, aiming to improve water security. This strategy focuses on water efficiency, pollution control, and addressing water-related risks. It also promotes clean technologies, circular economy practices, and digitalization in water management [44,45].
Southern Italy and Southern Europe are facing a climate crisis that requires urgent and coordinated interventions. Future projections suggest that, without significant action to reduce greenhouse gas emissions and improve adaptation strategies, the negative impacts on these regions will continue to intensify, threatening not only the natural environment but also the quality of life and the local economy.
The prevalence of permanent crops and the widespread adoption of drip irrigation systems emphasize the urgent need for targeted agricultural policies. In particular, small and fragmented farms require improved access to water-saving technologies and technical support to strengthen climate resilience and sustainability. Policymakers should prioritize investments in clean technologies, promote the transition to less water-intensive crops, and support farm-level adaptation strategies through economic incentives and knowledge transfer. From an agricultural perspective, the main challenge remains the sustainable management of water amid growing scarcity and climate change. Despite support from the CAP and EU directives, critical issues persist, such as inconsistent controls on water abstraction, insufficient economic incentives for water efficiency, and unequal cost distribution. At the EU level, policies like the Common Agricultural Policy (CAP) and the European Climate Law significantly influence farm-level decisions. The CAP’s recent reform, with its focus on “green architecture” (e.g., eco-schemes, agri-environment-climate measures), offers both incentives and constraints for adopting sustainable practices. Likewise, the European Climate Law, aiming for climate neutrality by 2050, increases pressure on agriculture to decarbonize and adapt. However, policy effectiveness varies by country and region, depending on implementation, administrative capacity, and farmers’ access to information and support. Agriculture is being called to adopt more resilient practices, invest in modern infrastructure, and promote nature-based solutions to enhance soil water retention. A paradigm shift is needed—one that rewards the rational and sustainable use of water resources through clear and uniformly enforced rules [39,40].
The choice of less water-demanding crops offers numerous advantages, such as reducing water usage, minimizing the environmental impact of agriculture (in terms of water pollution), contributing to greater environmental sustainability, enhancing resilience to climate change, and diversifying production. This diversification helps stabilize farmers’ incomes and reduces dependence on single crops.
- Limitation of the work
The main limitation of this work lies in the use of the FADN database. Specifically, the presence of irrigation on the farm is not considered when establishing or selecting the FADN sample. As a result, the number of farms in our case study appears somewhat limited for an in-depth analysis of this topic. Therefore, it would be advisable and potentially necessary to complement the FADN sample with a targeted survey to fully capture the structural and economic factors influencing changes in the type of farming on farms. Additionally, to address the current limitations of the FADN sample, particularly its lack of irrigation-specific data, we suggest combining FADN data with external sources (e.g., satellite or geospatial data) and strengthening the territorial dimension of the survey, as tested in pilot initiatives. The literature supports this need [46,47,48], pointing out the analytical limitations stemming from the lack of detailed irrigation information.
- Future research
Possible future developments of this work include a more in-depth analysis of the relationship between the presence or absence of irrigation on the farm and the types of crops cultivated. This will help examine the structural and economic factors that influence the formation of farm net income in both scenarios: with and without irrigation.
In future research, we intend to explicitly investigate the role of agricultural and climate-related policies in influencing farm-level transitions. In this regard, acknowledging the significance of the political and institutional context, we aim to integrate a comprehensive policy analysis into our framework. Linking our empirical findings to relevant policy instruments—such as the Common Agricultural Policy (CAP) and the European Climate Law—may substantially enhance the study’s relevance and potential policy impact. Particular attention will be devoted to understanding how these instruments interact with structural, socio-economic, and territorial dynamics that shape farmers’ decision-making processes.
Author Contributions
Conceptualization, S.C. and C.C.; methodology, S.C., C.C., and O.C.; validation, C.C. and O.C.; formal analysis, S.C., C.C., and O.C.; data curation, C.C. and O.C.; writing—original draft preparation, S.C. and C.C.; writing—review and editing, S.C., C.C., and O.C. All authors have read and agreed to the published version of the manuscript.
Funding
This research received no external funding.
Data Availability Statement
Data is unavailable due to privacy restrictions.
Conflicts of Interest
The authors declare no conflicts of interest.
References
- Intergovernmental Panel on Climate Change (IPCC). Climate Change 2022: Impacts, Adaptation and Vulnerability. Contribution of Working Group II to the Sixth Assessment Report of the Intergovernmental Panel on Climate Change; Pörtner, H.-O., Roberts, D.C., Tignor, M., Poloczanska, E.S., Mintenbeck, K., Alegría, A., Craig, M., Langsdorf, S., Löschke, S., Möller, V., Okem, A., Rama, B., Eds.; Cambridge University Press: Cambridge, UK, 2022. [Google Scholar] [CrossRef]
- European Environment Agency (EEA). European Climate Risk Assessment—Executive Summary; EEA Report 01/2024; Publications Office of the European Union: Luxembourg, 2024; ISBN 978-92-9480-627-7. [Google Scholar] [CrossRef]
- European Environment Agency (EEA). Urban Adaptation to Climate Change in Europe 2016—Transforming Cities in a Changing Climate; EEA Report 12/2016; Publications Office of the European Union: Luxembourg, 2016; ISBN 978-92-9213-742-7. [Google Scholar] [CrossRef]
- Toreti, A.; Bavera, D.; Acosta Navarro, J.; Acquafresca, L.; Arias-Muñoz, C.; Avanzi, F.; Barbosa, P.; Cremonese, E.; De Jager, A.; Ferraris, L.; et al. Drought in the Mediterranean Region—January 2024; Publications Office of the European Union: Luxembourg, 2024; JRC137036; ISBN 978-92-68-12861-9. [Google Scholar] [CrossRef]
- Braca, G.; Mariani, S.; Lastoria, B.; Tropeano, R.; Casaioli, M.; Piva, F.; Marchetti, G.; Bussettini, M. Bilancio Idrologico Nazionale: Stime BIGBANG e Indicatori Sulla Risorsa Idrica. Aggiornamento al 2023; Rapporti n. 401/2024; Istituto Superiore per la Protezione e la Ricerca Ambientale (ISPRA): Rome, Italy, 2024. Available online: https://www.isprambiente.gov.it/it/pubblicazioni/rapporti/rapporto-401-2024 (accessed on 10 December 2024)ISBN 978-88-448-0993-4.
- Sistema Nazionale per la Protezione dell’Ambiente (SNPA). Il Clima in Italia Nel 2023; Report Ambientali SNPA n. 42/2024; Istituto Superiore per la Protezione e la Ricerca Ambientale (ISPRA): Rome, Italy, 2024; Available online: https://www.snpambiente.it/snpa/il-clima-in-italia-nel-2023/ (accessed on 10 December 2024)ISBN 978-88-448-1217-1.
- European Commission, Directorate-General for Environment. River Basin Management in a Changing Climate—Common Implementation Strategy for the Water Framework Directive and the Floods Directive; Publications Office of the European Union: Luxembourg, 2024; ISBN 978-92-68-19443-0. [Google Scholar] [CrossRef]
- European Parliament and Council. Regulation (EU) 2021/1119 of the European Parliament and of the Council of 30 June 2021 establishing the framework for achieving climate neutrality and amending Regulations (EC) No 401/2009 and (EU) 2018/1999 (European Climate Law). Off. J. Eur. Union 2021, L 243, 1–17. [Google Scholar]
- Trimmel, H.; Weihs, P.; Leidinger, D.; Formayer, H.; Kalny, G.; Melcher, A. Can Riparian Vegetation Shade Mitigate the Expected Rise in Stream Temperatures Due to Climate Change during Heat Waves in a Human-Impacted Pre-Alpine River? Hydrol. Earth Syst. Sci. 2018, 22, 437–461. [Google Scholar] [CrossRef]
- Cramer, W.; Guiot, J.; Marini, K.; Seneviratne, S.I.; Zommers, Z.; Almazroui, M.; Djalante, R.; Ebi, K.L.; Engelbrecht, F.; Hoegh-Guldberg, O.; et al. Chapter 4: Water. In Climate Change 2022: Impacts, Adaptation and Vulnerability. Contribution of Working Group II to the Sixth Assessment Report of the Intergovernmental Panel on Climate Change; Pörtner, H.-O., Roberts, D.C., Tignor, M., Poloczanska, E.S., Mintenbeck, K., Alegría, A., Craig, M., Langsdorf, S., Löschke, S., Möller, V., et al., Eds.; Cambridge University Press: Cambridge, UK; New York, NY, USA, 2022; pp. 551–712. Available online: https://www.ipcc.ch/report/ar6/wg2/chapter/chapter-4/ (accessed on 9 January 2025).
- Mariani, S.; Braca, G.; Romano, E.; Lastoria, B.; Bussettini, M. Linee Guida Sugli Indicatori di Siccità e Scarsità Idrica da Utilizzare Nelle Attività Degli Osservatori Permanenti per gli Utilizzi Idrici. ISPRA. 2018. Available online: http://www.isprambiente.gov.it/pre_meteo/idro/Osservatori/Linee%20Guida%20Pubblicazione%20Finale%20L6WP1_con%20copertina_ec.pdf (accessed on 9 January 2025).
- Pan, S.; He, Z.; Gu, X.; Xu, M.; Chen, L.; Yang, S.; Tan, H. Agricultural Drought-Driven Mechanism of Coupled Climate and Human Activities in the Karst Basin of Southern China. Sci. Rep. 2024, 14, 12072. [Google Scholar] [CrossRef]
- Saleem, A.; Anwar, S.; Nawaz, T.; Fahad, S.; Saud, S.; Ur Rahman, T.; Khan, M.N.R.; Nawaz, T. Securing a Sustainable Future: The Climate Change Threat to Agriculture, Food Security, and Sustainable Development Goals. J. Umm Al-Qura Univ. Appl. Sci. 2024, 6, 2346–2394. [Google Scholar] [CrossRef]
- Pourshirazi, S.; Soltani, A.; Zeinali, E.; Arshad, A. Assessing the Sensitivity of Alfalfa Yield Potential to Climate Impact under Future Scenarios in Iran. Environ. Sci. Pollut. Res. 2022, 29, 61093–61106. [Google Scholar] [CrossRef]
- Ashraf, M.; Arshad, A.; Patel, P.M.; Khan, A.; Qamar, H.; Siti-Sundari, R.; Ghani, M.U.; Amin, A.; Babar, J.R. Quantifying Climate-Induced Drought Risk to Livelihood and Mitigation Actions in Balochistan. Nat. Hazards 2021, 109, 2127–2151. [Google Scholar] [CrossRef]
- Adaawen, S. Understanding Climate Change and Drought Perceptions, Impact and Responses in the Rural Savannah, West Africa. Atmosphere 2021, 12, 594. [Google Scholar] [CrossRef]
- Khosravi, Y.; Homayouni, S.; St-Hilaire, A. An Integrated Dryness Index Based on Geographically Weighted Regression and Satellite Earth Observations. Sci. Total Environ. 2024, 911, 168807. [Google Scholar] [CrossRef]
- European Commission. Implementing Regulation (EU) 2020/1652 of 4 November 2020 amending Implementing Regulation (EU) 2015/220 laying down rules for the application of Council Regulation (EC) No 1217/2009 setting up a network for the collection of accountancy data on the incomes and business operation of agricultural holdings in the European Union. Off. J. Eur. Union 2020, L 372, 1–49. [Google Scholar]
- ISTAT. 7th General Census of Agriculture: Preliminary Results; Italian National Institute of Statistics (ISTAT): Rome, Italy, 2022; Available online: https://www.istat.it/en/archive/267266 (accessed on 29 January 2025).
- FADN European Commission. Agri-Food Data Portal: Farm Economics. 2024. Available online: https://agridata.ec.europa.eu (accessed on 29 January 2025).
- Briamonte, L.; Cesaro, L.; Scardera, A. Guest Editorial: Current Use and New Perspectives for the Farm Accountancy Data Network. Econ. Agro-Aliment. 2022, 23, 1–5. [Google Scholar] [CrossRef]
- Kelly, E.; Latruffe, L.; Desjeux, Y.; Ryan, M.; Uthes, S.; Diazabakana, A.; Finn, J. Sustainability Indicators for Improved Assessment of the Effects of Agricultural Policy Across the EU: Is FADN the Answer? Ecol. Indic. 2018, 89, 903–911. [Google Scholar] [CrossRef]
- Cardillo, C.; Vitali, G. Mapping Data Granularity: The Case of FADN. Econ. Agro-Aliment. 2021, 23, 3. [Google Scholar] [CrossRef]
- Henke, R.; Cimino, O.; Vanni, F. The Role of Diversification in the Revenue Composition of Italian Farms. Ital. Rev. Agric. Econ. 2022, 77, 25–38. [Google Scholar] [CrossRef]
- Coppola, A.; Scardera, A.; Amato, M.; Verneau, F. Income Levels and Farm Economic Viability in Italian Farms: An Analysis of FADN Data. Sustainability 2020, 12, 4898. [Google Scholar] [CrossRef]
- Dunkler, D.; Plischke, M.; Leffondré, K.; Heinze, G. Augmented Backward Elimination: A Pragmatic and Purposeful Way to Develop Statistical Models. PLoS ONE 2014, 9, e113677. [Google Scholar] [CrossRef]
- Greene, W.H. Econometric Analysis, 8th ed.; Pearson Education: Boston, MA, USA, 2018. [Google Scholar]
- Wooldridge, J.M. Econometric Analysis of Cross Section and Panel Data, 2nd ed.; MIT Press: Cambridge, MA, USA, 2010. [Google Scholar]
- Train, K.E. Discrete Choice Methods with Simulation, 2nd ed.; Cambridge University Press: Cambridge, UK, 2009. [Google Scholar]
- Bursac, Z.; Gauss, C.H.; Williams, D.K.; Hosmer, D.W. Purposeful Selection of Variables in Logistic Regression. Source Code Biol. Med. 2008, 3, 17. [Google Scholar] [CrossRef]
- Gasson, R.; Errington, A. The Farm Family Business; CAB International: Wallingford, UK, 1993. [Google Scholar]
- Vik, J.; McElwee, G. Diversification and the Entrepreneurial Motivations of Farmers in Norway. J. Small Bus. Manag. 2011, 49, 390–410. [Google Scholar] [CrossRef]
- Hosmer, D.W.; Lemesbow, S. Goodness of fit tests for the multiple logistic regression model. Commun. Stat.—Theory Methods 1980, 9, 1043–1069. [Google Scholar] [CrossRef]
- IPCC. Climate Change and Land: An IPCC Special Report on Climate Change, Desertification, Land Degradation, Sustainable Land Management, Food Security, and Greenhouse Gas Fluxes in Terrestrial Ecosystems; IPCC: Geneva, Switzerland, 2019. [Google Scholar]
- Hoegh-Guldberg, O.; Jacob, D.; Taylor, M.; Bindi, M.; Brown, S.; Camilloni, I.; Diedhiou, A.; Djalante, R.; Ebi, K.L.; Engelbrecht, F.; et al. 2018: Impacts of 1.5 °C Global Warming on Natural and Human Systems. In Global Warming of 1.5 °C. An IPCC Special Report on the Impacts of Global Warming of 1.5 °C Above Pre-Industrial Levels and Related Global Greenhouse Gas Emission Pathways, in the Context of Strengthening the Global Response to the Threat of Climate Change, Sustainable Development, and Efforts to Eradicate Poverty; Masson-Delmotte, V., Zhai, P., Pörtner, H.-O., Roberts, D., Skea, J., Shukla, P.R., Pirani, A., Moufouma-Okia, W., Péan, C., Pidcock, R., et al., Eds.; IPCC: Geneva, Switzerland, 2018; pp. 175–311. Available online: www.climateanalytics.org (accessed on 29 January 2025).
- Sacchelli, S.; Fabbrizzi, S.; Bertocci, M.; Marone, E.; Menghini, S.; Bernetti, I. Un modello mix-method per l’adattamento ai cambiamenti climatici nel settore agricolo: Un caso di studio per le aziende vinicole italiane. J. Clean. Prod. 2017, 166, 891–900. [Google Scholar] [CrossRef]
- European Environment Agency (EEA). Adattamento ai Cambiamenti Climatici nel Settore Agricolo in Europa; EEA Report No. 112/2019; European Environment Agency: Copenhagen, Denmark, 2019; Available online: https://www.eea.europa.eu/it/publications/adattamento-ai-cambiamenti-climatici-nel (accessed on 4 March 2025).
- European Environment Agency. Perdite Economiche da Eventi Estremi Legati al Clima in Europa. European Environment Agency: Copenhagen, Denmark, 2019; Available online: https://www.eea.europa.eu/ (accessed on 4 March 2025).
- CREA. Annuario dell’Agricoltura Italiana; CREA: Roma, Italia, 2024; Volume LXXVII, ISBN 9788833854083. [Google Scholar]
- CREA. L’Agricoltura Italiana Conta; CREA: Roma, Italia, 2022. [Google Scholar]
- Sutherland, L.-A.; Burton, R.J.F.; Ingram, J.; Blackstock, K.L.; Slee, B.; Gotts, N. Triggering Change: Towards a Conceptualisation of Major Change Processes in Farm Decision-Making. J. Environ. Manag. 2012, 104, 142–151. [Google Scholar] [CrossRef] [PubMed]
- Giuliani, A.; Belletti, G. Exploring the Role of Protected Geographical Indications in Rural Development: Evidence from Italy. Int. J. Sociol. Agric. Food 2019, 25, 207–226. [Google Scholar]
- Burnham, K.P.; Anderson, D.R. Model Selection and Multimodel Inference: A Practical Information-Theoretic Approach, 2nd ed.; Springer: New York, NY, USA, 2002. [Google Scholar]
- European Environment Agency (EEA). Environment Policy and Protection of the Environment; Report 01/2024; European Environment Agency (EEA): Copenhagen, Denmark, 2024; ISBN 978-92-9480-678-9. ISSN 1977-8449. [Google Scholar] [CrossRef]
- European Commission (EC). Statement on a Vision for Agriculture and Food by Agriculture and Rural Development Committee Chair; COM(2025) 75 final; European Commission (EC): Brussels, Belgium, 2025. [Google Scholar]
- Poppe, K.; Vrolijk, H. Farm Sustainability Data for Better Policy Evaluation with FADN; Report 2017-061; Wageningen Economic Research: Wageningen, The Netherlands, 2017; ISBN 978-94-6343-203-0. [Google Scholar]
- Bonfante, A.; Basile, A.; Acutis, M.; Manna, P. A new paradigm for the estimation of irrigation needs: Integrating satellite data and agro-hydrological modeling. Agric. Water Manag. 2020, 239, 106267. [Google Scholar] [CrossRef]
- Guastalla, G.; Moro, D. Water use efficiency and farm performance in southern italy: Evidence from FADN data. Water Resour. Econ. 2021, 35, 100185. [Google Scholar] [CrossRef]
Disclaimer/Publisher’s Note: The statements, opinions and data contained in all publications are solely those of the individual author(s) and contributor(s) and not of MDPI and/or the editor(s). MDPI and/or the editor(s) disclaim responsibility for any injury to people or property resulting from any ideas, methods, instructions or products referred to in the content. |
© 2025 by the authors. Licensee MDPI, Basel, Switzerland. This article is an open access article distributed under the terms and conditions of the Creative Commons Attribution (CC BY) license (https://creativecommons.org/licenses/by/4.0/).