Abstract
In conventional hydrology, a short-duration design rainstorm is typically used to estimate the design discharge in urban sewer systems. The reason for using a short duration is that engineers believe the time of concentration in urban watersheds is relatively small. The short-duration hyetograph is supposed to generate a flow hydrograph that accurately reflects the rainfall-runoff processes. In this study, we developed a street-sewer runoff model for an urban district of 2470 hectares. Detailed field flooding records were utilized to verify the stormwater model’s capability for inundation simulations. Subsequently, different rainfall series extracted from the recorded rainstorm data were used to investigate the causes of flooding corresponding to different durations of rainstorms. The results indicate that a 90 min main concentrated rainstorm causes small-scale flooding only; however, a 24 h rainfall series results in an extensive range of inundations. We further conducted similar short- and long-duration hyetograph tests in 16 urban drainage partitions (ranging from 2.3 to 193.5 hectares) to confirm the above findings. The results indicate that the maximum discharge in most partitions can only be found when the hyetograph duration exceeds 1080 min, which essentially contradicts previous engineering designs in urban watersheds in Taiwan.
1. Introduction
Increasing impervious areas due to urbanization have enlarged the peak flow and resulted in frequent street flooding during the rainy season. Regarding flooding events, it is interesting to determine whether local inundations result from the magnitude of rainstorm events exceeding the design criteria or if the sewer system design fails to meet the required protection standards. An accurate estimation of the design discharge is one of the most critical tasks for flood control, as the size of hydraulic structures relies on accurate design discharge estimation. The estimations can be obtained at flow-gauged sites by frequency analysis using the annual maximum series. On the other hand, the design hyetograph is usually used as the input of rainfall-runoff models to estimate the design discharge in flow-ungauged sites. In practice, the T-year rainstorm may not produce a T-year peak discharge. It is only approximately valid if the antecedent moisture and the temporal rainfall distribution are set well. Although the reliability of converting from a design hyetograph to a design discharge is questionable, hydrologists have not yet developed a better solution. The design hyetograph can be generated directly from rainstorm records or intensity–duration–frequency (IDF) curves. Representative methods in the first category include those proposed by Huff [1], Pilgrim and Cordery [2], and Yen and Chow [3]. The Chicago method [4], the alternating block method [5], and the double-triangular hyetograph [6] are representatives of the second category.
The shape of a design hyetograph is mainly determined by the duration and peak of rainfall intensity. The duration of the design hyetograph should depend on the watershed size, land use, soil conditions, and the protection level. Marsalek and Watt [7] suggested that the duration should be appropriate to the catchment time constant (or nearly equal to the time of concentration); for small watersheds, the duration can be set from 30 to 60 min. Chow et al. [5] applied the alternating block method for hyetograph calculations. A short duration of 2 h was adopted in Denver City, and the peak intensity was calculated using the IDF curve corresponding to a 10 min time interval. Wenzel and Voorhees [8] reported that an appropriate choice for the design storm’s duration and antecedent moisture condition is important for producing a peak flow corresponding to the desired return period. Levy and McCuen [9] suggested analyzing the duration of rainstorms to produce the annual maximum discharge needed using historical rainfall/discharge records, where the annual maximum discharge is mainly caused by 24 h rainstorms in watershed areas as small as 2 square miles. Alfieri et al. [10] conducted numerical experiments to assess the adequacy of using a design hyetograph for peak discharge generation. They found that the flood peaks produced by design hyetographs are consistently biased in most cases.
Kimoto et al. [11] compared several design storms with observed records and concluded that observed storms were less intense than all the design storms considered, especially for short durations. Na and Yoo [12] evaluated design storms in Korea and reported that the alternating block method best agreed with observed storms. Krvavica and Rubinic [13] applied six different design storms to evaluate the discrepancy between recorded flood rates and flood modeling results. They concluded that design storms derived from IDF curves typically overestimated flooding, whereas those derived from observed temporal patterns matched or slightly underestimated the actual flooding results. Sharma et al. [14] proposed a simple procedure to estimate design runoff (Q) using design storm (P) and design curve number (CN) values. They found that the computed design Q from design CN values was either very close to or slightly greater than the observed Q in 10 Indian catchments. Szeląg et al. [15] presented a method to analyze the effect of design rainfall characteristics with intensity–duration–frequency (IDF) curves regarding the uncertainty of overfilled manholes in the sewerage network. Jidai et al. [16] investigated the design problem using design rainstorms and found that a temporal series of design rainstorms showed general growth under each return period in China. More recently, Shen et al. [17] applied the alternating block method according to the Cincinnati IDF curve for a 6 h design rainstorm to investigate urban flooding risk.
In summary, the design storm duration should correspond to the duration that yields the maximum peak flow. Previously, it has been treated as a local empirical function regarding the drainage area [18] or arbitrarily selected without specified reasons [17]. In small and impervious catchments, the critical rainfall duration is usually related to the time of concentration [19]. In partially urbanized watersheds, the antecedent condition affects the rainfall-runoff process; therefore, determining the critical rainfall duration becomes more complicated [13,20]. Researchers have reported that the most adverse conditions for a sewer system occur when the rainfall duration is twice as long as the time of sewage flow through the sewer system [21]. However, the connection between the time of concentration and peak discharge in urban watersheds has not been confirmed, and the method of estimating the time of concentration is also challenging.
According to Taiwan’s flooding records from 2018 to 2022, eight typhoons and eight concentrated rainfall events caused severe disasters in urban districts. We found that the flooding resulted from rainstorms that lasted longer than 180 min. Hence, it raises the question of whether a very short-duration hyetograph used in previous projects would lead to inappropriate hydraulic structure designs and how we can improve the design processes in Taiwan. In this study, we selected Linyuan District in southern Taiwan as a test site. This district was recently threatened by two severe floods in May 2020 and June 2021, for which the Emergency Management Information Cloud (EMIC) of Taiwan has detailed inundation records for model verification. We performed a series of numerical simulations and tests in the Linyuan District to investigate the influence of different rainstorm durations on peak discharge generation. Moreover, the adequacy of using a short-duration design hyetograph was also examined in 16 other urban drainage partitions in Taiwan to confirm the findings of this study.
2. Urban Storm Runoff Modeling
This study developed a street-sewer runoff model using the Storm Watershed Management Model (SWMM) to imitate stormwater in urban areas. The SWMM was developed by the US Environmental Protection Agency in 1971 to satisfy the necessity for stormwater simulation in urban environments. The model can be used for sewer planning and design, flood analysis, and evaluating the performance of stormwater green infrastructure strategies [22]. Hydrological phenomena are built into the modeling system, including evaporation, snowmelt, interception, infiltration, and deep percolation, to generate surface runoff, interflow, and groundwater. Urban drainage facilities such as pipes, open channels, culverts, pumps, weirs, orifices, detention pools, and water treatment facilities can be considered simultaneously. In addition, the SWMM provides a compound module, a street-sewer runoff model, by connecting the overflow from the underground sewer to induce street flooding. The compound module can be used to simulate city floods under high-return period conditions [17].
2.1. Overland and Channel Flow Simulations
In performing the subcatchment runoff simulation using SWMM, the subcatchment is described using a plane with a uniform slope and width, draining the runoff to a single outlet channel. The continuity of the flow can be expressed as follows:
where d is the flow depth; i is the rainfall rate; e is the surface evaporation rate; f is the infiltration rate; and q is the runoff rate. The surface runoff is computed by applying the continuity equation (Equation (1)). Each subcatchment area is treated as a nonlinear reservoir in the SWMM to generate surface runoff on the subcatchment areas that receive precipitation. The outflow of the subcatchment can be expressed as follows:
where Q is the flow rate; W is the width of the subcatchment; S is the average slope of the subcatchment; d is the net excess ponds atop the subcatchment surface; ds is the depression storage depth; is the flow height across the subcatchment surface; and n is the surface roughness coefficient. Infiltration in the nonlinear reservoir can be estimated using SCS-CN, Green and Ampt, and Horton’s Equation.
Flow routing for channels and pipes is governed by the conservation of mass and momentum equations for unsteady free-surface flow (St. Venant) equations. There are three options for flow routing depending on the simplification level of the equations: steady flow routing, kinematic-wave routing, and dynamic-wave routing. The continuity equation of the pipe/open channel flow can be expressed as follows:
where A is the cross-sectional area of the flux, and Q is the flow rate. The momentum equation for dynamic-wave routing is the following:
where H is the hydraulic head of water; Z is the conduit invert elevation; and Y is the conduit water depth. Sf is the friction slope, and g is the acceleration of gravity. Equations (3) and (4) can be used to calculate the flow Q in the conduits and the head at the nodes of the conveyance network. Since these equations cannot be solved analytically, a numerical solution procedure must be adopted instead. The SWMM uses an implicit backward Euler method to solve Equations (3) and (4).
2.2. Street-Sewer Runoff Model Structure
A street-sewer SWMM (1D/1D SWMM) was developed to dynamically connect the open-channel-type street flow and the pressure-pipe-type sewer flow based on the geometry data of the street and sewer. The urban drainage model simultaneously simulates the rainfall-runoff process of the street and the sewer, and the exchange of the floodwater between the street and sewer is conducted through manhole nodes. The runoff on the street can enter the sewer system through the roadside ditch or manhole. Conversely, the flow in the sewer system can also overflow into the street system through the ditch or manhole.
The manholes can be described as wide-crested weirs when the rainwater flows from the street to the sewer system, and the length of the crest equals the manhole perimeter. When the sewer system is full, the weir flow formula is converted to the orifice flow formula, where the driving force head is the head difference between the sewer pressure head and the ground surface water level. A dynamic-wave routing can be applied to consider the backwater effect and the variation in the water level in the manhole. Hence, the stormwater will move along the street according to the water levels between the adjacent nodes, so the direction of stormwater on the street may not be the same as that of the underground sewer.
3. Flooding Simulations in the Test Sites
Most flow records can be collected at reservoirs or river channel reaches for hydrological analysis; however, flow records are usually unavailable in urban sewer systems. Considering the increasing frequency of urban flooding in recent years caused by climate change, the National Land Management Agency of Taiwan has installed sewer-water-level gauges in flood-prone areas since 2018. The water level record can be used to calibrate the sewer model parameters and verify the accuracy of the simulations, facilitating the subsequent improvement of urban drainage systems. In this study, street-sewer runoff models were developed for the Linyuan District, located in the southeastern coastal area of Kaohsiung City, Taiwan (Figure 1). Detailed field inundation records from two severe rainstorms were utilized to verify the stormwater model’s capability for inundation simulations. Tests of the hyetograph duration were further conducted in four other districts (a total of 16 urban drainage partitions) to confirm the reliability of the analysis results found in this study.
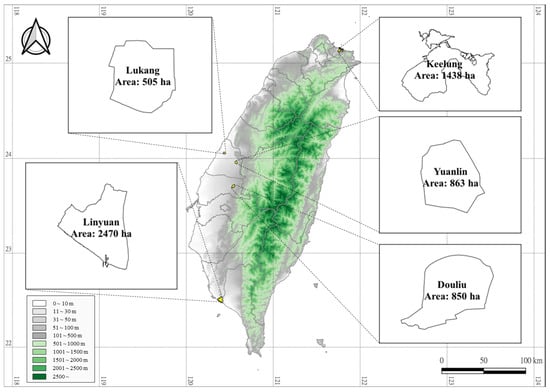
Figure 1.
Geographical location and topography of the Linyuan District and four other urban watersheds.
3.1. Description of Linyuan District
The Linyuan District is located in the southwest coastal area of Kaohsiung City in Taiwan (as shown in the lower-left corner of Figure 1). Due to the low-lying terrain, flooding frequently occurs during heavy rainstorms, especially in the high tide periods. Along with the continuous urban renewal and rezoning development in recent years, the increase in impervious areas, reducing infiltration capacity, has resulted in more frequent flooding in low-lying areas.
The area of the Linyuan District watershed is 2470 hectares. The ground elevation is between 1.5 m and 10 m, and the terrain slopes from north to south with an average slope of about 0.13%. The surface runoff in this area was collected by Zhongkengmen drainage, Gangzipu drainage, Zhongyun drainage, Linyuan drainage, and Shanwei drainage, and finally discharged into the Taiwan Strait. The storm sewer and sanitary sewer are separated in this district. The total length of the sewer network is about 8.79 km, and the length of the roadside ditch (in the area without an underground sewer) is 28.12 km. The storm sewer size was designed using the rational method corresponding to a 5 yr protection level. The 5 yr intensity-duration equation is expressed as follows:
where i is the rainfall intensity in mm/h, and td is the duration in min. As shown in Equation (5), the rainfall intensity is relatively high in the Linyuan District. The 1 h rainfall intensity reached 80 mm/h under the 5 yr return period condition.
3.2. Verification of the Street-Sewer Stormwater Model
The rainfall and inundation records of two heavy rainstorms that occurred on 22 May 2020 and 6 June 2021 in Linyuan District were collected to verify the capability of the developed street-sewer runoff model for the flooding simulation. Figure 2 shows the 10 min interval hyetographs of these two storms observed at the Kaohsiung rain-gauging station operated by the Central Weather Administration (Taiwan). In these two rainstorms, the durations of the rainfall events were all longer than 24 h. The 2020-05-22 storm had a lower peak intensity but a higher average rainfall, while the 2021-06-06 event was a concentrated rainstorm with a high rainfall peak.

Figure 2.
Hyetographs of the two severe rainstorms in the Linyuan District: (a) 2020-05-22 rainstorm; (b) 2021-06-06 rainstorm.
Figure 3 shows the rainfall intensities corresponding to different durations for the two rainstorms, in which the intensities were compared with the results of the IDF analysis using the records collected from the Kaohsiung rain-gauging station. As shown in Figure 3a, the 2020-05-22 event’s return period was less than 5 yrs for all durations. The return period was about 2 yr for durations shorter than 6 h, and there was a return period of about 3~4 yrs for durations longer than 6 h. Figure 3b shows how the return period reached 10 yr for durations shorter than 30 min in the 2021-06-06 event. The 3 h rainfall occurred for the 5 yr return period; for durations longer than 3 h, the return period was between 2 and 5 years.
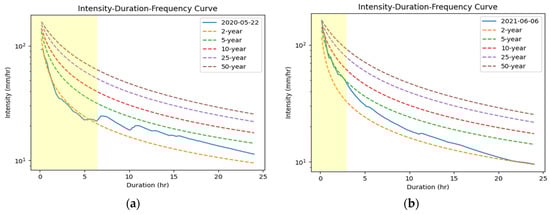
Figure 3.
Intensity–duration–frequency analysis of the two rainstorm events: (a) 2020-05-22 rainstorm; (b) 2021-06-06 rainstorm.
In the Linyuan District, about one-third of the areas have sewer drainage systems. For those areas without underground sewers, roadside ditches were built instead for stormwater drainage. The length of the underground sewer built in the street-sewer model was 8.79 km with 247 sewer nodes, and the total length of the ditch system was 28.12 km with a total of 7411 ditch nodes. To enhance the flooding warning work in Taiwan, the National Land Management Agency has installed sewer-water-level gauging stations in flood-prone areas since 2018. Pressure-type water level loggers were used, and the sampling rate was 10 min. The measurement accuracy was ±0.5 cm, and the resolution was 0.21 cm. Although two water-level gauging stations were set up in the Linyuan District, only one station had completed water level records for the two storms studied.
Figure 4 shows the comparison of the recorded and simulated water levels at sewer node No. 3449-05-N2 using the street-sewer runoff model. In conducting the flow simulations, the corresponding tidal records measured at the Kaohsiung tide station were used as the downstream boundary condition. The Pearson correlation coefficient was 0.92 for the 2020-05-22 rainstorm and 0.90 for the 2021-06-06 rainstorm, respectively. The Nash–Sutcliffe Efficiency was further adopted to validate the simulation results, which were 0.65 for the 2020-05-22 rainstorm and 0.76 for the 2021-06-06 rainstorm. The simulation results support the applicability of the developed street-sewer SWMM for runoff simulations in the Linyuan District.

Figure 4.
Recorded and simulated water levels at the sewer node No. 3449-05-N2 for the two severe rainstorms in the Linyuan District: (a) 2020-05-22 rainstorm; (b) 2021-06-06 rainstorm.
During these two rainstorms, the local Fire Department received calls from residents to report the flooding. All this information was recorded in Taiwan’s Emergency Management Information Cloud (EMIC), which was used to verify the developed stormwater model. Figure 5a shows the residents’ reported flooding locations and the model simulation results for the 2020-05-22 rainstorm. It can be determined that a good model is expected to give inundation predictions for all the resident-reported flooding locations; however, for those places where the model predicted flooding but no resident reported flooding, this does not mean the model’s predictions were incorrect. Instead, it is because most residents do not report flooding to the EMIC, even though inundations occur nearby.
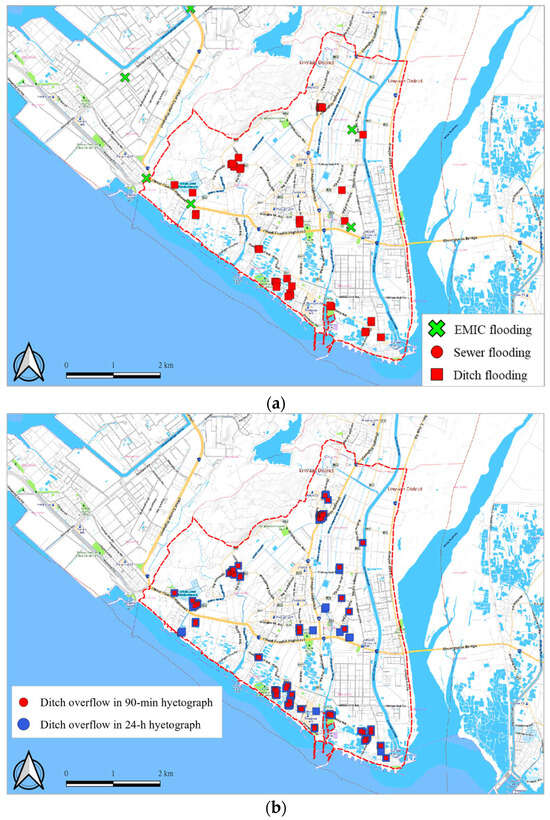
Figure 5.
Residents reported flooding locations and model-simulated flooding points: (a) 2020-05-22 rainstorm; (b) 2021-06-06 rainstorm.
As shown in Figure 5a, the EMIC received four calls for local inundation (the green cross on the map), in which the street-sewer runoff model predicted flooding at three out of the four locations within a distance of 100 m as the buffer zone. Since the frequency of the 2020-05-22 rainstorm was below the 5 yr return period and the design capacity of the sewer was 5 yr, no manhole flooding was found in this district. Nevertheless, the capacity of the roadside ditch was designed according to a 2 yr return period, and the return period was about 3 to 4 years for rainfall duration longer than 6 h in this storm. Hence, the street-sewer runoff model predicted 44 locations with ditch flooding (the red rectangle).
As shown in Figure 5b, the EMIC recorded twelve flooding locations in the 2021-06-06 rainstorm. The street-sewer SWMM correctly predicted ten out of twelve flooding locations in this rainstorm. The rainfall intensity for this event within 3 h was greater than the 5 yr return period (as shown in the yellow portion of Figure 3b), which exceeds the design standard of the rainstorm sewer system in the Linyuan District. Figure 5b shows that overflow occurred at the manholes near the center of the Linyuan area (the red circle), and there were significantly more flooded roadside ditches (total of 185 locations) than those in the 2020-05-22 rainstorm.
4. Inundation Simulation Using Short- and Long-Duration Rainstorms
It is known that the intensity and temporal distribution of rainstorms are the primary factors controlling whether urban flooding occurs. Currently, the design return period of the storm sewer in Taiwan is 2~5 yrs. This rational method is used to determine the sewer size first, and then a 90 min design hyetograph is input into the SWMM for manhole overflow checking. In the Linyuan District, the sewer design was under a 5 yr return period, and the roadside ditch design followed a 2 yr return period. As shown in Figure 3, the rainfall intensities of different durations in the 2020-05-22 rainstorm were all less than the intensity of the 5 yr return period. Hence, if the sewer network was well constructed according to the design criteria and no local clogging occurred in the sewers, there should be no overflow from manholes.
Nevertheless, in the 2021-06-06 rainstorm, the rainfall intensity was higher than the 5 yr design criteria for durations shorter than 3 h; hence, this rainstorm was adequate to be adopted for sewer overflow simulations and to investigate the difference in the simulations for different rainstorm durations. The total duration of the 2021-06-06 rainstorm was 37 h. In the following section, we exclude the early-stage slight rainfall in the event and discuss the inundations resulting from the 24 h main rainstorm series and the 90 min concentrated rainfall extracted from the record. Moreover, we also show the simulations using short- and long-duration design hyetographs to investigate the differences in flooding.
4.1. Flooding Analysis Using Historical Rainstorms
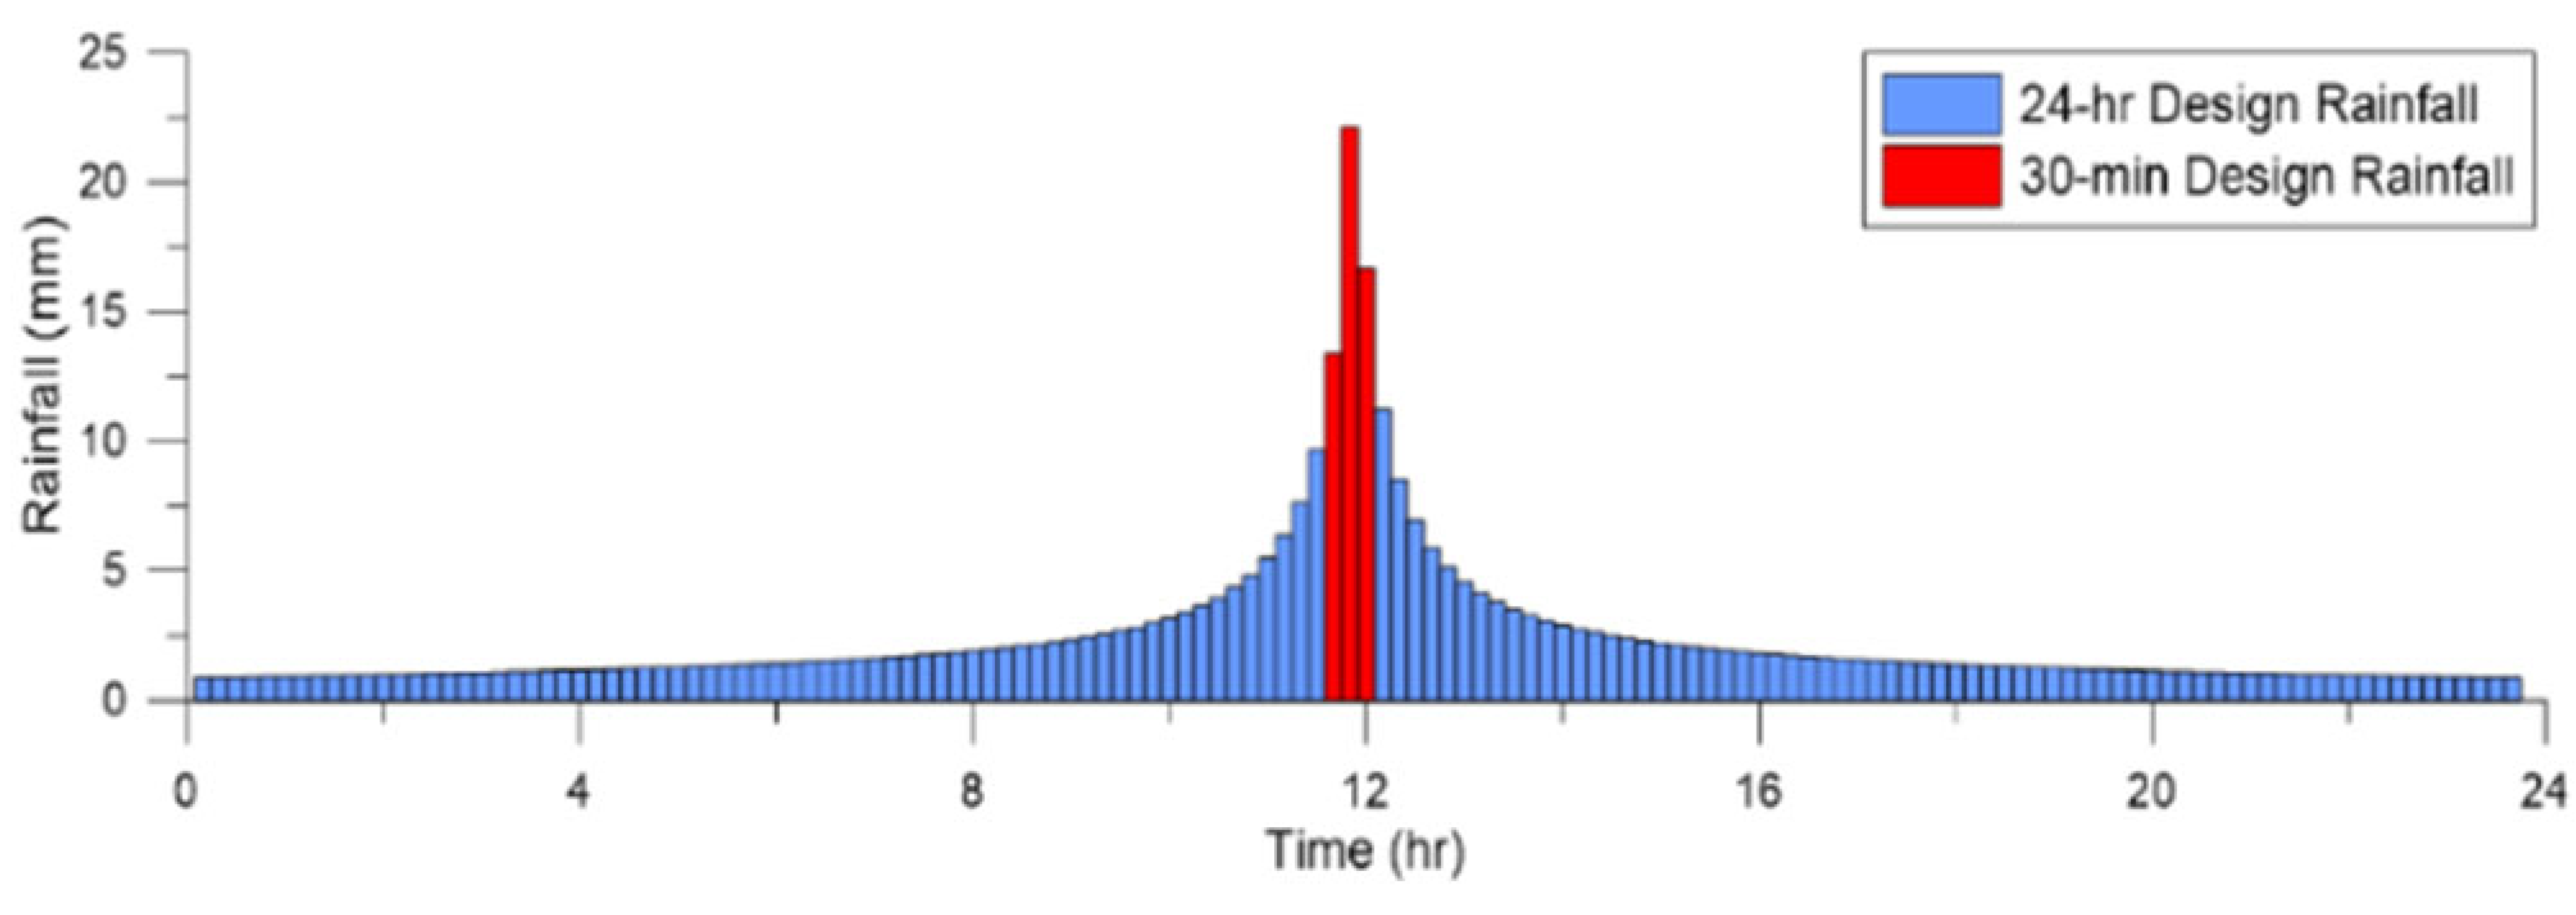
Figure 6 shows the water level simulations using the 90 min concentrated rainfall and 24 h rainstorm series in the 2021-06-06 event. The central red hyetograph indicates the 90 min concentrated rainfall (from 6 June 08:20 to 09:40), and the blue hyetograph (including the 90 min concentrated rainfall) is the rainfall used in the 24 h rainstorm simulation. The middle figure demonstrates the simulated water level at manhole No. 3449-10-D7 using the 90 min red hyetograph as the SWMM’s input, and the bottom figure indicates the simulated water level using the 24 h blue hyetograph as the input. In these figures, horizontal dashed lines represent the ground level. The blue hydrograph shows that the maximum water level is 1.88 m, which exceeds the ground surface (Ele, 1.87 m) and indicates that a manhole overflow occurred. Nevertheless, in the 90 min concentrated rainfall case, the maximum water level of the red hydrograph is 1.84 m, which nearly reaches the ground surface but does not produce flooding.
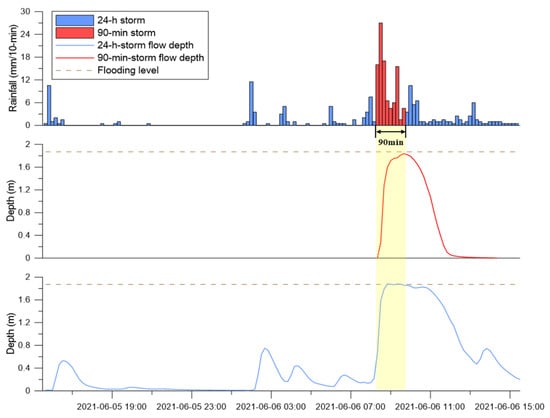
Figure 6.
Water level simulations using 90 min and 24 h hyetographs for the 2021-06-06 rainstorm at manhole No. 3449-10-D7.
The cause of this difference between the red and blue hydrographs is the rainwater retained in the sewer before the concentrated heavy rainfall started at 08:20. At that time, the retained water reached 12% of the overflow depth in the sewer. Hence, the subsequently concentrated rainfall caused the sewer water level to rise rapidly and reach the ground level, resulting in overflow (the blue hydrograph in Figure 6). On the contrary, as shown in the red hydrograph, no water stagnated at the beginning of the 90 min rainstorm, which only generated a lower water level without reaching the ground surface.
In the Linyuan District, 247 sewer nodes and 7411 roadside ditch nodes were built in the street-sewer SWMM. Since the existing sewer design was followed by a 90 min design hyetograph under the 5 yr return period condition, no sewer overflow occurred in the simulation using the 90 min concentrated rainfall condition in the 2021-06-06 rainstorm. Nevertheless, as shown in Figure 7, one sewer node (No. 3449-10-D7) showed overflow in the simulation using the 24 h hyetograph in the same rainstorm.
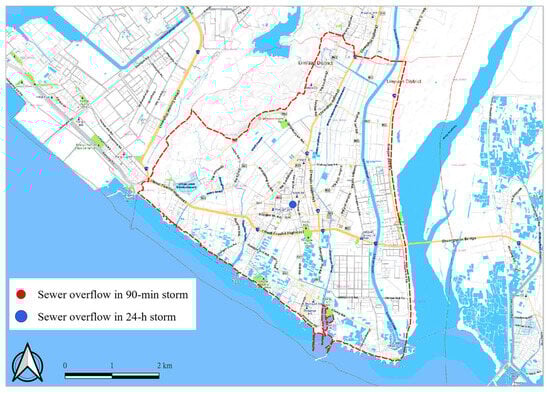
Figure 7.
Sewer overflow investigations using 90 min and 24 h hyetographs for the 2021-06-06 rainstorm.
As mentioned, roadside ditches were built for areas without underground sewer systems, and the design of the roadside ditch was taken as the 2 yr return period. As shown in Figure 8, significant street flooding was found in those areas where roadside ditches were the only available drainage facility. Ninety-nine ditches overflowed in the simulation using the 90 min concentrated rainfall, and 185 ditches flooded in the 24 h rainstorm simulation. Consequently, engineers would underestimate the extent of flooding and disaster severity if a short design hyetograph was used for the flooding analysis.
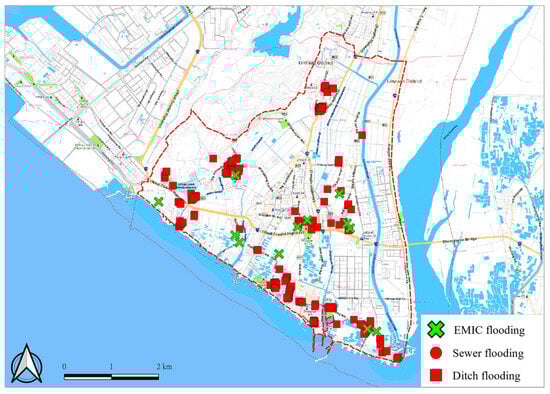
Figure 8.
Roadside-ditch overflow investigations using 90 min and 24 h hyetographs for the 2021-06-06 rainstorm.
4.2. Flooding Analysis Using Design Hyetographs
The 2021-06-06 event analysis indicates that the flooding in the Linyuan area was caused by rainfall that lasted more than 90 min. The long-duration rainfall retained more water in the sewer system, which resulted in the water level rising rapidly during the concentrated rainfall period and causing overflow. Since the current sewer design in Taiwan was based on runoff routing using the design rainstorm, this section analyzes the difference in sewer water depths and flooding extents using the 90 min and 24 h centralized design hyetograph [5] under the 5-year return period condition.
As shown in Figure 9, in the 5 yr 90 min design rainstorm (the red hyetograph), rainfall did not cause overflow at the sewer node No. 3449-10-D7, although the water depth (the red hydrograph) reached near the ground surface (the horizontal dashed line). Nevertheless, the 5 yr 24 h design rainstorm (the blue hyetograph) caused overflow at 12:00 (the blue hydrograph). In performing the flow simulations, the downstream boundary condition was set as the average high tide level from July to October measured at the Kaohsiung tide station. The main reason for flooding using the 24 h hyetograph was that the water depth reached about 70% of the overflow depth at 11:00, so the water level rose rapidly and overflowed the ground.
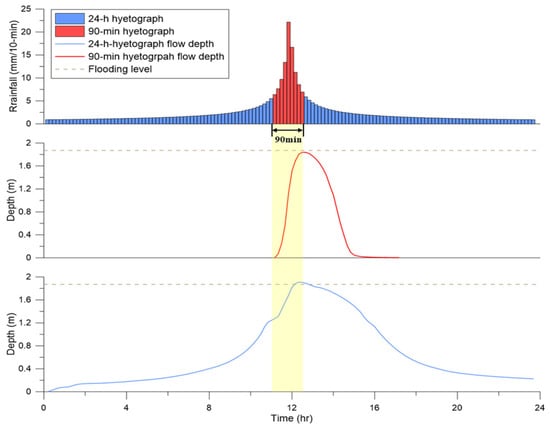
Figure 9.
Water depth simulations at manhole No. 3449-10-D7 using 90 min and 24 h design hyetographs under the 5 yr return period condition.
Figure 10 shows flooding occurring near the center of the Linyuan District at sewer node No. 3449-10-D7 in the 24 h design hyetograph simulation; nevertheless, no sewer flooding occurred in the simulation of the 90 min design rainstorm. On the other hand, as shown in Figure 11, massive flooding occurred in the 90 min and 24 h design rainstorm simulations for the areas without underground sewer systems. The number of flooded street nodes in the 90 min design storm simulation was 78, while it increased to 108 for the 24 h design rainstorm case. The results show that the design rainfall duration is the main factor that causes the change in flooding extent.

Figure 10.
Sewer overflow investigations using 90 min and 24 h design hyetographs under the 5-yr return period condition.
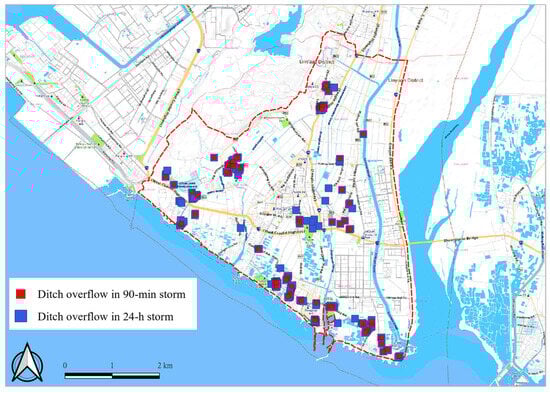
Figure 11.
Roadside ditch overflow investigations using 90 min and 24 h design hyetographs under the 5 yr return period condition.
5. Discussion of Sewer Design Discharge Determination
Since flow records are usually unavailable in urban areas, sewer design usually applies design hyetograph routings through runoff models to obtain the design hydrograph. The main factors influencing the design hyetograph’s shape are the rainfall peak and duration. Although Marsalek and Watt [7] suggested that the duration should be appropriate to the catchment time constant (or nearly equal to the time of concentration), this inference needs to be further investigated in Taiwan. Tests of the hyetograph duration were further conducted in 16 urban drainage partitions to confirm the reliability of the results obtained in the Linyuan District. The test sites were selected from northern, central, and southern Taiwan, with sizes ranging from 2.3 to 193.5 ha. As shown in Table 1, IDF regression equations were collected corresponding to the location of the urban areas.

Table 1.
The intensity–duration–frequency regression equations used to derive design hyetographs in the 16 drainage partitions.
Following the concept shown in Figure 9, 5 yr design hyetographs were produced corresponding to different durations, from 30 min to 1800 min. Table 2 illustrates the dimensionless peak discharges generated by the street-sewer SWMM using the design hyetographs with different durations, in which Qp is the peak discharge using the td-duration hyetograph as the input of the SWMM, and Qmax is the maximum discharge using different duration hyetographs in the specified partition. Taking the DB Partition in Keelung as an example (the first row in Table 2), the results indicate that the outflow peak discharge reaches 3.81 m3/s while the hyetograph duration is longer than 1080 min. Hence, the expected maximum discharge (Qmax) in the DB Partition under a 5 yr return rainfall period is set as 3.81 m3/s. The corresponding outflow peak for a 30 min design hyetograph is 3.47 m3/s, which indicates to be equal to 0.91. So, the design hyetograph duration should be longer than 1080 min to preserve a low-risk design in the DB Partition of Keelung. It is known that the maximum discharge in a drainage partition depends on the rainfall, ground slope, sewer network, street network, land cover condition, and the size of the drainage area. Hence, the relationship between the hyetograph duration and the maximum discharge is complicated and not straightforward. As shown in Table 2, the yellow-marked portion designated the minimum hyetograph duration to generate the maximum discharge (i.e.,) in the corresponding partition. In summary, the design hyetograph duration should be longer than 1440 min to ensure a conservative sewer design in the 16 test partitions.
Table 2.
Peak discharges generated by the street-sewer SWMM using different designyetographs as model inputs.
In conventional hydrology, the design of urban drainage systems using the rational method requires estimating the time of concentration to determine the critical rainfall intensity. The flow travel time includes the time in the overland flow portion and the pipe/channel system. A rainfall intensity, such as the 2 yr, 2 h rainfall intensity, is often used as the input to estimate the surface-flow velocity [23], and a full-flowing or 90%-full pipe is used for the estimation of pipe-flow travel time. Therefore, it usually results in a comparatively short estimation of flow travel time in urban watersheds.
At present, most urban sewer designs apply the SWMM. Temporal-varying design hyetographs according to different protection levels are used as the model input to determine the design discharge. As shown in Figure 9, lower rainfall intensity at both ends of the design hyetograph would produce shallow flow depths on overland areas and pipes/channels, creating a low flow velocity and delaying maximum discharge. Hence, a longer time to reach the maximum discharge shown in Table 2 contradicts our previous understandings. Nevertheless, as shown in the gray-marked portion of Table 2, if a 90% maximum discharge is selected as a criterion, the characteristic time in most partitions is around 90~120 min. This seems to align with the perception held in the conventional design work.
More recently, authorities in Taiwan have proposed comprehensive flood mitigation measures to reduce flood risk and improve flood resilience on a basin scale. The drainage design should consider the upstream inflows (from farm fields and surrounding hillslopes into the urban districts) and the downstream outflows (from urban drainage partitions to local drainage canals or nearby streams). Therefore, a 24 h or even longer duration of design hyetograph is suggested in accordance with runoff designs from upstream to downstream areas.
6. Conclusions
The rational method is usually used in conventional hydrology for peak flow estimation in small urban and rural watersheds. The controversy surrounding this method pertains to how to estimate the watershed time of concentration and the constant rainfall intensity obtained from the IDF curve to calculate the peak discharge. Although time-varying design hyetographs have been adopted as the input of the SWMM to account for the unsteadiness of the rainfall, engineers still follow early practice to choose the hyetograph duration equal to the time of concentration. Since the rainfall intensities at both ends of the designed hyetograph are relatively small, they generate slow flow in the sewer. Hence, the occurrence of maximum discharge is lagged and does not correspond to the time of concentration of the sewer system.
This study developed a street-sewer runoff model based on SWMM in the Linyuan District. Sewer water-level data and inundation records were used to validate the model’s applicability. Tests of different rainfall durations using two severe rainstorm events showed that the inundation condition cannot be obtained using 90 min concentrated rainfall data; nevertheless, the 24 h rainstorm simulation adequately reflected the flooding condition in this district. The same situation was also revealed when applying short- and long-duration design hyetographs to this district. Moreover, a series of numerical tests, using the duration from 30 min to 1800 min, were applied to another 16 drainage partitions. The simulation results indicated that a hyetograph duration longer than 1440 min will provide a conservative design for urban drainage systems.
Author Contributions
Conceptualization, K.T.L. and T.-C.C.; methodology, K.T.L.; software, N.-K.C.; validation, W.-S.Y., P.-C.H., and Y.-T.L.; formal analysis, Y.-H.H., H.-Y.C., C.-W.H., J.Z.Y., C.-R.L. and C.-M.Y.; investigation, Y.-H.L.; resources, W.-S.Y.; data curation, N.-K.C.; writing—original draft preparation, P.-C.H.; writing—review and editing, K.T.L.; visualization, T.-C.C.; supervision, K.T.L.; project administration, K.T.L.; funding acquisition, W.-S.Y. All authors have read and agreed to the published version of the manuscript.
Funding
This research was funded by the National Land Management Agency, Ministry of the Interior, Taiwan (Grant number: 111H50213).
Institutional Review Board Statement
Not applicable.
Informed Consent Statement
Not applicable.
Data Availability Statement
The authors do not have permission to share data.
Acknowledgments
Financial support provided by the National Land Management Agency, Ministry of the Interior, Taiwan (Grant number: 111H50213), is sincerely acknowledged.
Conflicts of Interest
The authors declare no conflict of interest.
References
- Huff, F.A. Time distribution of rainfall in heavy storms. Water Resour. Res. 1967, 3, 1007–1019. [Google Scholar] [CrossRef]
- Pilgrim, D.H.; Cordery, I. Rainfall temporal patterns for design floods. J. Hydraul. Div. 1975, 101, 81–95. [Google Scholar] [CrossRef]
- Yen, B.C.; Chow, V.T. Design hyetographs for small drainage structures. J. Hydraul. Div. 1980, 106, 1055–1076. [Google Scholar] [CrossRef]
- Keifer, C.J.; Chu, H.H. Synthetic storm pattern for drainage design. J. Hydraul. Div. 1957, 83, 1332-1–1332-25. [Google Scholar] [CrossRef]
- Chow, V.T.; Maidment, D.R.; Mays, L.W. Applied Hydrology; McGraw-Hill: New York, NY, USA, 1988. [Google Scholar]
- Lee, K.T.; Ho, J.-Y. Design hyetograph for typhoon rainstorms. J. Hydrol. Eng. 2008, 13, 643–651. [Google Scholar] [CrossRef]
- Marsalek, J.; Watt, W.E. Design storms for urban drainage design. Can. J. Civil. Eng. 1984, 11, 574–584. [Google Scholar] [CrossRef]
- Wenzel, H.G., Jr.; Voorhees, M.L. Evaluation of the Urban Design Storm Concept; University of Illinois at Urbana-Champaign: Champaign, IL, USA, 1981. [Google Scholar]
- Levy, B.; McCuen, R.H. Assessment of storm duration for hydrologic design. J. Hydrol. Eng. 1999, 4, 209–213. [Google Scholar] [CrossRef]
- Alfieri, L.; Laio, F.; Claps, P.A. Simulation experiment for optimal design hyetograph selection. Hydrol. Process. 2008, 22, 813–820. [Google Scholar] [CrossRef]
- Kimoto, A.; Canfield, H.E.; Stewart, D. Comparison of synthetic design storms with observed storms in southern Arizona. J. Hydrol. Eng. 2011, 16, 935–941. [Google Scholar] [CrossRef]
- Na, W.; Yoo, C. Evaluation of rainfall temporal distribution models with annual maximum rainfall events in Seoul, Korea. Water 2018, 10, 1468. [Google Scholar] [CrossRef]
- Krvavica, N.; Rubinic, J. Evaluation of design storms and critical rainfall durations for flood prediction in partially urbanized catchments. Water 2020, 12, 21–44. [Google Scholar] [CrossRef]
- Sharma, I.; Mishra, S.K.; Pandey, A. A simple procedure for design flood estimation incorporating duration and return period of design rainfall. Arab. J. Geosci. 2021, 14, 1286. [Google Scholar] [CrossRef]
- Szeląg, B.; Kiczko, A.; Łagód, G.; De Paola, F. Relationship between rainfall duration and sewer system performance measures within the context of uncertainty. Water Resour. Manag. 2021, 35, 5073–5087. [Google Scholar] [CrossRef]
- Jidai, J.; Yu, H.; Zhang, L.; Liu, Y.; Han, J. The Global Importance of Increasing Design Rainstorms under Specific Return Periods in China. Water 2023, 15, 2049. [Google Scholar] [CrossRef]
- Shen, C.; Xia, H.; Fu, X.; Wang, X.; Wang, W. Identifying risk components using a sewer-road integrated urban stormwater model. Water Resour. Manag. 2024, 38, 3049–3070. [Google Scholar] [CrossRef]
- Bogdanowicz, E.; Stachy, J. Maximum Rainfall in Poland. Design Characteristics, 1st ed.; The Publishing House of the Institute of Meteorology and Water Management: Warsaw, Poland, 1998; p. 83. [Google Scholar]
- Meynink, W.J.; Cordery, I. Critical duration of rainfall for flood estimation. Water Resour. Res. 1976, 12, 1209–1214. [Google Scholar] [CrossRef]
- Schmid, B.H. Critical rainfall duration for overland flow from an infiltrating plane surface. J. Hydrol. 1997, 193, 45–60. [Google Scholar] [CrossRef]
- Kotowski, A.; Kaźmierczak, B.; Nowakowska, M. Analysis of rainwater sewerage systems overloads on Rakowiec estate in Wroclaw caused by climate changes. Rocz. Ochr. Srodowiska 2014, 16, 608–626. [Google Scholar]
- Niazi, M.; Nietch, C.; Maghrebi, M.; Jackson, N.; Bennett, B.R.; Tryby, M.; Massoudieh, A. Storm water management model: Performance review and gap analysis. J. Sustain. Water Built Environ. 2017, 3, 04017002. [Google Scholar] [CrossRef] [PubMed]
- McCuen, R.H.; Wong, S.L.; Rawls, W.J. Estimating Urban Time of Concentration. J. Hydraul. Eng. 1984, 110, 887–904. [Google Scholar] [CrossRef]
Disclaimer/Publisher’s Note: The statements, opinions and data contained in all publications are solely those of the individual author(s) and contributor(s) and not of MDPI and/or the editor(s). MDPI and/or the editor(s) disclaim responsibility for any injury to people or property resulting from any ideas, methods, instructions or products referred to in the content. |
© 2025 by the authors. Licensee MDPI, Basel, Switzerland. This article is an open access article distributed under the terms and conditions of the Creative Commons Attribution (CC BY) license (https://creativecommons.org/licenses/by/4.0/).