Article

Allometric Models to Estimate the Merchantable Wood Volume and Biomass of the Most Abundant Miombo Species in the Miombo Woodlands in Mozambique

1
Department of Forest Resources Assessment and Management, College of Forestry, Wildlife and Tourism, Sokoine University of Agriculture, Morogoro P.O. Box 3013, Tanzania
2
Department of Forestry Engineering, University of Eduardo Mondlane (UEM), Maputo 257, Mozambique
3
Department of Forest Ecology and Management, Swedish University of Agricultural Sciences (SLU), SE-901 83 Umeå, Sweden
*
Author to whom correspondence should be addressed.
Earth 2025, 6(2), 52; https://doi.org/10.3390/earth6020052
Submission received: 29 January 2025 / Revised: 31 March 2025 / Accepted: 8 April 2025 / Published: 5 June 2025

Abstract

:
The Miombo woodlands are declining in both area and value, primarily due to over-harvesting of commonly preferred species. These forests, however, still contain several other species that are potentially of commercial importance. This study aimed to address the need for improved volume and biomass estimates for the sustainable management and utilization of two of the most abundant timber species in Mozambique’s Miombo woodlands: Brachystegia spiciformis (common name: Messassa) and Julbernardia globiflora (common name: red Messassa). Non-linear models were developed to estimate the merchantable wood volume under bark, heartwood volume, and biomass. The volume and biomass models for wood and heartwood volume, which included both diameter at breast height (DBH) and tree height as predictor variables, outperformed single-predictor models. However, the performance of some ratio models using DBH as the only predictor variable surpassed that of models using two predictor variables. The developed models are recommended for adoption by forest companies to increase economic and environmental benefits as they can refine harvest planning by improving the selection of trees for harvesting. Proper tree selection enhances the rate of recovery of high-quality timber from heartwood while observing sustainable forest management practices in Miombo and increasing the proportion of carbon removed from forests, which is subsequently stored in wood products outside the forest.

1. Introduction

The Miombo woodlands are the largest tropical seasonal woodland and dry forest found in Africa [1], covering an area of 1.9 million km2 [2]. The Miombo woodlands play a crucial role in climate regulation and the socio-economic development of many sub-Saharan countries by sequestering carbon and helping households absorb, withstand, and recover from climatic or economic shocks [3,4].
In Mozambique, Miombo woodland is the most important forest type, since it covers three-thirds of the total forest area of the country, which is estimated to be 34 million hectares [5,6]. These forests support the livelihood of over 70% of Mozambique’s population, contributing approximately 20% to household cash income, 40% to household subsistence (non-monetary), and 80% to the country’s total energy consumption [6,7]. Additionally, the Miombo woodlands contribute significantly to the country’s economy, accounting for about 13.7% of the Gross Domestic Product (GDP) in 2016, generating up to 214,000 jobs, and storing approximately 5.2 trillion tCO2eq [6,7]. Therefore, it is necessary to responsibly manage this forest formation.
In Mozambique, Brachystegia spiciformis (common name: Messassa) and Julbernardia globiflora (common name: Red Messassa) are among the most abundant species, yet they are less known [5,8,9]. Notably, the national annual allowable cut (AAC) for these two species (599,296 m3/year) accounts for 31% of the country’s total AAC, whereas the AAC for the three most harvested species—Pterocarpus angolensis, Combretum imberbe, and Afzelia quanzensis—is only 96,713 m3/year, representing just 5% of the total AAC [10]. Additionally, Brachystegia spiciformis and Julbernardia globiflora are among the few timber species with commercially viable populations [8]. Furthermore, some researchers argue that the commercial value of these two species should be increased, as their physical and chemical properties, along with their workability, are comparable to those of high-value species [8,9,11]. Therefore, promoting their use could play a crucial role in enhancing the sustainable management of Miombo forests by alleviating pressure on the most valuable and consequently most exploited timber species [8,9]. However, to achieve this, in addition to conducting studies aimed at understanding their properties and identifying suitable uses, it is essential to develop mechanisms that enable the accurate, rapid, and cost-effective estimation of different volume categories, their ratios, and biomass at the individual tree level for these species at a local scale.
Among the measurable categories of volume and biomass, the merchantable volumes of the stem, branches, and heartwood are particularly significant [12,13,14]. These metrics provide essential insights into the actual wood volume available for industrial applications, enhance qualitative assessments of harvested timber, inform the selection process for trees designated for harvesting, and facilitate accurate evaluations of logging impacts on carbon emissions, as well as the potential for carbon sequestration in wood products with varying lifespans [12,13,14]. Their measurement at different time points also offers valuable data for growth and yield studies related to these various merchantable components [15]. Additionally, predicting the ratios of component volumes to stem or total merchantable volume can improve the tree selection process for felling, increase the recovery rate and the proportion of harvested wood that will be incorporated into wood products, reduce operational costs, and improve the quality of the harvested timber, factors that optimize the profitability of logging activities and reduce the impact of logging on carbon emissions [16,17].
To assess the impact of logging on forest carbon stocks, it is essential to obtain accurate estimates of the biomass removed from forests and incorporated into wood products [14,18,19]. Utilizing allometric equations to estimate the merchantable volume of harvested trees enhances the precision of these estimates, enabling a more accurate evaluation of how much of the carbon previously stored in the forest will potentially be converted into carbon stocks in wood products outside the forest [14,20,21]. This enhances the identification of viable business models that encompass timber products, co-products, and carbon credits [18,22]. This step is essential for optimizing wood utilization by considering conversion rates and increasing wood valuation, as well as for evaluating the climatic impact of using wood relative to other materials in goods production and infrastructure development [23,24].
Allometric equations have been developed for estimating the total tree wood volume and biomass for mixed Miombo species by [25,26] and for the most valuable Miombo species by [27], as well as for the determination of tree components’ wood volume, such as merchantable branches and stems, by [13,28]. However, species-specific equations for lesser-known species are scarce. The main objective of this study is to develop species-specific allometric equations for estimating the total merchantable wood volume, the volumes of tree components and their ratios, and biomass for B. spiciformis and J. globiflora from the Miombo woodlands in Mozambique.

2. Materials and Methods
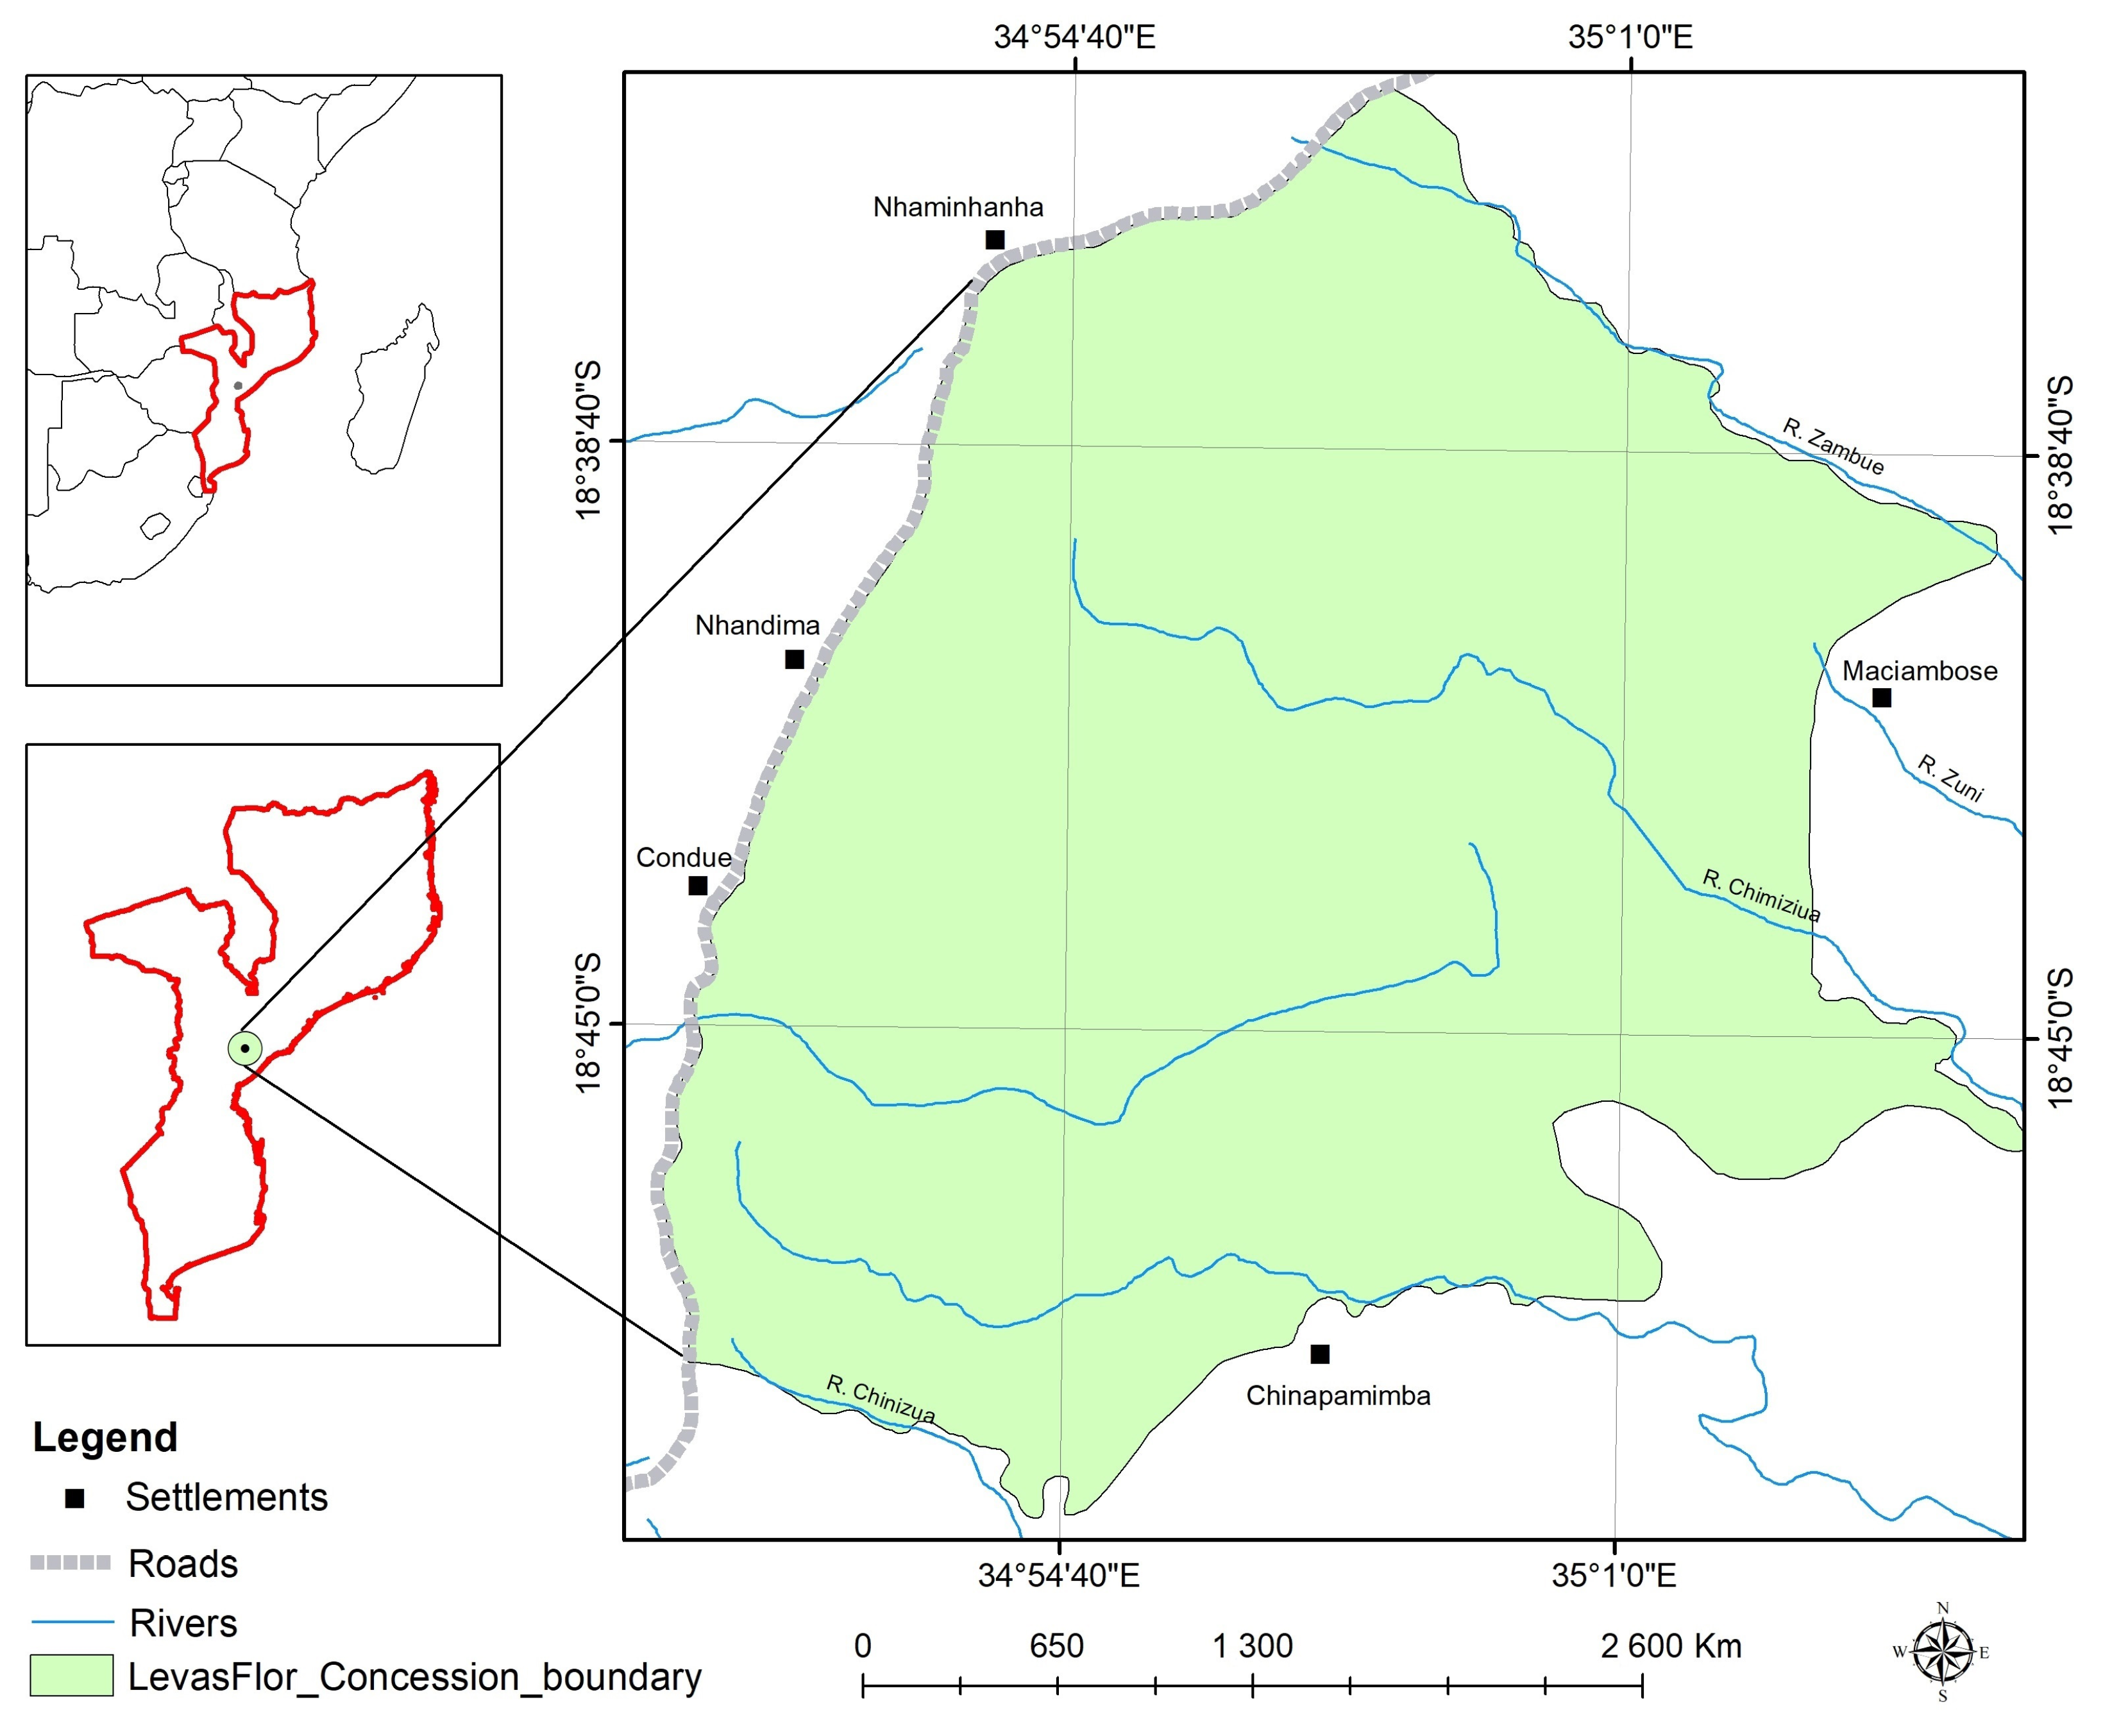
2.1. Study Area

Data for this study were collected from Levasflor Company forests located in Cheringoma district, Sofala province, central Mozambique (Figure 1). The area is characterized as a rainy tropical savanna on a flat slope with a low altitude (30–200 m.a.s.l.) [29]. The average annual rainfall exceeds 1000–1200 mm, primarily during the rainy season (November–April), and the average annual temperature is 23 °C [29]. The soil is sandy, extremely well drained, and has a low nutrient and water retention capacity [30].

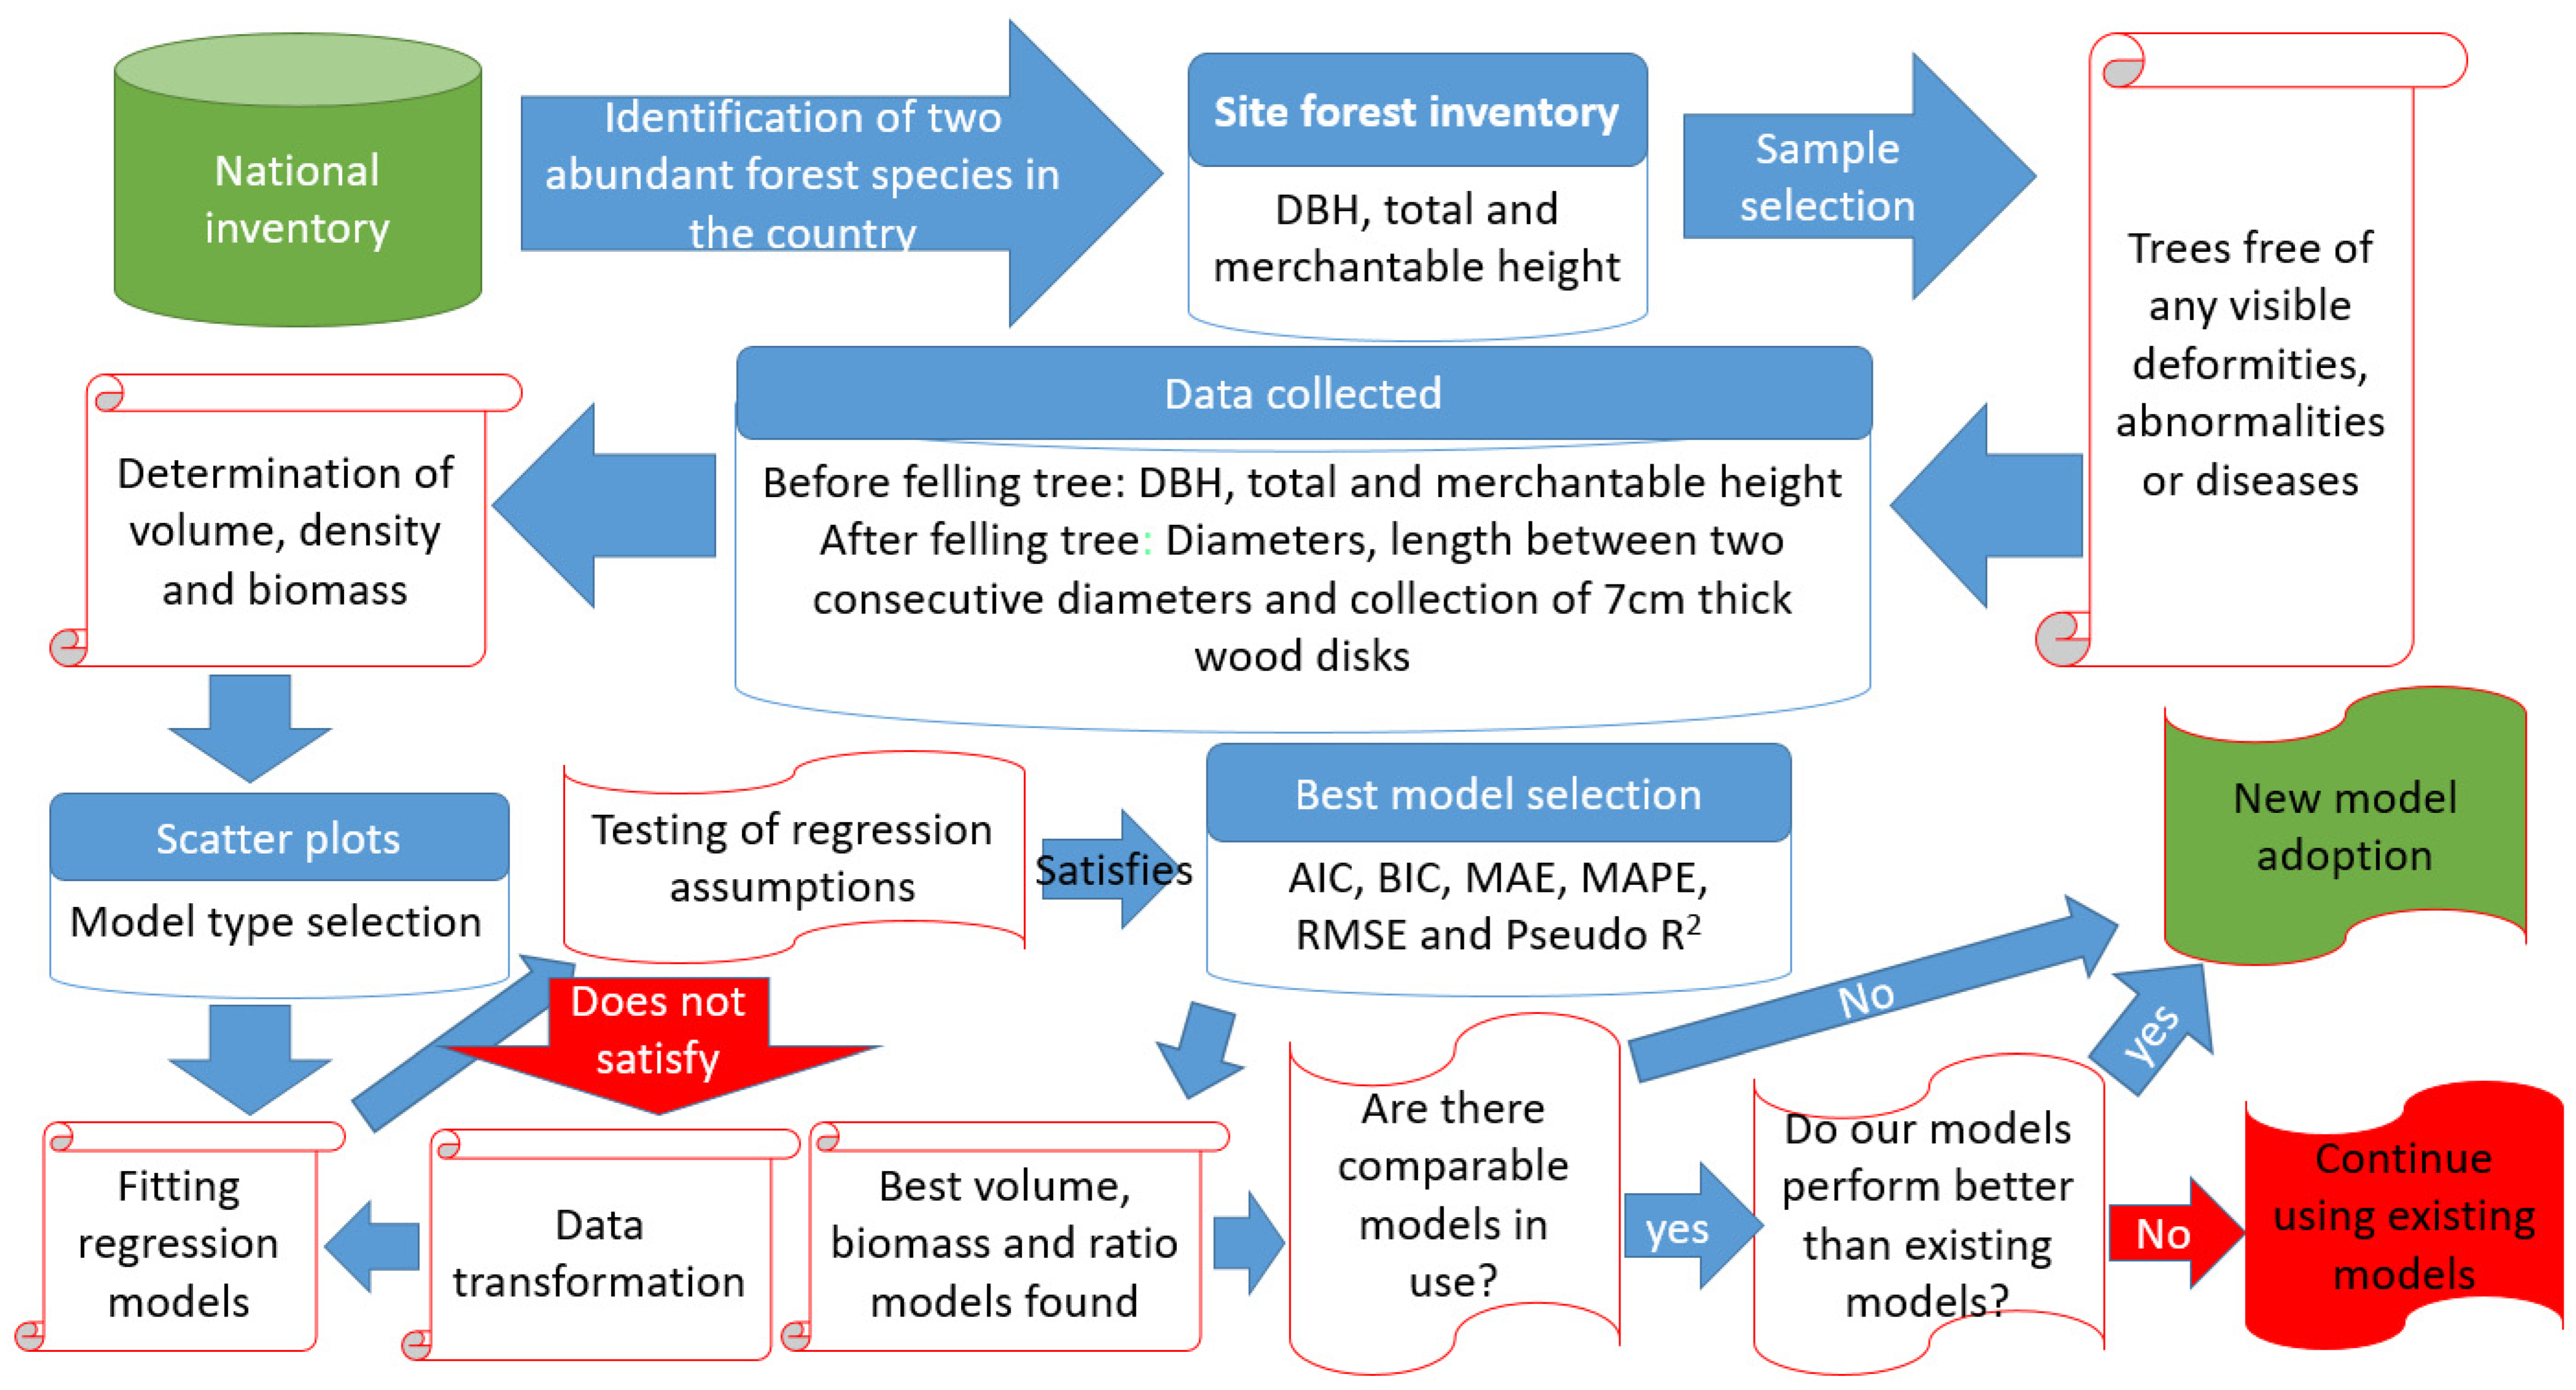
2.2. Data Collection

A total of 37 B. spiciformis trees (DBH ranging from 17 to 81cm and height ranging from 12 to 26 m) and 23 J. globiflora trees (DBH ranging from 14 to 62 cm and height ranging from 12 to 23 m) were sampled. The selected trees were evenly distributed across the available DBH classes. The trees were chosen based on the absence of visible deformities, abnormalities, or diseases that might interfere with their industrial processing, following standard practices employed by forest companies in Mozambique. This approach is commonly applied in selecting sample trees for volume and biomass studies as it helps minimize errors, particularly when the measurements target specific volume/biomass categories rather than the total stand volume/biomass, as demonstrated by [31,32,33].
Once selected, the tree’s DBH, total height, and merchantable height were measured prior to felling. A statistical summary of these variables is provided in Table 1. In addition, after felling, each tree was cross-cut, and its diameter under and over bark and the diameter of the heartwood stem were measured at lengths of 0.3 m, 0.8 m, 1.5 m, and 2.3 m and then in sections every 3 m up to a top diameter over bark of 10 cm. The branches were trimmed and cross-cut into 1 m sections from the bottom up to a top diameter over bark of 10 cm, and the diameter over bark and under bark and the diameter of heartwood were measured at the ends of each section. Only large branches (top diameter ≥ 10 cm) were measured, and, to comply with the typical practices of forest companies in Mozambique, only branches with at least a length of 1.5 m were selected for developing the models. The flowchart in Figure 2 shows the data collection, processing, and analysis.

2.3. Determination of Volumes, Ratios, and Biomass

The volume of each section of the felled trees was computed using the Smalian formula (Equation (1)).
V m = L × ( A b + A u ) 2
where
  • Vm = total volume of the section (under bark and heartwood) (m3);
  • Ab = cross-sectional area at the bottom of the section (m2);
  • Au = cross-sectional area at the top of the section (m2);
  • L = length of the section (m).
The total merchantable volume and the volume of the components were computed by summing the volumes of the corresponding sections. Table 2 presents the categories of merchantable volumes and biomass computed in this study.
Two types of ratios were determined: the ratio of the merchantable volume of the stem in relation to the total merchantable volume of the tree under bark (branches from 15 cm diameter over bark), and the ratio of the volume of the heartwood of each component in relation to the volume of the wood (heartwood and sapwood) of the component to which the heartwood belongs.
In the model fitting process for the total and component volumes, identical models were applied to ensure the additivity of the component volumes, as proposed by [34]. This approach ensures that the sum of the component estimates equals the total volume obtained from the total equation [34,35].
The basic wood density of each component (the stem, primary branches, secondary branches, and tertiary branches) was used to compute the merchantable biomass, as in [36]. To determine the basic wood density, seven B. spiciformis trees and six J. globiflora trees, one for each diametric class, were selected. Four 7 cm thick discs were obtained from each tree: one at the DBH position and the others from the first, second, and third branches. Each disc was converted into four wedges; two opposite wedges were selected, and the basic wood density was determined following the [37]. The fresh volume of the wedges was determined via hydrostatic weighing, and the dry weight was recorded after the wedges were dried to a constant mass at 103 ± 2 °C. The basic wood density of each disc was calculated as dry mass/fresh volume.

2.4. Selection of Candidate Models

An exploratory data analysis was carried out through scatter plots to observe patterns in the relationships between DBH and selected dependent variables (the total merchantable volume, total merchantable biomass, and the volume of merchantable components, namely, the branches, stem, and heartwood). Based on the scatter plot patterns, the candidate models shown in Table 3 were selected.
As the homogeneity of variance of residuals is an assumption often violated in biological studies that model size [26,38], several procedures have been developed to overcome heterogeneity [35,39]. In the current study, to compensate for the unequal variance of the residual error when fitting non-linear models relating to volume and biomass, the variance was weighted as in [26]. This procedure was used due to its flexibility and its recognized robustness over non-linear models with additive error and log-transformed models [35,40].
For each model (power and ratio), residuals were analyzed using distribution patterns [41] and the Breusch–Pagan test [42,43]. This combination evaluates homoscedasticity by visually identifying trends in residuals and statistically confirming variance consistency, ensuring robust model performance assessment [41,42].

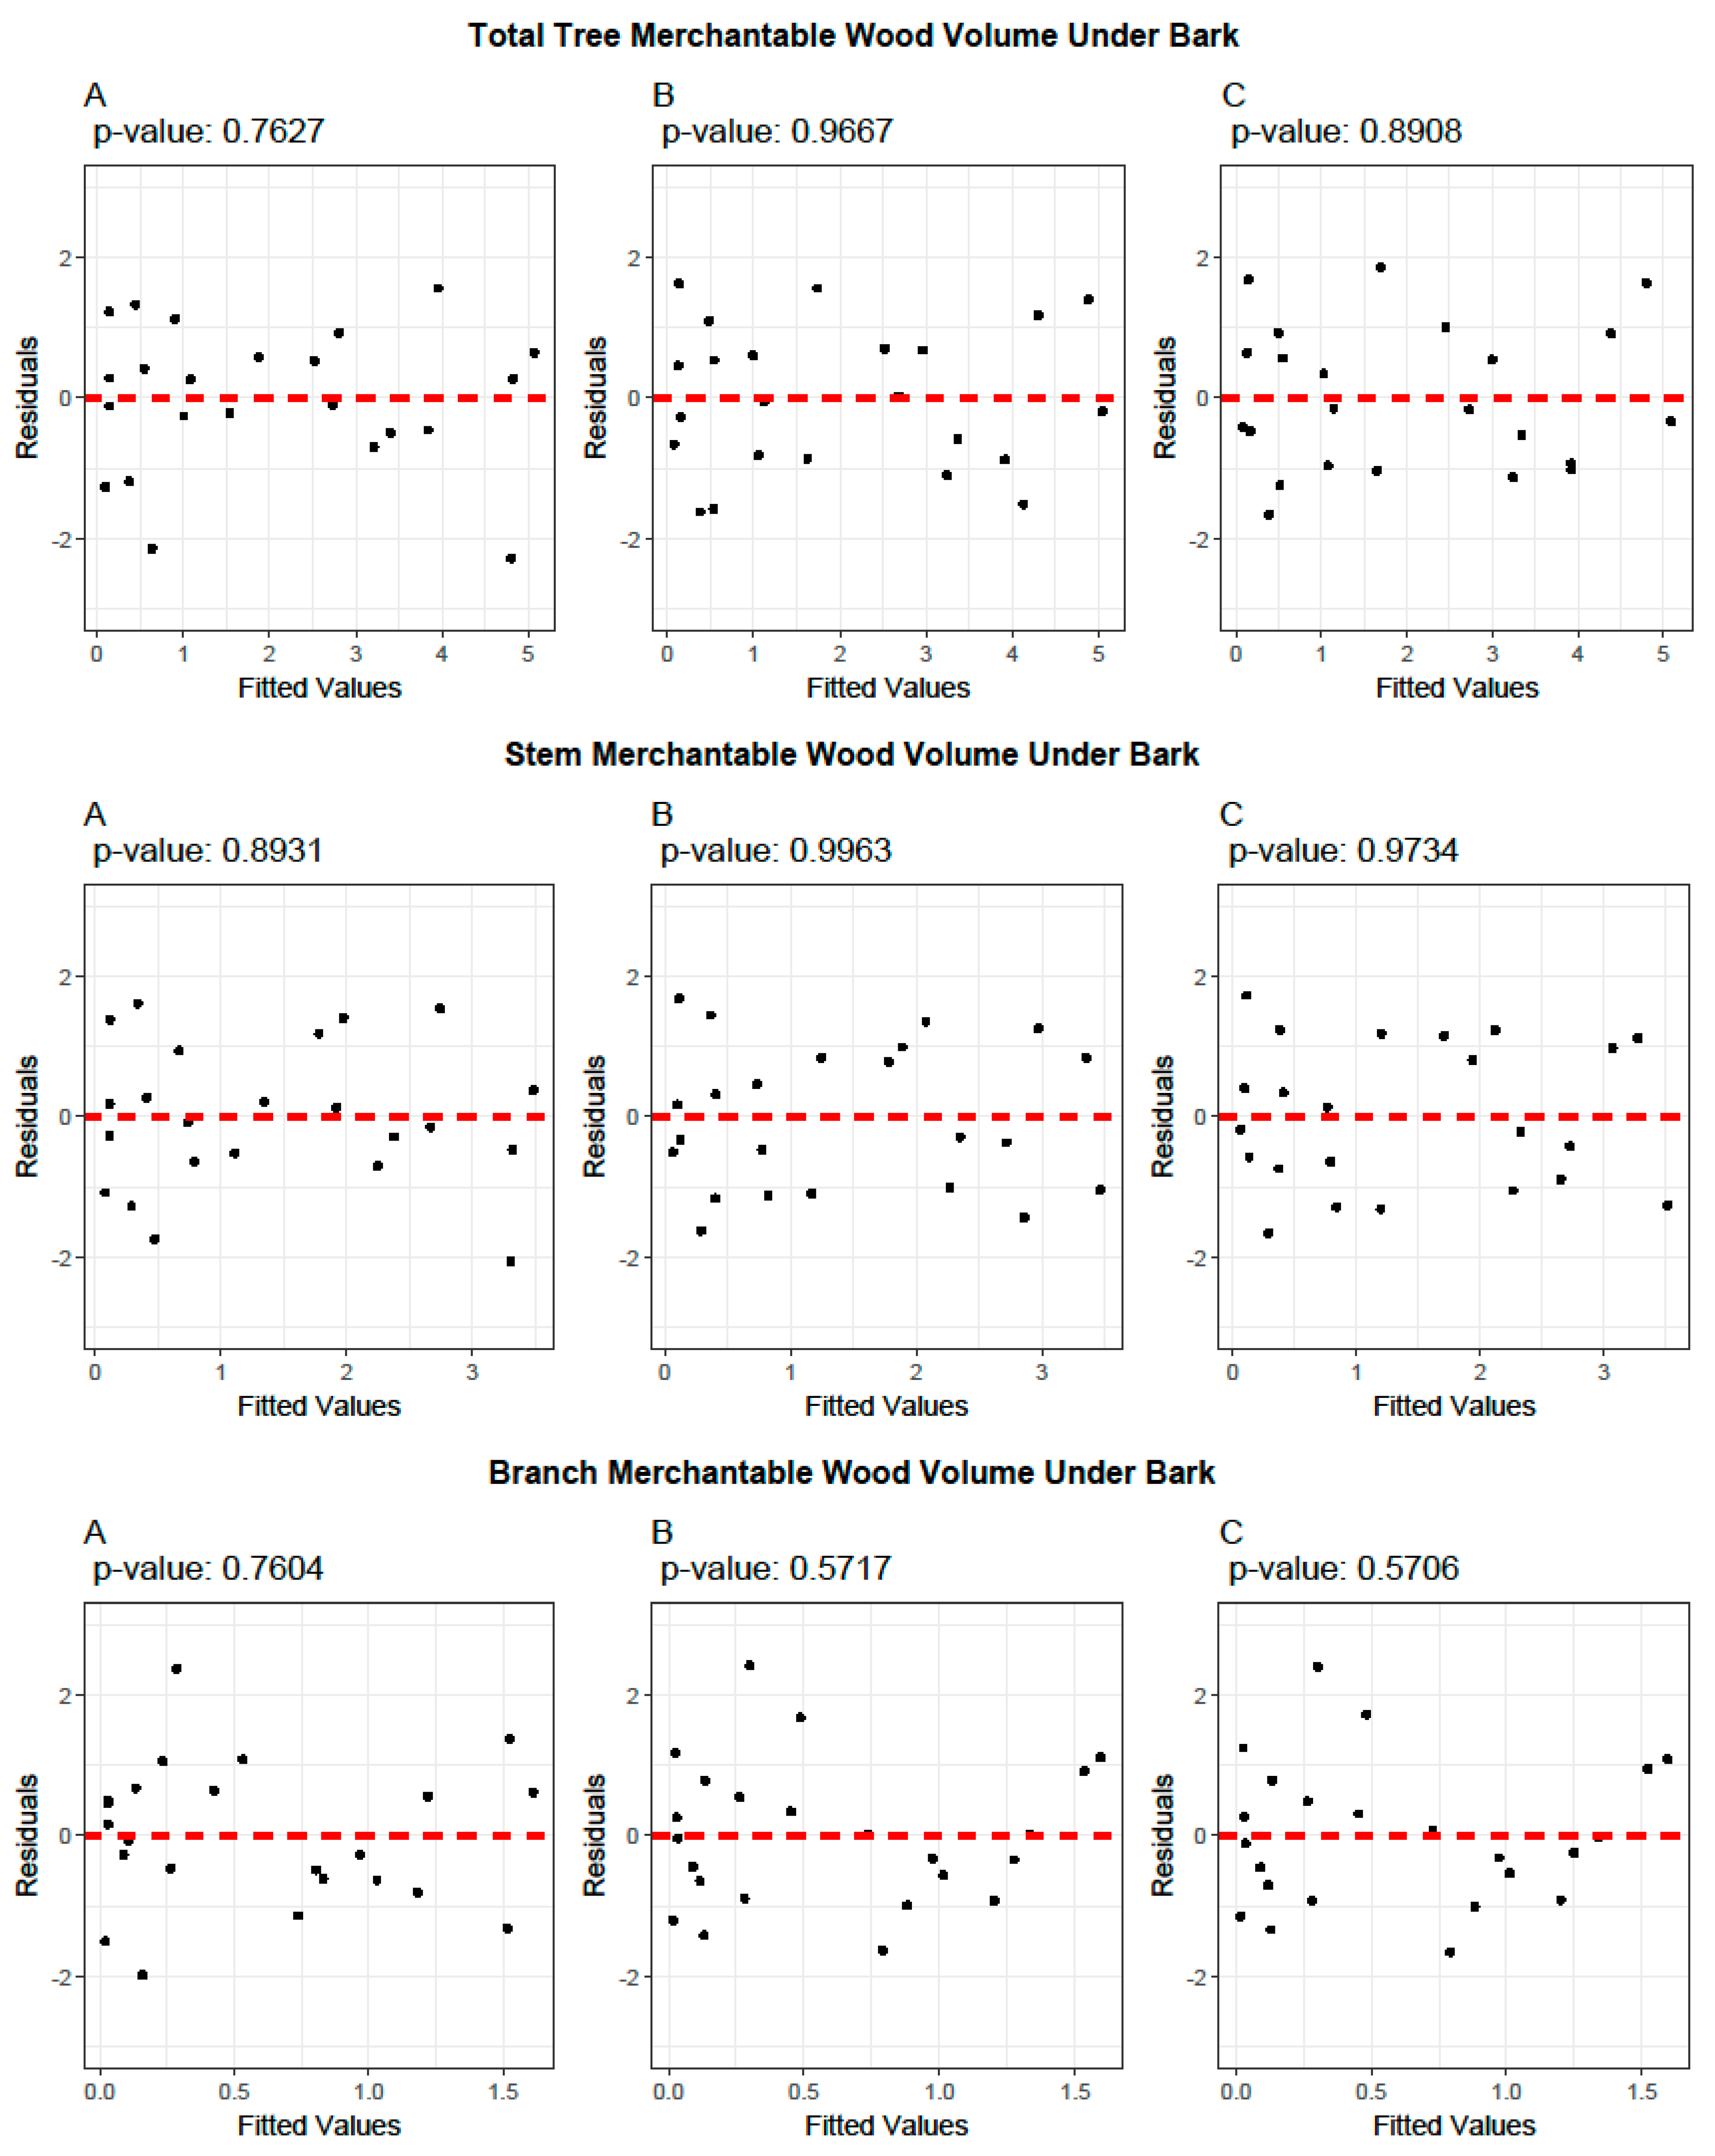
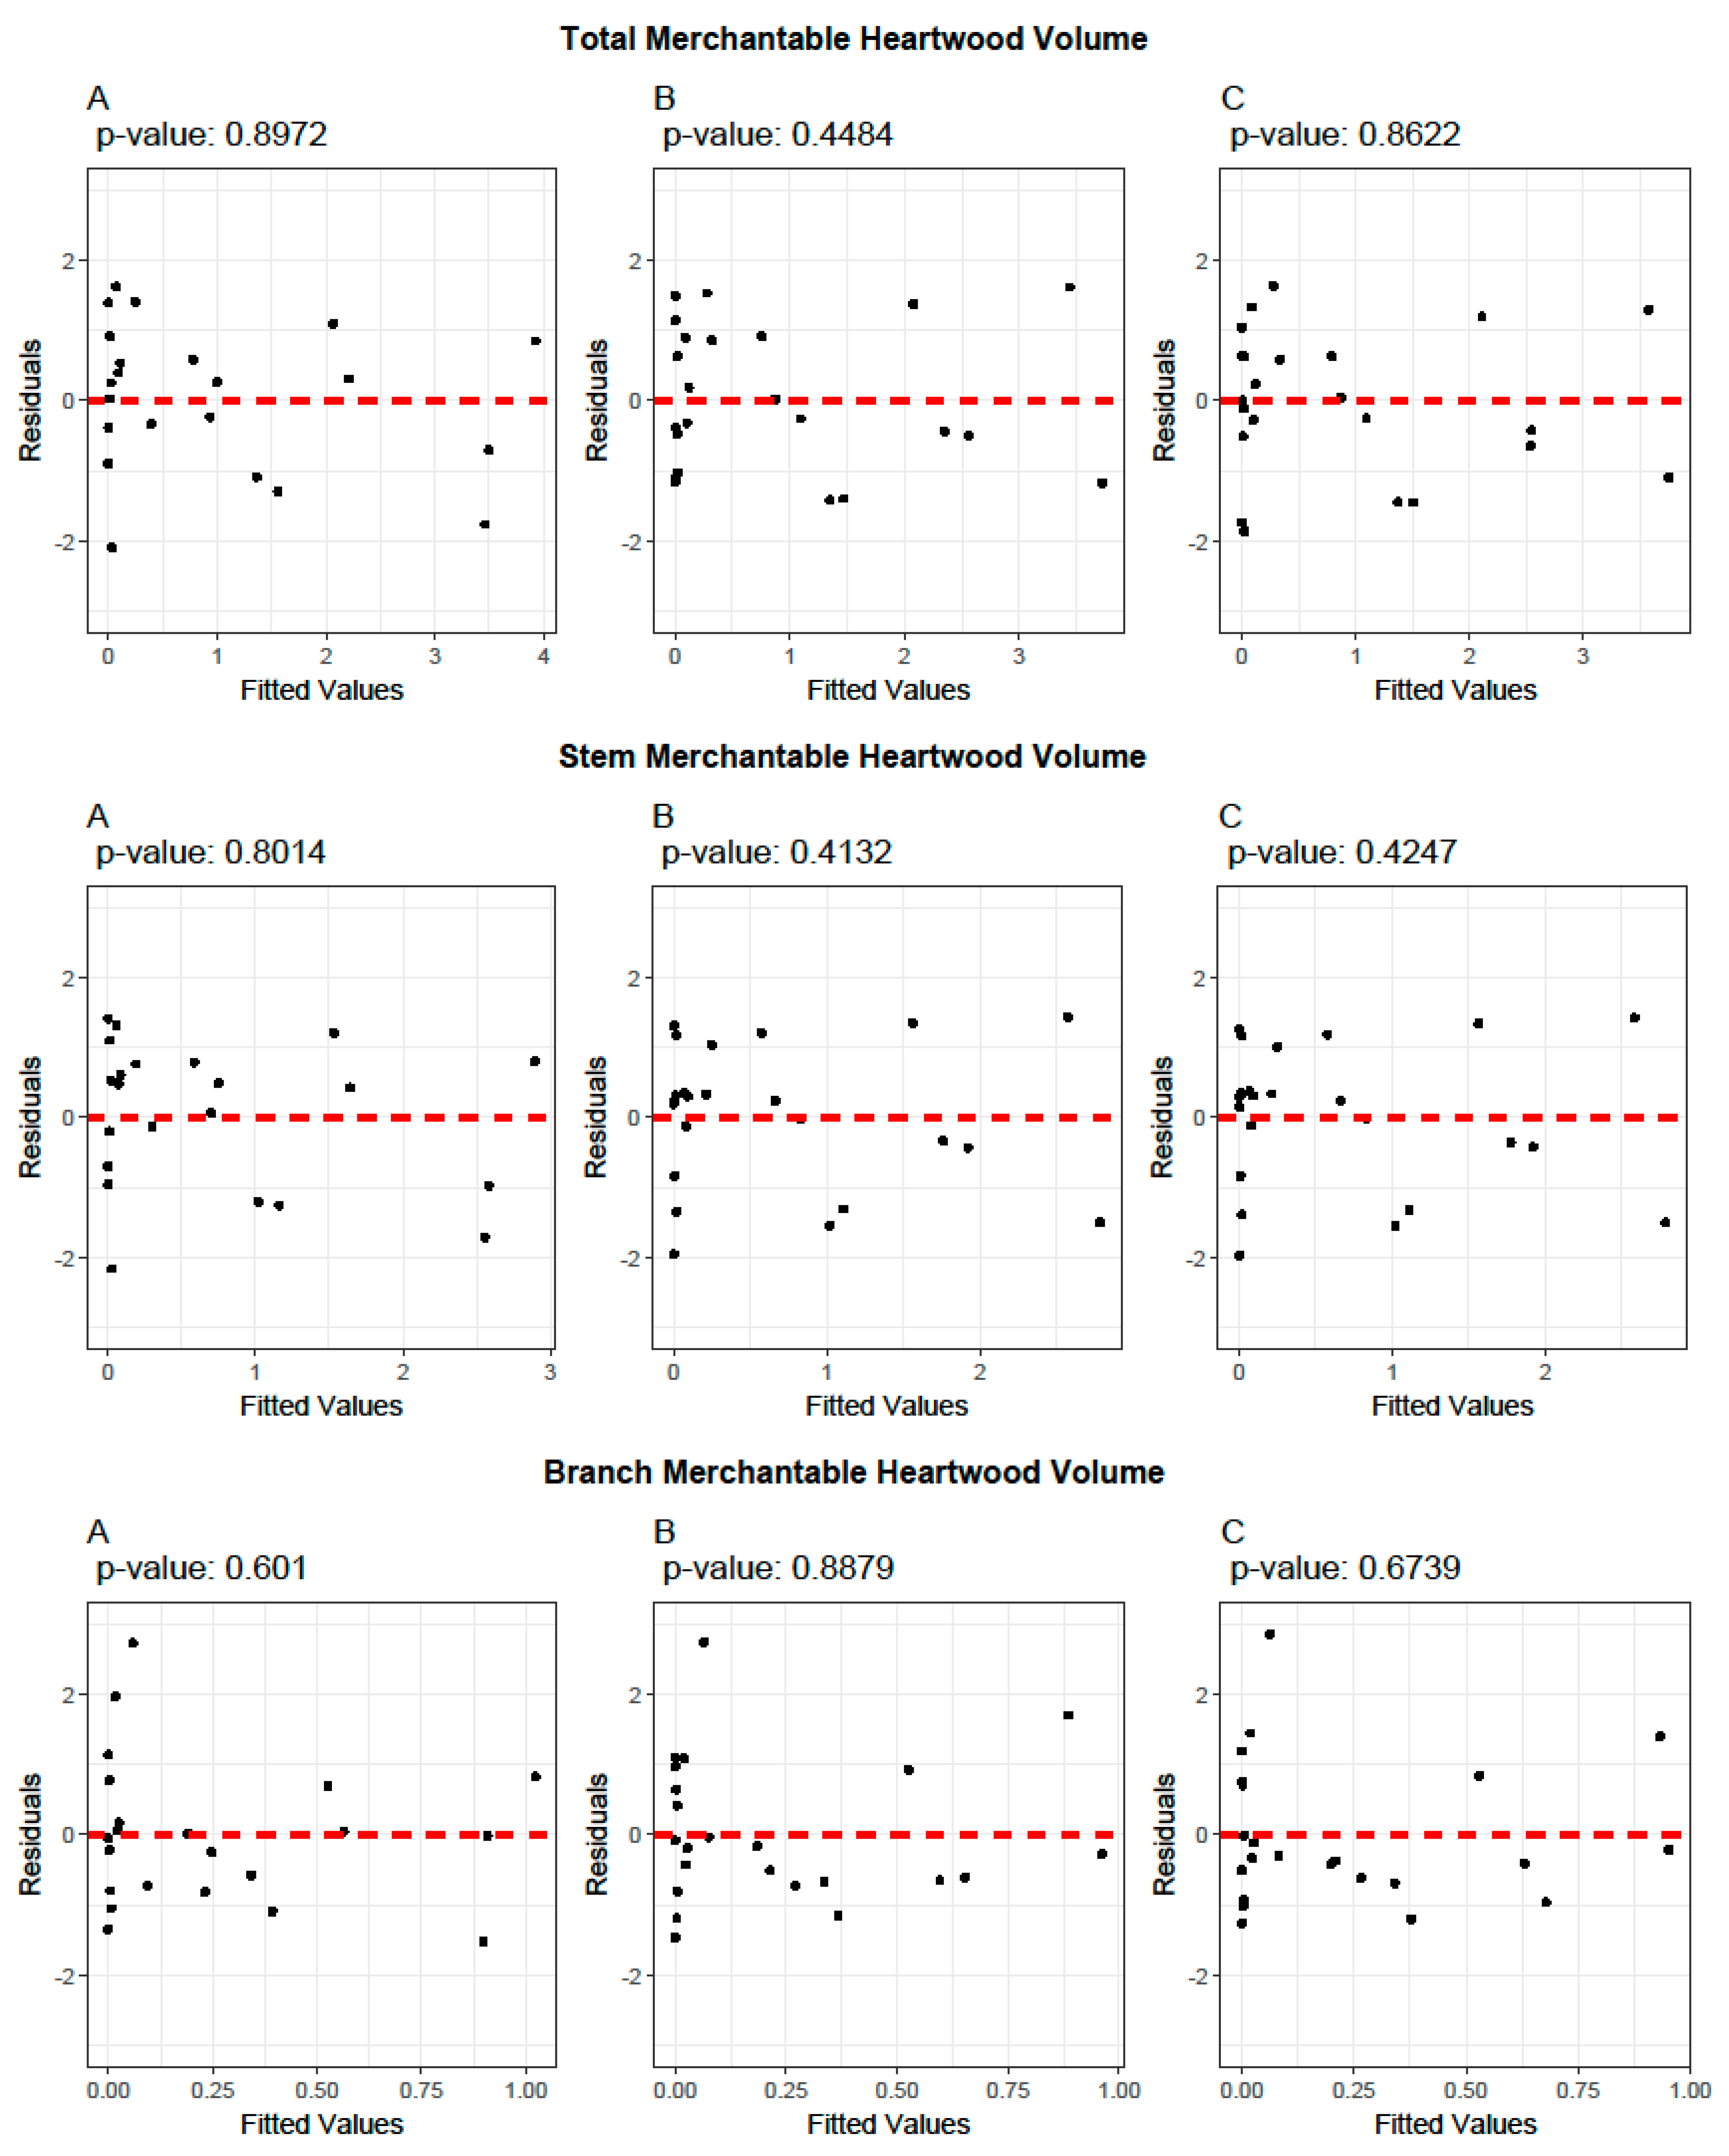
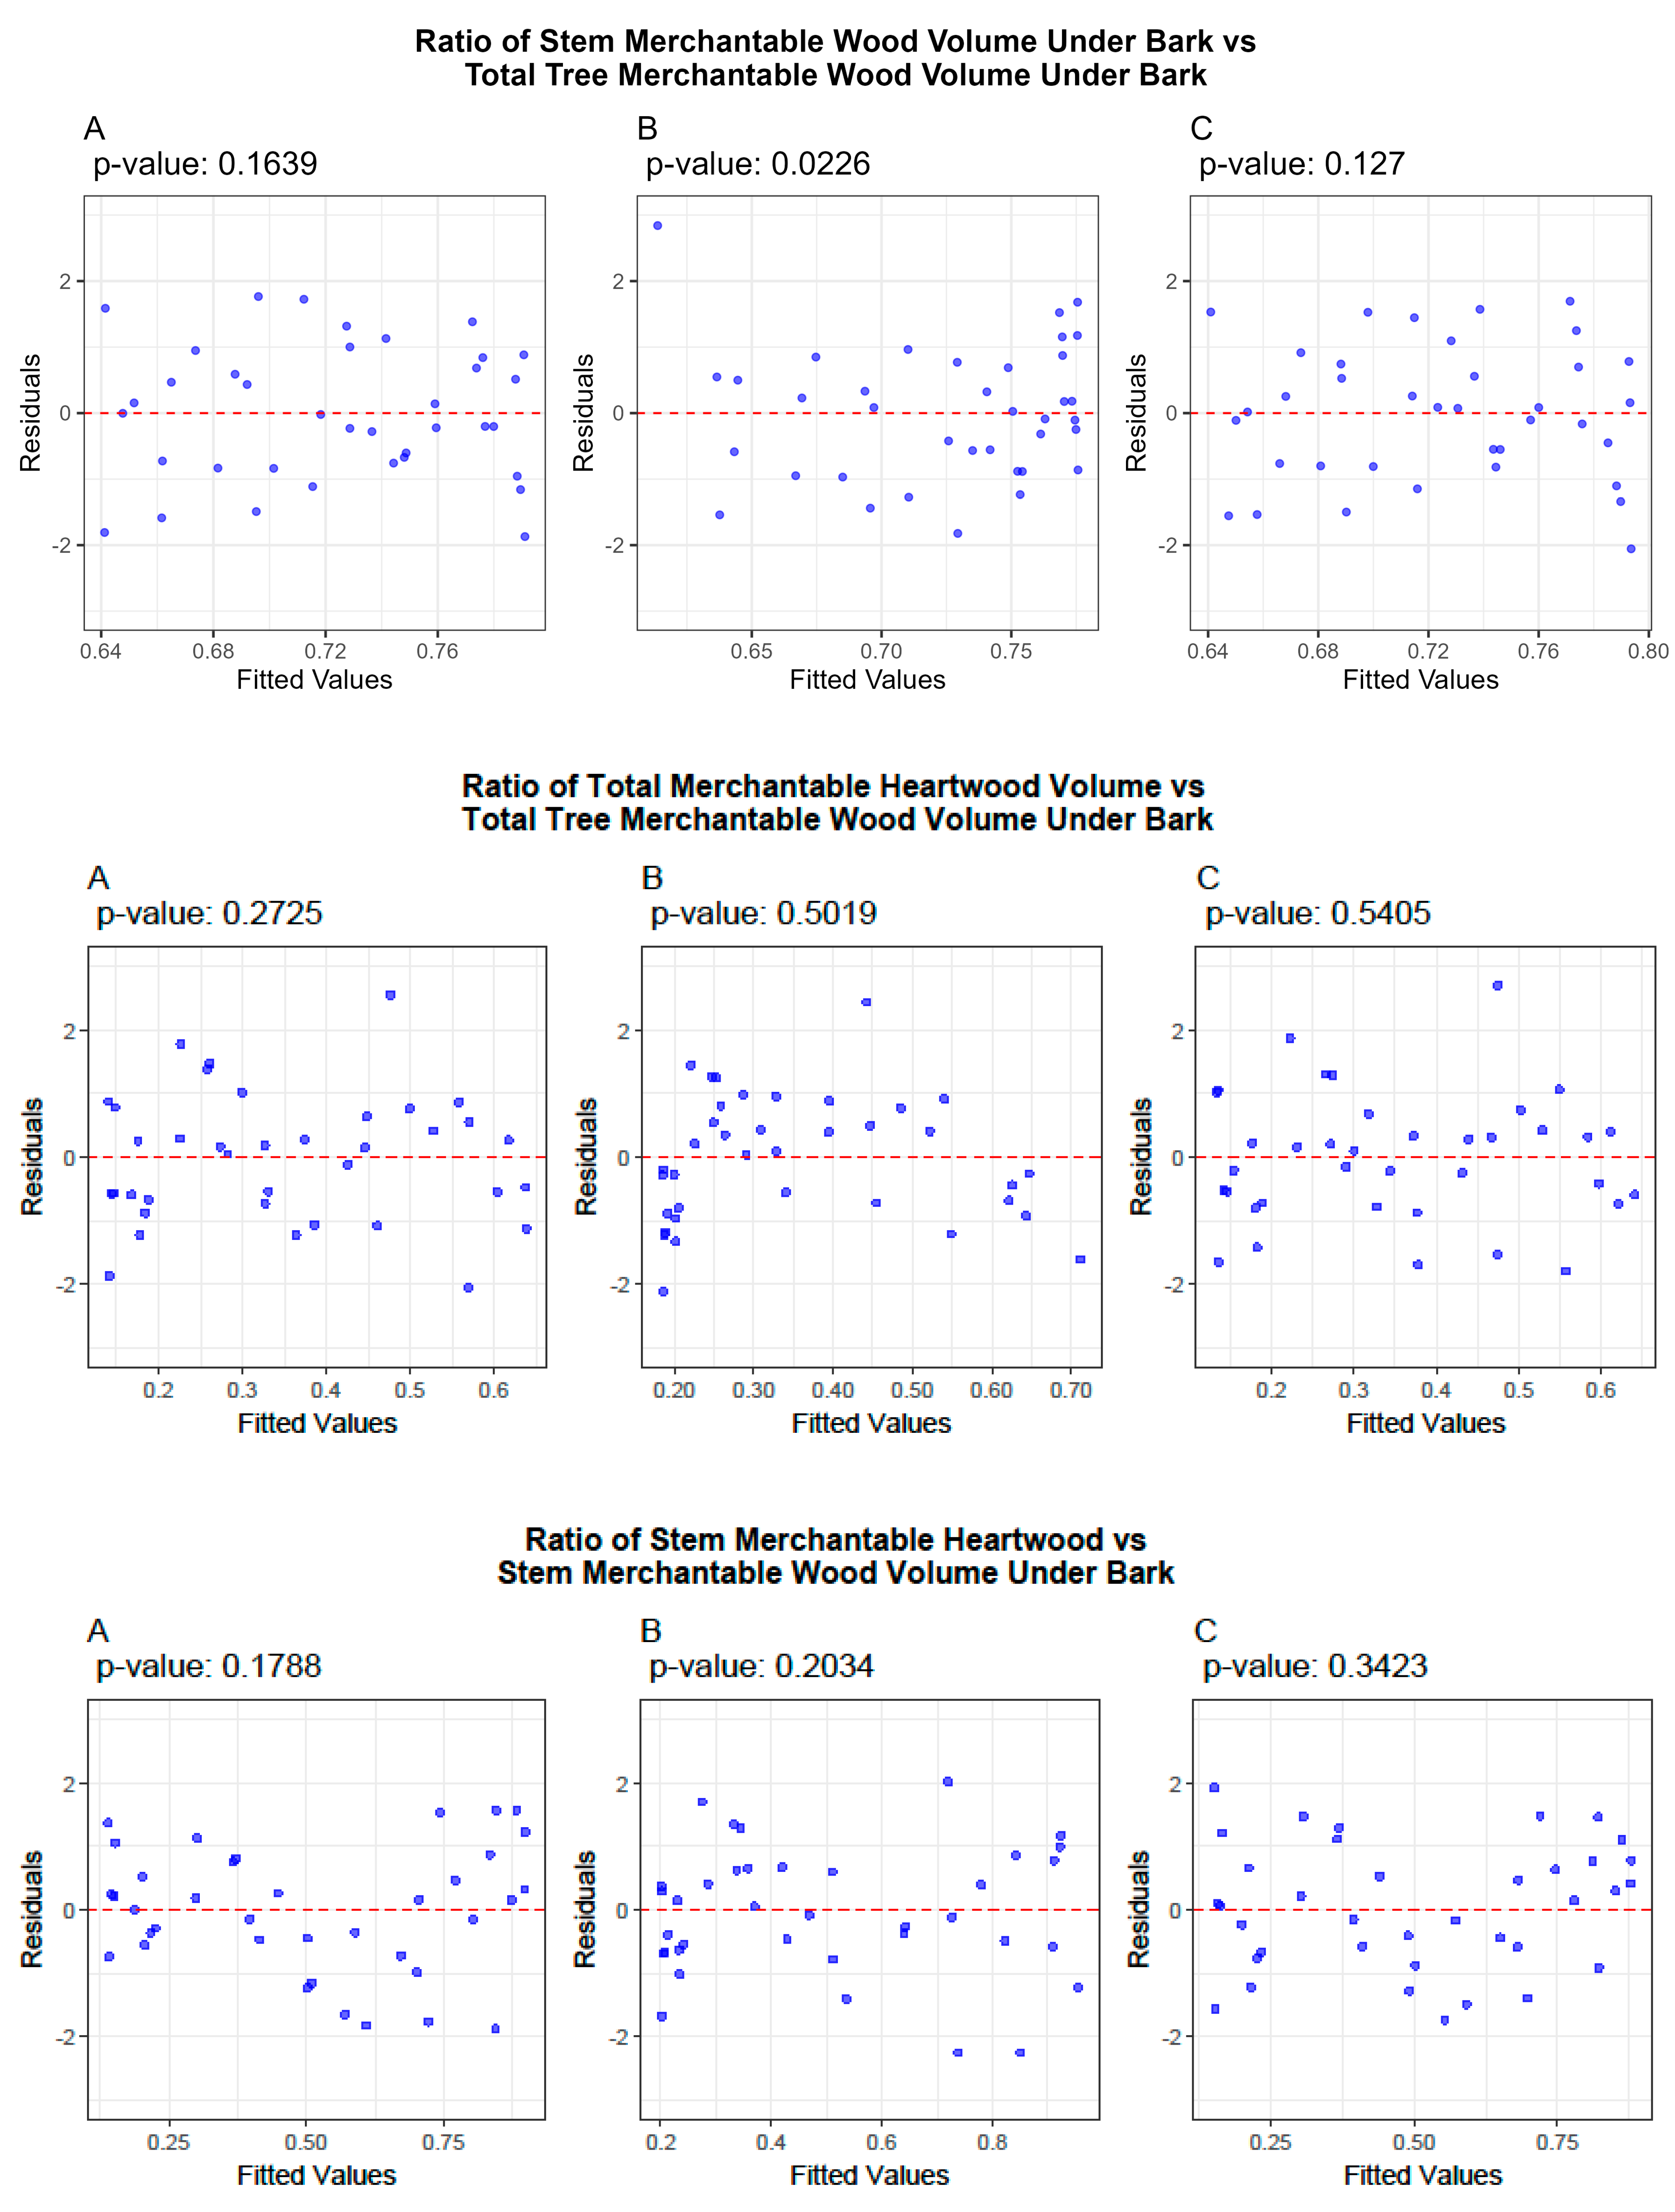
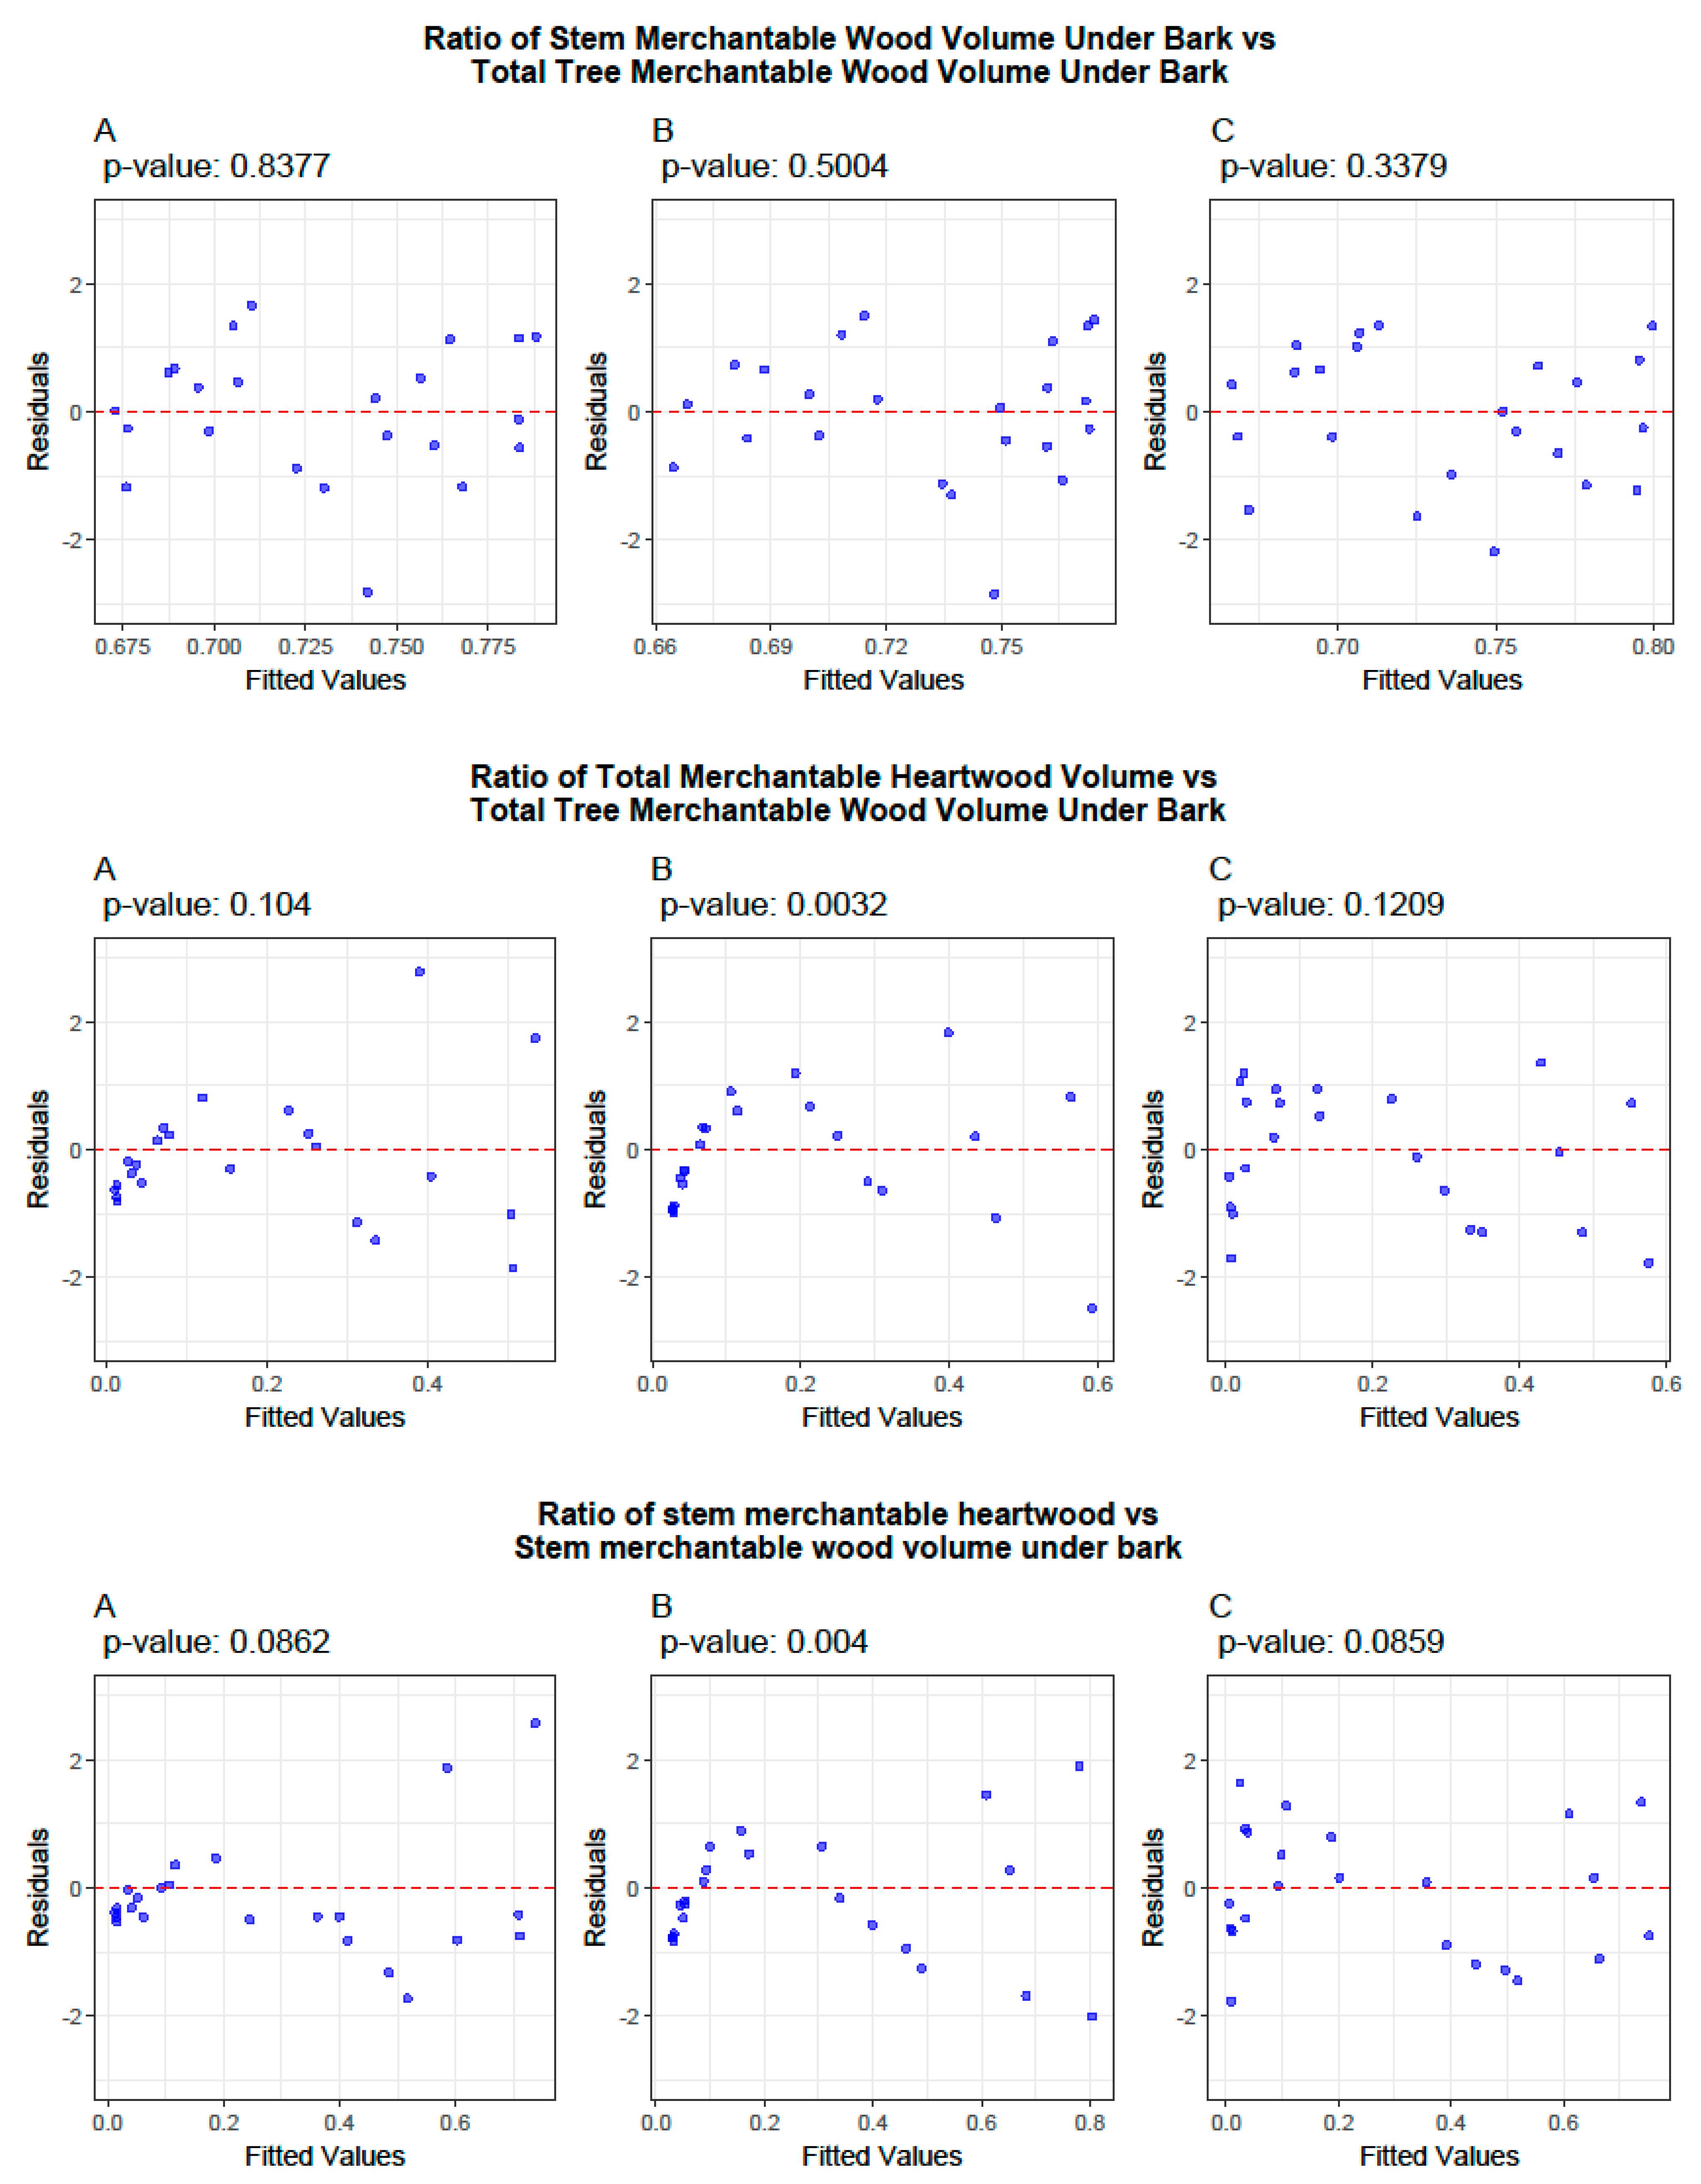
2.5. Model Evaluation and Validation

The most suitable models were selected using the following criteria, listed in order of relative importance: Akaike’s Information Criterion (AIC), the Bayesian Information Criterion (BIC), the Mean Absolute Error (MAE), the Mean Absolute Percentage Error (MAPE), and the Root Mean Squared Error (RMSE) [44]. AIC and the BIC were used to assess model fit while penalizing complexity, with lower values indicating better model performance [45,46,47]. AIC prioritizes goodness of fit with a moderate penalty for additional parameters, whereas the BIC applies a stricter penalty, favoring simpler models. The combined use of AIC and the BIC aimed to balance overfitting (favored by AIC) and under fitting (favored by the BIC), ensuring a more robust model selection while maintaining the principle of selecting models that are as simple as possible and as complex as required [45,46]. If both criteria select the same model, it provides strong evidence of its adequacy.
The MAE measures the average absolute difference between observed and predicted values, offering an intuitive measure of prediction accuracy [48,49,50]. The MAPE expresses these errors as a percentage, enabling comparison across different datasets [49]. The RMSE, which gives higher weight to larger errors, captures overall model accuracy while being more sensitive to extreme deviations [48,50]. The simultaneous use of the MAE and MAPE allowed for a comprehensive assessment of both absolute (MAE) and relative (MAPE) error magnitudes, contributing to a more robust decision-making process. The inclusion of the RMSE helped identify large errors that could compromise prediction quality [48,49,50]. Overall, the combination of these criteria enhanced the reliability of model selection by ensuring a balance between goodness of fit and predictive accuracy. R2 was not used because it is inappropriate for non-linear models [51,52]. The AIC, BIC, MAE, MAPE, and RMSE were selected due to their widespread application in studies of this nature conducted in Miombo by the authors of [26,53] and in other forest formations [54,55].
Validation was performed for the selected models for volume, ratio, and biomass using repeated K-fold cross-validation with 10 folds and three repetitions, as suggested in [56,57]. In this analysis, we computed the MAPE and assessed its variability and consistency in relation to the same parameter determined for the models, which was obtained randomly in different sub-samples. Through these evaluation and validation techniques, the accuracy, reliability, and predictive capabilities of the selected model were assessed in other samples [56,57].

2.6. Comparison with Existing Allometric Equations

In this study, the performance of the best-fitting model was compared with that of existing models described in the literature, prioritizing comparisons with models developed for species and climatic conditions similar to those considered in the present study. This procedure is common in modeling and aims to validate and justify the adoption of new models compared to pre-existing ones, as in [25,28]. The comparison assesses the relevance of adopting existing general volume and biomass models with reasonable performance rather than developing new local-species-specific models. In this study, this comparison was restricted to volume and biomass models.
In this context, in terms of the total tree merchantable wood volume under bark, the models developed for the two species in the current study were compared with each other, with the model developed for Holoptelea grandis (Hutch.) Mildbr and Cynometra megalophylla Harms by the authors of [58], and with models developed for mixed species in the Miombo ecoregion stands by the authors of [26,59]. For the stem merchantable wood volume under bark, the models for the species considered in the current study were compared with each other, with the models developed by the authors of [60] for Afzelia quanzensis and Millettia stuhlmannii, and with models for the stem volume of mixed species in the Miombo stand developed by the authors of [13,26]. For the branch merchantable wood volume under bark, the models the species in the current study were compared with each other and with the models developed for the branch volume of mixed species in the Miombo stand by the authors of [10,26,28].
For the total merchantable heartwood volume, the models for the species in this study were compared with each other and with the models developed by the authors of [61,62] for the total heartwood volume of Tectona grandis. The models for the total tree biomass for the species in the current study were compared with each other and with species-specific models developed by the authors of [53,60] for the biomass of Afzelia quanzensis, Pterocarpus angolensis, and Brachystegia spiciformis, as well as with biomass models for mixed species in the Miombo ecoregion stands [25]. No models were found that were considered viable for comparison at the branch (heartwood) and ratio levels.

3. Results

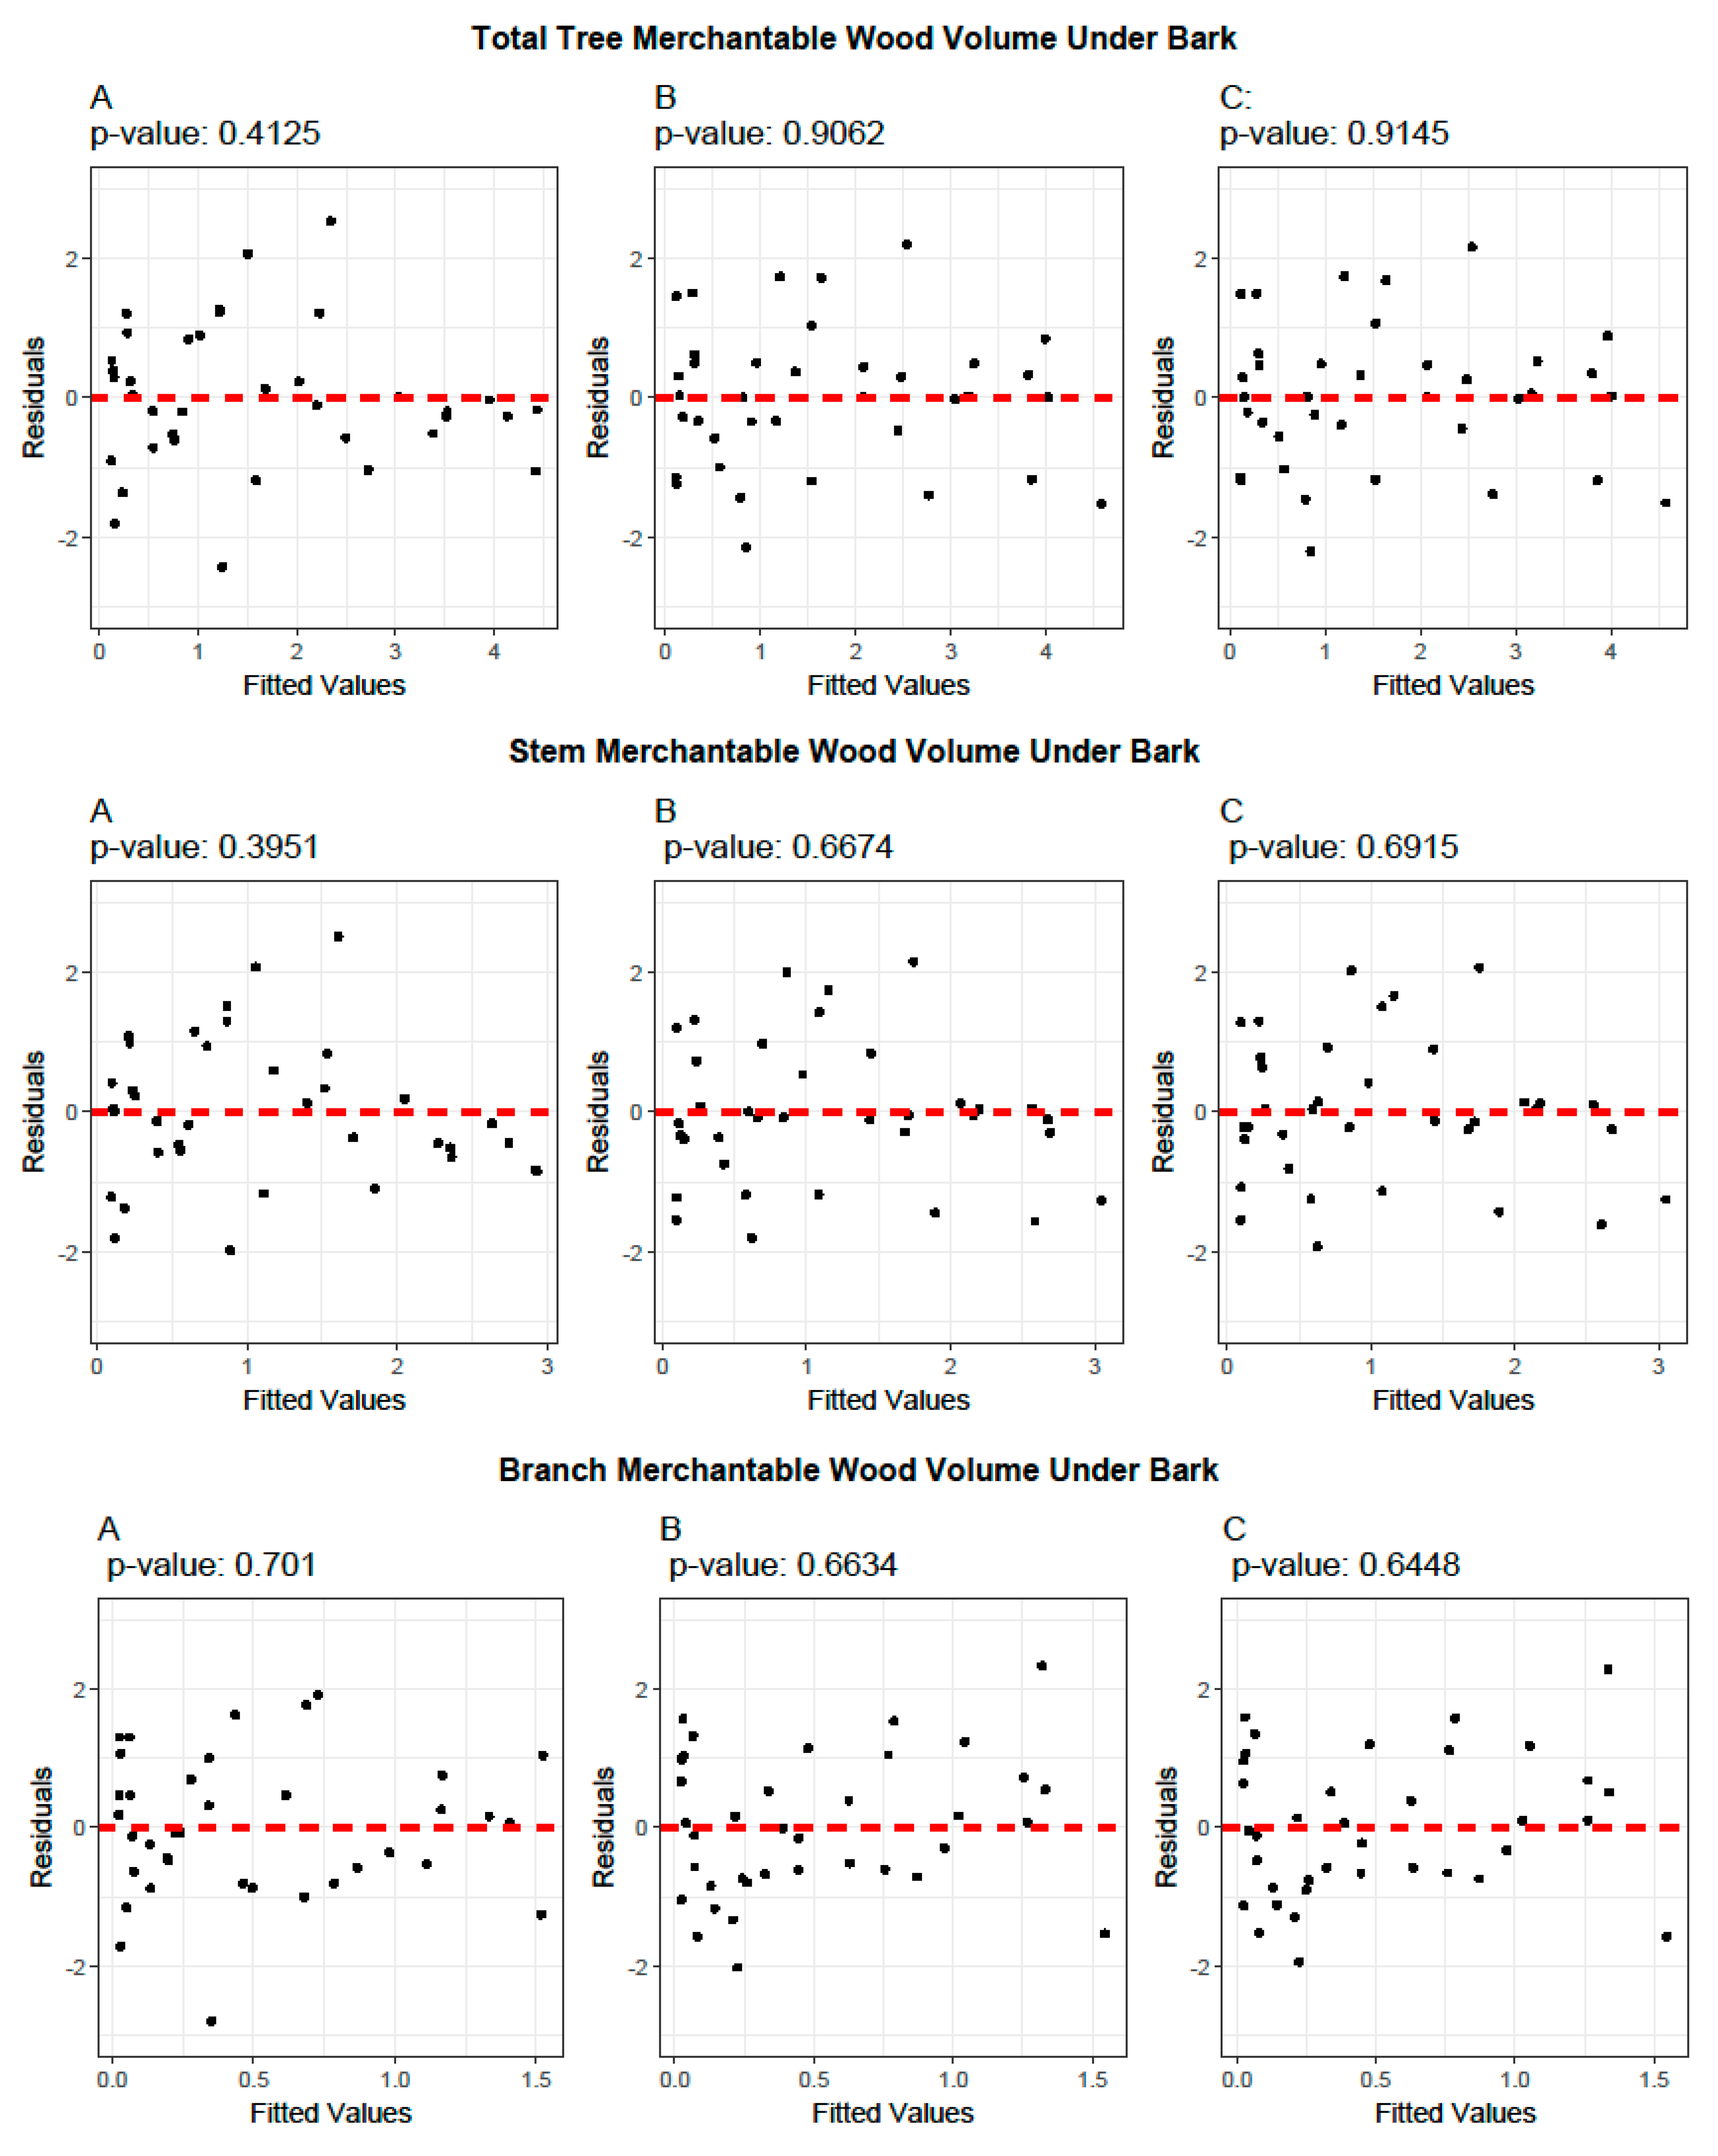
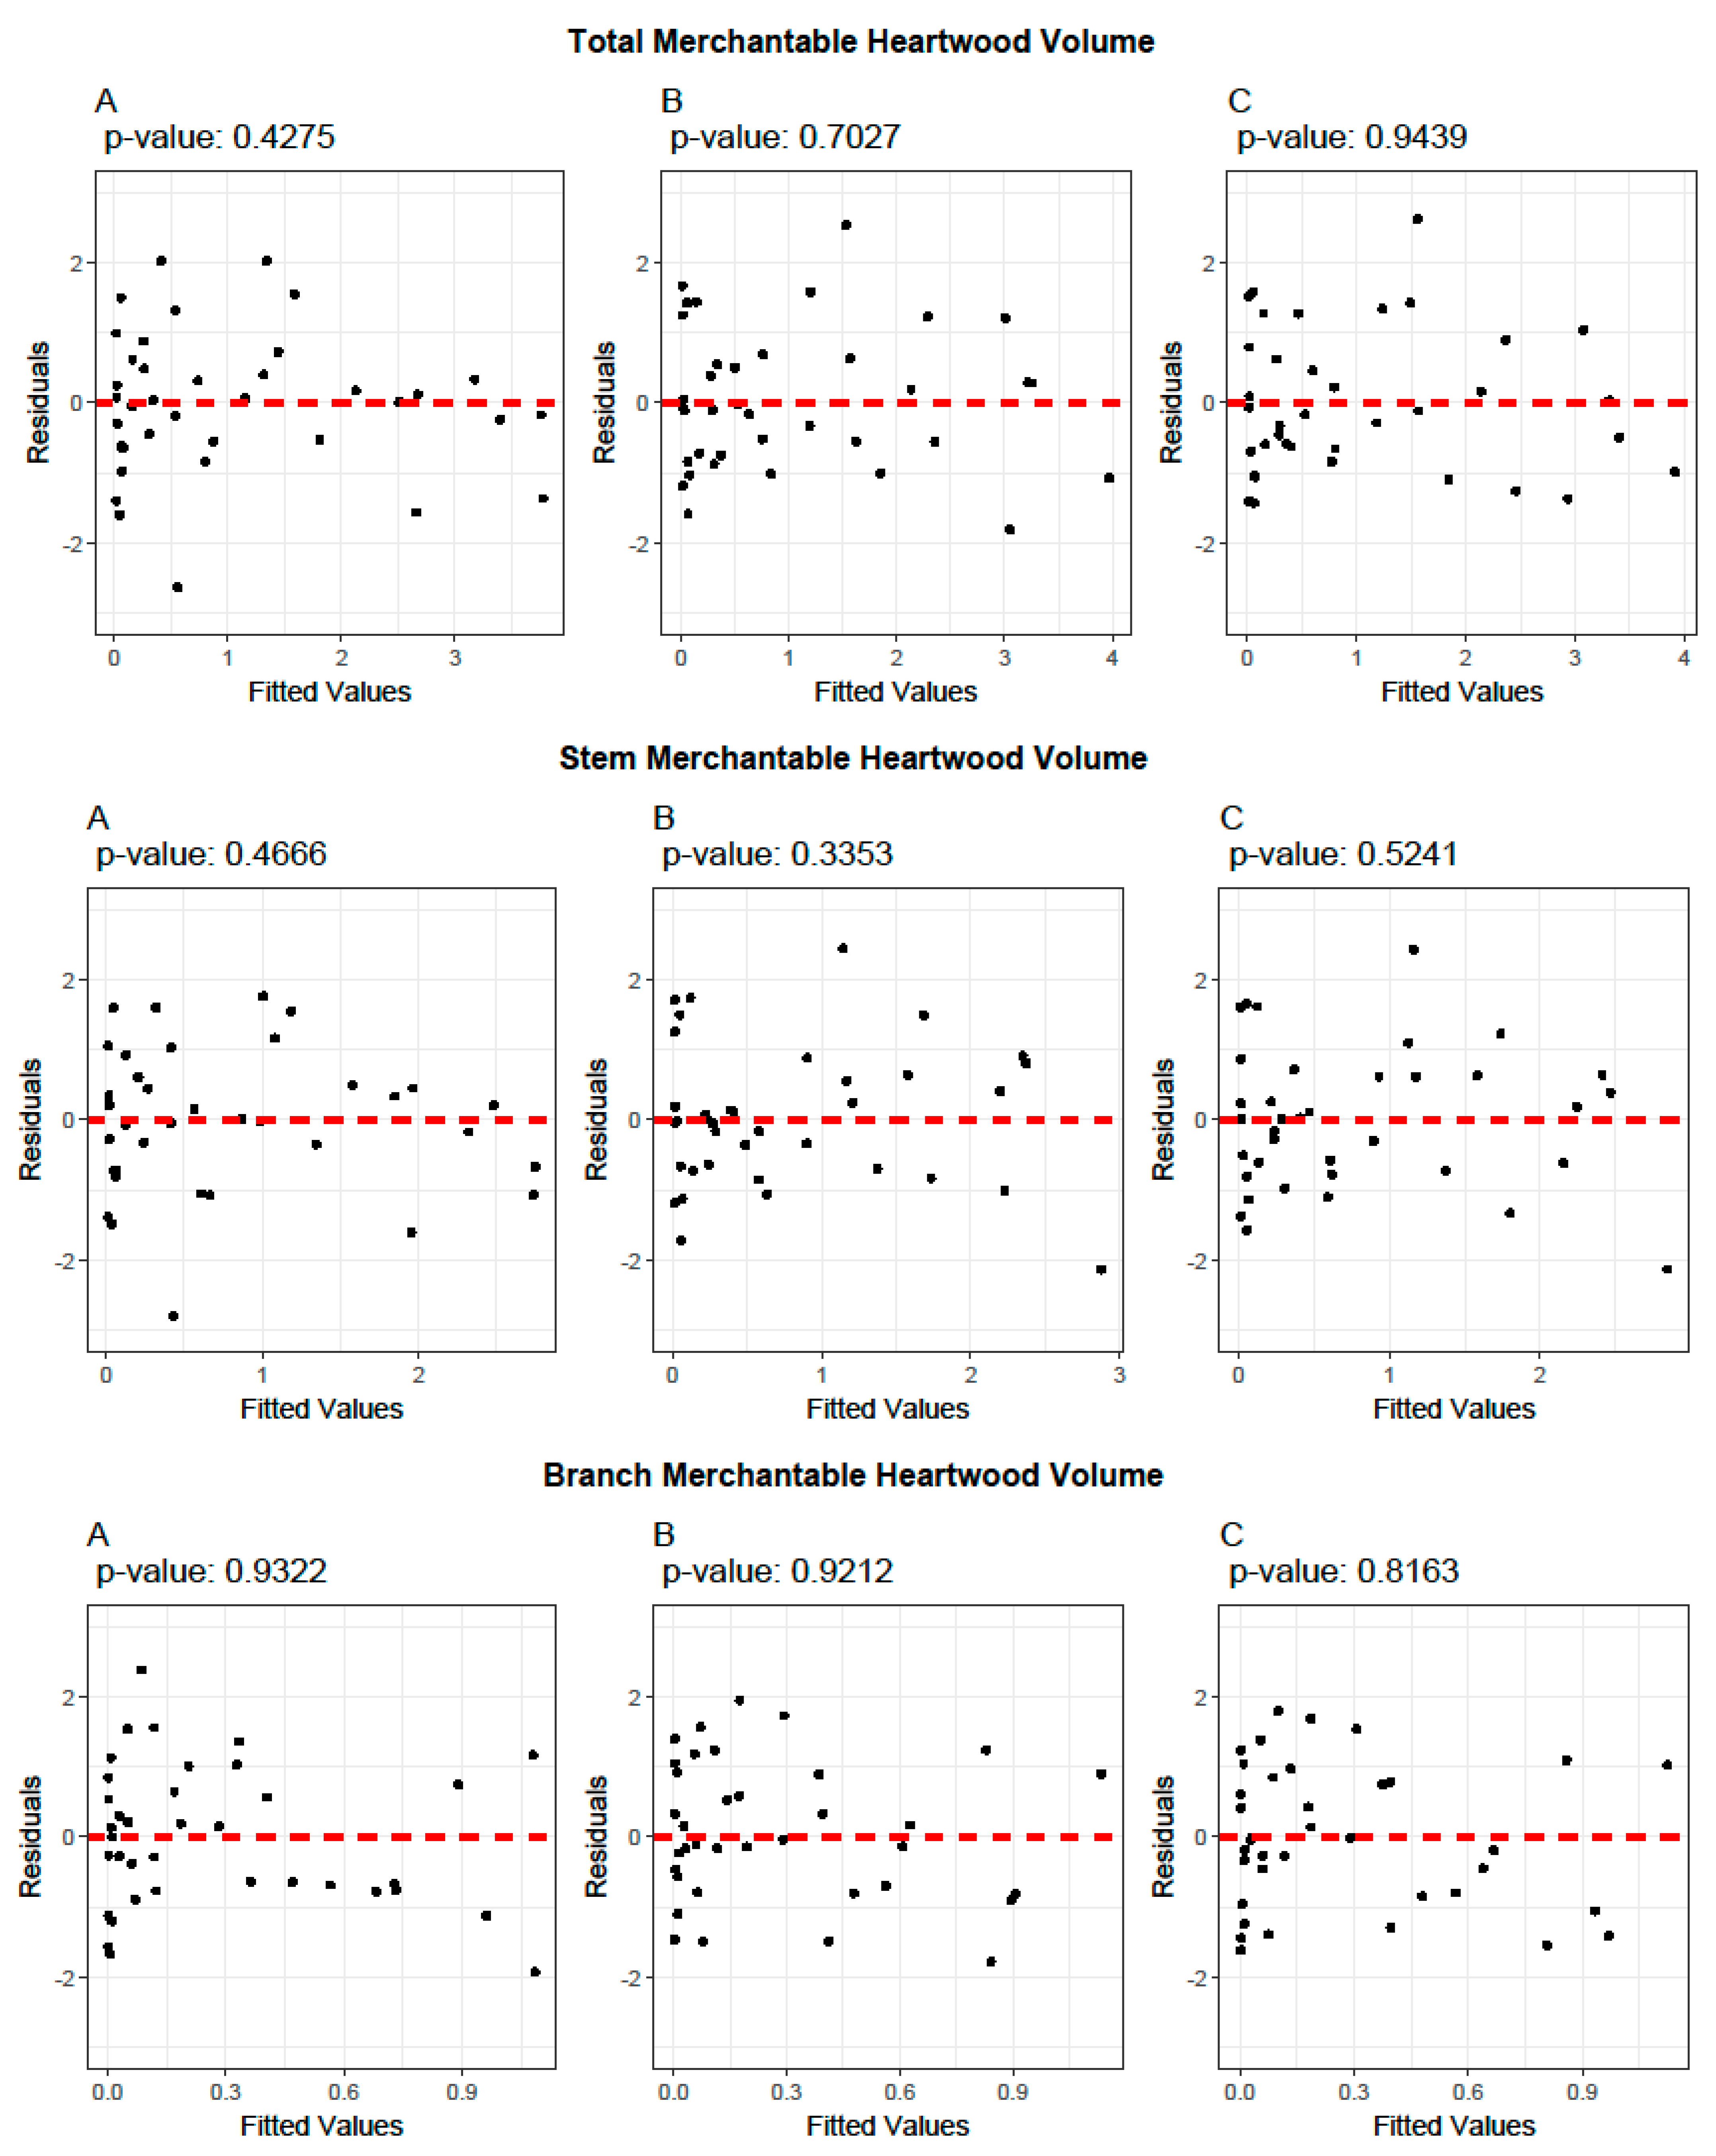
3.1. Allometric Equations for Volume Estimation

The residual scatterplots combined with the p-value of the Breusch–Pagan test for the variables related to the merchantable wood volume under bark and heartwood for both B. spiciformis and J. globiflora indicate homoscedasticity in all cases (Figure 3 and Figure 4). Therefore, the selection of the most suitable merchantable volume models was based exclusively on the AIC, BIC, MAE, MAPE, and RMSE criteria.
Among the three evaluated models for all dependent variables (total tree merchantable wood volume under bark, stem merchantable wood volume under bark, branch merchantable wood volume under bark, total merchantable heartwood volume, stem merchantable heartwood volume, and branch merchantable heartwood volume), Model 2, which incorporates height as a variable (DBH2Ht), demonstrated higher performance for both B. spiciformis and J. globiflora, as per their AIC and BIC values, which were the lowest. Model 1, which relied solely on DBH as the predictor variable, exhibited the poorest performance, with the highest AIC and BIC values. Model 3, which includes both DBH and height (with height as a second variable), performed better than Model 1 but did not outperform Model 2 in overall accuracy (Table 4 and Table 5).

3.2. Ratio Models

The residual scatterplots, combined with the p-value of the Breusch–Pagan test for the ratios, indicate heteroscedasticity only in Model 2 for the ratio of stem merchantable wood volume under bark to total tree merchantable wood volume under bark for B. spiciformis (Figure 5). However, for J. globiflora, heteroscedasticity was observed in two models: Model 2 for the ratio of total merchantable heartwood volume under bark to total tree merchantable wood volume under bark and in Model 2 for the ratio of stem merchantable heartwood volume under bark to total tree merchantable wood volume under bark (Figure 6). The models that showed heteroscedasticity are not candidates for the best model. The selection of the best model considered the AIC, BIC, MAE, MAPE, and RMSE criteria for those models remaining contenders for best model.
Model 4, with one predictor variable (DBH), was the best model for estimating the ratio of stem merchantable wood volume under bark to total tree merchantable wood volume under bark for both species, as well as the ratio of total merchantable heartwood volume to total tree merchantable wood volume under bark for B. spiciformis (Table 6 and Table 7), since it observed the lowest AIC and BIC values. Model 5 demonstrated higher performance, for B. spiciformis, in computing the ratio of stem merchantable heartwood to stem merchantable wood volume under bark, as it has the lowest AIC and BIC values, the smallest RMSE and MAE. Model 6 exhibited the best performance for the ratio of total merchantable heartwood volume to total tree merchantable wood volume under bark and for the ratio of stem merchantable heartwood to stem merchantable wood volume under bark for J. globiflora, showing the lowest AIC and BIC values and the smallest MAPE.

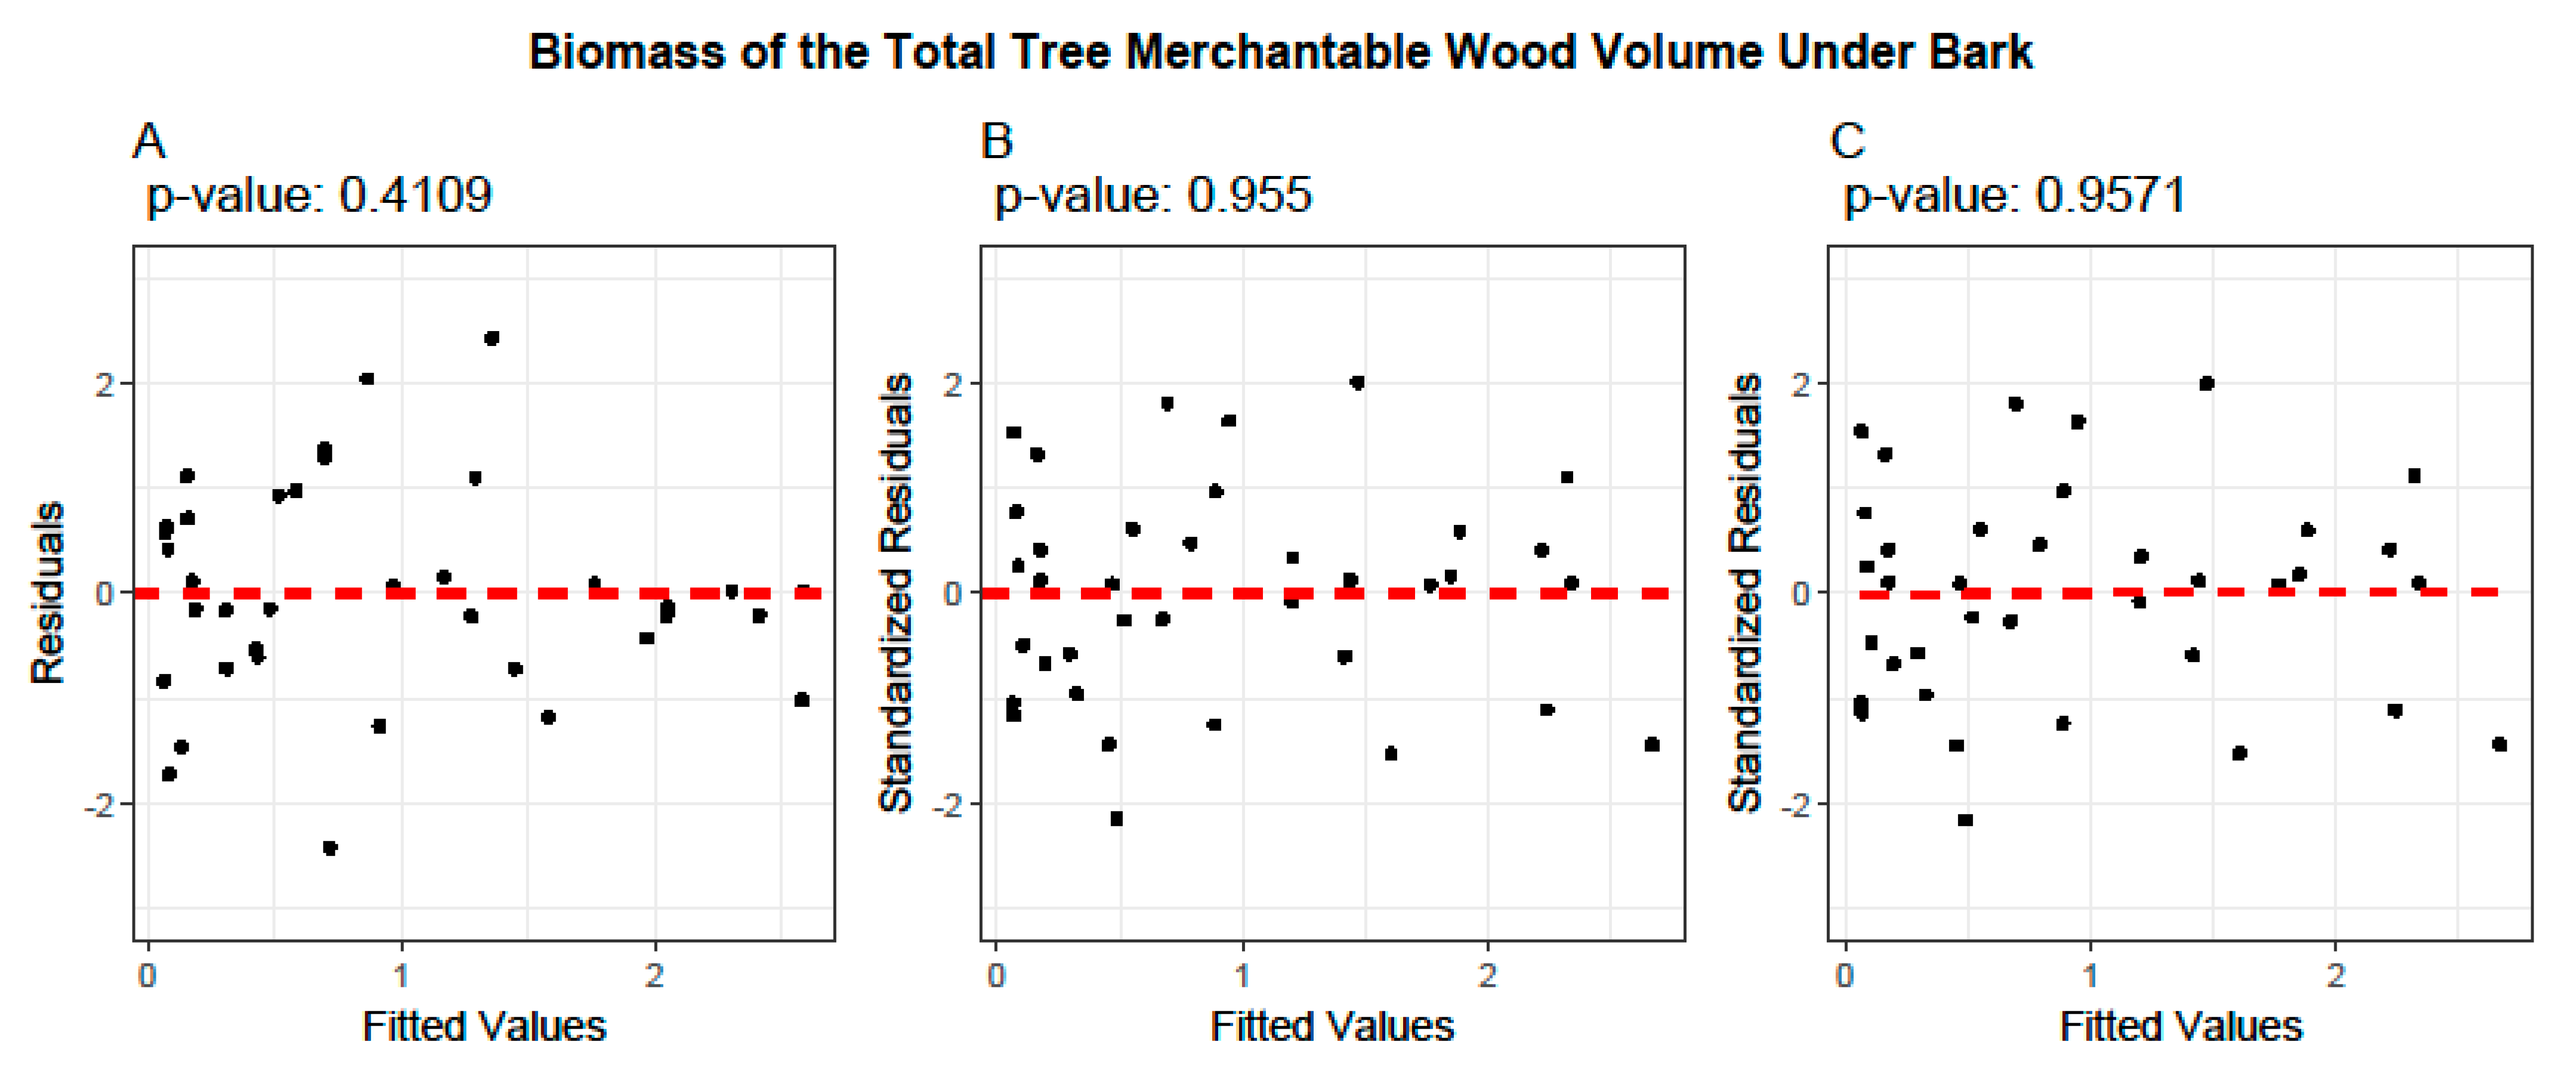
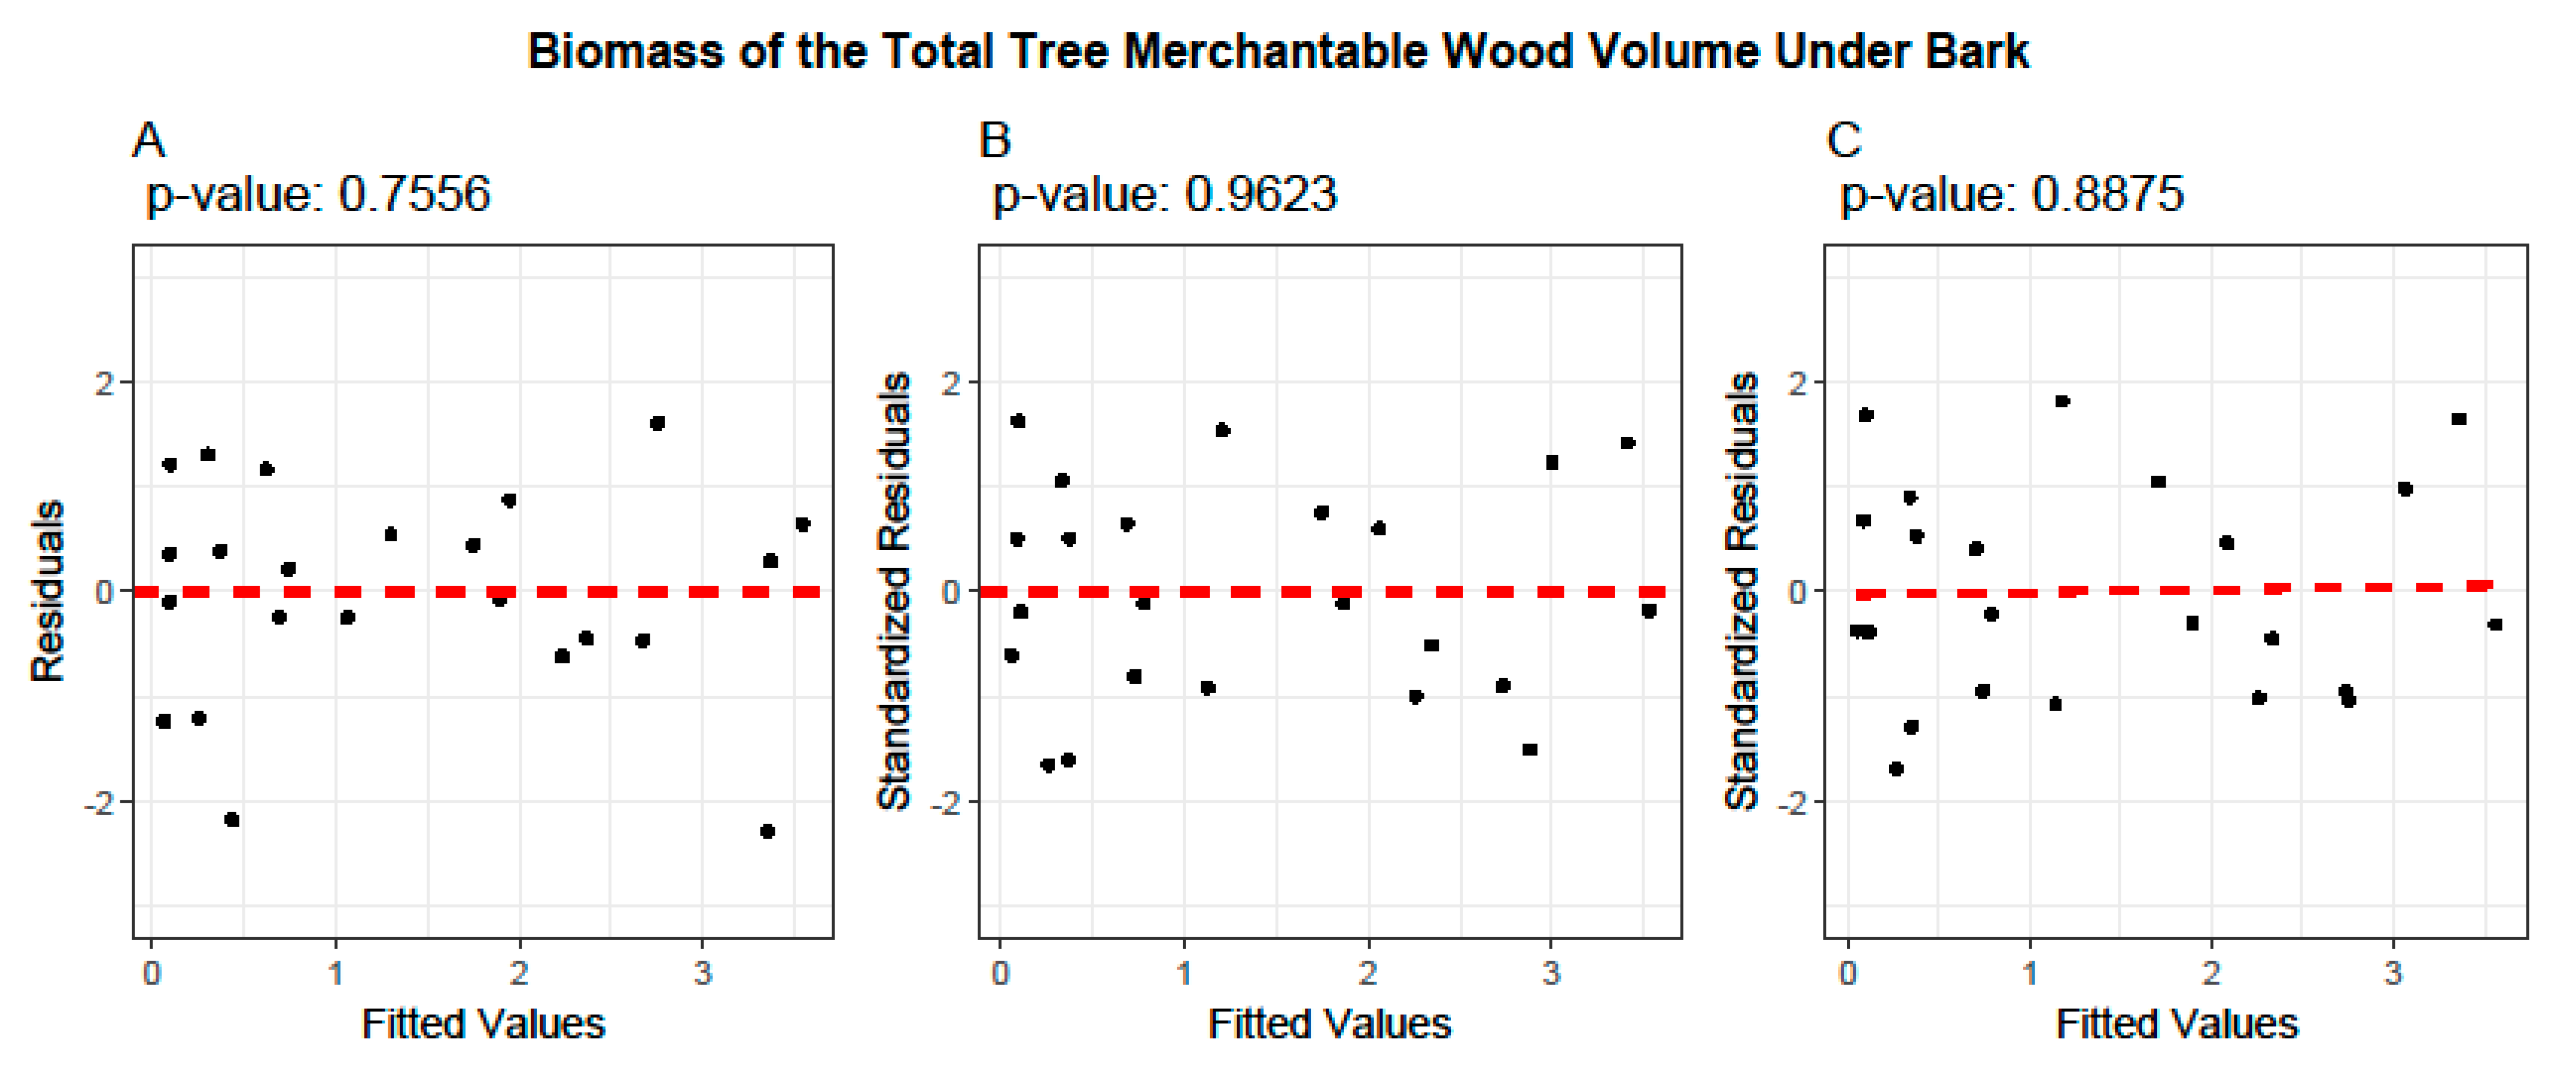
3.3. Biomass Equations

Basic wood density was used to estimate biomass. The mean density of wood (g/cm3) and related standard deviation values at the DBH position, first branch, secondary branch, and tertiary branch were 0.575 ± 0.012, 0.563 ± 0.022, 0.562 ± 0.011, and 0.551 ± 0.009 for B. spiciformis, respectively, and 0.699 ± 0.012, 0.687 ± 0.014, 0.684 ± 0.008, and 0.679 ± 0.007 for J. globiflora, respectively. There was no evidence of a statistically significant difference in density among the established positions for B. spiciformis (p = 0.076). However, a significant difference was observed for J. globiflora (p = 0.036), particularly between the density of tertiary branches and the density at the DBH position. A significant difference was also observed between the two species (p = 2.53 × 10⁻³⁰).
The residual scatterplots combined with the p-value of the Breusch–Pagan test for the models for both species of the total tree merchantable biomass and the total merchantable wood under bark indicate homoscedasticity (Figure 7 and Figure 8). Therefore, the selection of the best model was based on the AIC, BIC, MAE, MAPE, and RMSE criteria.
Table 8 and Table 9 show that, for both species, Model 2, which uses height as an additional predictor variable (D2H), demonstrated the best performance in terms of AIC and the BIC. Conversely, Model 1 exhibited the poorest performance, with the highest AIC, BIC, MAE, and MAPE values. Although Model 3 outperformed Model 1, it did not surpass Model 2 in overall accuracy.

3.4. Cross-Validation of Volume and Ratio Biomass Equations

For the volume equations for B. spiciformis, the mean MAPE values ranged from 18.03 to 7.80, with higher values observed for the branches and heartwood, while, for J. globiflora, the values of the same criteria ranged from 19.84 to 11.66, with higher values observed for the same components (Table 10). The average MAPE for the cross-validation of biomass in the equations was 11.04% and 8.03% for B. spiciformis and J. globiflora, respectively.
For the ratio equations of B. spiciformis, the mean MAPE values ranged from 16.05 to 2.23, with higher values observed for ratios involving heartwood, while, for J. globiflora, the values of the same criteria ranged from 23.01 to 4.93, with higher values observed for the same components (Table 11). For the biomass model of B. spiciformis, the mean MAPE value was 8.03, while, for J. globiflora, it was 11.66% (Table 12).

3.5. Evaluation of the Predictive Performance of Developed and Existing Allometric Equations

All the merchantable volume models developed in this present study, whose dataset served as a basis for evaluating other models, demonstrated superior performance in terms of the MAPE across all variables analyzed for the dataset used (Table 13).
Similarly, all biomass models developed in this study, whose dataset served as the basis for evaluating all other models, demonstrated higher performance in terms of the MAPE across all variables analyzed for the dataset used (Table 14).

4. Discussion

  • Wood volume equations
The total, stem, and branch merchantable wood (heartwood plus sapwood) volume equations of the studied species exhibited MAPE values that fall within the ranges reported in [26] (0.26–18.9%) and [28] (0.0–16.6%) in Tanzanian Miombo woodlands, while the RMSE values were lower than that reported in [59] (0.315 m3–0.47 m3), [26] (0.36–1.10 m3), and [59] (0.142–0.355 m3), studies conducted in the Tanzanian Miombo woodlands. The models in [26,28] were developed for mixed species, while the authors of [59] developed species-specific equations for Brachystegia spiciformis, Combretum molle, and Dalbergia arbutifolia.
The MAPE values obtained in this study were consistently slightly higher for the equation for stem merchantable wood volume under bark than for that of the total tree merchantable wood volume under bark for J. globiflora. This observation is consistent with the findings of [13,26,28], where total wood volume models performed better than stem wood volume models. That stem models achieve the lowest performance may be explained by the fact that determining the merchantable stem height often involves some degree of subjectivity due to imprecision in defining the upper point for measuring the stem height [26]; according to the same authors, this can be attributed to factors such as the variability in first branching and the appearance of defects in the stem.
In general, models with only one predictor variable (DBH) exhibited lower performance than those with two variables. This observation is in agreement with the findings reported by the authors of [13,26,28], when modeling wood volume in Miombo woodlands. The inclusion of the total height variable improved model performance. However, the improvement was not very significant because, as proposed in [26,63,64], DBH and total height are related. Authors, such as those of [13,26,28], also observed that including height in a given model with an existing DBH variable neither adds significant new information nor improves the model performance in Miombo woodlands. Nevertheless, incorporating height as a combined variable with DBH (DBH2Ht) resulted in better-performing models compared to those in which height was included as a second variable, as was found in [28].
It is generally observed that the equations of branches exhibited the highest MAPE values when compared to those of the total and stem volume. Other studies that modeled the total volume, stem volume, and branch volume also reported low performance for models of branches in Miombo woodlands [13,26,28]. The lower accuracy of allometric equations for branches can be attributed to the greater plasticity of branches compared to stems [65,66]. This difference arises from the more variable anatomical structure of branches relative to trunks [65,66,67]. Branches exhibit adaptive growth patterns in response to environmental conditions, whereas trunks are primarily designed for transport, stability, and support, resulting in a more uniform structure that emphasizes strength over adaptability [66,67]. This is particularly evident in the ability of tree species to develop different crown shapes in open and closed environments in response to variations in environmental conditions [66,67,68].
  • Heartwood volume equations
The MAPE values of the heartwood equations for the studied species tended to be slightly higher than those of total wood volume equations (sapwood plus heartwood), and the MAE values were higher than those found by the authors of [62] when modeling the total heartwood volume of Tectona grandis in a plantation in China (0.0019 m3). On the other hand, the authors of [69] reported an RMSE value of 0.125 m3 when modeling total heartwood in Eucalyptus globoidea, which is close to the range of values presented in this study. The differences in the MAE and RMSE values may be attributed, among other factors, to the variables that influence heartwood formation in tropical species [70,71]. These include the sociological position of the crown, trunk size, growth rate, species or genera characteristics, and local agro-ecological conditions [70,71,72]. Silvicultural treatments such as spacing, thinning, pruning, fertilization, and irrigation also play a significant role [70,73]. Furthermore, aspects such as metabolism, hormonal regulation, transcriptional control, and cellular biology also influence heartwood formation [62].
The heartwood merchantable volume models suggest that the total merchantable heartwood volume and stem merchantable heartwood volume of both studied species increase exponentially with the increment of DBH, as was observed in [61,74]. However, the authors of [75] observed in their study of the total heartwood volume in teak trees the increase in the heartwood volume with increasing DBH was not exponential but polynomial.
  • Ratio models
The relevance of the ratio lies in its ability to quickly provide insights into the proportion of wood with properties and characteristics suitable for processing, as well as the proportion that could potentially be allocated to less valuable purposes (branch wood) [76,77]. By using Beta regression models to model ratios, it was possible to conclude that a high proportion of merchantable branch volume is expected from trees in larger diameter classes. According to the ratio models developed in this study, the increase in DBH results in a reduction in the proportion of the stem merchantable wood volume to the total tree merchantable wood volume. On the other hand, increasing DBH also produces an increase of the proportion of the stem merchantable heartwood volume to the stem merchantable wood volume; the same patterns were found by the authors of [74,75] when modeling the proportion of total heartwood to the total wood volume of teak trees (Tectona grandis). This pattern means that higher proportions of heartwood are associated with trees of larger diameter, indicating that fewer large trees would be needed to produce a given heartwood stem volume required for high-quality products. Although it is rarely addressed in the literature, it is worth noting that ratios should be modeled at the species and site levels, as different allometric relations that can affect ratio models (heartwood/total wood as a function of DBH) have been identified among models developed in different climatic zones [74].
  • Practical use of volume and ratio models
Combining information that can be obtained from the wood, heartwood, and ratio models developed in this study can aid in the adoption of suitable strategies for selecting trees for harvesting according to specific objectives. The wood and heartwood merchantable volume models discussed above show increments of the stem merchantable wood volume and stem heartwood volume as DBH increases. This means that fewer larger trees are needed to produce a given volume of wood and heartwood from the stem. However, considering the behavior of the ratio models discussed above, a high volume of merchantable branches is expected from large-diameter trees. Therefore, the decision to select trees for a specific purpose should be made considering that the expected volume of merchantable branches decreases when using a greater number of small trees, but a high volume is generated when using a smaller number of large trees. Users can choose the second option if there is a clear strategy for using branches; otherwise, the first option is preferred. Although it is challenging to use branches due to their small size and irregular shape, which lower the recovery rate, they can be valorized by manufacturing small goods of high quality from their small heartwood material [58].
When selecting larger trees, the volume of heartwood is maximized by the higher total amount of wood per stem as well as the greater proportion of heartwood per stem. Users should therefore also prioritize larger trees if they want to produce high-quality products. However, because large trees play a critical role in forest regeneration and maintaining ecosystem quality and value [78,79], some large trees should be left dispersed throughout the stand. This selective retention approach supports ecological stability and biodiversity, balancing economic gains with forest sustainability. Therefore, harvesting larger trees offers both economic and climatic advantages, as the wood of larger trees typically holds higher value and higher carbon content [78,80,81], so harvesting and processing them increases profit and significantly contributes to increasing carbon storage outside the forest in wood products, owing to their high recovery rate.
  • Biomass models
The biomass models exhibited higher values for some model evaluation criteria compared to values found in other studies, such as the MAPE reported in [25] (0.1% and 1.5%), which involved mixed models for Miombo woodlands; the MAPE reported in [82] for species-specific models for Julbernardia paniculata, Brachystegia spiciformis (2.89%), Marquesia macroura, and Isoberlinia angolensis and overall (1.35–7.15%) for the Miombo woodlands; and the MAE reported in [25] (21.8 kg and 6.9 kg). The values obtained in the present study are similar to the RMSE values reported by the authors of [83] (0.163 to 146 kg), who worked with mixed models in Amazon, as well as those reported by the authors of [84], who worked with species-specific models for Brachystegia spiciformis (127–162 kg), Combretum molle (170–203 kg), and Dalbergia arbutifolia (150–206 kg) in Miombo woodlands.
The biomass models in this study showed lower evaluation criteria values compared to those reported in other studies. For instance, the authors of [77,85] reported MAPE values of 18.65–29.30% for mixed-species models in a dry Afromontane forest; the authors of [83] reported MAE values of 144–121 kg and an RMSE of 530 kg for mixed models in the Amazon for commercial stems; and the authors of [86] reported RMSE values of 353–617 kg for species-specific models of Diospyros abyssinica (Hiern) F. White. Similarly, the authors of [14] reported an MAE value of 304 kg for mixed models in the Amazon. Due to the fact that the values obtained in the present study, when compared to others found in the literature, are higher than some [25,82], similar to others [83,84], and lower than some [77,85], it can be concluded that the evaluation metrics obtained in this study fall within the range reported in the literature.
Incorporating height into biomass models improved model performance, particularly when height was included as a combined variable (DBH2H), which is consistent with the findings of [87]. This effect of adding height in biomass models was also found by [53]; however, in their study, the best performance was found when height was included as a separate variable. It is worth emphasizing that the improvement due to height inclusion was not substantial, as observed in [25,53,87]. Therefore, given the challenges associated with measuring tree height and the accuracy of models that do not require direct height measurements, it is justifiable to use equations based solely on diameter.
  • Model Performance
The cross-validation results for both species indicate a slight increase in MAPE values compared to the original models, without exceeding 2% for both volume and biomass. The values of the present study are lower than the MAPE values obtained in [85], which ranged from about 18% to 29% for mixed-species biomass equations developed for Afromontane forests. The values of the present study are comparable to the MAPE values obtained in [82], which ranged from −6.09 to 1.35% with the cross-validation method applied to estimate biomass (carbon) in Miombo. The models developed in this study exhibit strong predictive performance, which is expected to remain reliable even when applied to datasets beyond those used for their development. The observed 2% difference is within acceptable limits, considering that cross-validated score estimates often overestimate the expected loss due to the reduced size of the training set compared to the full dataset [56,57].
The comparison of volume and biomass models in this study indicates that our models perform better. Specifically, our biomass model exhibits a broader range and higher values than those reported in previous studies: ref. [85] reported values ranging from 19% to 71%, ref. [25] reported values from 2% to 49%, and ref. [88] reported values from 25% to 290%. Similarly, our total volume model shows greater amplitude and higher values compared to [13], which reported a range of 48% to 139%, and [28], which reported a range of 1% to 52%. These high differences in our study may be due to the fact that several models used for comparison with the values of the present study did not refer to merchantable values. This result aligns with the premise advanced in [25,28,38], which states that local equations specific to species and components (stem, branches, merchantable volume, or entire tree) are essential for accurate modeling.

5. Conclusions

This study developed allometric equations for estimating the total, stem, and branch merchantable wood volume, heartwood, and total merchantable biomass and equations for three ratios, namely, (i) the stem merchantable wood volume under bark to the total tree merchantable wood volume under bark, (ii) the total merchantable heartwood volume to the total tree merchantable wood volume under bark, and (iii) the stem merchantable heartwood to the stem merchantable wood volume under bark, of B. spiciformis and J. globiflora, the two most abundant but less used timber species in the Miombo woodlands in Mozambique.
These models demonstrated reasonable performance, as evidenced by the acceptable MAPE, MAE, and RMSE values, and their use can enhance planning by forest companies by enabling the prior selection of trees suitable for harvesting based on easily measurable variables. This approach provides economic benefits to companies while adhering to good forest management practices and increasing the volumes of biomass and carbon stored in end-user products outside forest ecosystems. The development of local models for these species is recommended, as the performance of existing models for this specific site and species is not sufficient.

Author Contributions

A.M.: conceptualization, data collection, methodology, formal analysis, data curation, and writing (original draft preparation). R.G.: methodology, formal analysis, writing (review and editing), and supervision. E.Z.: methodology, formal analysis, writing (review and editing), and supervision. U.I.: data collection, methodology, formal analysis, and supervision. A.E.: conceptualization, data collection, methodology, formal analysis, data curation, writing—original draft preparation, writing (review and editing), and supervision. All authors have read and agreed to the published version of the manuscript.

Funding

This research was funded by the Swedish International Development Cooperation Agency (SIDA) under the program Regional Research School in Forest Sciences (REFOREST), grant number 13394 and The Swedish Research Council (Vetenskapsrådet), grant number 2019-04669.

Data Availability Statement

Data will be shared upon reasonable request (contact the corresponding author).

Acknowledgments

I would like to thank the REFOREST Programme, Sokoine University of Agriculture, Eduardo Mondlane University, Swedish University of Agricultural Sciences; the company LEVASFLOR and its collaborators; my wife, children, and family in general; and Tarquinio Magalhães, Sá Nogueira, Anelarda Vicente, and Obed Magaure. Without these individuals and their variety of contributions, this article would not have been written.

Conflicts of Interest

The authors declare that there are no conflicts of interest regarding the publication of this paper.

References

  1. Campbell, B.M.; Angelsen, A.; Cunningham, A.; Katerere, Y.; Sitoe, A.; Wunder, S. Miombo Woodlands—Opportunities and Barriers to Sustainable Forest Management; Campbell, B., Ed.; Center for International Forestry Research (CIFOR): Bogor, Indonesia, 2007. [Google Scholar]
  2. Dziba, L.; Ramoelo, A.; Ryan, C.; Harrison, S.; Pritchard, R.; Tripathi, H.; Sitas, N.; Selomane, O.; Engelbrecht, F.; Pereira, L.; et al. Scenarios for Just and Sustainable Futures in the Miombo Woodlands. In Miombo Woodlands in a Changing Environment: Securing the Resilience and Sustainability of People and Woodlands; Ribeiro, N., Katerere, Y., Chirwa, P.W., Grundy, I.M., Eds.; Springer Nature: Cham, Switzerland, 2020; pp. 191–234. [Google Scholar]
  3. Chiteculo, V.; Surovy, P. Dynamic Patterns of Trees Species in Miombo Forest and Management Perspectives for Sustainable Production—Case Study in Huambo Province, Angola. Forests 2018, 9, 321. [Google Scholar] [CrossRef]
  4. Gumbo, D.J.; Dumas-Johansen, M.; Muir, G.; Boerstler, F.; Xia, Z. Sustainable Management of Miombo Woodlands. Food Security, Nutrition, and Wood Energy; Food and Agriculture Organization of the United Nations (FAO): Rome, Italy, 2018; ISBN 9789251304235. [Google Scholar]
  5. Magalhães, T. Inventário Florestal Nacional; Ministério da Terra, Ambiente e Desenvolvimento Rural: Maputo, Mozambique, 2018. [Google Scholar]
  6. MITADER. Desflorestamento em Moçambique (2003–2016); Direção Nacional de Florestas: Maputo, Mozambique, 2018. [Google Scholar]
  7. Aquino, A.; Lim, C.; Kaechele, K.; Taquidir, M. Mozambique Country Forestry Note; World Bank: Washington, DC, USA, 2018; pp. 1–33. [Google Scholar] [CrossRef]
  8. Magalhães, T.M. What is left in miombo woodlands? Rarity and commonness of woody species, commercial timber species, and lawful harvestable diameter classes. Heliyon 2025, 11, e41821. [Google Scholar] [CrossRef] [PubMed]
  9. Bila, N.F.; Trianoski, R.; Iwakiri, S.; Bila, N.F.; Manhiça, A.A.; Rocha, M.P.D. Bonding Quality of Two Lesser-Used Wood Species Brachystegia spiciformis and Julbernardia globiflora from Mozambique. Maderas. Cienc. y Tecnol. 2021, 23, 1–12. [Google Scholar] [CrossRef]
  10. DINAF. Relatorio Anual 2023; Brazilian Development Bank: Rio de Janeiro, Brazil, 2023. [Google Scholar]
  11. Bila, N.F.; Trianoski, R.; Da Rocha, M.P.; Da Silva, J.R.M.; Iwakiri, S.; Egas, A.F.; Mussana, A.F. Machining Operations on Messassa Wood. Wood Res. J. 2020, 11, 12–19. [Google Scholar] [CrossRef]
  12. De Lima, R.B.; Rutishauser, E.; Da Silva, J.A.A.; Guedes, M.C.; Herault, B.; De Oliveira, C.P.; Da Silva Aparício, P.; Sotta, E.D.; Da Silva, D.A.S.; Ferreira, R.L.C. Accurate Estimation of Commercial Volume in Tropical Forests. For. Sci. 2020, 67, 14–21. [Google Scholar] [CrossRef]
  13. Kachamba, D.J.; Eid, T. Total tree, merchantable stem and branch volume models for miombo woodlands of Malawi Total tree, merchantable stem and branch volume models for miombo. South. For. 2016, 78, 41–51. [Google Scholar] [CrossRef]
  14. Romero, F.M.B.; Jacovine, L.A.G.; Ribeiro, S.C.; Torres, C.M.M.E.; da Silva, L.F.; Gaspar, R.d.O.; da Rocha, S.J.S.S.; Staudhammer, C.L.; Fearnside, P.M. Allometric equations for volume, biomass, and carbon in commercial stems harvested in a managed forest in the southwestern amazon: A case study. Forests 2020, 11, 874. [Google Scholar] [CrossRef]
  15. Miranda, D.L.C.; Loch, V.M.; Silva, F.; dos Santos Lisboa, G.; de Goes Canalez, G.; Condé, T.M.; Castelo, P.A.R. Porcentagem de cerne, alburno e casca de cinco espécies madeireiras da Amazônia. Nativa 2017, 5, 619–627. [Google Scholar] [CrossRef]
  16. Bor, N.C.; Muchiri, M.N.; Kigomo, J.N.; Hyvönen, P.; Muga, M.; Nduati, P.N.; Haakana, H.; Owuor, N.O. Compartmentalized Allometric Equation for Estimating Volume and Biomass of Eucalyptus in Agroforestry Systems in Kenya. East African J. For. Agrofor. 2021. Special Issue 1–9. Available online: https://www.kefri.org/assets/publications/articles/Compartmentalized%20Allometric%20Equation%20for%20estimating%20volume%20and%20biomass%20of%20eucalyptus%20in%20agroforestry%20systems%20in%20Kenya.pdf (accessed on 31 March 2025).
  17. Ver Planck, N.R.; MacFarlane, D.W. Modelling vertical allocation of tree stem and branch volume for hardwoods. Forestry 2014, 87, 459–469. [Google Scholar] [CrossRef]
  18. Steel, E.A. Carbon Storage and Climate Change Mitigation Potential of Harvested Wood Products; The Food and Agriculture Organization of the United Nations (FAO): Roma, Italy, 2021. [Google Scholar]
  19. Johnston, C.M.T.; Radeloff, V.C. Global mitigation potential of carbon stored in harvested wood products. Proc. Natl. Acad. Sci. USA 2019, 116, 14526–14531. [Google Scholar] [CrossRef]
  20. Zhang, L.; Sun, Y.; Song, T.; Xu, J. Harvested wood products as a carbon sink in China, 1900–2016. Int. J. Environ. Res. Public Health 2019, 16, 445. [Google Scholar] [CrossRef] [PubMed]
  21. Jasinevičius, G.; Lindner, M.; Pingoud, K.; Tykkylainen, M. Review of models for carbon accounting in harvested wood products. Int. Wood Prod. J. 2015, 6, 198–212. [Google Scholar] [CrossRef]
  22. Tadese, S.; Soromessa, T.; Aneseyee, A.B.; Gebeyehu, G.; Noszczyk, T.; Kindu, M. Carbon Storage Dynamics and its Economic Values in Tropical Moist Afromontane Forests, South-West. Res. Sq. 2023, 1–41. [Google Scholar]
  23. Parobek, J.; Paluš, H.; Moravčík, M.; Kovalčík, M.; Dzian, M.; Murgaš, V.; Šimo-Svrček, S. Changes in carbon balance of harvested wood products resulting from different wood utilization scenarios. Forests 2019, 10, 590. [Google Scholar] [CrossRef]
  24. Tupenaite, L.; Kanapeckiene, L.; Naimaviciene, J.; Kaklauskas, A.; Gecys, T. Timber Construction as a Solution to Climate Change: A Systematic Literature Review. Buildings 2023, 13, 976. [Google Scholar] [CrossRef]
  25. Guedes, B.S.; Sitoe, A.A.; Olsson, B.A. Allometric models for managing lowland miombo woodlands of the Beira corridor in Mozambique. Glob. Ecol. Conserv. 2018, 13, e00374. [Google Scholar] [CrossRef]
  26. Mugasha, W.A.; Mwakalukwa, E.E.; Luoga, E.; Malimbwi, R.E.; Zahabu, E.; Silayo, D.S.; Sola, G.; Crete, P.; Henry, M.; Kashindye, A. Allometric Models for Estimating Tree Volume and Aboveground Biomass in Lowland Forests of Tanzania. Int. J. For. Res. 2016, 2016, 8076271. [Google Scholar] [CrossRef]
  27. Mate, R.; Johansson, T.; Sitoe, A. Biomass equations for tropical forest tree species in mozambique. Forests 2014, 5, 535–556. [Google Scholar] [CrossRef]
  28. Mauya, E.W.; Mugasha, W.A.; Zahabu, E.; Bollandsås, O.M.; Tron, E. Models for estimation of tree volume in the miombo woodlands of Tanzania. South. For. 2014, 76, 209–219. [Google Scholar] [CrossRef]
  29. Falcão, M.P. Plano de Maneio Revisto 2017–2022 Levasflor; Administração Nacional das Áreas de Conservação: Maputo, Mozambique, 2017.
  30. Ministério da Administração Estatal. Perfil do Distrito do Nhamatanda Prov Í Ncia de Sofala Edi ç ão 2005; Ministério da Administração Estatal: Maputo, Mozambique, 2005.
  31. Ulak, S.; Ghimire, K.; Gautam, R.; Bhandari, S.K.; Poudel, K.P.; Timilsina, Y.P.; Pradhan, D.; Subedi, T. Predicting the upper stem diameters and volume of a tropical dominant tree species. J. For. Res. 2022, 33, 1725–1737. [Google Scholar] [CrossRef]
  32. Koirala, A.; Montes, C.R.; Bullock, B.P.; Wagle, B.H. Developing taper equations for planted teak (Tectona grandis L.f.) trees of central lowland Nepal. Trees For. People 2021, 5, 100103. [Google Scholar] [CrossRef]
  33. Subedi, T.; Bhandari, S.K.; Pandey, N.; Timilsina, Y.P.; Mahatara, D. Form factor and volume equations for individual trees of Shorea robusta in Western low land of Nepal. Austrian J. For. Sci. 2021, 138, 143–166. [Google Scholar]
  34. Kozak, A. Methods for Ensuring Additivity of Biomass Components by Regression Analysis. For. Chron. 1970, 46, 402–405. [Google Scholar] [CrossRef]
  35. van Laar, A.; Akça, A. Forest Mensuration—Managing Forest Ecosystems; von Gadow, K., Pukkala, T., Tomé, M., Eds.; Springer: Dordrecht, The Netherlands, 2007; Volume 13, ISBN 9781402059902. [Google Scholar]
  36. Kershaw, J.J.A.; Ucey, M.J.; Beers, T.W.; Husch, B. Forest Mensuration, 5th ed.; John Wiley & Sons: West Sussex, UK, 2017; ISBN 9781118902035. [Google Scholar]
  37. ISO 13061-2:2014; Physical and Mechanical Properties of Wood—Test Methods for Small Clear Wood Specimens—Part 2: Determination of Density for Physical and Mechanical Tests. International Organization for Standardization: Geneva, Switzerland, 2014.
  38. Picard, N.; Saint-André, L.; Henry, M. Manual for Building Tree Volume and Biomass Allometric Equations: From Field Measurement to Prediction; Food and Agricultural Organization of the United Nations: Rome, Italy; Centre de Coopération Internationale en Recherche Agronomique pour le Développement: Montpellier, France, 2012.
  39. Dutcă, I.; McRoberts, R.E.; Næsset, E.; Blujdea, V.N.B. Accommodating heteroscedasticity in allometric biomass models. For. Ecol. Manag. 2021, 505, 119865. [Google Scholar] [CrossRef]
  40. Mascaro, J.; Litton, C.M.; Hughes, R.F.; Uowolo, A.; Schnitzer, S.A. Minimizing Bias in Biomass Allometry: Model Selection and Log-Transformation of Data. Biotropica 2011, 43, 649–653. [Google Scholar] [CrossRef]
  41. Li, W.; Cook, D.; Tanaka, E.; VanderPlas, S. A Plot is Worth a Thousand Tests: Assessing Residual Diagnostics with the Lineup Protocol. J. Comput. Graph. Stat. 2024, 33, 1497–1511. [Google Scholar] [CrossRef]
  42. Halunga, A.G.; Orme, C.D.; Yamagata, T. A heteroskedasticity robust Breusch–Pagan test for Contemporaneous correlation in dynamic panel data models. J. Econom. 2017, 198, 209–230. [Google Scholar] [CrossRef]
  43. Waldman, D.M. A note on algebraic equivalence of White’s test and a variation of the Godfrey/Breusch-Pagan test for heteroscedasticity. Econ. Lett. 1983, 13, 197–200. [Google Scholar] [CrossRef]
  44. Bruce, P.; Bruce, A. Practical Statistics for Data Scientists 50 Essential Concepts; Shannon, C., Ed.; O’Reilly Media: Sebastopol, CA, USA, 2017; ISBN 978-4-87311-828-4. [Google Scholar]
  45. Menin, B. Objective Model Selection in Physics: Exploring the Finite Information Quantity Approach. J. Appl. Math. Phys. 2024, 12, 1848–1889. [Google Scholar] [CrossRef]
  46. Pham, H. A new criterion for model selection. Mathematics 2019, 7, 1215. [Google Scholar] [CrossRef]
  47. Höge, M.; Wöhling, T.; Nowak, W. A Primer for Model Selection: The Decisive Role of Model Complexity. Water Resour. Res. 2018, 54, 1688–1715. [Google Scholar] [CrossRef]
  48. Chai, T.; Draxler, R.R. Root mean square error (RMSE) or mean absolute error (MAE)?-Arguments against avoiding RMSE in the literature. Geosci. Model Dev. 2014, 7, 1247–1250. [Google Scholar] [CrossRef]
  49. Hyndman, R.J. Another Look at Forecast Accuracy Metrics for Intermittent Demand. Foresight Int. J. Appl. Forecast. 2006, 4, 43–46. [Google Scholar]
  50. Willmott, C.J.; Matsuura, K. Advantages of the mean absolute error (MAE) over the root mean square error (RMSE) in assessing average model performance. Clim. Res. 2005, 30, 79–82. [Google Scholar] [CrossRef]
  51. Magalhães, T.M.; Mate, R.S. Least squares-based biomass conversion and expansion factors best estimate biomass than ratio-based ones: Statistical evidences based on tropical timber species. MethodsX 2018, 5, 30–38. [Google Scholar] [CrossRef]
  52. Spiess, A.-N.; Neumeyer, N. An evaluation of R2 as an inadequate measure for nonlinear models in pharmacological and biochemical research: A Monte Carlo approach. BMC Pharmacol 2010, 10, 6. [Google Scholar] [CrossRef]
  53. Magalhães, T.M.; Cossa, V.N.; Guedes, B.S.; Fanheiro, A.S.M. Species-specific biomass allometric models and expansion factors for indigenous and planted forests of the Mozambique highlands. J. For. Res. 2021, 32, 1047–1065. [Google Scholar] [CrossRef]
  54. Asigbaase, M.; Dawoe, E.; Abugre, S.; Kyereh, B.; Ayine Nsor, C. Allometric relationships between stem diameter, height and crown area of associated trees of cocoa agroforests of Ghana. Sci. Rep. 2023, 13, 14897. [Google Scholar] [CrossRef]
  55. Wirabuana, P.Y.A.P.; Setiahadi, R.; Sadono, R.; Lukito, M.; Martono, D.S.; Matatula, J. Allometric equations for estimating biomass of community forest tree species in Madiun, Indonesia. Biodiversitas 2020, 21, 4291–4300. [Google Scholar] [CrossRef]
  56. Yates, L.A.; Aandahl, Z.; Richards, S.A.; Brook, B.W. Cross validation for model selection: A review with examples from ecology. Ecol. Monogr. 2023, 93, e1533. [Google Scholar] [CrossRef]
  57. Arlot, S.; Celisse, A. A survey of cross-validation procedures for model selection. Stat. Surv. 2010, 4, 40–79. [Google Scholar] [CrossRef]
  58. Goussanou, C.A.; Guendehou, S.; Assogbadjo, A.E.; Kaire, M.; Sinsin, B.; Cuni-Sanchez, A. Specific and generic stem biomass and volume models of tree species in a West African tropical semi-deciduous forest. Silva Fenn. 2016, 50, 1474. [Google Scholar] [CrossRef]
  59. Mwaluseke, M.L.; Mwakalukwa, E.E.; Maliondo, S.M.S. Volume and aboveground biomass models for a dry evergreen montane forest in Tanzania. Asian J. For. 2023, 7, 45–53. [Google Scholar] [CrossRef]
  60. Mate, R.; Johansson, T.; Sitoe, A. Stem Volume Equations for Valuable Timber Species in Mozambique. J. Sustain. For. 2015, 34, 787–806. [Google Scholar] [CrossRef]
  61. Fernández-Sólis, D.; Berrocal, A.; Moya, R. Heartwood formation and prediction of heartwood parameters in Tectona grandis L.f. trees growing in forest plantations in Costa Rica. Bois Forets des Trop. 2018, 335, 25–37. [Google Scholar] [CrossRef]
  62. Yang, B.; Jia, H.; Zhao, Z.; Pang, S.; Cai, D. Horizontal and vertical distributions of heartwood for teak plantation. Forests 2020, 11, 225. [Google Scholar] [CrossRef]
  63. Ekoungoulou, R.; Nzala, D.; Liu, X.; Niu, S. Tree Biomass Estimation in Central African Forests Using Allometric Models. Open J. Ecol. 2018, 8, 209–237. [Google Scholar] [CrossRef]
  64. Feldpausch, T.R.; Banin, L.; Phillips, O.L.; Baker, T.R.; Lewis, S.L.; Quesada, C.A.; Affum-Baffoe, K.; Arets, E.J.M.M.; Berry, N.J.; Bird, M.; et al. Height-diameter allometry of tropical forest trees. Biogeosciences 2011, 8, 1081–1106. [Google Scholar] [CrossRef]
  65. Fortier, J.; Truax, B.; Gagnon, D.; Lambert, F. Allometric equations for estimating compartment biomass and stem volume in mature hybrid poplars: General or site-specific? Forests 2017, 8, 309. [Google Scholar] [CrossRef]
  66. Halle, F.; Oldeman, R.A.A.; Tomlinson, P.B. Tropical Trees and Forests: An Architectural Analysis; Springer: Berlin/Heidelberg, Germany; New York, NY, USA, 1978; ISBN 2013206534. [Google Scholar]
  67. Pulido-Rodríguez, E.; López-Camacho, R.; Tórres, J.; Velasco, E.; Salgado-Negret, B. Traits and trade-offs of wood anatomy between trunks and branches in tropical dry forest species. Trees-Struct. Funct. 2020, 34, 497–505. [Google Scholar] [CrossRef]
  68. Cushman, K.C.; Machado, J.L. Plasticity in branching and crown architecture helps explain how tree diversity increases tropical forest production. New Phytol. 2020, 228, 1163–1165. [Google Scholar] [CrossRef] [PubMed]
  69. Boczniewicz, D.; Mason, E.G.; Morgenroth, J.A. Developing fully compatible taper and volume equations for all stem components of Eucalyptus globoidea Blakely trees in New Zealand. N. Z. J. For. Sci. 2022, 52, 6. [Google Scholar] [CrossRef]
  70. Arisandi, R.; Marsoem, S.N.; Sutapa, J.P.G.; Lukmandaru, G. A Review of the Factors Influencing Variations in the Heartwood Proportion for Solid Wood. South-East Eur. For. 2023, 14, 245–253. [Google Scholar] [CrossRef]
  71. Igartúa, D.; Moreno, K.; Monteoliva, S. Acacia melanoxylon in Argentina: Heartwood content and its relationship with site, growth and age of the trees. For. Syst. 2017, 26, 9. [Google Scholar] [CrossRef]
  72. Kokutse, A.D.; Baillères, H.; Stokes, A.; Kokou, K. Proportion and quality of heartwood in Togolese teak (Tectona grandis L.f.). For. Ecol. Manag. 2004, 189, 37–48. [Google Scholar] [CrossRef]
  73. Ramanan, S.S.; Kunhamu, T.K.; Anoop, E.V.; George, A.K. Does stand thinning influence wood physical properties? An investigation in a tropical hardwood, Acacia mangium Willd. J. Trop. Agric. 2018, 56, 137–144. [Google Scholar]
  74. Pérez Cordero, L.D.; Kanninen, M. Heartwood, sapwood and bark content, and wood dry density of young and mature teak (Tectona grandis) trees grown in Costa Rica. Silva Fenn. 2003, 37, 45–54. [Google Scholar] [CrossRef]
  75. Tewari, V.P.; Mariswamy, K.M. Heartwood, sapwood and bark content of teak trees grown in Karnataka, India. J. For. Res. 2013, 24, 721–725. [Google Scholar] [CrossRef]
  76. Tewari, V.P.; Singh, B. Total and merchantable wood volume equations for Eucalyptus hybrid trees in Gujarat State, India. Arid L. Res. Manag. 2006, 20, 147–159. [Google Scholar] [CrossRef]
  77. Teshome, T. Compatible volume-taper equations for predicting merchantable volume to variable merchantable limits for Cupressus lusitanica, Ethiopia. SINET Ethiop. J. Sci. 2005, 28, 15–22. [Google Scholar] [CrossRef]
  78. Ali, A.; Wang, L.Q. Big-sized trees and forest functioning: Current knowledge and future perspectives. Ecol. Indic. 2021, 127, 107760. [Google Scholar] [CrossRef]
  79. Lindenmayer, D.B.; Laurance, W.F. The ecology, distribution, conservation and management of large old trees. Biol. Rev. 2017, 92, 1434–1458. [Google Scholar] [CrossRef]
  80. Sitoe, A.; Chidumayo, E.; Alberto, M. Timber and wood products. In The Dry Forests and Woodlands of Africa: Managing for Products and Services; Chidumayo, E.N., Gumbo, D.J., Eds.; Center for International Forestry Research: London, UK; Washington, DC, USA, 2010; pp. 131–153. ISBN 9781136531385. [Google Scholar]
  81. Syampungani, S.; Chirwa, P.W.; Geldenhuys, C.J.; Handavu, F.; Chishaleshale, M.; Rija, A.A.; Mbanze, A.A.; Ribeiro, N.S. Managing Miombo: Ecological and Silvicultural Options for Sustainable Socio-Economic Benefits. In Miombo Woodlands in a Changing Environment: Securing the Resilience and Sustainability of People and Woodlands; Ribeiro, N.S., Katerere, Y., Chirwa, P.W., Grundy, I.M., Eds.; Springer Nature: Cham, Switzerland, 2020; pp. 101–131. [Google Scholar]
  82. Kapinga, K.; Syampungani, S.; Kasubika, R.; Yambayamba, A.M.; Shamaoma, H. Species-specific allometric models for estimation of the above-ground carbon stock in miombo woodlands of Copperbelt Province of Zambia. For. Ecol. Manag. 2018, 417, 184–196. [Google Scholar] [CrossRef]
  83. Romero, F.M.B.; de Nazaré Oliveira Novais, T.; Jacovine, L.A.G.; Bezerra, E.B.; de Castro Lopes, R.B.; de Holanda, J.S.; Reyna, E.F.; Fearnside, P.M. Wood Basic Density in Large Trees: Impacts on Biomass Estimates in the Southwestern Brazilian Amazon. Forests 2024, 15, 734. [Google Scholar] [CrossRef]
  84. Mwakalukwa, E.E.; Meilby, H.; Treue, T. Volume and Aboveground Biomass Models for Dry Miombo Woodland in Tanzania. Int. J. For. Res. 2014, 2014, 31256. [Google Scholar] [CrossRef]
  85. Teshome, M.; Torres, C.M.M.E.; Sileshi, G.W.; de Mattos, P.P.; Braz, E.M.; Temesgen, H.; da Rocha, S.J.S.S.; Alebachew, M. Mixed-Species Allometric Equations to Quantify Stem Volume and Tree Biomass in Dry Afromontane Forest of Ethiopia. Open J. For. 2022, 12, 263–296. [Google Scholar] [CrossRef]
  86. Daba, D.E.; Soromessa, T. Allometric equations for aboveground biomass estimation of Diospyros abyssinica (Hiern) F. White tree species. Ecosyst. Health Sustain. 2019, 5, 86–97. [Google Scholar] [CrossRef]
  87. Grundy, I.M. Wood biomass estimation in dry miombo woodland in Zimbabwe. For. Ecol. Manag. 1995, 72, 109–117. [Google Scholar] [CrossRef]
  88. Lisboa, S.N.; Macôo, S.; Sitoe, A. Allometric equations and height-diameter models for estimating above-and below-ground biomass of Colophospermum mopane J. Léonard. in Mozambique. Nature 2025, 15, 3464. [Google Scholar] [CrossRef]
Figure 1. LevasFlor map.
Earth 06 00052 g001
Figure 2. Flowchart of data collection, processing, and analysis.
Earth 06 00052 g002
Figure 3. Residual scatterplots for the models developed for B. spiciformis. (A Y = b 0 × D B H b 1 ×  ε, (B Y = b 0 × D B H 2 × H b 1 × ε and C   Y = b 0 × D B H b 1 × H b 2 ×  ε. The p-value represents the result of the Breusch–Pagan test for homoscedasticity. Red dashed line: zero-residual reference.
Earth 06 00052 g003aEarth 06 00052 g003b
Figure 4. Residual scatterplots for the models developed for J. globiflora. (A Y = b 0 × D B H b 1 ×  ε, (B Y = b 0 × D B H 2 × H b 1 × ε and (C) Y = b 0 × D B H b 1 × H b 2 ×  ε. The p-value represents the result of the Breusch–Pagan test for homoscedasticity. Red dashed line: zero-residual reference.
Earth 06 00052 g004aEarth 06 00052 g004b
Figure 5. Residual scatterplots for models of B. spiciformis. (A) g ( μ ) = b 0 + b 1 D B H + ε; (B) g ( μ ) = b 0 + b 1 D B H 2 H + ε, and (C) g ( μ ) = b 0 + b 1 D B H + b 2 H + ε. The p-value represents the result of the Breusch–Pagan test for homoscedasticity. Red dashed line: zero-residual reference.
Earth 06 00052 g005
Figure 6. Residual scatterplots for models of J. globiflora. (A) g ( μ ) = b 0 + b 1 D B H + ε; (B) g ( μ ) = b 0 + b 1 D B H 2 H + ε, and (C) g ( μ ) = b 0 + b 1 D B H + b 2 H + ε. The p-value represents the result of the Breusch–Pagan test for homoscedasticity. Red dashed line: zero-residual reference.
Earth 06 00052 g006
Figure 7. Residual scatterplots for the biomass models developed for B. spiciformis. (A) Y = b 0 × D B H b 1 ×  ε, (B) Y = b 0 × D B H 2 × H b 1 × ε and (C) Y = b 0 × D B H b 1 × H b 2 ×  ε. The p-value represents the result of the Breusch–Pagan test for homoscedasticity.
Earth 06 00052 g007
Figure 8. Residual scatterplots for biomass models developed for J. globiflora. (A Y = b 0 × D B H b 1 × ε, (B) Y = b 0 × D B H 2 × H b 1 × ε and (C) Y = b 0 × D B H b 1 × H b 2 ×  ε. The p-value represents the result of the Breusch–Pagan test for homoscedasticity. Red dashed line: zero-residual reference.
Earth 06 00052 g008
Table 1. Summary and descriptive statistics of field-measured data.
Brachystegia spiciformisJulbernardia globiflora
DBH (cm)Hc (m)Ht (m)DBH (cm)Hc (m)Ht (m)
Min17.14.4612.514.54.4612.03
Max80.718.725.461.213.922.17
Mean47.0410.2619.9238.939.1718.28
SD20.623.923.4215.713.172.77
CV43.8438.2217.1840.3434.5515.15
SE3.390.650.563.280.660.58
Table 2. Categories of volumes and biomass computed in this study.
Category Wood Component Tree Part Analyzed Volume and Biomass Categories
Total woodHeartwood
plus
sapwood
Stem
plus
branches
Total tree merchantable wood volume under bark (stem merchantable wood volume under bark plus branch merchantable wood volume under bark) (stem or branches from 15cm diameter over bark)
Total tree merchantable biomass under bark (biomass of stem merchantable wood volume under bark plus biomass of branches merchantable wood volume under bark) (stem or branches from 15 cm diameter over bark)
ComponentsHeartwood
and
sapwood
Merchantable stemStem merchantable wood volume under bark (stem from 15 cm diameter over bark)
Merchantable branchesBranches merchantable wood volume under bark (branches from 15 cm top diameter over bark)
HeartwoodStem
plus
branches
Total merchantable heartwood volume (stem merchantable heartwood plus branch merchantable heartwood)
Merchantable stemStem merchantable heartwood (stems from 15 cm diameter over bark)
Merchantable branchesBranches merchantable heartwood (branches from 15 cm diameter over bark)
Table 3. Candidate allometric models for merchantable volume and biomass.
ModelPower ModelsModelRatio Models
1 Y = b 0 × D B H b 1 ×  ε4 g μ = b 0 + b 1 × D B H +  ε
2 Y = b 0 × D B H 2 × H t b 1  × ε5 g ( μ ) = b 0 + b 1 × D B H 2 H t +  ε
3 Y = b 0 × D B H b 1 × H t b 2 ×  ε6 g ( μ ) = b 0 + b 1 × D B H + b 2 × H t +  ε
where DBH: diameter at breast height (cm); Ht: total height (m); b0, b1, and b2: regression coefficients; µ: the mean of link function  g μ = l o g μ 1 μ ; ε: random error.
Table 4. Statistical performance of merchantable volume models for B. spiciformis.
IDModelsAICBICRMSEMAEMAPE (%)
Total tree merchantable wood volume under bark
1Y = 1.67 × 10⁻⁴ × DBH2.319 −33.017−21.7410.2000.12810.631
2Y = 2.59 × 10⁻⁵ × (DBH2 × Ht)1.008 −57.394−46.1170.1920.1157.411
3Y = 2.42 × 10⁻⁵ × DBHb2.002 × Ht1.047 −49.439−31.7190.1940.1167.365
Stem merchantable wood volume under bark
1Y = 2.03 × 10⁻⁴ × DBH2.181 −51.701−40.4250.1550.10911.680
2Y = 3.32 × 10⁻⁵ × (DBH2 × Ht)0.953 −72.116−60.8400.1420.0838.111
3Y = 2.75 × 10⁻⁵ × DBH1.873 × Ht1.058 −64.373−46.6530.1430.0848.077
Branch merchantable wood volume under bark
1Y = 1.17 × 10⁻⁵ × DBH2.682 −123.212−111.9350.0780.05112.187
2Y = 1.58 × 10⁻⁶ × (DBH2 × Ht)1.150 −145.192−133.9150.0910.0488.832
3Y = 1.78 × 10⁻⁶ × DBH2.327 × Ht5.130 −137.316−119.5960.0890.0478.895
Total merchantable heartwood volume
1Y = 7.99 × 10⁻⁷ × DBH3.500 −98.802−87.5250.1350.07511.649
2Y = 4.36 × 10⁻⁸ × (DBH2 × Ht)1.528 −117.166−105.8900.1180.0709.408
3Y = 1.13 × 10⁻⁷ × DBH3.198 × Ht1.035 −115.792−98.0710.1010.0619.080
Stem merchantable heartwood
1Y = 9.39 × 10⁻⁷ × DBH3.391 −112.714−101.4380.1130.06812.657
2Y = 5.78 × 10⁻⁸ × (DBH2 × Ht)1.478 −130.199−118.9230.1140.0639.380
3Y = 1.29 × 10⁻⁷ × DBH3.081 × Ht1.053 −126.200−108.4800.1030.0579.529
Branch merchantable heartwood
1Y = 2.83 × 10⁻⁸ × DBH43.977 −184.658−173.3820.0820.04518.862
2Y = 1.12 × 10⁻⁹ × (DBH2 × Ht)1.729 −191.102−179.8260.0670.03816.989
3Y = 3.65 × 10⁻⁹ × DBH3.649 × Ht1.099 −185.938−168.2180.0690.04016.820
Akaike’s Information Criterion (AIC), Bayesian Information Criterion (BIC), Mean Absolute Error (MAE), Mean Absolute Percentage Error (MAPE), Root Mean Squared Error (RMSE), diameter at breast height (DBH), and total height (Ht).
Table 5. Statistical performance of merchantable volume models for J. globiflora.
IDModelsAICBICRMSEMAEMAPE (%)
Total tree merchantable wood volume under bark
1Y = 6.53 × 10⁻⁵ × DBH2.737 −2.5885.3600.3420.20413.502
2Y = 6.98 × 10⁻⁶ × (DBH2 × Ht)1.196 −16.500−8.5520.2300.16010.474
3Y = 3.55 × 10⁻⁶ × DBH2.286 × Ht1.559 −9.5602.9310.2190.15610.135
Stem merchantable wood volume under bark
1Y = 7.05 × 10⁻⁵ × DBH2.627 −10.365−2.4170.2770.16915.070
2Y = 8.34 × 10⁻⁶ × (DBH2 × Ht)1.1470−20.879−12.9310.2040.15312.802
3Y = 3.02 × 10⁻⁶ × DBH2.134 × Ht1.694 −14.382−1.8920.1910.14512.193
Branch merchantable wood volume under bark
1Y = 5.41 × 10⁻⁶ × DBH3.064 −50.336−42.3870.1290.08918.202
2Y = 4.72 × 10⁻⁷ × (DBH2 × Ht)1.333 −56.293−48.3440.1120.07515.003
3Y = 3.73 × 10⁻⁷ × DBH2.624 × Ht1.464 −48.346−35.8550.1120.07514.908
Total merchantable heartwood volume
1Y = 1.86 × 10⁻¹¹ × DBH6.337 −89.882−81.9340.3910.19819.621
2Y = 1.28 × 10⁻¹³ × (DBH2 × Ht)2.748 −120.782−112.8340.3500.17311.342
3Y = 2.67 × 10⁻¹³ × DBH5.639 × Ht2.325 −116.228−103.7370.3430.17611.359
Stem merchantable heartwood
1Y = 1.88 × 10⁻¹¹ × DBH6.261 −100.158−92.2100.2840.14921.231
2Y = 1.29 × 10⁻¹³ × (DBH2 × Ht)2.722 −126.579−118.6300.2630.13112.303
3Y = 1.38 × 10⁻¹³ × DBH5.457 × Ht2.682 −118.595−106.1050.2630.13112.354
Branch merchantable heartwood
1Y = 1.88 × 10⁻¹² × DBH6.568 −147.223−139.2750.1160.05120.823
2Y = 1.09 × 10⁻¹⁴ × (DBH2 × Ht)2.847 −153.325−145.3760.0990.04717.715
3Y = 5.17 × 10⁻¹⁴ × DBH5.950 × Ht1.999 −146.343−133.8530.0980.04817.835
Akaike’s Information Criterion (AIC), Bayesian Information Criterion (BIC), Mean Absolute Error (MAE), Mean Absolute Percentage Error (MAPE), Root Mean Squared Error (RMSE), diameter at breast height (DBH), and total height (Ht).
Table 6. Statistical performance of the selected models for ratios of B. spiciformis.
IDModelAICBICRMSEMAEMAPE (%)
Ratio of stem merchantable wood volume under bark vs. total tree merchantable wood volume under bark
4Y = 1.533 − 0.012 × DBH−187.216−182.3830.0180.0152.128
5Y = 1.261 − 4.9 × 10⁻⁶ × (DBH2 × Ht)−183.582−178.7490.0190.0152.129
6Y = 1.656 − 0.011 × DBH − 0.009 × Ht−184.099−174.4330.0180.0142.029
Ratio of total merchantable heartwood volume vs. total tree merchantable wood volume under bark
4Y = −2.452 + 0.037 × DBH−120.798−115.9650.0450.03613.392
5Y = −1.543 + 1.52 × 10⁻⁵ (DBH2Ht)−99.164−94.3310.0580.04819.468
6Y = −2.834 + 0.034 × DBH + 0.027 × Ht−117.079−107.4130.0430.03412.733
Ratio of stem merchantable heartwood vs. stem merchantable wood volume under bark
4Y = −2.893 + 0.063 × DBH−84.558−79.7260.0730.05914.469
5Y = −1.498 + 2.82 × 10⁻⁵ × (DBH2Ht)−93.142−88.3090.0660.05315.298
6Y = −2.679 + 0.058 × DBH − 0.003 × Ht−88.089−78.4240.0720.06014.290
Akaike’s Information Criterion (AIC), Bayesian Information Criterion (BIC), Mean Absolute Error (MAE), Mean Absolute Percentage Error (MAPE), Root Mean Squared Error (RMSE), diameter at breast height (DBH), and total height (Ht).
Table 7. Statistical performance of the selected models for ratios of J. globiflora.
ID AICBICRMSEMAEMAPE (%)
Ratio of stem merchantable wood volume under bark to total tree merchantable wood volume under bark
4Y = 1.497 − 0.013 × DBH−74.966−71.5600.0420.0344.708
5Y = 1.250 − 7.14 × 10⁻⁶ × (DBH2 × Ht)−72.716−69.3100.0440.0354.857
6Y = 1.146 − 0.016 × DBH + 0.005 × Ht−74.667−67.8540.0430.0344.825
Ratio of total merchantable heartwood volume to total tree merchantable wood volume under bark
4Y = −5.892 + 0.098 × DBH−97.364−93.9570.0480.03043.407
5Y = −3.728 + 5.18 × 10⁻⁵ (DBH2Ht)−82.850−79.4440.0580.040104.198
6Y = −8.505 + 0.094 × DBH + 0.145 × Ht−106.714−99.9010.0560.03421.837
Ratio of stem merchantable heartwood to stem merchantable wood volume under bark
4Y = −6.061 + 0.166 × DBH−71.651−68.2440.0710.04639.758
5Y = −3.564 + 6.40 × 10⁻⁵ × (DBH2Ht)−69.126−65.7200.0730.05492.633
6Y = −8.566 + 0.110 × DBH − 0.140 × Ht−93.239−86.4260.0760.04920.017
Akaike’s Information Criterion (AIC), Bayesian Information Criterion (BIC), Mean Absolute Error (MAE), Mean Absolute Percentage Error (MAPE), Root Mean Squared Error (RMSE), diameter at breast height (DBH), and total height (Ht).
Table 8. Statistical performance of biomass models for B. spiciformis.
IDModelsAICBICRMSEMAEMAPE (%)
Total tree merchantable biomass of the total merchantable wood under bark
1Y = 8.83 × 10⁻⁵ × DBH2.343−74.835−63.5580.1110.07110.657
2Y = 1.35 × 10⁻⁵ × (DBH2 × Ht)1.017−98.324−87.0480.1120.0697.682
3Y = 1.33 × 10⁻⁵ × DBH2.030 × Ht1.028−90.328−72.6080.1120.0697.670
Akaike’s Information Criterion (AIC), Bayesian Information Criterion (BIC), Mean Absolute Error (MAE), Mean Absolute Percentage Error (MAPE), Root Mean Squared Error (RMSE), diameter at breast height (DBH), and total height (Ht).
Table 9. Statistical performance of biomass models for J. globiflora.
IDModelsAICBICRMSEMAEMAPE (%)
Total tree merchantable biomass of the total merchantable wood under bark
1Y = 4.10 × 10⁻⁵ × DBH2.763−20.095−12.1470.2370.13813.250
2Y = 4.29 × 10⁻⁶ × (DBH2 × Ht)1.207−34.244−26.2950.2370.11010.298
3Y = 2.26 × 10⁻⁶ × DBH2.314 × Ht1.551−27.216−14.7260.1510.1089.995
Akaike’s Information Criterion (AIC), Bayesian Information Criterion (BIC), Mean Absolute Error (MAE), Mean Absolute Percentage Error (MAPE), Root Mean Squared Error (RMSE), diameter at breast height (DBH), and total height (Ht).
Table 10. Mean MAPE values from cross-validation for volume parameters 1.
Species Parameter TWuBSWuBBWuBTHwVSHwVBHwV
B. spiciformisMAPE (%)7.808.559.319.889.9618.03
J. globifloraMAPE (%)11.6613.9616.3313.0914.1519.84
1 Total merchantable wood volume under bark (TWuB), stem merchantable wood volume under bark (SWuB), branch merchantable wood volume under bark (BWuB), total merchantable heartwood volume (THwV), stem merchantable heartwood (SHwV), branch merchantable heartwood (BHwV), and Mean Absolute Percentage Error (MAPE).
Table 11. Mean MAPE values from cross-validation for ratio parameters 1.
Species Parameter Ratio SWUB vs. TWUBRatio THWV vs. TWUBRatio SMHW vs. SWUB
B. spiciformisMAPE (%)2.2314.1216.05
J. globifloraMAPE (%)4.9325.8423.01
1 Ratio of stem merchantable wood volume under bark vs. total tree merchantable wood volume under bark (ratio SWuB vs. TWuB), ratio of total merchantable heartwood volume vs. total tree merchantable wood volume under bark (ratio THwV vs. TWuB), ratio of stem merchantable heartwood vs. stem merchantable wood volume under bark (ratio SHwV vs. SWuB), Mean Absolute Percentage Error (MAPE).
Table 12. Mean MAPE values from cross-validation for biomass.
Species Parameter Biomass
B. spiciformisMAPE (%)8.03
J. globifloraMAPE (%)11.66
Mean Absolute Percentage Error (MAPE).
Table 13. MAPE of the models developed in the present study and in previous studies using volume data from the current study.
References ModelsMAPE (%)
TWuBSWuBBWuBTHwV
Present study B. spiciformis (data set used)7899
Present study J. globiflora81155108159
[58] Holoptelea grandis46---
[58] Cynometra megalophylla29---
[59]Mixed species86---
[26] Mixed species8253205-
[60] Pterocarpus angolensis-217--
[60] Afzelia quanzensis-76--
[13]Mixed species-6498-
[28]Mixed species--334-
[61] Tectona grandis---61
[62]Tectona grandis---100
Total tree merchantable wood volume under bark (TWuB); stem merchantable wood volume under bark (SWuB), branch merchantable wood volume under bark (BWuB), total tree merchantable heartwood (THwV), and Mean Absolute Percentage Error (MAPE).
Table 14. MAPE of models developed in the present study and in previous studies using biomass data from the current study.
ReferencesModelsMAPE (%)
Biomass
Present studyB. spiciformis (data set used)8
Present studyJ. globiflora166
[53]B. spiciformis25
[27]Pterocarpus angolensis29
[27]Afzelia quanzensis128
Mixed species89
Mean Absolute Percentage Error (MAPE).
Disclaimer/Publisher’s Note: The statements, opinions and data contained in all publications are solely those of the individual author(s) and contributor(s) and not of MDPI and/or the editor(s). MDPI and/or the editor(s) disclaim responsibility for any injury to people or property resulting from any ideas, methods, instructions or products referred to in the content.

