

Physical–Statistical Characterization of PM10 and PM2.5 Concentrations and Atmospheric Transport Events in the Azores During 2024


Abstract
1. Introduction
2. Data Collection, Methods, and Processing
2.1. Study Area and Dataset
2.2. Descriptive Statistics for Pollutant Concentration
2.3. Performance Indicator: Coefficient of Determination
2.4. Probability Distributions
2.5. Exceedances: PM2.5, PM10, SO2, and O3 Overview
3. Results
3.1. Descriptive Statistics and Variability
3.1.1. Summary of Data and Missing Values
3.1.2. Dispersion
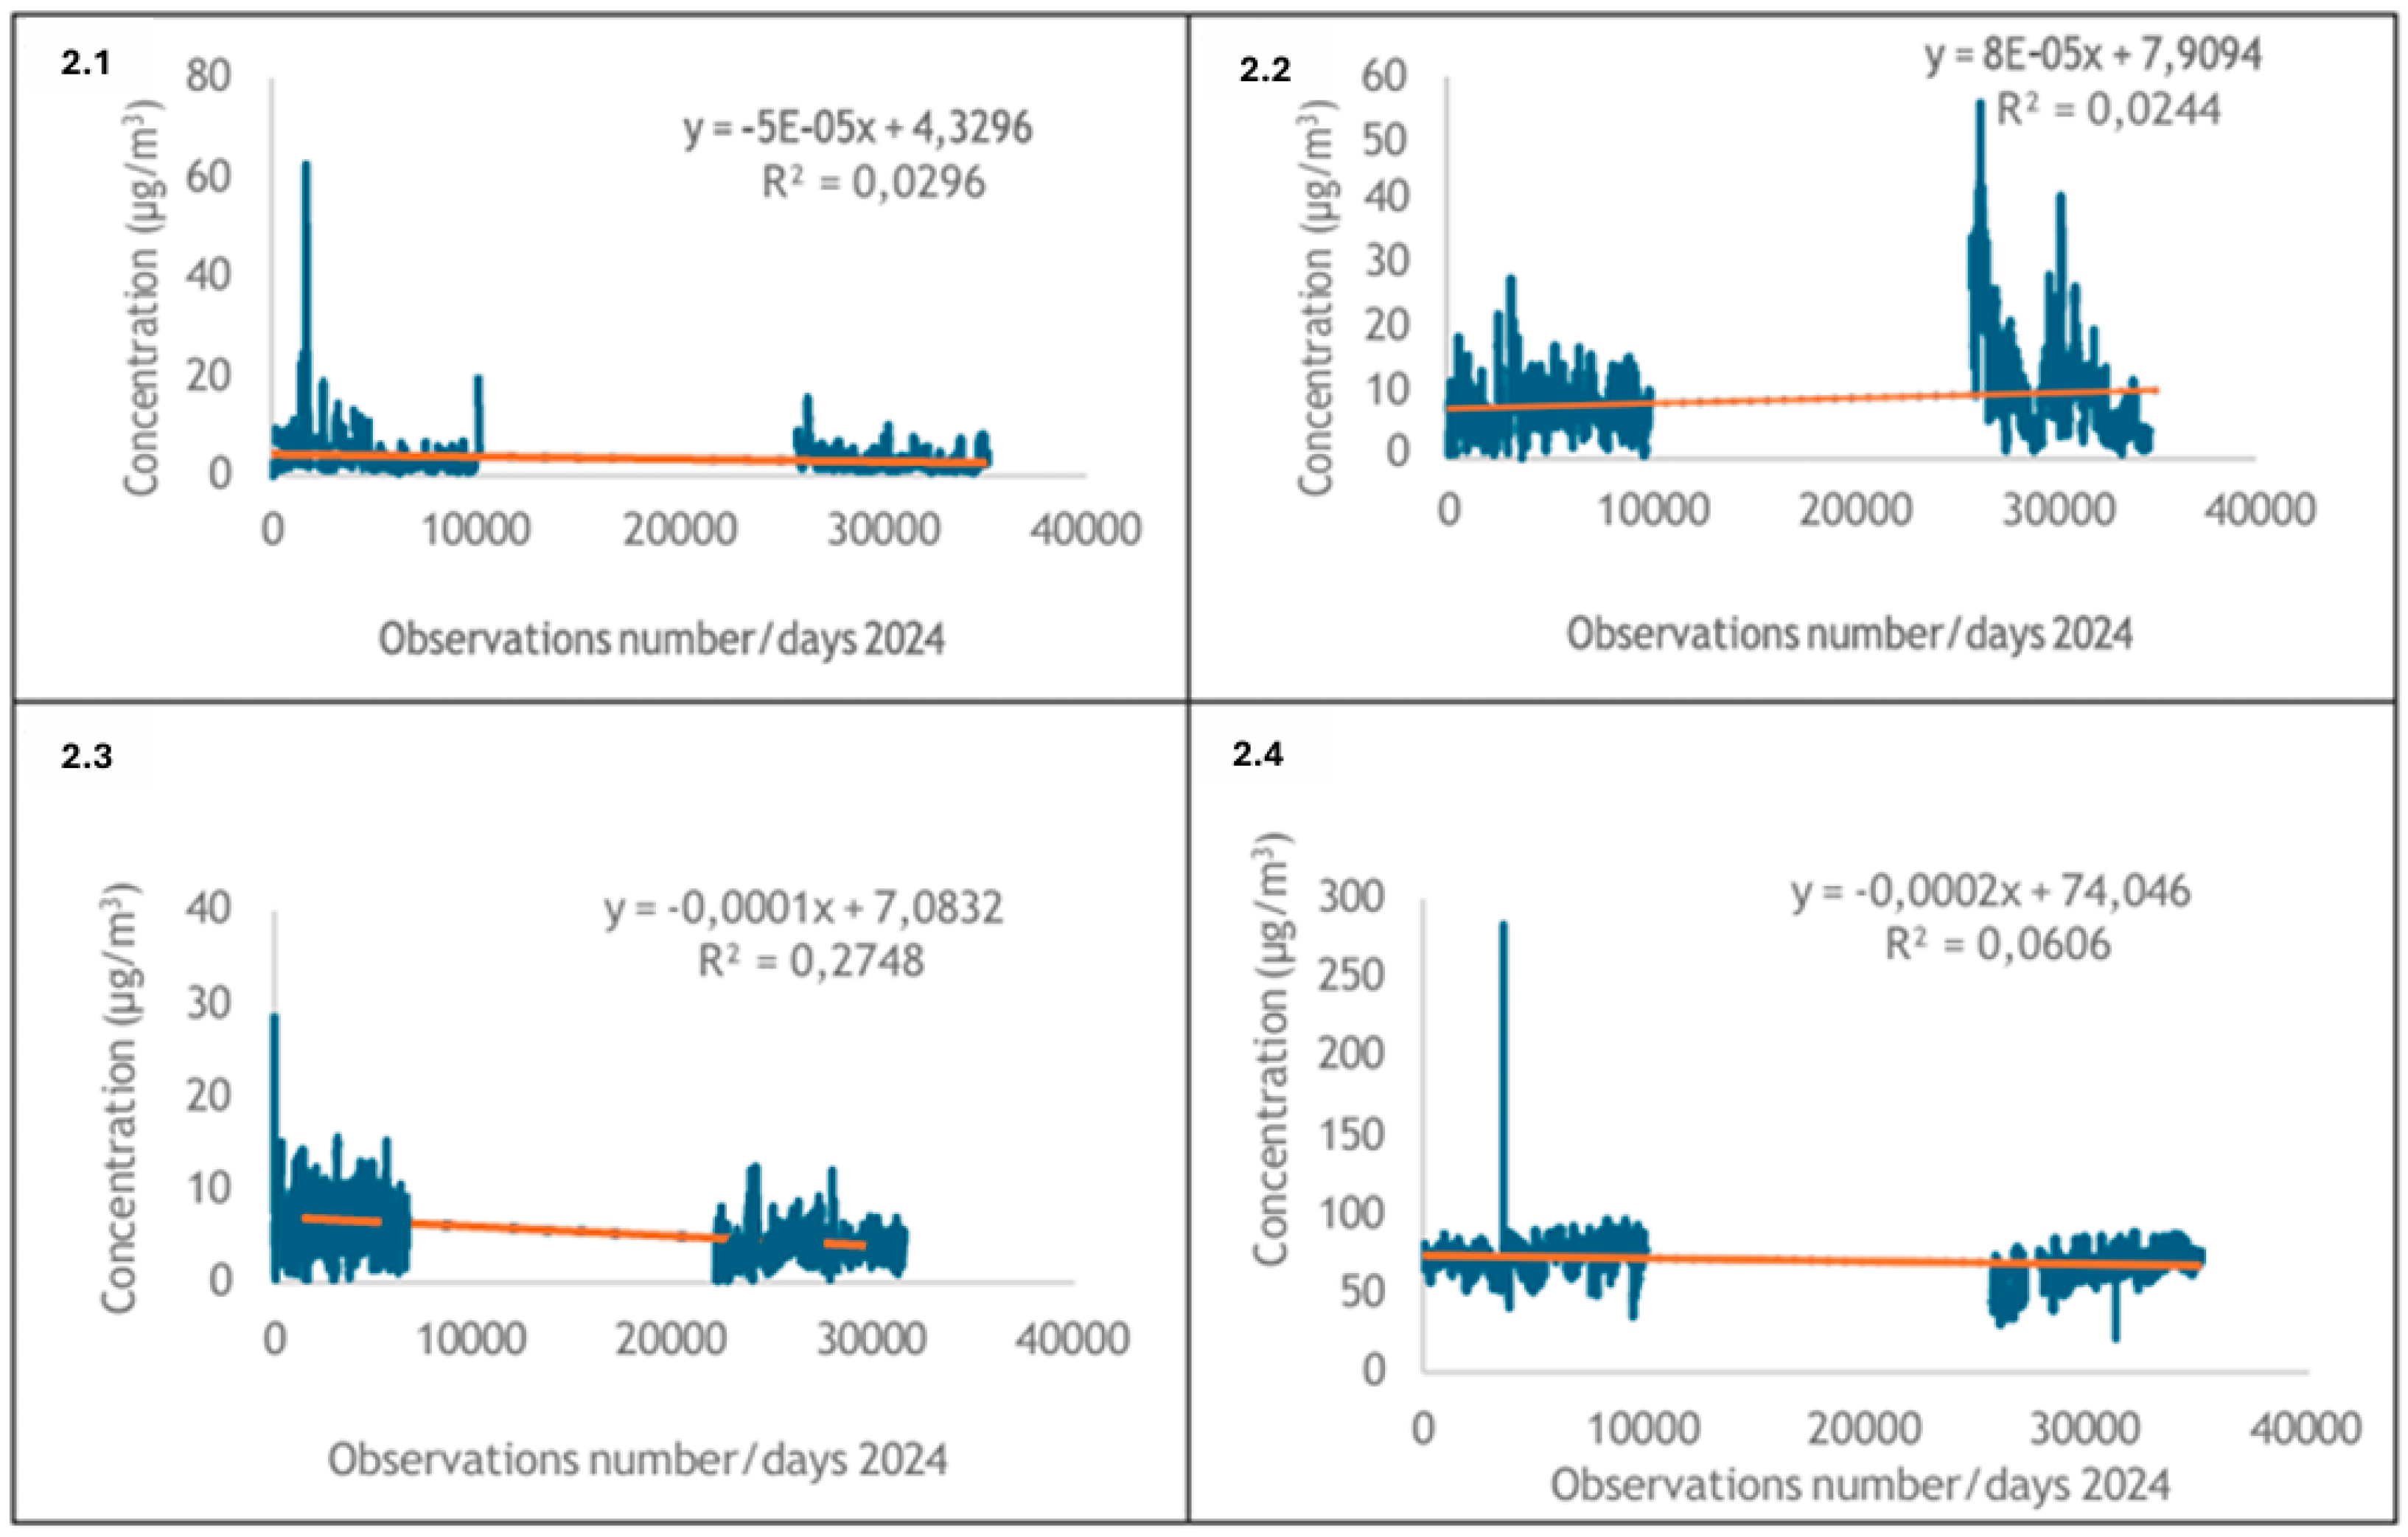
3.1.3. Linear Trends and Coefficients of Determination
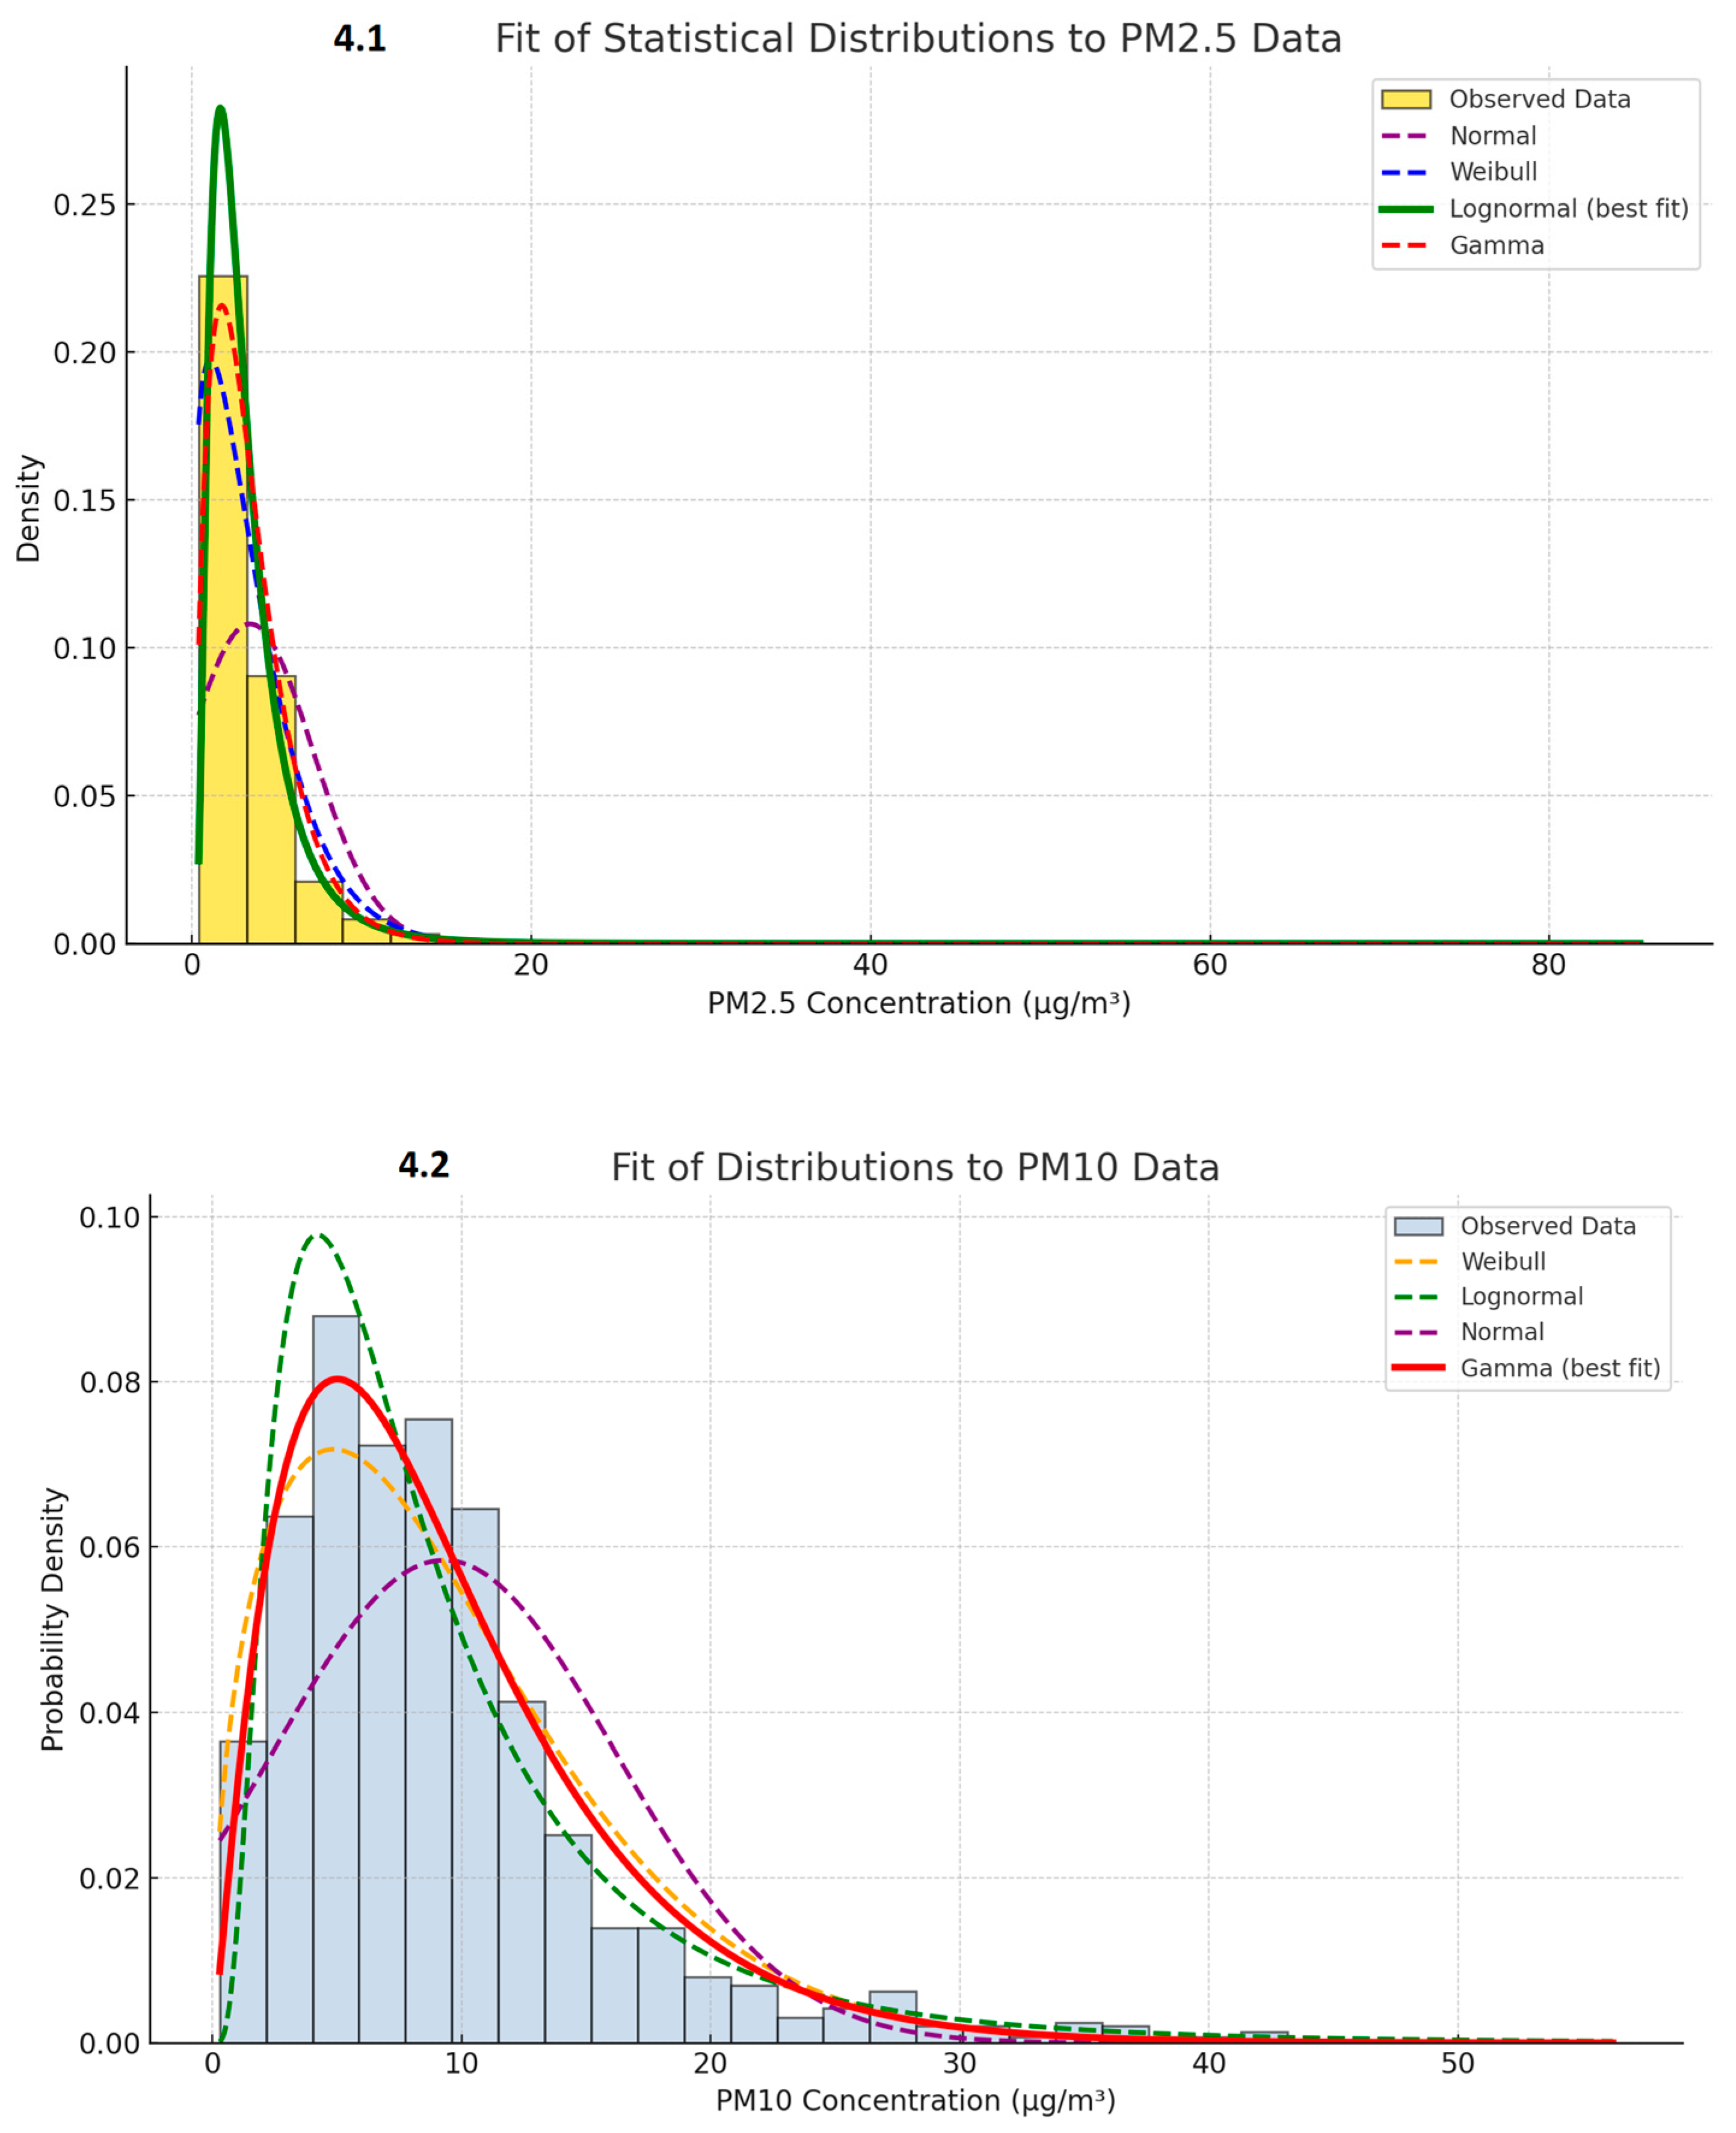
3.2. Probability Distributions Modeling
3.2.1. Fitting PM2.5 and PM10 Distributions
- -
- Normal Distribution:
- μ is the mean;
- σ is the standard deviation;
- is the random variable.
- -
- Lognormal Distribution:
- μ is the mean of the natural logarithm of x;
- σ is the standard deviation of the natural logarithm of x.
- -
- Weibull Distribution:
- c > 0 is the shape parameter;
- λ > 0 is the scale parameter.
- -
- Gamma Distribution:
- is the shape parameter;
- is the scale parameter;
- is the Gamma function.
3.2.2. Goodness-of-Fit Criteria (KS, AIC, BIC)
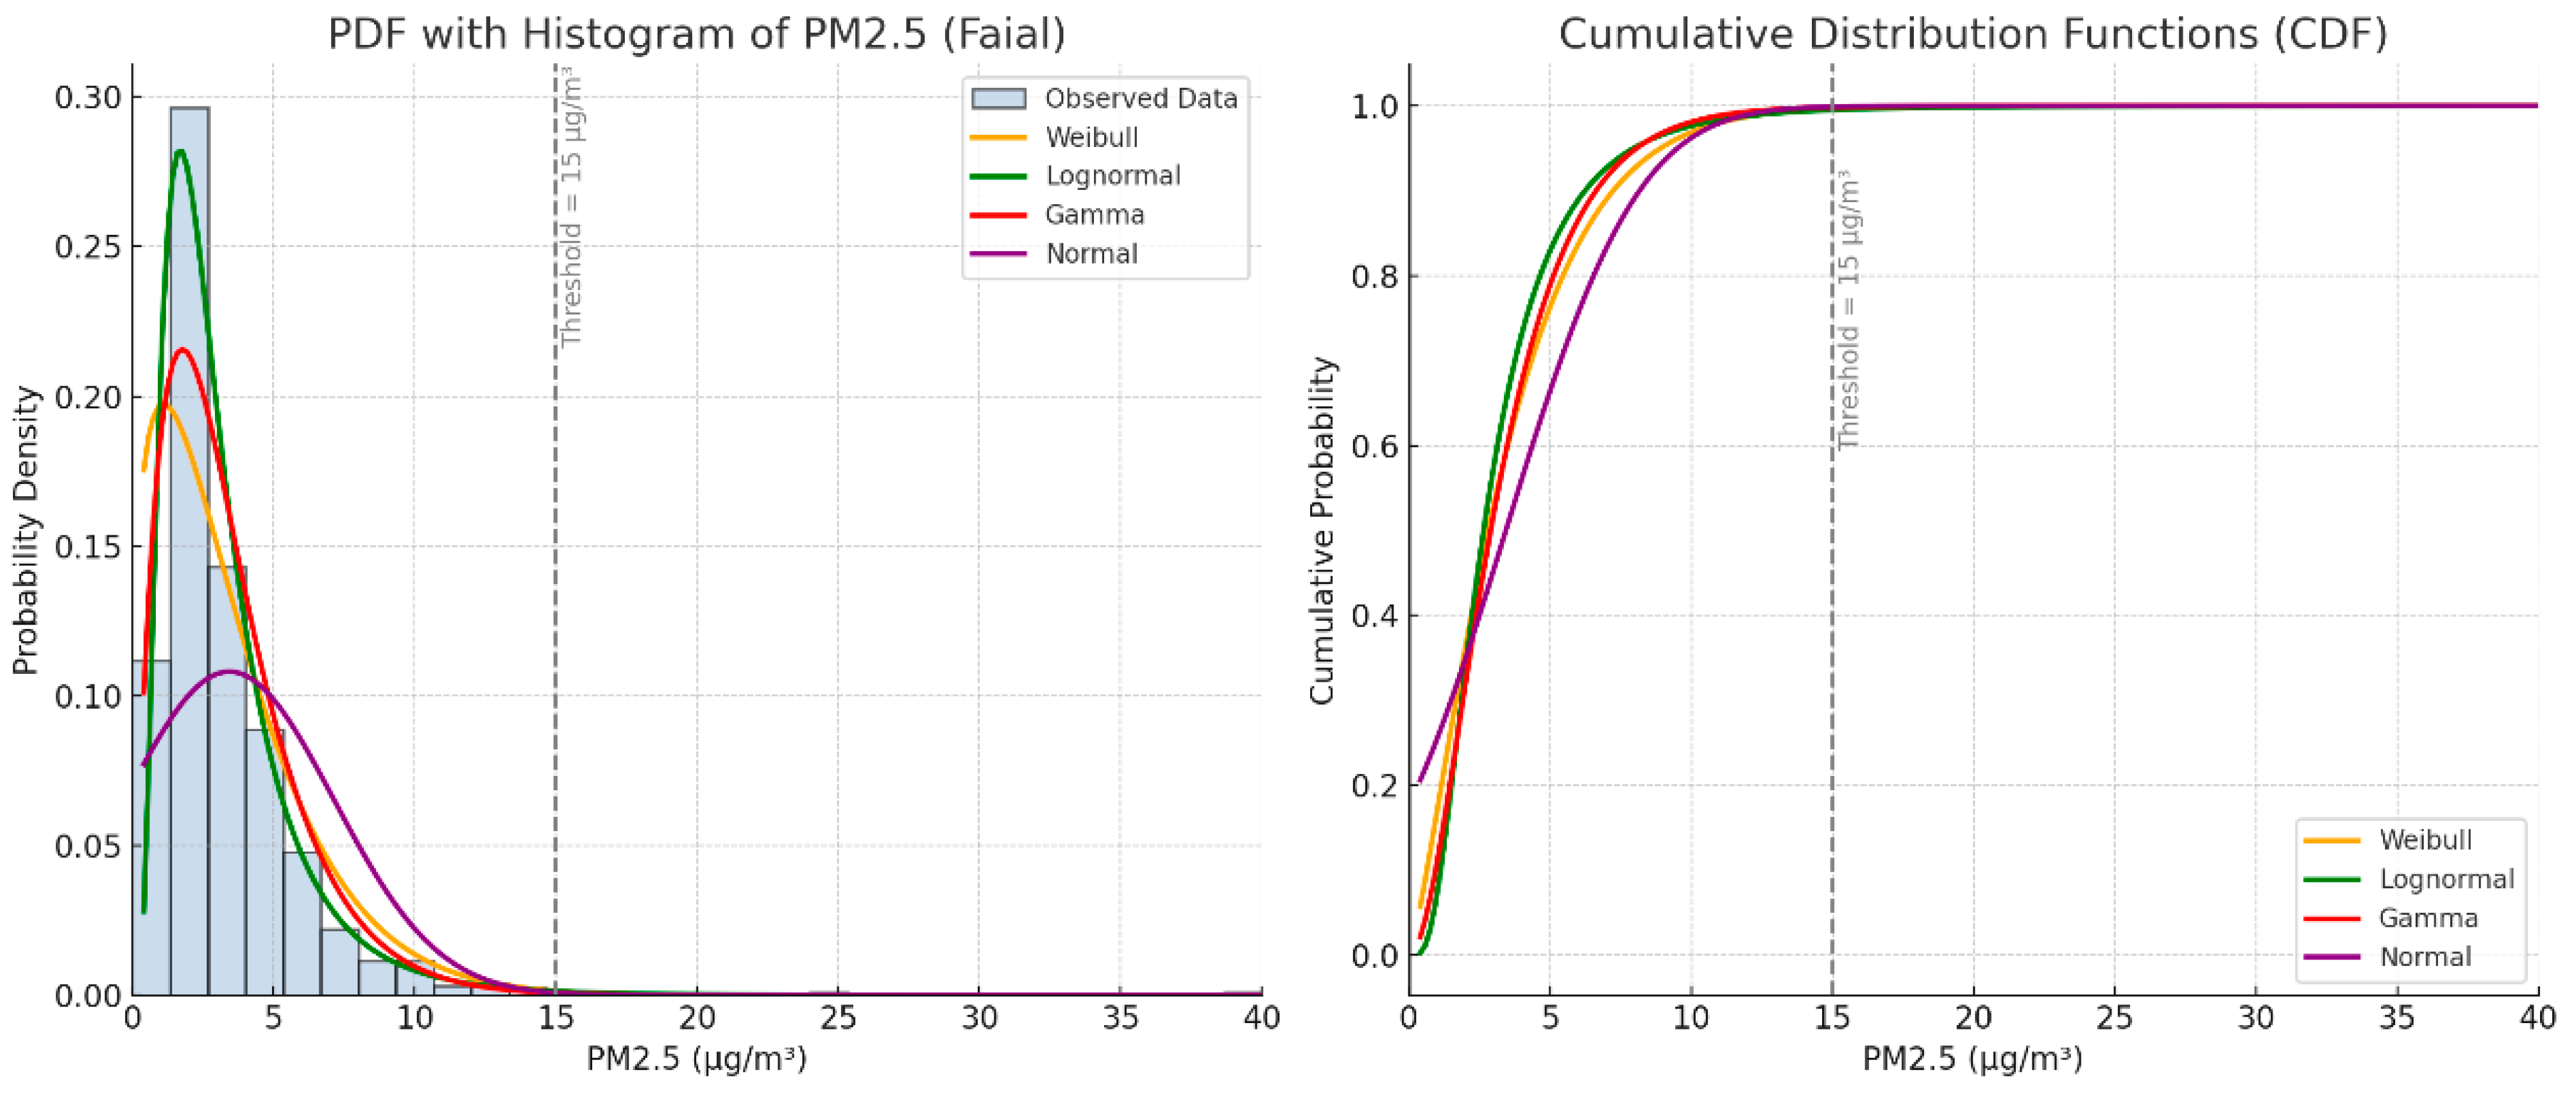
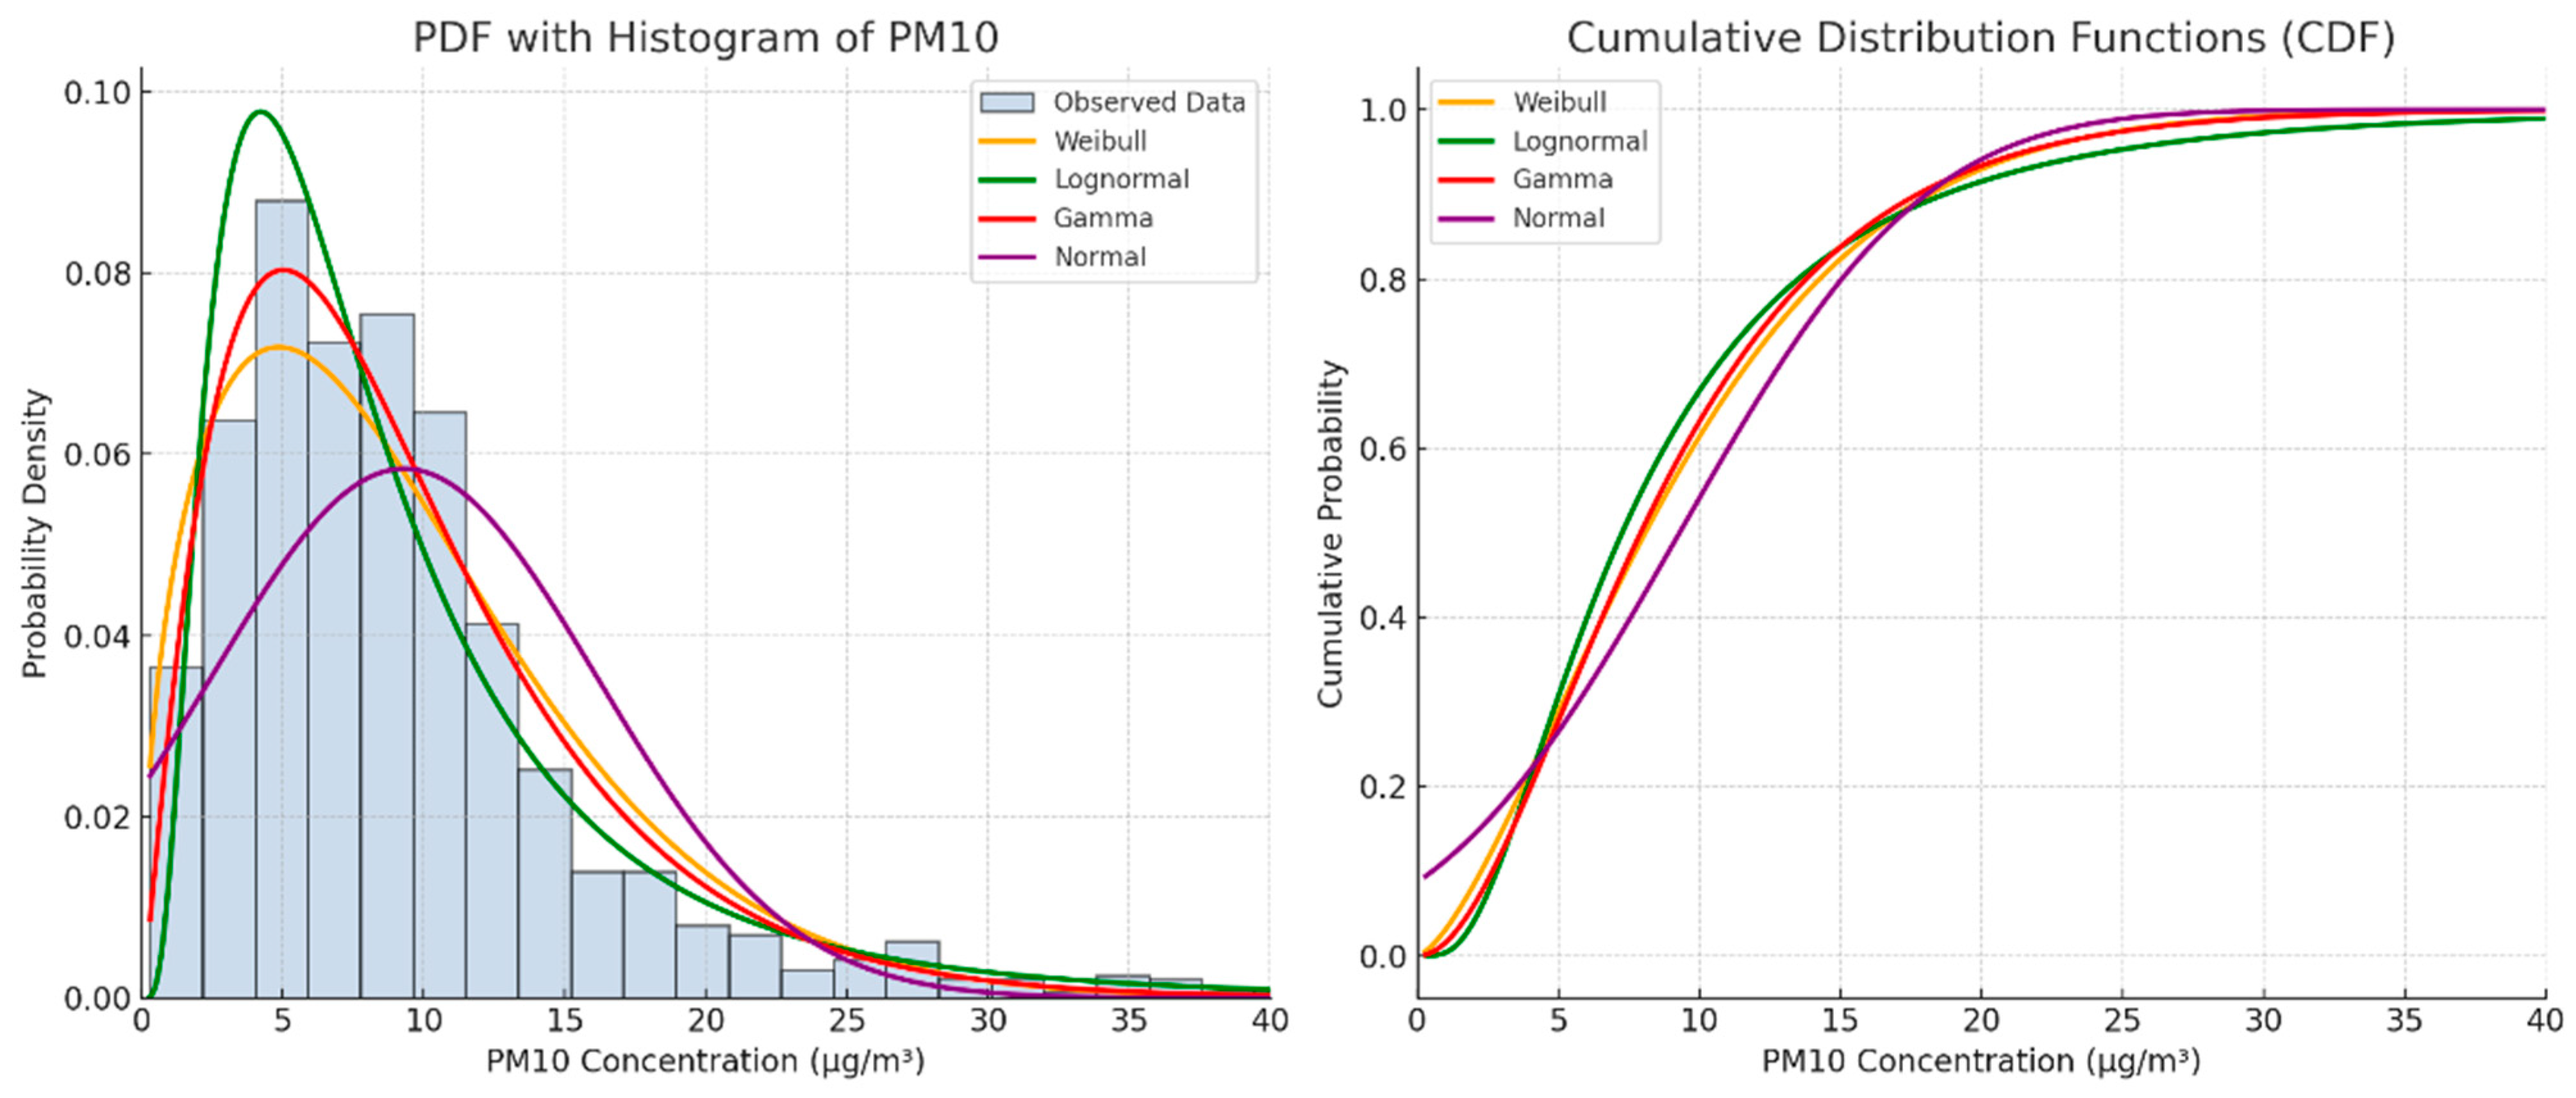
3.3. Exceedances: Regulatory Thresholds and Legislative Context
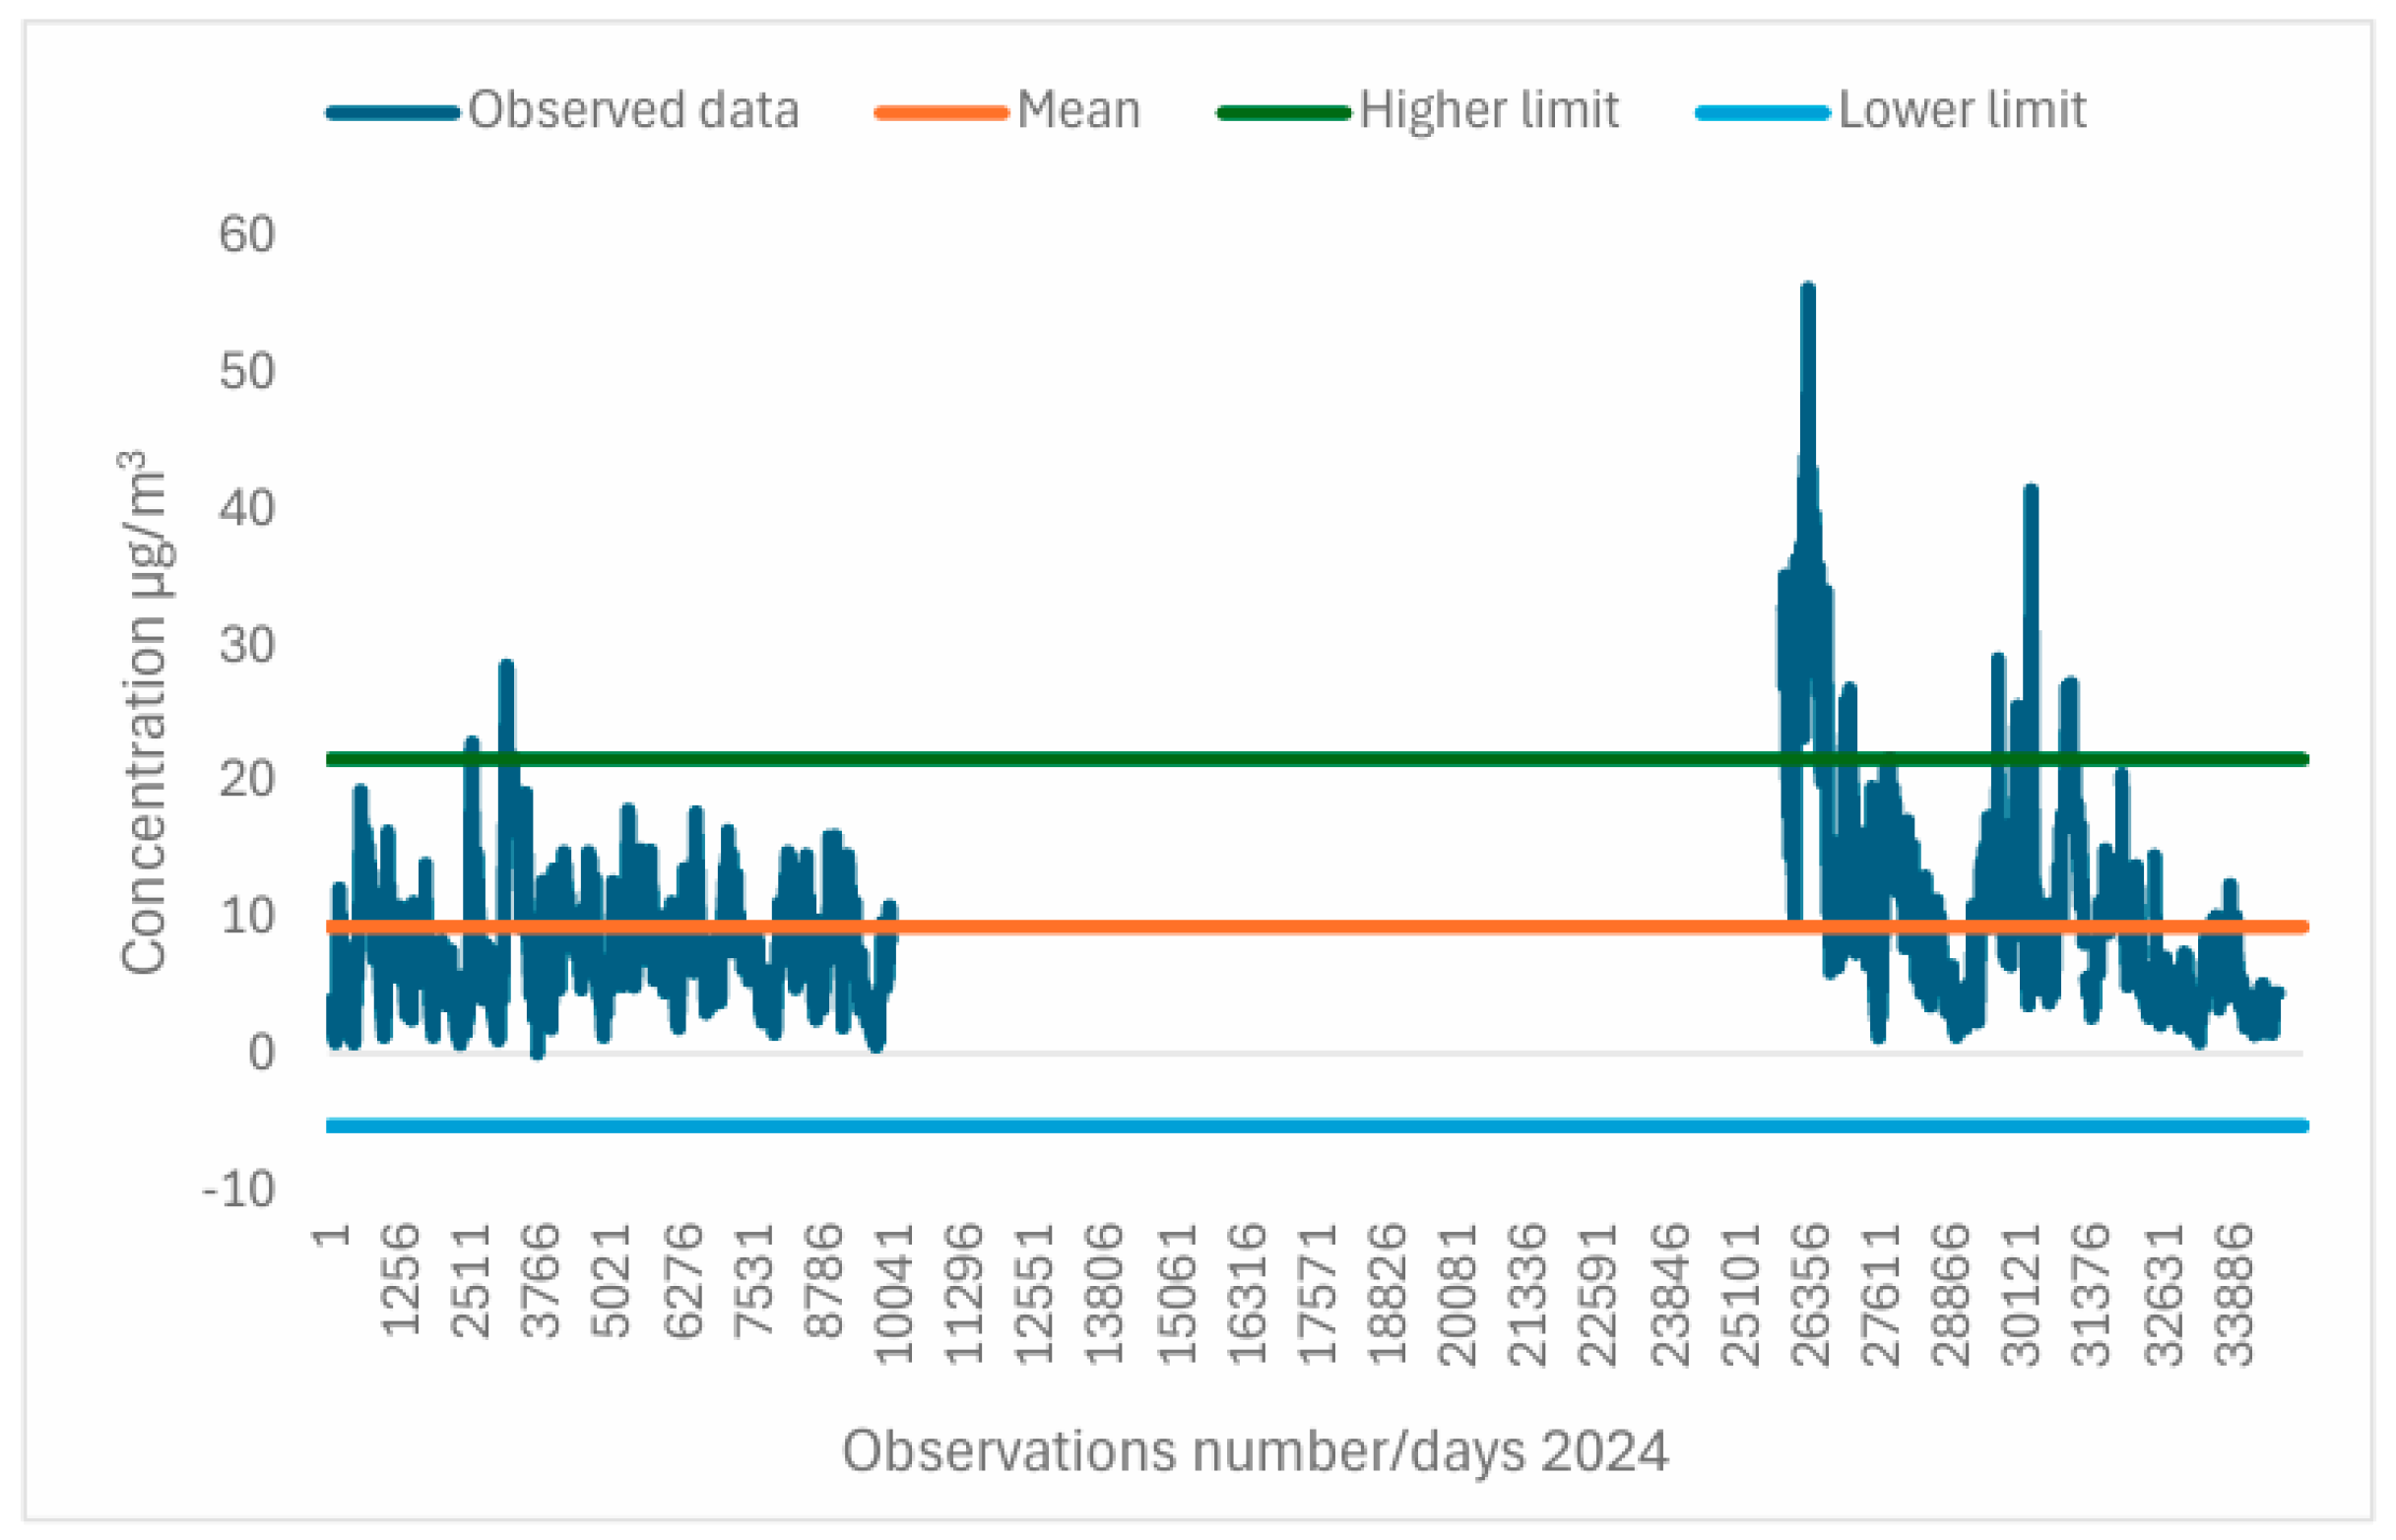
3.3.1. PM2.5 Outliers and Episodic Peaks
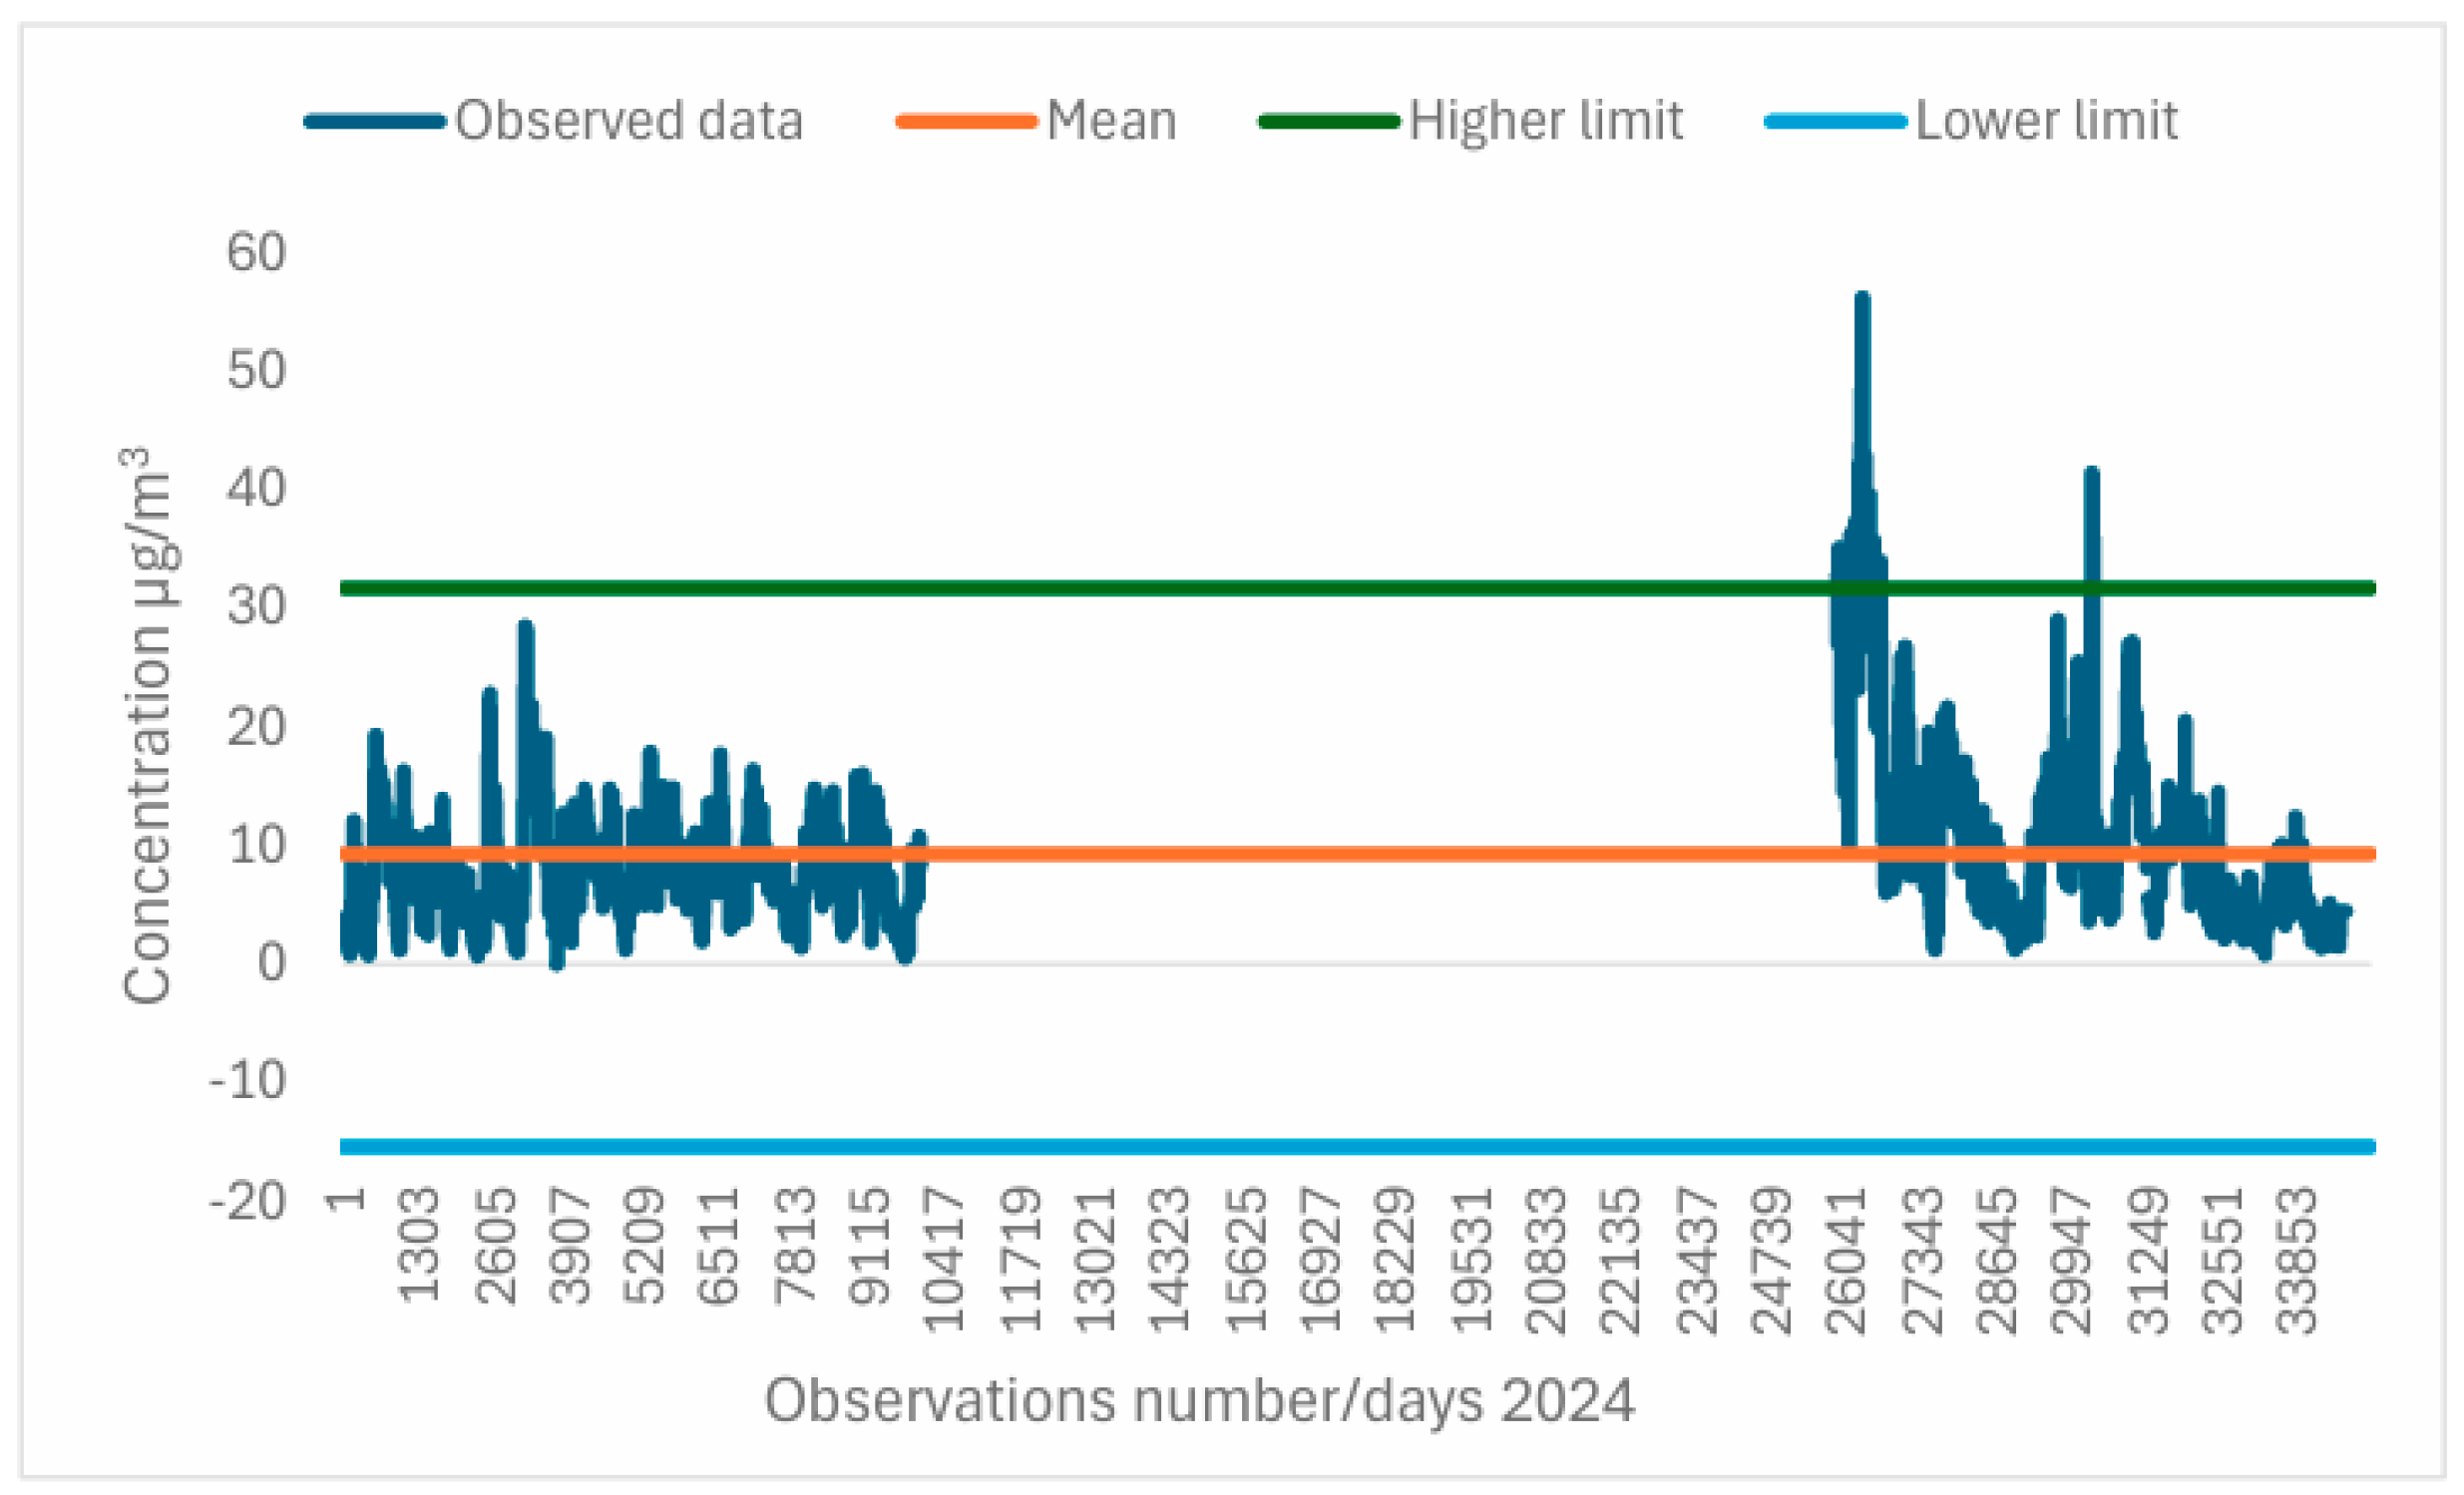
3.3.2. PM10 Outliers and Alert Periods
3.3.3. Saharan Dust Surface Forecast Maps
3.4. Correlation and Time Lag Analysis
3.4.1. PM vs. SO2 and O3
3.4.2. Time-Lagged Regression: SO2 and O3
- is the observed ozone concentration at time ;
- is sulfur dioxide concentration measured at a previous time (with a time lag , e.g., 3 h);
- is the intercept of the regression line (value of when is zero);
- is the regression coefficient (slope) indicating how much changes per unit change in lagged ;
- ε is the random error term (residuals) capturing the variation not explained by the model.
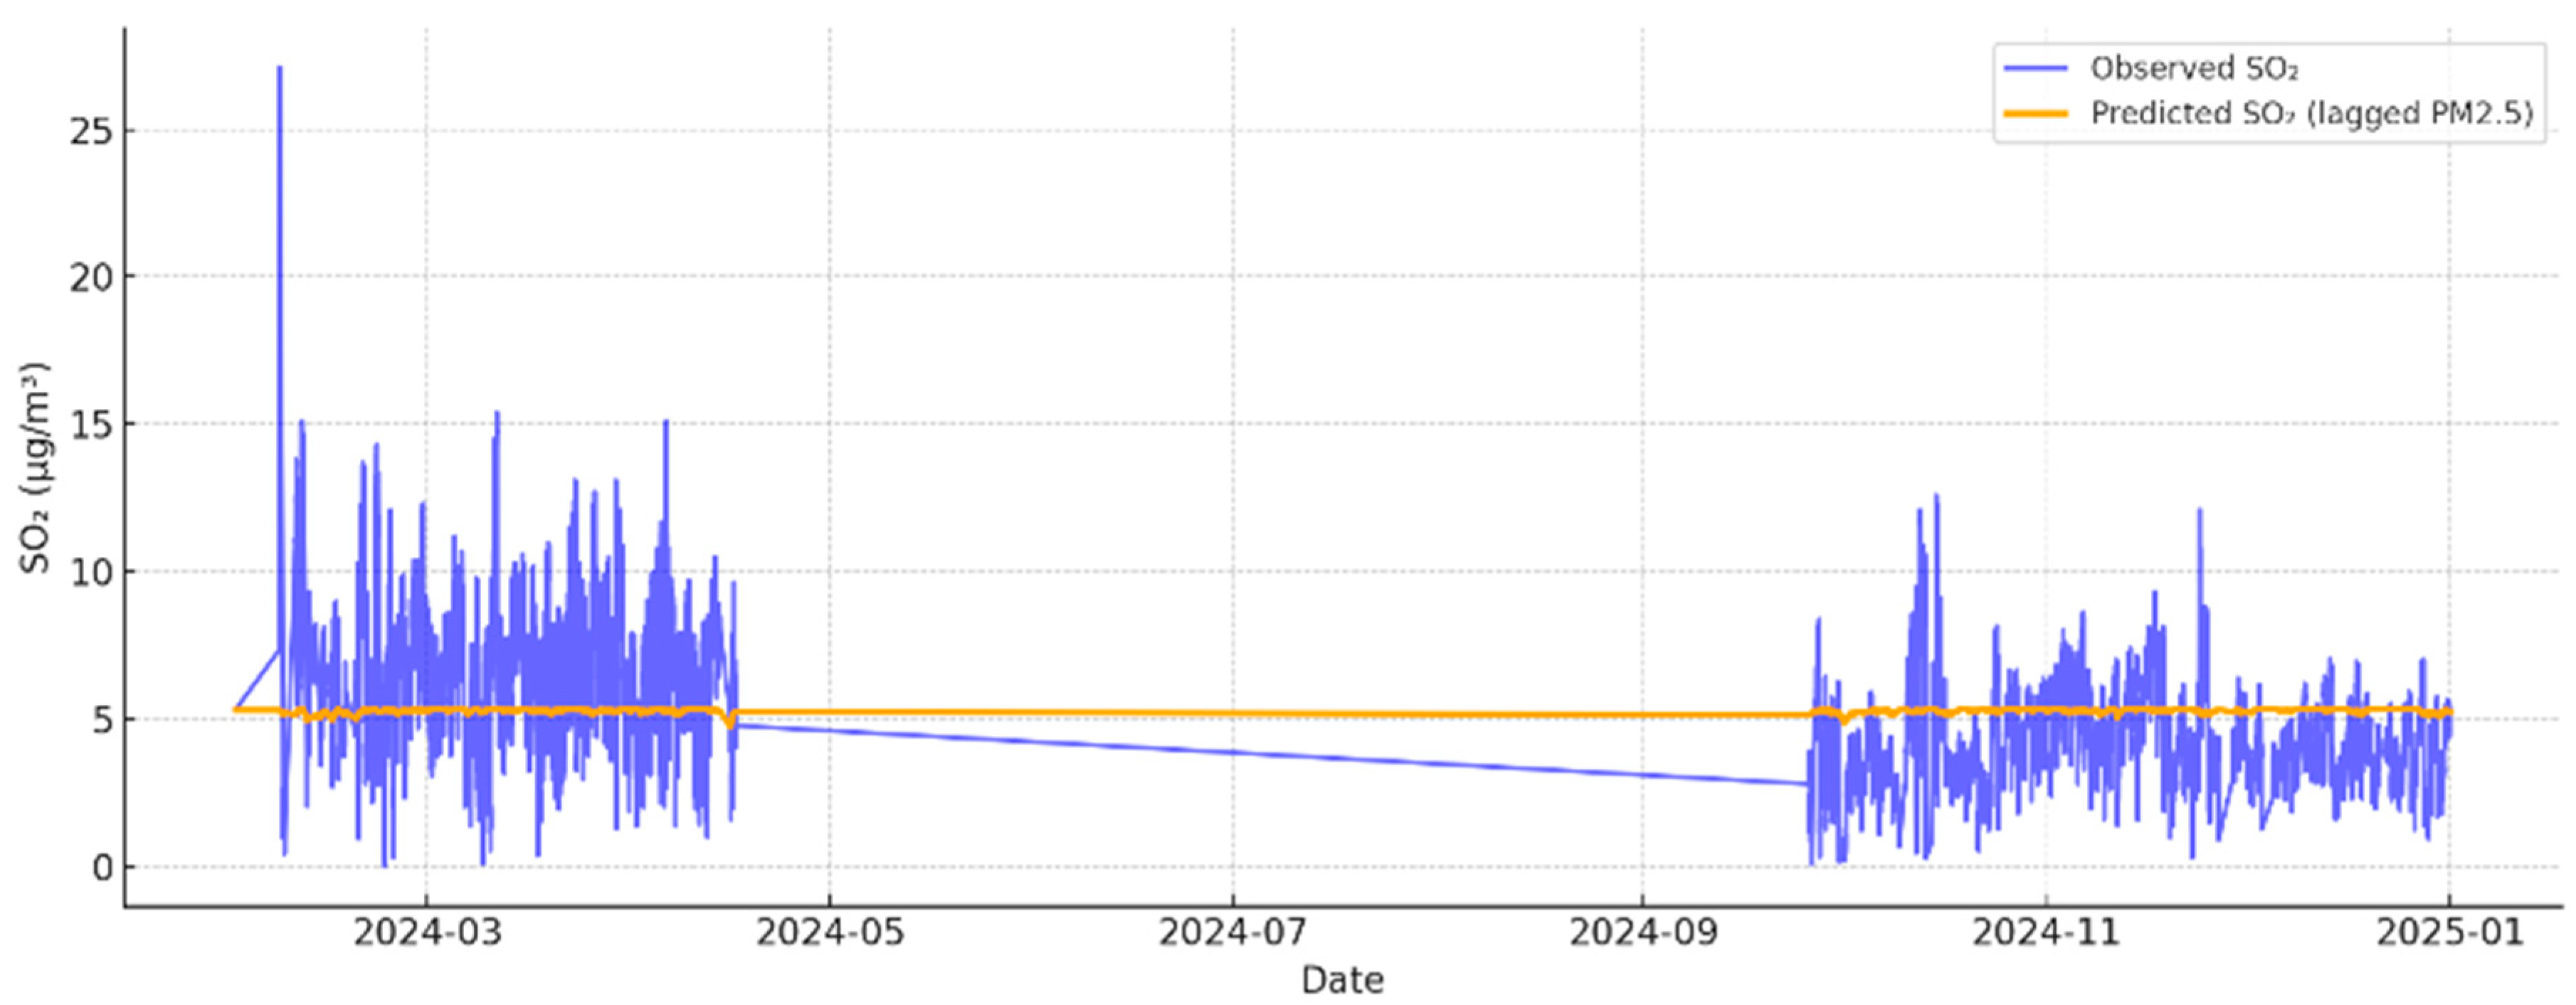
3.4.3. Time-Lagged Regression: SO2 and PM2.5
- is the sulfur dioxide concentration at time ;
- is the concentration of fine particulate matter at a previous time (in this case, 6 h);
- is the intercept;
- is the slope coefficient representing the change in SO2 per unit change in lagged PM2.5;
- is the error term accounting for unexplained variability.
4. Discussions
4.1. Interpretation of Statistical Distributions
4.2. Saharan Dust Transport Influence
4.3. Significance of Weak Correlations
4.4. Public Health and Environmental Implications
5. Conclusions
Author Contributions
Funding
Data Availability Statement
Conflicts of Interest
References
- Kumar, R.P.; Singh, R.; Kumar, P.; Kumar, R.; Nahid, S.; Singh, S.K.; Nijjar, C.S. Aerosol-PM2.5 Dynamics: In-situ and satellite observations under the influence of regional crop residue burning in post-monsoon over Delhi-NCR, India. Environ. Res. 2024, 255, 119141. [Google Scholar] [CrossRef] [PubMed]
- Henning, R.J. Particulate Matter Air Pollution is a Significant Risk Factor for Cardiovascular Disease. Curr. Probl. Cardiol. 2024, 49, 102094. [Google Scholar] [CrossRef]
- Nguyen, T.T.N.; Vu, T.D.; Vuong, N.L.; Pham, T.V.L.; Le, T.H.; Tran, M.D.; Künzli, N.; Morgan, G. Effect of ambient air pollution on hospital admission for respiratory diseases in Hanoi children during 2007–2019. Environ. Res. 2024, 241, 117633. [Google Scholar] [CrossRef]
- Vallero, D. Respiratory Effects of Air Pollutants. In Fundamentals of Air Pollution, 5th ed.; Academic Press: Cambridge, MA, USA, 2014; pp. 247–256. [Google Scholar] [CrossRef]
- Wei, Q.; Chen, Y.; Zhang, H.; Jia, Z.; Yang, J.; Niu, B. Simulation and prediction of PM2.5 concentrations and analysis of driving factors using interpretable tree-based models in Shanghai, China. Environ. Res. 2025, 270, 121003. [Google Scholar] [CrossRef]
- Son, R.; Stratoulias, D.; Kim, H.C.; Yoon, J.-H. Estimation of surface PM2.5 concentrations from atmospheric gas species retrieved from TROPOMI using deep learning: Impacts of fire on air pollution over Thailand. Atmos. Pollut. Res. 2023, 14, 101875. [Google Scholar] [CrossRef]
- Alves, C.; Evtyugina, M.; Vicente, E.; Vicente, A.; Rienda, I.C.; de la Campa, A.S.; Tomé, M.; Duarte, I. PM2.5 chemical composition and health risks by inhalation near a chemical complex. J. Environ. Sci. 2023, 124, 860–874. [Google Scholar] [CrossRef]
- Dawidowski, L.; Constantin, J.G.; Murillo, J.H.; Gómez-Marín, M.; Nogueira, T.; Jiménez, S.B.; Díaz-Suárez, V.; Victorica, F.B.; Lichtig, P.; Resquin, M.D.; et al. Carbonaceous fraction in PM2.5 of six Latin American cities: Seasonal variations, sources and secondary organic carbon contribution. Sci. Total. Environ. 2024, 948, 174630. [Google Scholar] [CrossRef] [PubMed]
- Wei, Q.; Zhang, H.; Yang, J.; Niu, B.; Xu, Z. PM2.5 concentration prediction using a whale optimization algorithm based hybrid deep learning model in Beijing, China. Environ. Pollut. 2025, 371, 125953. [Google Scholar] [CrossRef] [PubMed]
- Chen, S.; Liu, D.; Huang, L.; Guo, C.; Gao, X.; Xu, Z.; Yang, Z.; Chen, Y.; Li, M.; Yang, J. Global associations between long-term exposure to PM2.5 constituents and health: A systematic review and meta-analysis of cohort studies. J. Hazard. Mater. 2024, 474, 134715. [Google Scholar] [CrossRef]
- Li, H.; Zhang, T.; Su, H.; Liu, S.X.; Shi, Y.Q.; Wang, L.Y.; Xu, D.D.; Zhou, J.M.; Zhao, Z.Z.; Wang, Q.Y.; et al. Factors affecting the different growth rates of PM2.5: Evidence from composition variation, formation mechanisms, and importance analysis of water-soluble inorganic ions with case study in northern China. Atmos. Environ. 2025, 340, 120913. [Google Scholar] [CrossRef]
- Zhen, S.; Luo, M.; Xin, F.; Ma, L.; Xu, D.; Cheng, X.; Shao, Y. Chemical composition, source distribution and health risk assessment of PM2.5 and PM10 in Beijing. Atmos. Pollut. Res. 2025, 16, 102448. [Google Scholar] [CrossRef]
- Canu, I.G.; Wild, P.; Charreau, T.; Freund, R.; Toto, A.; Pralong, J.; Sakthithasan, K.; Jouannique, V.; Debatisse, A.; Suarez, G. Long-term exposure to PM10 and respiratory health among Parisian subway workers. Int. J. Hyg. Environ. Health 2024, 256, 114316. [Google Scholar] [CrossRef] [PubMed]
- Kalantary, S.; Jahani, A.; Shams, S.M.P.; Kalantari, B.; Singh, D.; Moeinnadini, M.; Choi, Y. Assessing the effectiveness of artificial neural networks (ANN) and multiple linear regressions (MLR) in forcasting AQI and PM10 and evaluating health impacts through AirQ+ (case study: Tehran). Environ. Pollut. 2023, 338, 122623. [Google Scholar] [CrossRef]
- Alves, C.A.; de la Campa, A.S.; Cipoli, Y.; Furst, L.; Higawa, G.; Leitão, A.; da Silva, A.V.; Feliciano, M.S. PM10-bound elements in Luanda’s urban atmosphere: Concentrations, sources, and their environmental and health impacts. Environ. Pollut. 2025, 372, 125995. [Google Scholar] [CrossRef]
- Núñez, A.; Moreno, D.A.; García, A.M. Saharan dust storms affecting the center of the Iberian Peninsula: Effect on the urban aerobiome. Atmos. Environ. 2024, 328, 120522. [Google Scholar] [CrossRef]
- Neff, J.C.; Reynolds, R.L.; Munson, S.M.; Fernandez, D.; Belnap, J. The role of dust storms in total atmospheric particle concentrations at two sites in the western U.S. J. Geophys. Res. Atmos. 2013, 118, 11201–11212. [Google Scholar] [CrossRef]
- Xi, W.; Jie, C.R.; Heng, C.B.; Dong, K.H. Application of Statistical Distribution of PM10 Concentration in Air Quality Management in 5 Representative Cities of China. Biomed. Environ. Sci. 2013, 26, 638–646. [Google Scholar] [CrossRef]
- Lu, H.-C. The statistical characters of PM10 concentration in Taiwan area. Atmos. Environ. 2002, 36, 491–502. [Google Scholar] [CrossRef]
- Mijić, Z.; Tasić, M.; Rajšić, S.; Novaković, V. The statistical characters of PM10 in Belgrade area. Atmos. Res. 2009, 92, 420–426. [Google Scholar] [CrossRef]
- Sánchez, E. Q-Weibull distribution to explain the PM2.5 air pollution concentration in Santiago de Chile. Eur. Phys. J. B 2023, 96, 108. [Google Scholar] [CrossRef]
- Kunecki, P.; Franus, W.; Wdowin, M. Statistical study and physicochemical characterization of particulate matter in the context of Kraków, Poland. Atmos. Pollut. Res. 2020, 11, 520–530. [Google Scholar] [CrossRef]
- Yang, Q.; Yuan, Q.; Li, T.; Shen, H.; Zhang, L. The Relationships between PM2.5 and Meteorological Factors in China: Seasonal and Regional Variations. Int. J. Environ. Res. Public Health 2017, 14, 1510. [Google Scholar] [CrossRef]
- Pateraki, S.; Asimakopoulos, D.N.; Flocas, H.A.; Maggos, T.; Vasilakos, C. The role of meteorology on different sized aerosol fractions (PM10, PM2.5, PM2.5–10). Sci. Total Environ. 2012, 419, 124–135. [Google Scholar] [CrossRef] [PubMed]
- Li, X.; Chen, X.; Yuan, X.; Zeng, G.; León, T.; Liang, J.; Chen, G.; Yuan, X. Characteristics of Particulate Pollution (PM2.5 and PM10) and Their Spacescale-Dependent Relationships with Meteorological Elements in China. Sustainability 2017, 9, 2330. [Google Scholar] [CrossRef]
- Chen, T.Y.; Chen, S.C.; Wang, C.W.; Tu, H.P.; Chen, P.S.; Hu, S.C.; Li, C.H.; Wu, D.W.; Hung, C.H.; Kuo, C.H. The impact of the synergistic effect of SO2 and PM2.5/PM10 on obstructive lung disease in subtropical Taiwan. Front. Public Health 2023, 22, 1229820. [Google Scholar] [CrossRef] [PubMed] [PubMed Central]
- Wang, L.; Zhao, B.; Zhang, Y.; Hu, H. Correlation between surface PM2.5 and O3 in eastern China during 2015–2019: Spatiotemporal variations and meteorological impacts. Atmos. Environ. 2023, 294, 119520. [Google Scholar] [CrossRef]
- Carvalho, F.; Martins, D.; Meirelles, M.; Vasconcelos, H. Weather and Air Quality Factors Contribution to the Hospital Admissions of Patients with Respiratory Diseases: Case Study of Faial Island (Azores). Int. J. Environ. Sci. Nat. Resour. 2022, 31, 556305. [Google Scholar] [CrossRef]
- Meirelles, M.; Carvalho, F.; Ferreira, A.; Vasconcelos, H.C. Meteorological and Environmental Drivers of Cardiovascular Health Risk in an Insular Region (Azores). Cardiol. Cardiovasc. Res. 2025, 9, 1–24. [Google Scholar] [CrossRef]
- Carvalho, F.; Meirelles, M.; Martins, D.; Vasconcelos, H.C. Yearly Assessment of Weather and Air Quality Impact on Respiratory Disease Hospitalizations: Faial Island (Azores) Study. Am. J. Health Res. 2024, 12, 165–178. [Google Scholar] [CrossRef]
- Meirelles, M.; Carvalho, F.; Porteiro, J.; Henriques, D.; Navarro, P.; Vasconcelos, H. Climate Change and Impact on Renewable Energies in the Azores Strategic Visions for Sustainability. Sustainability 2022, 14, 15174. [Google Scholar] [CrossRef]
- Carvalho, F.S.; Meirelles, M.G.; Henriques, D.; Porteiro, J.; Navarro, P.; Vasconcelos, H.C. Climate Change and Extreme Events in Northeast Atlantic and Azores Islands Region. Climate 2023, 11, 238. [Google Scholar] [CrossRef]
- Available online: https://qualar.apambiente.pt (accessed on 2 March 2025).
- Abdullah, M.M.; Tan, C.Y.; Ramli, N.A.; Yahaya, A.S.; Fitri, N.F. Modelling of PM10 concentration for industrialized area in Malaysia: A case study in Shah Alam. Phys. Procedia 2011, 22, 318–324. [Google Scholar] [CrossRef]
- Zhang, X.; Liang, H.; Zhong, F.; Liu, Y.; Wang, G. Concentration distribution and cluster analysis of PM2.5 based on lognormal cloud model. In Proceedings of the 2022 IEEE 8th International Conference on Cloud Computing and Intelligent Systems (CCIS), Chengdu, China, 26–28 November 2022; pp. 676–683. [Google Scholar] [CrossRef]
- Noor, N.M.; Tan, C.Y.; Ramli, N.A.; Yahaya, A.S.; Yusof, N.F. Assessment of Various Probability Distributions to Model Pm10 Concentration for Industrialized Area in Peninsula Malaysia: A Case Study in Shah Alam and Nilai. Aust. J. Basic Appl. Sci. 2011, 5, 2796–2811. [Google Scholar]
- Available online: https://ambiente.azores.gov.pt/qualidadedoar/Default.aspx (accessed on 24 March 2025).
- Lu, H.-C.; Fang, G.-C. Predicting the exceedances of a critical PM10 concentration—A case study in Taiwan. Atmos. Environ. 2003, 37, 3491–3499. [Google Scholar] [CrossRef]
- Decreto Legislativo Regional nº 32/2012/A, Diário da República 1ª Série, 135, 3706. Available online: https://files.diariodarepublica.pt/gratuitos/1s/2012/07/13500.pdf (accessed on 25 March 2025).
- Portuguese Environment Agency (APA). Available online: https://ambiente.azores.gov.pt/qualidadedoar/store/Uploads/AlertasNotas/previsao_en_2024_01_26_acores.pdf (accessed on 30 March 2025).
- Portuguese Environment Agency (APA). Available online: https://ambiente.azores.gov.pt/qualidadedoar/store/Uploads/AlertasNotas/previsao_en_2024_01_27_acores.pdf (accessed on 30 March 2025).
- Portuguese Environment Agency (APA). Available online: https://ambiente.azores.gov.pt/qualidadedoar/store/Uploads/AlertasNotas/previsao_en_2024_02_02.pdf (accessed on 30 March 2025).
- Portuguese Environment Agency (APA). Available online: https://ambiente.azores.gov.pt/qualidadedoar/store/Uploads/AlertasNotas/previsao_en_2024_02_04.pdf (accessed on 30 March 2025).
- Portuguese Environment Agency (APA). Available online: https://ambiente.azores.gov.pt/qualidadedoar/store/Uploads/AlertasNotas/previsao_en_2024_02_05.pdf (accessed on 30 March 2025).
- Portuguese Environment Agency (APA). Available online: https://ambiente.azores.gov.pt/qualidadedoar/store/Uploads/AlertasNotas/previsao_en_2024_02_06.pdf (accessed on 30 March 2025).
- Portuguese Environment Agency (APA). Available online: https://ambiente.azores.gov.pt/qualidadedoar/store/Uploads/AlertasNotas/previsao_en_2024_04_14.pdf (accessed on 25 April 2025).
- Portuguese Environment Agency (APA). Available online: https://ambiente.azores.gov.pt/qualidadedoar/store/Uploads/AlertasNotas/previsao_en_2024_04_15.pdf (accessed on 25 April 2025).
- Portuguese Environment Agency (APA). Available online: https://ambiente.azores.gov.pt/qualidadedoar/store/Uploads/AlertasNotas/previsao_en_2024_04_16.pdf (accessed on 25 April 2025).
- Portuguese Environment Agency (APA). Available online: https://ambiente.azores.gov.pt/qualidadedoar/store/Uploads/AlertasNotas/previsao_en_2024_11_11.pdf (accessed on 25 April 2025).
- Portuguese Environment Agency (APA). Available online: https://ambiente.azores.gov.pt/qualidadedoar/store/Uploads/AlertasNotas/previsao_en_2024_12_27.pdf (accessed on 25 April 2025).
- Portuguese Environment Agency (APA). Available online: https://ambiente.azores.gov.pt/qualidadedoar/store/Uploads/AlertasNotas/previsao_en_2024_12_28.pdf (accessed on 25 April 2025).
- Portuguese Environment Agency (APA). Available online: https://ambiente.azores.gov.pt/qualidadedoar/store/Uploads/AlertasNotas/previsao_en_2024_12_29.pdf (accessed on 25 April 2025).


| Station Espalhafatos Faial (2024) | |||||
|---|---|---|---|---|---|
| PM2.5 | PM10 | SO2 | O3 | ||
| Total Data | 35,137 | 35,137 | 35,137 | 35,137 | |
| Missing Data | 17,859 | 16,593 | 20,248 | 16,637 | |
| Mean | 3.42 | 9.29 | 5.34 | 70.97 | |
| Median | 2.48 | 7.91 | 5.0 | 72.1 | |
| Standard Deviation | 3.64 | 6.83 | 2.37 | 9.74 | |
| Mode | 1.59 | 10.2 | 5.0 | 70.6 | |
| Variance | 13.25 | 46.67 | 5.61 | 94.92 | |
| Kurtosis | 85.31 | 6.08 | 2.12 | 14.17 | |
| Minimum Value | 0.4 | 0.49 | 0.02 | 9.74 | |
| Maximum Value | 62.7 | 56.2 | 28.9 | 284 | |
| Range | |||||
| Percentiles | 25 | 1.59 | 4.77 | 3.57 | 66.2 |
| 50 | 3.42 | 9.29 | 5.34 | 70.97 | |
| 75 | 4.13 | 11.5 | 6.69 | 77.5 | |
| PM2.5 | ||||
|---|---|---|---|---|
| Parameters | Mean (µg/m3) | Standard Deviation (µg/m3) | Shape | Scale |
| Normal Distribution | μ = 3.43 | σ = 3.69 | --- | --- |
| Weibull Distribution | --- | --- | c = 1.27 | λ = 3.74 |
| Lognormal Distribution | --- | --- | σ = 0.67 | ϴ = 2.64 |
| Gamma Distribution | --- | --- | α = 2.06 | ϴ =1.66 |
| PM10 | ||||
|---|---|---|---|---|
| Parameters | Mean(µg/m3) | Standard Deviation (µg/m3) | Shape | Scale |
| Normal Distribution | μ = 9.3 | σ = 6.83 | --- | --- |
| Weibull Distribution | --- | --- | c = 1.43 | λ = 10.3 |
| Lognormal Distribution | --- | --- | σ = 0.74 | ϴ = 7.26 |
| Gamma Distribution | --- | --- | α = 2.18 | ϴ = 4.27 |
| PM2.5 | ||||
|---|---|---|---|---|
| Distribution | KS Statistic | p-Value | AIC | BIC |
| Normal | 0.226 | 0.000000 | 94,172.0 | 94,187.5 |
| Weibull | 0.128 | 2.07 × 10−246 | 75,203.2 | 75,218.7 |
| Lognormal | 0.044 | 1.23 × 10⁻²⁹ | 68,725.9 | 68,741.5 |
| Gamma | 0.089 | 1.84 × 10−120 | 72,812.2 | 72,827.7 |
| PM10 | ||||
|---|---|---|---|---|
| Distribution | KS Statistic | p-Value | AIC | BIC |
| Normal | 0.123 | 4.37 × 10−263 | 123,842.5 | 123,858.1 |
| Weibull | 0.064 | 2.87 × 10−67 | 115,423.9 | 115,439.6 |
| Lognormal | 0.058 | 4.83 × 10−55 | 114,784.3 | 114,799.9 |
| Gamma | 0.045 | 1.48 × 10⁻³³ | 114,488.1 | 114,503.7 |
| SO2 | ||
|---|---|---|
| Upper assessment threshold | Health safety | Vegetation safety |
| 60% of the limit value per twenty-four-hour period (75 μg/m3, not to be exceeded more than three times per calendar year). | 60% of the critical level applicable in winter (12 μg/m3). | |
| Lower assessment threshold | 40% of the limit value per twenty-four-hour period (50 μg/m3, not to be exceeded more than three times per calendar year). | 40% of the critical level applicable in winter (8 μg/m3). |
| PM2.5/PM10 | |||
|---|---|---|---|
| Upper assessment threshold | Average per twenty-four-hour period (PM10) | Annual average PM2.5 (1) | Annual average PM10 |
| 70% of the limit value (35 μg/m3, not to be exceeded more than 35 times per calendar year). | 70% of the limit value (17 μg/m3). | 70% limit value (28 μg/m3). | |
| Lower assessment threshold | 50% of the limit value (25 μg/m3, not to be exceeded more than 35 times per calendar year). | 50% of the limit value (12 μg/m3). | 50% of the limit value (20 μg/m3). |
| Objective | Reference Period | Threshold |
|---|---|---|
| Information | 1 h | 180 μg/m3 |
| Alert | 1 h | 240 μg/m3 |
| Reference Period | Limit Value |
|---|---|
| PM10 | |
| One day Calendar year | 50 μg/m3, not to exceed 35 times per calendar year 40 μg/m3 |
| Portuguese Environment Agency (APA)—Alert Excedence PM10 | |
|---|---|
| Date | Weather Conditions |
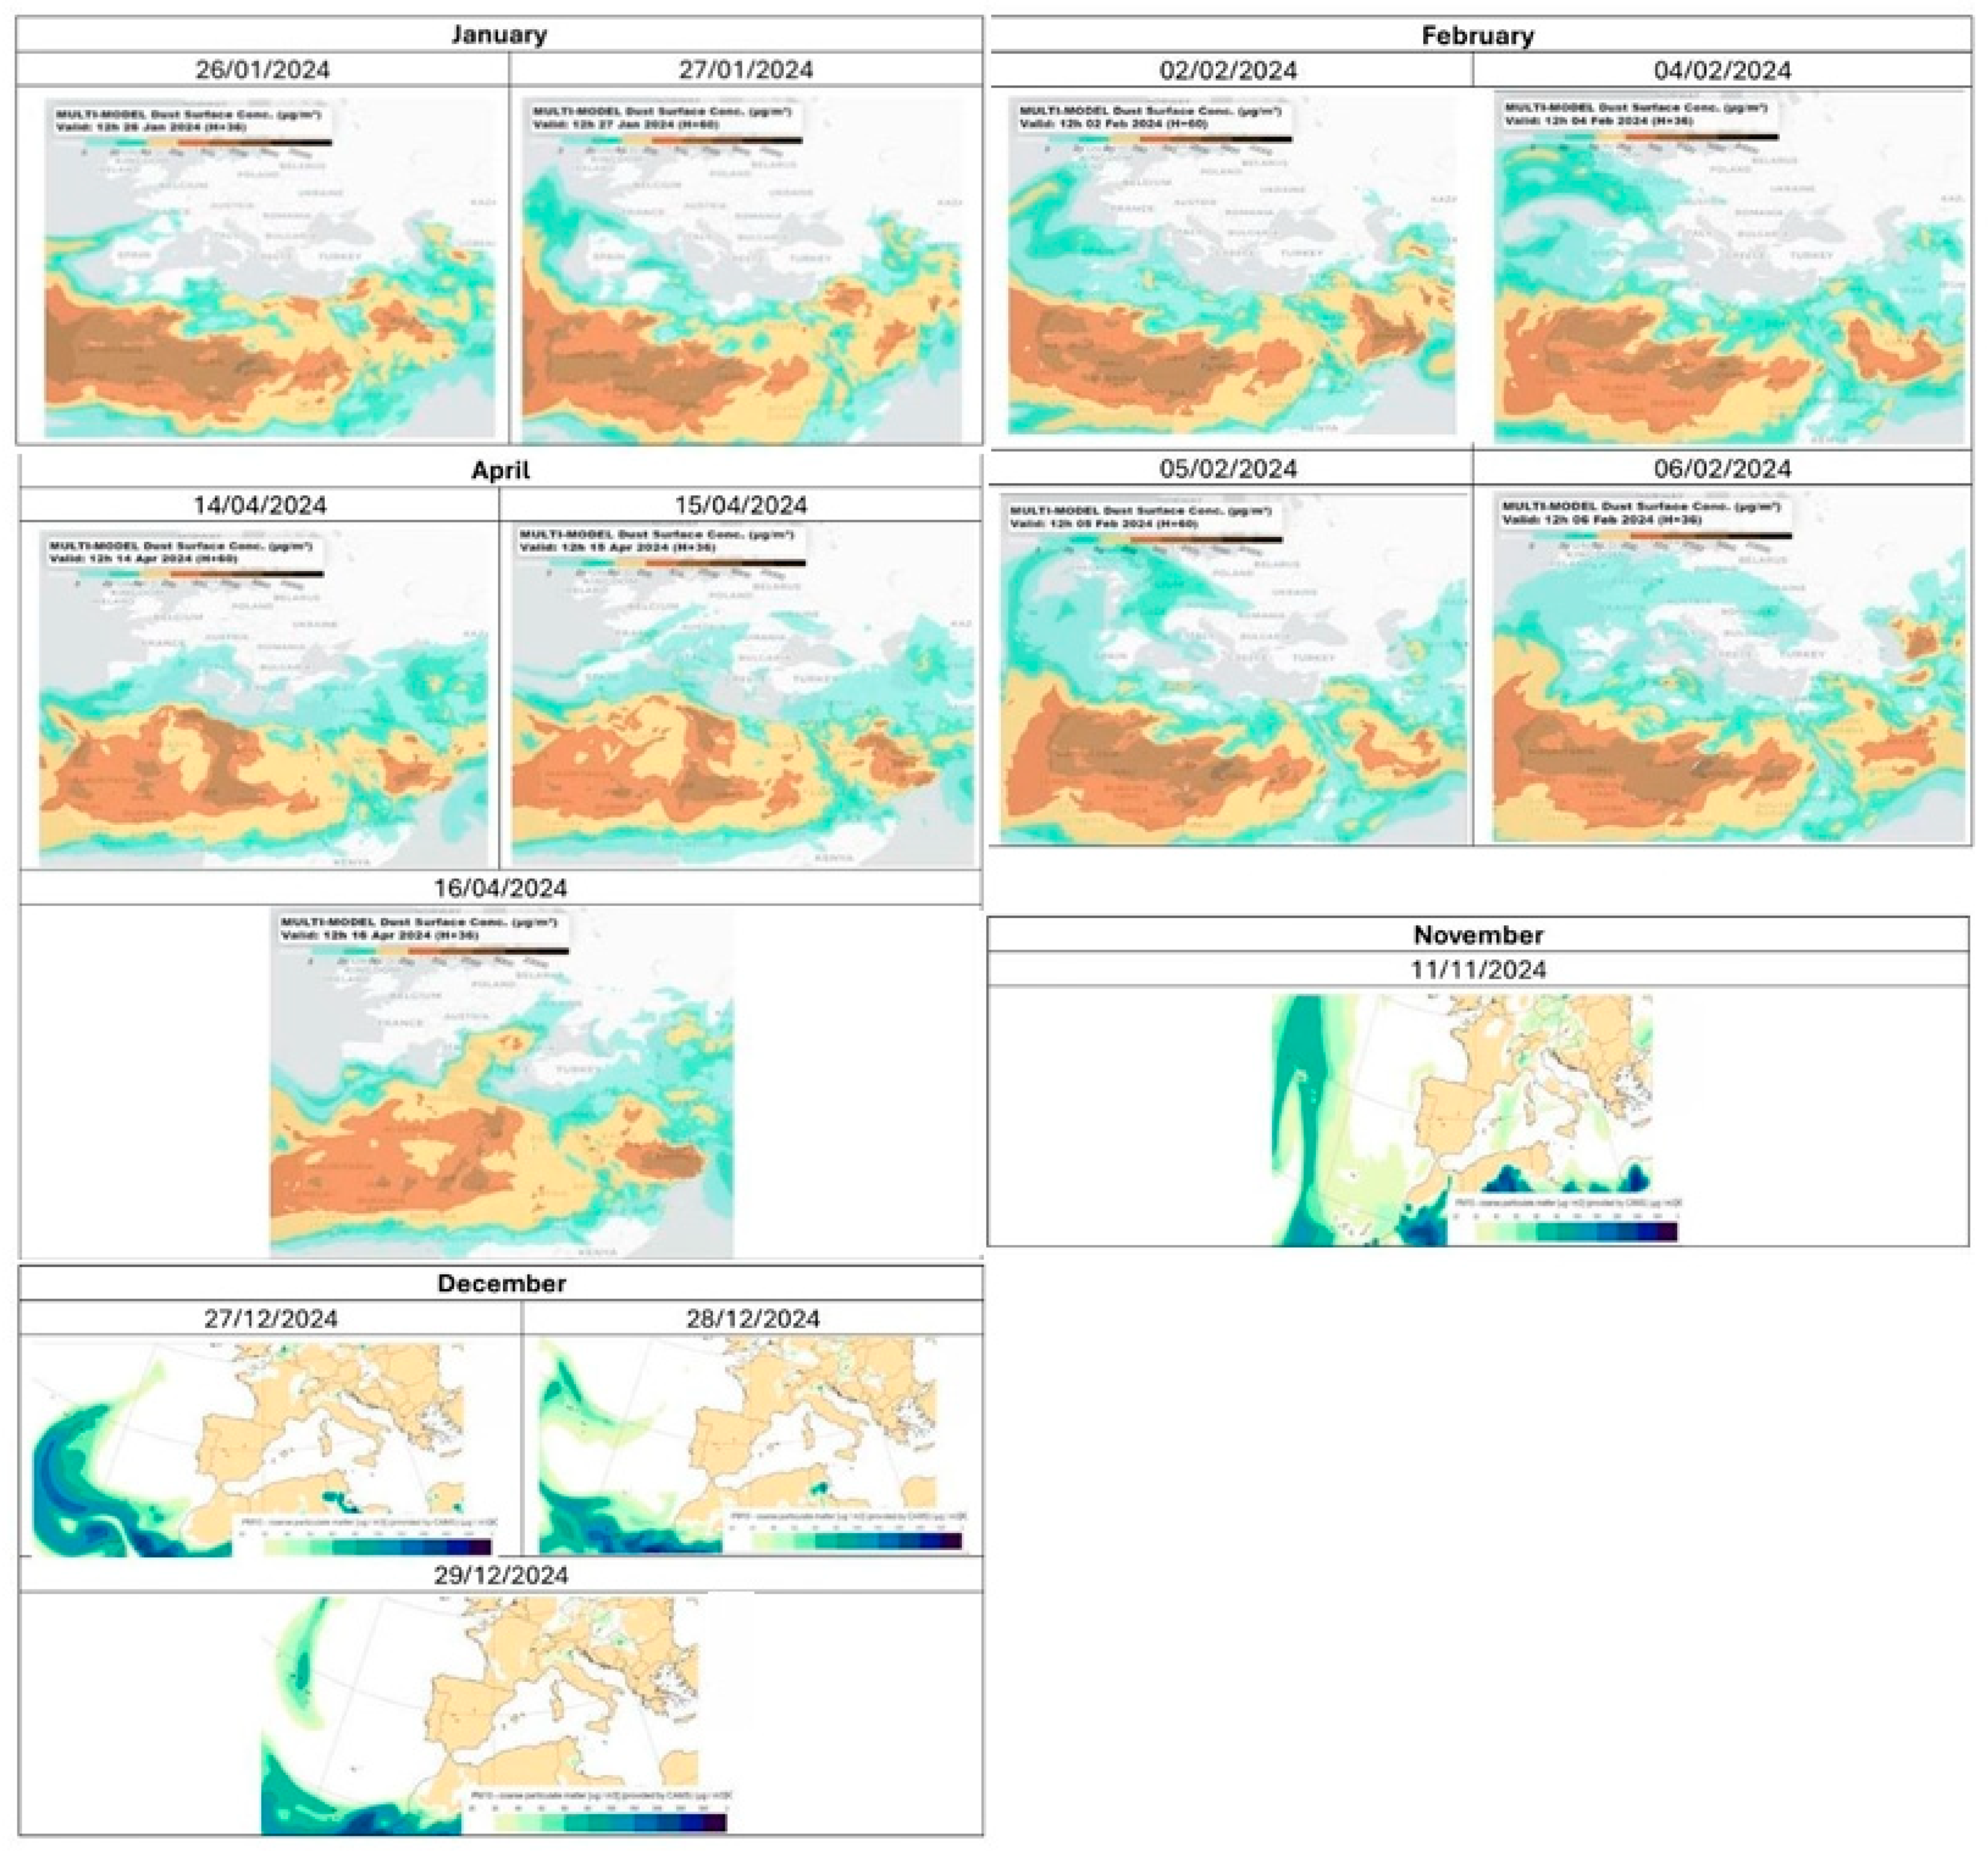
| 26 January 2024 to 27 January 2024 | In the Azores archipelago region, a synoptic configuration conducive to the transport of suspended particles (PM10) originating from North Africa was observed. On 26 January, two anticyclonic nuclei—located over the Bay of Biscay and North Africa—interacted with a depression centered south of the archipelago, generating an easterly to southeasterly airflow in the lower levels of the troposphere. This circulation promoted the advection of air masses laden with Saharan dust, particularly over the Eastern and Central groups. Precipitation recorded in these sectors contributed to the wet deposition of particles, partially reducing atmospheric concentrations. On 27 January, the synoptic situation evolved with the establishment of an anticyclone over Central Europe, extending as a ridge toward North Africa, while a depression moved slowly northeast of the Azores. This configuration resulted in a southerly airflow over the Eastern and Central groups, rotating to a northwesterly direction throughout the day, maintaining the regime of dust transport at altitude. The occurrence of precipitation once again played a mitigating role in the levels of PM10 concentrations. Nevertheless, the Portuguese Environment Agency (APA) issued an alert for PM10 exceedance, indicating concentration levels above the recommended air quality limits for the Azores during this episode. |
| Portuguese Environment Agency (APA)—Alert Excedence PM10 | |
|---|---|
| Date | Weather Conditions |
| 2 February 2024, 4 February 2024 and 5 February 2024, 6 February 2024 | During early February 2024, multiple episodes of advection of suspended particles (PM10) originating from North Africa were recorded in the Azores, driven by various large-scale synoptic configurations. On 2, 4, 5, and 6 February, the persistent presence of anticyclones located over the Iberian Peninsula, the Bay of Biscay, and North Africa, often associated with depressions to the west or northeast of the archipelago, resulted in prevailing easterly, southeasterly, and southerly airflow patterns in the lower levels of the troposphere over the Eastern and Central groups of the Azores. These atmospheric conditions favored the transport of air masses laden with desert dust at altitude, establishing a regime of natural-origin pollution. The occurrence of intermittent precipitation, particularly over the Eastern group, contributed to the attenuation of dust concentrations through wet deposition. |
| Portuguese Environment Agency (APA)—Alert Excedence PM10 | |
|---|---|
| Date | Weather Conditions |
| 14 April 2024 to 16 April 2024 | Between April 14 and 16, 2024, the Azores Archipelago was affected by a prolonged Saharan dust intrusion event, driven by persistent synoptic conditions favorable to the transport of suspended particulate matter (PM10) from North Africa. On 14 April, the presence of a slow-moving anticyclone west of the Azores and an upper-level depression centered west of Madeira induced an easterly airflow over the Eastern and Central groups of the Azores at low atmospheric levels, promoting dust advection at altitude. Precipitation recorded over the archipelago contributed to wet deposition, partially mitigating the impact, with estimated PM10 concentrations ranging between 5 and 20 µg/m3 in the affected islands. On 15 April, favorable circulation persisted, with easterly winds over the Western and Central groups and southeasterly winds over the Eastern group. This synoptic configuration continued to support the intrusion of desert particles, with estimated PM10 concentrations ranging from 5 to 20 µg/m3 in the Western and Central groups, and 20 to 50 µg/m3 in the Eastern group. By 16 April, the anticyclone had shifted toward the west of the British Isles, while the associated depression moved slowly south of the Azores. This resulted in easterly flow over the Central group and southeasterly flow over the Eastern group, initiating the gradual displacement of the dust-laden air mass. Despite continued precipitation, PM10 concentrations remained elevated, with estimates between 5 and 20 µg/m3. Forecast models indicated the dissipation of the intrusion event on the following day. |
| Portuguese Environment Agency (APA)—Alert Excedence PM10 | |
|---|---|
| Date | Weather Conditions |
| 11 November 2024 | On 11 November 2024, the Azores Archipelago was under the influence of a synoptic configuration dominated by an anticyclone centered over the British Isles, extending as a ridge toward the Madeira region. This pattern resulted in a southeasterly airflow in the lower levels of the troposphere, promoting the advection of air masses containing suspended particulate matter (PM10) originating from the deserts of North Africa. Precipitation over the Western and Central Island groups contributed to the wet deposition of dust particles, partially mitigating atmospheric concentrations. Estimates from the Portuguese Environment Agency (APA) indicated an increase in PM10 concentrations ranging from 5 to 20 µg/m3 due to this dust intrusion event. Forecast models for dust transport and dispersion suggested the dissipation of the event on the following day, as the dust-laden air mass moved away from the region. |
| Portuguese Environment Agency (APA)—Alert Excedence PM10 | |
|---|---|
| Date | Weather Conditions |
| 27 December 2024 to 29 December 2024 | Between 27 and 29 December 2024, the Azores Archipelago was affected by a Saharan dust intrusion event, sustained by a synoptic configuration favorable to the long-range transport of suspended particulate matter (PM10) at altitude. On 27 December, the presence of an anticyclone centered over Central Europe, extending as a ridge toward the Azores and North Africa, generated a southeasterly flow over the Central and Eastern groups, promoting the advection of Saharan air masses. Precipitation over the Central group contributed to attenuating PM10 concentrations, which were estimated to range between 5 and 20 µg/m3. On 28 and 29 December, the anticyclone shifted northwest of the Iberian Peninsula, maintaining a ridge toward Madeira. This configuration resulted in southeasterly winds over the Central and Western groups, and easterly winds over the Eastern group, sustaining the dust transport over the archipelago. On both days, precipitation in the Western group partially mitigated particle concentrations; however, PM10 levels remained within the 5 to 20 µg/m3 range across the region. |
| Method | Correlation |
|---|---|
| Pearson | 0.237 |
| Spearman | 0.289 |
Disclaimer/Publisher’s Note: The statements, opinions and data contained in all publications are solely those of the individual author(s) and contributor(s) and not of MDPI and/or the editor(s). MDPI and/or the editor(s) disclaim responsibility for any injury to people or property resulting from any ideas, methods, instructions or products referred to in the content. |
© 2025 by the authors. Licensee MDPI, Basel, Switzerland. This article is an open access article distributed under the terms and conditions of the Creative Commons Attribution (CC BY) license (https://creativecommons.org/licenses/by/4.0/).
Share and Cite
Meirelles, M.G.; Vasconcelos, H.C. Physical–Statistical Characterization of PM10 and PM2.5 Concentrations and Atmospheric Transport Events in the Azores During 2024. Earth 2025, 6, 54. https://doi.org/10.3390/earth6020054
Meirelles MG, Vasconcelos HC. Physical–Statistical Characterization of PM10 and PM2.5 Concentrations and Atmospheric Transport Events in the Azores During 2024. Earth. 2025; 6(2):54. https://doi.org/10.3390/earth6020054
Chicago/Turabian StyleMeirelles, Maria Gabriela, and Helena Cristina Vasconcelos. 2025. "Physical–Statistical Characterization of PM10 and PM2.5 Concentrations and Atmospheric Transport Events in the Azores During 2024" Earth 6, no. 2: 54. https://doi.org/10.3390/earth6020054
APA StyleMeirelles, M. G., & Vasconcelos, H. C. (2025). Physical–Statistical Characterization of PM10 and PM2.5 Concentrations and Atmospheric Transport Events in the Azores During 2024. Earth, 6(2), 54. https://doi.org/10.3390/earth6020054