Article

Comparing Recyclers and Non-Recyclers to Foster Pro-Environmental Behavior

by
Ioanna Ligoudi
,
Evangelia Karasmanaki
* and
Georgios Tsantopoulos
Department of Forestry and Management of the Environment and Natural Resources, Democritus University of Thrace, Pantazidou 193, 682 00 Orestiada, Greece
*
Author to whom correspondence should be addressed.
Earth 2025, 6(2), 47; https://doi.org/10.3390/earth6020047
Submission received: 13 April 2025 / Revised: 16 May 2025 / Accepted: 29 May 2025 / Published: 1 June 2025

Abstract

:
The voluntary basis on which recycling and energy saving are performed at households brings forward the need to better understand the profile of recyclers and non-recyclers and to make meaningful comparisons between them. Hence, the aim of this study is to compare recyclers’ and non-recyclers’ profiles and practices in order to detect areas that require policy and educational interventions. To achieve this aim, this study collected a representative sample of 384 citizens in a fast-growing urban center and compared recyclers and non-recyclers in terms of their environmental practices. The results showed that both groups identified environmental protection as their leading motive to recycle, while plastic and paper were the most recycled materials. An interesting difference between the two groups was that recyclers were more engaged in energy-saving, suggesting that recycling engagement may be associated with the adoption of energy-saving practices. The Internet was the leading information source across both groups, emphasizing the role it can play in spreading accurate and motivating messages about recycling and energy-saving. This study provides a useful and nuanced picture of recyclers’ and non-recyclers’ profiles and their differences, and as such, it can introduce new angles for the design of strategies for encouraging pro-environmental behavior.

1. Introduction

Technological development has profoundly transformed everyday life and provides a wide range of conveniences, such as the incorporation of smart devices into domestic spaces that shape how individuals interact with their environments. These developments have facilitated substantial societal progress, and contemporary younger generations now benefit from innovations that have become deeply embedded in daily routines, often without conscious recognition. This development, however, was not combined with environmental protection measures, and now both the environment and humans are faced with severe effects linked to environmental problems [1]. While these effects are becoming more intense, overconsumption remains a significant part of modern life [2,3]. The Internet plays a significant role in overconsumption patterns by fostering the frequent purchase of non-essential products, driven by pervasive advertising, influencer culture, and algorithmic targeting.
The need to address environmental problems is clear, and now, sustainability occupies a significant place in public dialogue and policy agendas. It is widely acknowledged that institutional policies, along with individual actions concerning environmental issues, are critical in achieving meaningful change. As people are inextricably linked to the natural environment and each behavior has an impact on it, changing behavior patterns should be an integral part of every strategy to mitigate the excessive pressure on the environment [4]. As they do not require any particular training or knowledge, energy saving and recycling are practices that people can easily apply in their everyday lives [5]. In order to promote the wide adoption of these behaviors, a combination of appropriate information, awareness, and education is necessary.
Recycling is based on the principle of returning waste to the production cycle and involves the process of transforming waste materials into new products. It may thus be seen as a crucial response to the widespread problems of overconsumption and insufficient waste management worldwide [6,7]. According to the European Environmental Agency, each European citizen produces around 5 tons of waste, but only 40.8% of municipal waste is recycled [8]. The textile industry, through the proliferation of fast fashion, is a major contributor to waste as the production of low-cost clothing at a rapid pace accelerates waste generation [9]. In 2015, the European Council presented an action plan for the circular economy in which the reuse and recycling of useful materials were recognized as a key issue. The objectives of the plan involved strengthening the EU’s independence from raw material imports and the use of natural resources in sustainable ways. In 2018, the European Council further strengthened recycling targets since these were considered key factors for the circular economy. The target for the recycling of municipal waste was set to 55% by 2025, which should be increased to 60% by 2030 and to 65% by 2035. Member states are thus obliged to carry out separate collection of textiles, hazardous household waste, and organic products by 2025, while separate collection of paper, glass, plastic, metal, and cardboard is already in force. In addition, recycling targets are set for packaging materials (plastic, paper, glass, aluminum, wood, ferrous metals), which should increase 5–10% by 2030 [10]. In relation to the study area, Greece has exerted great efforts to increase the rate of recycling, but has not achieved the same progress as other EU member states [5]. Local governmental authorities in Greece have increasingly aligned their waste management strategies with broader European Union directives aimed at promoting circular economy principles. Municipalities have thus implemented a wide range of policies and regulatory measures to facilitate and enhance the collection, sorting, and recycling of waste. This includes the gradual imposition of bans on the disposal of certain categories of waste in landfills. In addition, the introduction of separate waste collection streams, public awareness campaigns, and economic incentives is implemented at the local level to increase citizen participation in recycling practices. Despite these advancements, significant regional disparities persist in implementation and performance, often due to variations in infrastructure, administrative capacity, and public engagement [11].
Apart from recycling, energy saving is another necessary step toward sustainability [12,13]. People are highly dependent on energy, which is required in every activity of modern society [14]. The largest share of energy is still derived from fossil fuels, whose combustion, however, produces greenhouse gases, which in turn contribute to climate change. Acknowledging the need to reduce greenhouse gas emissions and to reinforce its energy independence, the European Commission on 18 May 2022 announced the REpowerEU plan, which reinforces the Green Deal’s aim of making the EU the world’s first climate-neutral continent by 2050. According to this plan, the EU seeks its independence from Russia and focuses on different ways of energy supply, energy saving, and energy production from renewable sources. Energy saving is one of the most important energy strategies and the EU wants to reduce the amount of energy consumption by about 13% [15]. However, it does not suffice to rely solely on the EU’s policies; it is necessary to spread knowledge on recycling and energy saving throughout society and seek effective ways to change people’s behavior in line with the new objectives [9,16].
Research has focused on citizens’ knowledge, opinions, attitudes, and behaviors regarding recycling and energy saving. For example, the studies of Byrne et al. [17], De Young [18], Mtutu and Thondhlana [4], and Altikolatsi et al. [19] indicated that most citizens are engaged in recycling practices and implement recycling practices on a frequent basis. On the other hand, research by Thomas et al. [20] and Zen et al. [21] captured much lower citizen engagement with recycling. The profile of frequent recyclers is also interesting to note; most recyclers are women [22,23] and, in terms of their family status, most are cohabiting or married [22,24]. As for age, however, no specific age range has been found; there is a volume of research showing that older people recycle more often [4,25], while another stream of the literature has reported that both the younger and older age ranges are committed to recycling [22]. At the same time, the age group 31–40 has been identified as the most active in recycling [26]. Income and educational level are other variables that have been found to be highly influential in terms of recycling [21,27]. Several studies have found similar results regarding which materials citizens recycle the most; most people recycle paper and plastic, and fewer people recycle glass, aluminum, batteries, or other recyclable materials [4,18,20,27].
On a general note, citizens have been found to express positive views on recycling and energy-saving in various studies. In a considerable number of studies, citizens were found to acknowledge these practices as important and ones that can contribute to the mitigation of environmental problems [18,19,20,28]. With that being said, findings on citizens’ knowledge are somewhat varied. For example, Zerinou et al. [29] and Liao et al. [30] found that citizens were aware of the limited availability of natural resources, while Mtutu and Thondhlana [4] found that citizens were able to recognize which materials are recyclable and non-recyclable. On the other hand, in the study of Szaba et al. [31], a significant percentage of respondents demonstrated limited knowledge about renewable energy sources and especially geothermal energy, while the conclusion in the study of Coco Chin et al. (2023) was that citizens lacked basic knowledge [26]. In general, the most widely adopted practices involve turning off the lights when not using a room [32,33], recycling [33], and turning off the laptop when not in use [34]. In the study of Zerinou et al. [29], which was conducted in a city in the same prefecture as the study area of this study, the majority of respondents reported checking the energy label when buying an appliance, choosing mostly class A appliances, setting the temperature on the thermostat between 20 °C to 22 °C, and watering their garden or balcony plants at night. A similarly high level of adoption of environmentally friendly practices was observed by Żywiołek et al. [32]; specifically, 47% of respondents reported opting for energy-efficient light bulbs, 17% having installed insulation on walls and roofs, and 38% having installed energy-efficient window frames. Similarly, in the study of Jia et al. [35], the majority of the participants had installed energy-saving heating and air conditioning devices, while about half participants owned low-emission vehicles. Moreover, regarding the practices related to electronic devices, when not using the laptop and the TV, respondents in the study of Zerinou et al. [29] reported turning off these devices from the power source, while in the study of Mtutu and Thondhlana [4], a low percentage of participants always turned off the laptop when not in use. Finally, Zerinou et al. [29] observed that citizens expressed more trust in scientists on environmental matters, followed by citizen groups. Regarding trust, remarkably low trust levels were recorded for political parties in another study [36].
Recycling and energy saving are two relatively easy to adopt practices that can almost immediately reduce households’ environmental footprint without requiring any expensive equipment or special training. If both practices gain widespread adoption among citizens, then significant progress can be made in terms of local and national environmental quality. The adoption of such practices depends on citizens pointing to the need to dedicate more research to their current recycling and energy-saving practices. In other words, it is necessary to record the current practices of citizens in order to understand which areas require attention. Against this background, the aim of this study is to examine the profile of recyclers and non-recyclers in the city of Alexandroupolis, Greece, and to make a comparison in order to detect areas that require policy and educational interventions. Specific objectives are to identify sociodemographic differences between recyclers and non-recyclers as well as to examine and compare recycling motives, recycled materials, energy saving practices, trust in stakeholders, and the media used for their environmental information.

2. Materials and Methods

2.1. Study Area

For the purposes of this study, the city of Alexandroupolis in northern Greece was considered appropriate for examining citizens’ recycling and energy-saving practices. This seaside city is located in the Prefecture of Evros, which is strategically positioned at the crossroads of Europe, Asia, and the Middle East. With a population of 71,751, Alexandroupolis is one of the fastest-growing cities in Greece, where there is important infrastructure, including pipelines and port facilities. At the same time, the city and the surrounding area are home to an impressively diverse range of ecosystems, with the most important found in the Evros River Delta, which is a protected site under the Ramsar Convention [37]. The Municipality of Alexandroupolis offers its citizens the opportunity to easily and quickly locate the nearest recycling points in their area through an updated digital map. In addition, it provides citizens with a fully updated guide for the materials that can be recycled per stream. More specifically, the recycling streams and bins available in the Municipality involve the blue bins where materials such as water bottles, bags, yoghurt containers, detergents, glass bottles, cartons, and soft drink cans are disposed of, and there are special glass recycling bins for all glass packaging and for small devices (such as computers, computer monitors, fax machines, telephones, toasters, coffee makers, etc.) at selected points. There are also special recycling bins for appliances (such as light bulbs), which are collected separately in special bins placed in electrical goods stores. In addition, citizens can find recycling bins for batteries in various public places and shops, as well as in most educational institutions, supermarkets, banks, and many other shops. For clothing and footwear, citizens can use specific recycling bins at central points in the city. The Sanitation Service is responsible for collecting bulky and inert objects (e.g., worn furniture and mattresses, large electrical appliances, etc.) that are not served by the network bin [38].

2.2. Data Collection

The results reported in this paper draw on data collected through a questionnaire study on recycling and energy saving in the city of Alexandroupolis. The questionnaire was designed explicitly for the purposes of this study and drew on previous relevant studies (such as [19,28,29,31,32,33,34]). The questionnaire was structured in five sections and was three pages long. To ensure coherence and accuracy, the questionnaire was pilot-tested on a limited scale, which pointed to changes that led to the final version of the questionnaire. The first section involved introductory questions examining respondents’ views on environmental issues. The second section included questions examining respondents’ recycling views and practices and the third section collected information on respondents’ energy-saving practices. Then, the items of the fourth section investigated respondents’ environmental attitudes and the fifth section collected their sociodemographic characteristics. Most items were closed-ended because this form enables respondents to fill the questionnaire easily and relatively quickly, while enabling coding for analysis [39]. All responses employed five-point Likert scales, making it possible for respondents to specify their responses. In line with the current legislation, the questionnaire and the design of this study were submitted for approval to the Research Ethics Committee of the Democritus University of Thrace, which decided unanimously to approve this research (Decision No. 7/28-03-23).

2.3. Data Analysis

The collected data were coded and introduced into the Statistical Package for the Social Sciences (SPSS, version 22). To achieve the aim and objectives of this study, descriptive statistics, the chi-square test of independence, and the non-parametric Friedman test were performed. The non-parametric Friedman test was applied in order to compare the values of three or more groups of variables that exhibit correlation. Regarding the distribution of the Friedman test, it was a χ2 distribution with degrees of freedom defined as (df) df = k − 1, where k is the number of teams or samples. The test classifies the values of variables for every respondent separately and estimates the mean rank of classification values for every examined variable [40]. The non-parametric Friedman test was applied in order to examine statistical differences in terms of information sources, trust in stakeholder groups for participation in environmental actions, and environmental attitudes. Moreover, the chi-square test of independence was applied to almost all variables; cross-tabulation tables were drawn separately between each question and the recycling frequency. When the percentage in the control was below 20% and p > 0.05, it was considered that there was no relationship and the variables could be characterized as independent. In the opposite case, if p < 0.05, then there is a relationship, and they are considered dependent. If the variables belong to the latter category, the χ2, DF, and p values are also reported. To facilitate comparison, respondents were then classified into two groups based on the reported frequency with which they recycle. While the terms “recyclers” and “non-recyclers” are used for clarity, it is important to note that the “non-recycler” group still reported engaging in recycling activities at a notable rate, albeit less frequently than the “recyclers” group. Therefore, the classification reflects relative frequency, not complete disengagement.

3. Results

3.1. Recycling Frequency

Respondents were first asked how often they recycle at home, and according to Figure 1, most respondents reported recycling always and very often (by 30.5% and 30.2%, respectively). A significant share of respondents (24.5%) reported recycling often, while 1 in 10 respondents did not recycle at all or recycle rarely.
Respondents were then classified into two groups based on the reported frequency with which they recycle. The first group, referred to as “recyclers”, involves respondents who reported to recycle frequently, very frequently, and always, whereas the second group, termed “non-recyclers”, includes respondents who reported recycling never or rarely. The results will be presented according to this grouping to enable comparisons.

3.2. Demographic Characteristics of Recyclers and Non-Recyclers

Similar recycling frequency rates were indicated for both men and women (p > 0.05). Of those that reported to never or rarely recycle (non-recyclers), 43.9% were women and 56.1% were men, whereas 57.2% of citizens who often–always recycle (recyclers) were women and 42.8% were men (Table 1).
In terms of age, it was observed that the highest percentage of non-recyclers were in the age range of 18–30 years (36.8%), followed by >60 years and 31–40 years (22.8% and 19.3%, respectively). However, recyclers make up the largest share of the age group 41–50 years (26.3%), followed by >60 years, 51–60 years, and 18–30 years (21.7%, 19.6%, and 19.0%, respectively). There is thus a discernible dependence between the variables age and the frequency of recycling (χ2 = 15.583, DF = 4, p < 0.05) (Table 2).
As for their education level, most recyclers and non-recyclers were university graduates (31.5% and 36.8%, respectively). Conversely, the share of master’s degree holders was significantly higher in the group of recyclers (19%) compared to the group of non-recyclers (5.3%) (Table 3).
Regarding family status, around half respondents in the non-recycler group were unmarried (47.4%) and the other half were married (45.6%). In the group of recyclers, the majority was married (65.4%), and a lower percentage of respondents were unmarried (26.9%) (Table 4).
Finally, in terms of their occupation, a significant share of non-recyclers were private employees (24.6%), whereas a high share of recyclers were public employees (30.6%) (Table 5).

3.3. Motives for Recycling and Practices Related to the Disposal of Recyclable Materials

When asked to evaluate the motives for which they would recycle, both recyclers and non-recyclers perceived the contribution of recycling to reducing environmental pollution as the most important motive. The other examined motives were perceived as significant by low shares of respondents, whereas 12.3% of non-recyclers and 12.8% of recyclers regarded recycling as a way to experience a sense of inner fulfillment (Table 6).
Table 7 shows the cross-tabulation results related to the materials that the two groups recycle; the most reported recycled materials for both recyclers and non-recyclers were plastic and paper. More analytically, 95.4% of recyclers and 76.1% of non-recyclers reported recycling plastic, while 94.5% of recyclers and 76.1% reported recycling paper. Regarding the other examined materials, it was observed that the recycling frequency and the materials are two dependent variables. Specifically, the chi-square test of independence showed that 78% of recyclers recycled paper, whereas 43.5% of non-recyclers reported doing so (χ2 = 24.784, DF = 1, p < 0.001). Similarly, 67.9% of recyclers reported recycling aluminum compared to 43.5% of non-recyclers (χ2 = 24.345, DF = 1, p < 0.001). Finally, a significant disparity was observed for two groups for battery recycling, with the corresponding percentages being 81.3% and 41.3% for recyclers and non-recyclers, respectively (χ2 = 35.868, DF = 1, p < 0.001).
Citizens’ level of knowledge on the materials that can be recycled was next examined. Both recyclers and non-recyclers were aware that batteries can be recycled (95.4% and 94.7%, respectively). Similarly, the majority in both groups concerned recyclable cereal boxes, DVD and CD cases, soft drink cans, pieces of paper, broken glass, and yoghurt containers. Only a low percentage in both groups thought that toilet paper is recyclable (Table 8).
Then, the chi-square test of independence was performed to analyze respondents’ behavior when disposing of recyclable materials outside their homes. The test suggested an association between the recycling frequency and the disposal of recyclable materials outside the home (χ2 = 21.572, DF = 3, p < 0.001). More analytically, when outside their home, most non-recyclers dispose of recyclable materials in sidewalk bins or conventional trash cans (63.2%), whereas most recyclers dispose of them in the special recycling bins (Table 9).

3.4. Energy Saving

A comparison between recyclers and non-recyclers was also made in terms of their views and knowledge about energy sources, and it was indicated that, overall, both groups were able to distinguish between renewable and non-renewable sources. High percentages of recyclers (65.1%) and non-recyclers (63.2%) were aware that renewables are the sun, the wind, water, and geothermal energy. A similar level of knowledge for both groups was recorded for non-renewable sources (Table 10).
The chi-square test of independence was used to examine the patterns of differences in responses that concerned checking the energy label when buying appliances. It was indicated that recyclers (57.5%) checked the energy labels to a higher degree than non-recyclers (50.9%), indicating an association between the variables (χ2 = 24.637, DF = 2, p < 0.001) (Table 11).
Regarding the preference for A-class electrical appliances, the chi-square test of independence showed that high percentages in both groups prefer A-class electrical appliances when shopping for their house (41% of recyclers and 42.1% for non-recyclers), showing an association between the variables (χ2 = 16.875, DF = 4, p < 0.005) (Table 12).
The type of light bulbs that respondents use at their house and the recycling frequency were also found to be dependent variables (χ2 = 13.077, DF = 3, p < 0.05). LED lights were reported to be used by high percentages of both recyclers (57.2%) and non-recyclers (47.4%), while the latter also used incandescent bulbs (14%). Energy-efficient bulbs were used more than recyclers (28.1%) compared to non-recyclers (19.3%) (Table 13).
Recyclers’ and non-recyclers’ practices in appliance energy consumption and standby power usage were also compared. Most respondents in both groups reported turning off their TVs and laptops with the button when not using them (Table 14). Interestingly, considerable shares in both groups reported that they do not own desktop computers (42.1% of recyclers and 32.4% of non-recyclers) or home stereo systems (54.4% of recyclers and 46.5% of non-recyclers). For all of the above appliances, the chi-square test of independence was applied, and it was shown that the variables were independent as p > 0.05.
Recyclers’ and non-recyclers’ practices in terms of heating and cooling energy management were then examined. It was shown that regardless of the frequency with which they recycle, they set the thermostat between 20 °C and 22 °C during wintertime (38.6% of non-recyclers and 41.0% of recyclers) (Table 15).
The same trend was observed for the yearly maintenance and proper adjustment of their heating systems (62.1% of recyclers and 52.6% of non-recyclers) (Table 16).
In addition, substantial shares of both groups reported having shading systems at their home (61.8% of recyclers and 52.6% of non-recyclers) (p > 0.05) and ceiling/floor fans at their home (67.6% of recyclers and 64.9% of non-recyclers) (Table 17 and Table 18).
Significant differentiation between the two groups was observed for solar water heaters; the performance of the chi-square test of independence showed that the majority of recyclers (by 76.1%) had installed solar water heaters at their residence as opposed to non-recyclers (by 57.9%) (χ2 = 8.289, DF = 1, p < 0.05) (Table 19).
Both groups reported low levels of having installed insulation or photovoltaic systems. More analytically, in both groups, only about half of the respondents had installed insulation at their house, while the majority in both groups did not have photovoltaic systems. Despite not having insulation at their houses, respondents in both groups reported being very satisfied with their exterior frames (40.4% for recyclers and 50.5% for non-recyclers) (Table 20, Table 21 and Table 22).
Recyclers’ and non-recyclers’ practices in terms of watering plants were compared. There was no association between recycling frequency and watering plants (p > 0.05), with most respondents in both groups reporting watering plants in the afternoon and evening or not owing any plants at all (Table 23).
In terms of using the stairs instead of the elevators, considerable shares of recyclers (37.6%) and non-recyclers (29.8%) reported always using the stairs. Yet, responses for the other frequency levels do not differ significantly (Table 24).

3.5. Environmental Information, Trust in Stakeholders, and Environmental Attitudes

The media that recyclers and non-recyclers use to obtain information about environmental topics was next examined and the non-parametric Friedman test was applied to rank the media. According to Table 25, there is a small degree of differentiation between recyclers and non-recyclers. Both recyclers and non-recyclers gave the highest ranking to the Internet (mean ranks of 7.93 and 7.83, respectively), followed by family and friends (mean ranks of 6.33 and 6.60, respectively) and seminars and conferences (mean ranks of 6.06 and 6.60). Local newspapers were ranked in the last position by both groups (mean ranks of 4.12 and 4.05, respectively).
Respondents were also asked to evaluate various actors based on whether they would be willing to participate in environmental actions organized by them. The non-parametric Friedman test was applied; in Table 26, it can be seen that there was only a slight differentiation. All respondents, regardless of their recycling frequency, mostly trust scientists (mean ranks of 7.24 for recyclers and 7.37 for non-recyclers). This was followed by environmental groups, citizen groups, and EU institutions. Conversely, political parties were ranked in the last position by both groups (mean ranks of 2.82 for non-recyclers and 2.77 for recyclers).
Respondents’ environmental attitudes were then examined, and the Friedman test was performed to rank them (Table 27). On a general note, there was little differentiation between recyclers and non-recyclers. The highest ranked environmental practices for both recyclers and non-recyclers were turning off the lights in unoccupied rooms and using energy-efficient light bulbs (mean ranks of 8.29 and 9.11, respectively), reusing old clothes or donating them (mean ranks of 8.04 and 8.46), and reducing water consumption by turning off the tap while brushing teeth or shaving (mean ranks of 8.09 and 8.18). Conversely, the lowest ranked practices for both recyclers and non-recyclers were using public transport (mean ranks of 4.78 and 4.55), reducing the consumption of meat and cured meat (mean ranks of 4.23 and 3.86), and setting the thermostat at 18 °C. As shown in Table 27, both groups’ rankings exhibit slight differences.

4. Discussion

In order to be successful, recycling and energy saving need active and continuous participation. As recycling and energy-saving behaviors are voluntary yet integral to environmental sustainability, it is essential to carry out sociological research that explores the practices, norms, and contextual factors shaping individual engagement with these behaviors. To attain a new angle, this study has compared recyclers and non-recyclers and, overall, captured an interesting differentiation, which can be used to develop new approaches to the understanding of the adoption of recycling and energy-saving practices.
The high level of recycling recorded here is in line with the high recycling percentages found in previous studies [4,17,18], suggesting a wide adoption of recycling by citizens in different countries. An unexpected finding in this study was that gender and recycling frequency were independent variables, although relevant studies have shown an association with women recycling more often than men [22,23]. There was, however, an association between recycling frequency and age, thereby confirming the results of previous studies; much like the age ranges recorded for recyclers in the studies of Coco Chin et al. [26] and Abushammala and Ghulam [41], recyclers in our study were also aged between 41 and 50 years. This, however, contradicts the earlier study of McDonald and Ball [25], who had indicated that individuals reporting higher recycling frequency were over 60 years old. On the other hand, our study found that non-recyclers are between 18 and 30 years, which comes in contrast to studies showing that recyclers can also be younger (such as Fiorillo [22]). Education level was another influential variable, with high percentages of both recyclers and non-recyclers being university graduates. Yet, many master’s degree holders were recyclers, confirming previous studies showing that a higher educational level is positively associated with a higher recycling frequency [4,21]. Interestingly, marital status emerged as an important variable when it comes to recycling frequency, with married respondents reporting significantly higher recycling frequency. In our study, recyclers were mostly public employees and pensioners, whereas non-recyclers were private employees and pensioners. A similar study had shown that unemployed individuals, homemakers, pensioners, and freelancers tended to exhibit higher commitment to recycling practices [26]. The differences between this study and ours may be attributed not only to the sample but also to the different conditions (such as the availability of recycling bins) in each study area.
Respondents’ environmental views were also examined in order to form a spherical idea of their profile. Regardless of the recycling frequency, most respondents perceived that there are significant environmental problems and that natural resources are constantly decreasing, with these findings being in line with those of Liao et al. [30] and Zerinou et al. [29]. They also recognized recycling and energy saving as good practices that can contribute to the mitigation of environmental problems. These findings are in line with the studies of Altikolatsi et al. [19] and Thomas et al. [20], indicating that the public may be becoming increasingly aware of the environmental benefits of recycling and energy saving. This may imply that public campaigns aimed at raising awareness about recycling and energy saving have been successful in the areas where these studies have been conducted.
The motives driving individuals to commit to recycling are important to examine for several reasons. Specifically, knowing what motivates people can help design policies and campaigns that effectively encourage the adoption of recycling practices [42]. Another benefit is that such insights guide the tailoring of communication strategies; as different people are affected by different factors (environmental concern, financial rewards), understanding their motives enables targeted messaging that appeals to different groups [43]. In addition, potential barriers can be identified and addressed, while new strategies to reinforce recycling habits can be developed [42,43]. In our study, environmental protection was the most important motive, confirming the previous studies of Perrin and Barton [44] and Williams et al. [45], whose results also indicated the strong effect of environmental concern on the adoption of recycling practices. At the same time, environmental concerns also seem to motivate individuals to adopt energy-saving practices [4,46]. A somewhat unexpected motive was that recyclers viewed recycling as an experience that brought them a feeling of personal fulfillment, as Liao et al. [30] have also observed.
In order to improve recycling programs or ensure their effectiveness, it is necessary to examine the materials that citizens recycle because this can point to the citizens’ level of familiarity with recyclable and non-recyclable materials. Plastic and paper emerged as the most recycled materials for both groups; similarly, plastic and paper were the most recycled materials in previous studies [18,27,45], while aluminum has been identified as a material that is recycled less often [4,18,27]. An interesting difference between recyclers and non-recyclers in our study was that recyclers recycled batteries and glass more often (yet batteries were not the most recycled material for both groups). Batteries have been found to be recycled to a lower degree than other recyclable materials, also in other relevant studies [18,27,47], suggesting that there may be a lack of awareness about their recyclability or a lack of infrastructure that can facilitate battery recycling. In relation to infrastructure, however, citizens in the study area can find special recycling bins for batteries in various public places and shops, as well as in most educational institutions, supermarkets, and banks. The low rate of respondents recycling batteries recorded here suggests that there may be other factors that inhibit engagement with recycling batteries, which is worthwhile to address in a future study.
The comparison between recyclers and non-recyclers captured interesting differences in terms of energy saving. Recyclers check the energy label when buying an appliance and choose class A appliances, in contrast to non-recyclers, who reported lower levels of commitment to these practices. Recyclers’ energy saving practices are consistent with those reported in the studies of Zerinou et al. [29] and Liao et al. [30], while non-recyclers’ are consistent with those by Jareemit and Limmeechokchai [34]. In addition, recyclers reported using energy-efficient bulbs much like respondents in the studies of Zywiolek et al. [32] and Fang et al. [48]. Thus, there is evidence that recycling engagement is associated with the adoption of energy saving practices and, therefore, it may be suggested that fostering recycling adoption can create a positive ripple effect in that it may promote the adoption of energy saving practices.
In terms of thermal practices, most respondents set the thermostat at 20–22 °C during winter, which is a temperature that has also been reported in another study in the wider area [29]. A prominent difference between recyclers and non-recyclers was that recyclers were diligent with the annual maintenance and the proper adjustment of their heating systems, while many had installed solar heaters at their house. Regardless of recycling frequency, relatively low shares of citizens had ceiling/floor fans, shading systems, and thermal insulation. This comes in contrast to the study of Zywiolek et al. [32] where considerable shares of householders reported having thermal insulation at their house, and the study of Mtutu and Thondlhana [4] where offices had ceiling fans.
When exploring ways to foster engagement with recycling and energy saving, it is often recommended to leverage the influence of the media. By understanding the media sources citizens use, we can improve their information by ensuring that only accurate and reliable information about recycling and energy saving reaches them. In other words, if we know which media sources people use, we can leverage these sources in order to spread accurate and action-driven messages about recycling and energy saving [49]. In this study, respondents turned mostly to the Internet and their family and friends as their primary sources of information, confirming previous studies showing the high usage of these sources [29,36]. Despite their lack of expert knowledge, family and friends have been found to be profoundly influential to individuals’ environmental views and behavior [27,35,46], while they are often considered the best information sources [50].
A last point that requires discussion concerns respondents’ evaluation of different stakeholder groups based on whether they would participate in environmental actions organized by them. Scientists and environmental groups emerged as the most trusted stakeholders, whereas political parties emerged as the least trusted. This suggests that citizens in the study area are most likely to support environmental actions organized by stakeholders that are surrounded by less controversy. The lack of trust in political parties recorded here is in line with the significant decrease in trust in political parties after the global financial crisis, particularly in southern Europe [51].

5. Conclusions

The voluntary basis on which recycling and energy saving are performed at households brings forward the need to better understand the profile of recyclers and non-recyclers and to make meaningful comparisons between them. As environmental concern was the most important motive for carrying out recycling, it may be inferred that educational approaches emphasizing the contribution of recycling to the mitigation of environmental problems are successful in fostering recycling behaviors. Our study corroborated findings from other studies that recyclers are between 41 and 50 years old, married, and likely to have attended higher education, while non-recyclers tend to fall into younger age groups and be unmarried. Future research should thus seek to detect the social and economic factors behind these trends. Both groups recycled plastic and paper, but aluminum and batteries were recycled at a significantly lower degree, thereby pointing to the areas that need to be addressed by future recycling programs in the study area. Given the toxicity of batteries, it is worthwhile in a future study to examine further citizens’ awareness about their environmental pollution hazards, while local officials need to ensure the availability of convenient collection points. As recyclers were more engaged with energy saving, it may be suggested that recycling engagement can create a positive ripple effect by fostering energy-saving practices. Both respondent groups used mostly the Internet for their information about environmental topics, emphasizing the role that the Internet can play in spreading accurate and action-driven messages about recycling and energy saving.
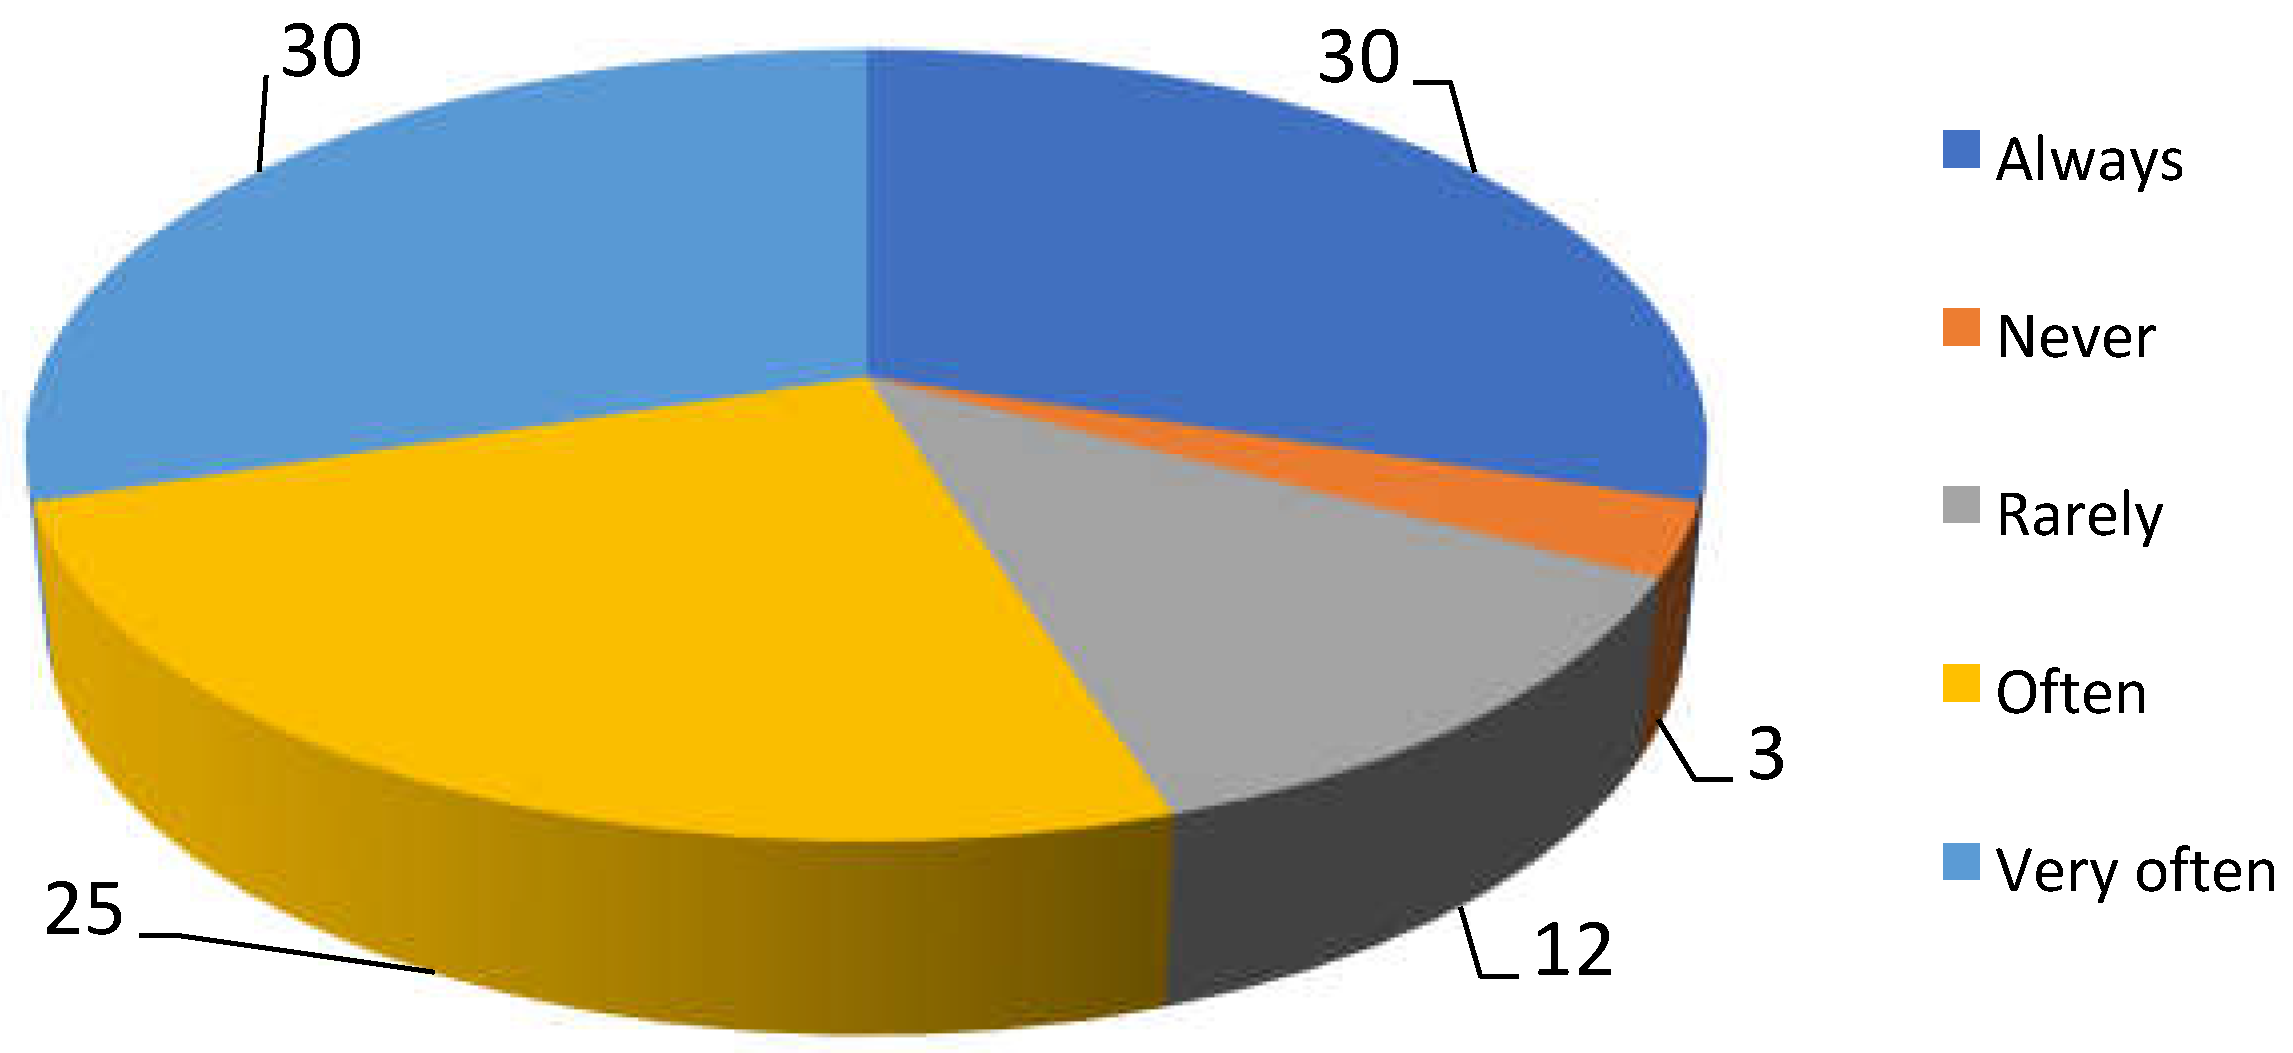
Finally, the results of this study must be considered in view of certain limitations. For the purposes of analysis, respondents in this study were categorized into two groups based on their self-reported frequency of recycling. The first group, referred to as “recyclers”, includes individuals who indicated that they recycle frequently, very frequently, or always. The second group, termed “non-recyclers”, consists of those who reported recycling never or rarely. While these labels are used to differentiate relative behaviors, it is important to note that the “non-recycler” group still demonstrated a substantial level of recycling activity compared to the “recycler” group. As such, the classification reflects comparative frequency rather than complete absence of recycling behavior. In addition, results represent only the citizens in the study area and are not applicable to the entire country or other areas. Also, as the study was performed with the use of a questionnaire, it is not possible to entirely exclude the possibility that there may be a discrepancy between self-reported and actual behaviors.

Author Contributions

Conceptualization, I.L. and G.T.; methodology, G.T.; software, G.T.; validation, G.T., I.L., and E.K.; formal analysis, G.T., I.L., and E.K.; investigation, I.L.; data curation, G.T.; writing—original draft preparation, E.K. and I.L.; writing—review and editing, E.K.; visualization, G.T. and I.L.; supervision, G.T. All authors have read and agreed to the published version of the manuscript.

Funding

This research received no external funding.

Data Availability Statement

The dataset is available on request from the authors.

Conflicts of Interest

The authors declare no conflicts of interest.

References

  1. Sovacool, B.K.; Furszyfer Del Rio, D.D. Smart home technologies in Europe: A critical review of concepts, benefits, risks and policies. Renew. Sustain. Energy Rev. 2020, 120, 109663. [Google Scholar] [CrossRef]
  2. Czerwiński, B.; Domański, J. Contemporary Consumer Trends. Found. Manag. 2023, 15, 51–62. [Google Scholar] [CrossRef]
  3. Botetzagias, I.; Grigoraki, E.; Kokkoris, G.D. Using the Theory of Planned Behavior for Explaining Mobile Phone Recycling: The Role of Subjective Norms. Sustainability 2024, 16, 8773. [Google Scholar] [CrossRef]
  4. Mtutu, P.; Thondhlana, G. Encouraging pro-environmental behaviour: Energy use and recycling at Rhodes University, South Africa. Habitat Int. 2016, 53, 142–150. [Google Scholar] [CrossRef]
  5. Tsimnadis, K.; Kyriakopoulos, G.L.; Arabatzis, G.; Leontopoulos, S.; Zervas, E. An Innovative and Alternative Waste Collection Recycling Program Based on Source Separation of Municipal Solid Wastes (MSW) and Operating with Mobile Green Points (MGPs). Sustainability 2023, 15, 3106. [Google Scholar] [CrossRef]
  6. Tsimnadis, K.; Kyriakopoulos, G.L. Investigating the Role of Municipal Waste Treatment within the European Union through a Novel Created Common Sustainability Point System. Recycling 2024, 9, 42. [Google Scholar] [CrossRef]
  7. Evode, N.; Qamar, S.A.; Bilal, M.; Barceló, D.; Iqbal, H.M.N. Plastic waste and its management strategies for environmental sustainability. Case Stud. Chem. Environ. Eng. 2021, 4, 100142. [Google Scholar] [CrossRef]
  8. European Environmnetal Agency Waste and Recycling. Available online: https://www.eea.europa.eu/en/topics/in-depth/waste-and-recycling (accessed on 1 October 2024).
  9. European Commission Waste and Recycling. Available online: https://environment.ec.europa.eu/topics/waste-and-recycling_en (accessed on 1 October 2024).
  10. European Council Waste Management and Recycling: Council Adopts New Rules. Press Release, 259/18, 22/05/2018. Available online: http://www.consilium.europa.eu/en/press/press-releases/2018/05/22/waste-management-and-recycling-council-adopts-new-rules/ (accessed on 1 October 2024).
  11. Kountouris, Y. The influence of local waste management culture on individual recycling behavior. Environ. Res. Lett. 2022, 17, 074017. [Google Scholar] [CrossRef]
  12. Karasmanaki, E.; Tsantopoulos, G. Public attitudes toward the major renewable energy types in the last 5 years: A scoping review of the literature. In Low Carbon Energy Technologies in Sustainable Energy Systems; Academic Press: Cambridge, MA, USA, 2021; pp. 117–139. ISBN 9780128228975. [Google Scholar]
  13. Hewitt, P.G. Conceptual Physics, 8th ed.; Addison-Wesley: Menlo Park, CA, USA, 1998. [Google Scholar]
  14. Karasmanaki, E.; Galatsidas, S.; Tsantopoulos, G. Exploring the nuances in citizen willingness-to-invest in renewable energy. Energy Effic. 2024, 17, 69. [Google Scholar] [CrossRef]
  15. European Council European Green Deal. Available online: https://www.consilium.europa.eu/en/policies/european-green-deal/ (accessed on 1 October 2024).
  16. Andreopoulou, Z. Internet of Things and food circular economy: A new tool for Sustainable Development Goals. Riv. Di Studi Sulla Sostenibilita 2017, 12, 43–49. [Google Scholar] [CrossRef]
  17. Byrne, S.; O’Regan, B. Attitudes and actions towards recycling behaviours in the Limerick, Ireland region. Resour. Conserv. Recycl. 2014, 87, 89–96. [Google Scholar] [CrossRef]
  18. De Young, R. Recycling as appropriate behavior: A review of survey data from selected recycling education programs in Michigan. Resour. Conserv. Recycl. 1990, 3, 253–266. [Google Scholar] [CrossRef]
  19. Altikolatsi, E.; Karasmanaki, E.; Parissi, A.; Tsantopoulos, G. Exploring the Factors Affecting the Recycling Behavior of Primary School Students. World 2021, 2, 334–350. [Google Scholar] [CrossRef]
  20. Thomas, C.; Slater, R.; Yoxon, M.; Leaman, J.; Downing, J. What Makes People Recycle? An Evaluation of Attitudes and Behaviour in London Western Riverside. In Proceedings of the ISWA World Congress, Melbourne, Australia, 10–14 November 2003. [Google Scholar]
  21. Zen, I.S.; Noor, Z.Z.; Yusuf, R.O. The profiles of household solid waste recyclers and non-recyclers in Kuala Lumpur, Malaysia. Habitat Int. 2014, 42, 83–89. [Google Scholar] [CrossRef]
  22. Fiorillo, D. Household waste recycling: National survey evidence from Italy. J. Environ. Plan. Manag. 2013, 56, 1125–1151. [Google Scholar] [CrossRef]
  23. Meyer, A. Heterogeneity in the preferences and pro-environmental behavior of college students: The effects of years on campus, demographics, and external factors. J. Clean. Prod. 2016, 112, 3451–3463. [Google Scholar] [CrossRef]
  24. Trotta, G. Factors affecting energy-saving behaviours and energy efficiency investments in British households. Energy Policy 2018, 114, 529–539. [Google Scholar] [CrossRef]
  25. McDonald, S.; Ball, R. Public participation in plastics recycling schemes. Resour. Conserv. Recycl. 1998, 22, 123–141. [Google Scholar] [CrossRef]
  26. Coco Chin, K.K.; Mahanta, J.; Nath, T.K. Knowledge, Attitude, and Practices toward Plastic Pollution among Malaysians: Implications for Minimizing Plastic Use and Pollution. Sustainability 2023, 15, 1164. [Google Scholar] [CrossRef]
  27. Delistavrou, A.; Tilikidou, I.; Sarmaniotis, C. The Role of Motivation in the Consumers’ Recycling Behavior. Cyprus J. Sci. Technol. 2005, 4, 20–38. [Google Scholar]
  28. Tiew, K.-G.; Basri, N.E.A.; Deng, H.; Watanabe, K.; Zain, S.M.; Wang, S. Comparative study on recycling behaviours between regular recyclers and non regular recyclers in Malaysia. J. Environ. Manag. 2019, 237, 255–263. [Google Scholar] [CrossRef]
  29. Zerinou, I.; Karasmanaki, E.; Ioannou, K.; Andrea, V.; Tsantopoulos, G. Energy saving: Views and attitudes among primary school students and their parents. Sustainability 2020, 12, 6206. [Google Scholar] [CrossRef]
  30. Liao, X.; Shen, S.V.; Shi, X. The effects of behavioral intention on the choice to purchase energy-saving appliances in China: The role of environmental attitude, concern, and perceived psychological benefits in shaping intention. Energy Effic. 2020, 13, 33–49. [Google Scholar] [CrossRef]
  31. Szabó, G.; Fazekas, I.; Radics, Z.; Csorba, P.; Patkós, C.; Kovács, E.; Tóth, T.; Mester, T.; Szabó, L. Assessing the public knowledge structure towards renewable energy sources in hungary. Int. J. Renew. Energy Res. 2020, 10, 1476–1487. [Google Scholar] [CrossRef]
  32. Żywiołek, J.; Rosak-Szyrocka, J.; Mrowiec, M. Knowledge management in households about energy saving as part of the awareness of sustainable development. Energies 2021, 14, 8207. [Google Scholar] [CrossRef]
  33. Fytopoulou, E.; Karasmanaki, E.; Tampakis, S.; Tsantopoulos, G. Effects of Curriculum on Environmental Attitudes: A Comparative Analysis of Environmental and Non-Environmental Disciplines. Educ. Sci. 2023, 13, 554. [Google Scholar] [CrossRef]
  34. Jareemit, D.; Limmeechokchai, B. Understanding Resident’s Perception of Energy Saving Habits in Households in Bangkok. Energy Procedia 2017, 138, 247–252. [Google Scholar] [CrossRef]
  35. Jia, J.J.; Xu, J.H.; Fan, Y.; Ji, Q. Willingness to accept energy-saving measures and adoption barriers in the residential sector: An empirical analysis in Beijing, China. Renew. Sustain. Energy Rev. 2018, 95, 56–73. [Google Scholar] [CrossRef]
  36. Tsantopoulos, G.; Arabatzis, G.; Tampakis, S. Public attitudes towards photovoltaic developments: Case study from Greece. Energy Policy 2014, 71, 94–106. [Google Scholar] [CrossRef]
  37. Karditsa, A.; Tsapanou, A.; Poulos, S.E. The evolution of the transboundary Evros river delta (Northeast Aegean Sea) under human intervention: A seven-decade analysis. Phys. Geogr. 2020, 41, 291–314. [Google Scholar] [CrossRef]
  38. Followgreen All About Recycling Spot in the Municipality of Alexandroupolis. Available online: https://followgreen.gr/alexpolis/ (accessed on 20 April 2025).
  39. Wilkinson, D.; Birmingham, P. Using Research Instruments: A Guide for Researchers; Routledge: London, UK, 2003; ISBN 9781134483464. [Google Scholar]
  40. Ho, R. Handbook of Univariate and Multivariate Data Analysis and Interpretation with SPSS; Chapman and Hall/CRC: New York, NY, USA, 2006; ISBN 9781420011111. [Google Scholar]
  41. Abushammala, H.; Ghulam, S.T. Impact of Residents’ Demographics on Their Knowledge, Attitudes, and Practices towards Waste Management at the Household Level in the United Arab Emirates. Sustainability 2023, 15, 685. [Google Scholar] [CrossRef]
  42. Fogt Jacobsen, L.; Pedersen, S.; Thøgersen, J. Drivers of and barriers to consumers’ plastic packaging waste avoidance and recycling—A systematic literature review. Waste Manag. 2022, 141, 63–78. [Google Scholar] [CrossRef]
  43. Aguilar-Morales, S.Y.; Negrete-Cardoso, M.; Rosano-Ortega, G.; Sánchez-Ruíz, F.J.; Sánchez-Baltasar, L.B.; Vega-Lebrún, C.A.; Schabes-Retchkiman, P.S. Marketing strategies for waste recycling: A bibliometric analysis towards the circular economy. Environ. Sci. Pollut. Res. 2023, 30, 67565–67581. [Google Scholar] [CrossRef] [PubMed]
  44. Perrin, D.; Barton, J. Issues associated with transforming household attitudes and opinions into materials recovery: A review of two kerbside recycling schemes. Resour. Conserv. Recycl. 2001, 33, 61–74. [Google Scholar] [CrossRef]
  45. Williams, H.; Wikström, F.; Wetter-Edman, K.; Kristensson, P. Decisions on recycling or waste: How packaging functions affect the fate of used packaging in selected Swedish households. Sustainability 2018, 10, 4794. [Google Scholar] [CrossRef]
  46. Wang, B.; Wang, X.; Guo, D.; Zhang, B.; Wang, Z. Analysis of factors influencing residents’ habitual energy-saving behaviour based on NAM and TPB models: Egoism or altruism? Energy Policy 2018, 116, 68–77. [Google Scholar] [CrossRef]
  47. Ball, R.; Lawson, S.M. Public attitudes towards glass recycling in Scotland. Waste Manag. Res. 1990, 8, 177–192. [Google Scholar] [CrossRef]
  48. Fang, X.; Qu, Z.; Sun, C.; Wu, C.; Wei, J. Public attitude and policy selection of future energy sustainability in China: Evidence of the survey of the college students. Energy Policy 2022, 165, 112961. [Google Scholar] [CrossRef]
  49. Giannarakis, G.; Zafeiriou, E.; Sariannidis, N.; Efthalitsidou, K. Determinants of dissemination of environmental information: An empirical survey. J. Bus. Econ. Manag. 2016, 17, 749–764. [Google Scholar] [CrossRef]
  50. Nixon, H.; Saphores, J.D.M. Information and the decision to recycle: Results from a survey of US households. J. Environ. Plan. Manag. 2009, 52, 257–277. [Google Scholar] [CrossRef]
  51. Valgarðsson, V.; Jennings, W.; Stoker, G.; Bunting, H.; Devine, D.; Mckay, L.; Klassen, A. A Crisis of Political Trust? Global Trends in Institutional Trust from 1958 to 2019. Br. J. Polit. Sci. 2025, 55, e15. [Google Scholar] [CrossRef]
Figure 1. Respondents’ recycling frequency.
Earth 06 00047 g001
Table 1. Recycling frequency and gender.
RecyclersNon-Recyclers
Female57.243.9
Male42.856.1
Total100.0100.0
Table 2. Recycling frequency and age.
RecyclersNon-Recyclers
18–30 19.036.8
31–40 13.519.3
41–50 26.310.5
51–60 19.610.5
>6021.722.8
Total100.0100.0
Table 3. Recycling frequency and education level.
RecyclersNon-Recyclers
Not completed primary school1.81.8
Primary school graduate2.17.0
Junior high school graduate3.15.3
High school graduate19.915.8
Technical school graduate4.08.8
Vocational school graduate6.17.0
Technical institution graduate12.512.3
University graduate31.536.8
Master’s degree19.05.3
Total100.0100.0
Table 4. Recycling frequency and marital status.
RecyclersNon-Recyclers
Unmarried26.947.4
Married65.445.6
Divorced5.23.5
Widow/widower2.43.5
Total100.0100.0
Table 5. Recycling frequency and occupation.
RecyclersNon-Recyclers
Crop or livestock farmer0.91.8
Homemaker3.41.8
Private employee15.924.6
Pensioner17.419.3
Public employee30.614.0
Student7.614.0
Free lancer (trader, electrician, etc.)5.83.5
Free lancer (doctor, lawyer, etc.)9.58.8
Business owner0.90
Unemployed0.91.8
Occasional paid work3.15.3
Other4.05.3
Total100.0100.0
Table 6. Cross-tabulation results regarding recycling frequency and recycling motives.
RecyclersNon-Recyclers
Reduction in environmental pollution81.359.6
Following the example of my family/friends2.88.8
Experience of sense of inner fulfillment12.812.3
Attaining the rewards1.55.3
I would not recycle0.610.5
Other motive0.93.5
Total100.0100.0
Table 7. Cross-tabulation results between recycling frequency and materials.
RecyclersNon-Recyclers
Paper94.576.1
Plastic95.476.1
Glass78.043.5
Aluminum67.930.4
Batteries81.341.3
Table 8. Cross-tabulation results regarding recycling frequency and knowledge about recyclable materials.
RecyclersNon-Recyclers
Batteries95.494.7
Cereal boxes85.384.2
Toilet paper26.329.8
DVD and CD cases74.677.2
DVDs and CDs45.645.6
Soft drink cans89.394.7
Pieces of A4 paper62.175.4
Glass jars 88.791.2
Yoghurt containers81.384.2
Broken glass51.468.4
Table 9. Cross-tabulation results regarding recycling frequency and the disposal of recyclable materials outside.
RecyclersNon-Recyclers
Using sidewalk bins or conventional trash cans31.563.2
Using recycling bins5531.6
Throwing materials on the ground2.11.8
Keeping materials and later disposing of them in recycling11.33.5
Total100.0100.0
Table 10. Cross-tabulation results regarding recycling frequency and knowledge of renewable energy sources.
RecyclersNon-Recyclers
Geothermal, sun, natural gas, wind19.015.8
Natural gas, water, food, geothermal 1.21.8
Sun, wind, oil, water3.73.5
Sun, wind, water, geothermal 65.16.2
Do not know11.015.8
Total100.0100.0
Table 11. Cross-tabulation results regarding recycling frequency and checking the energy label when buying appliances.
RecyclersNon-Recyclers
Always57.536.8
Never20.250.9
Sometimes22.312.3
Total100.0100.0
Table 12. Cross-tabulation results regarding recycling frequency and preference for A-class electrical appliances.
RecyclersNon-Recyclers
Class A41.024.6
Class B8.910.5
Class C and below4.03.5
Other classes27.519.3
Do not know18.742.1
Total100.0100.0
Table 13. Cross-tabulation results regarding recycling frequency and light bulbs.
RecyclersNon-Recyclers
Incandescent bulbs4.614.0
Energy-efficient bulbs28.119.3
LED lights57.247.4
Do not know10.119.3
Total100.0100.0
Table 14. Cross-tabulation results regarding recycling frequency and television power usage.
RecyclersNon-Recyclers
Turn off the TV with the power button59.678.9
Leave the TV on standby33.015.8
Unplug the TV4.00.0
Do not own a TV3.45.3
Total100.0100.0
Table 15. Cross-tabulation results regarding recycling frequency and heating and cooling energy management.
RecyclersNon-Recyclers
Below 18 °C2.81.8
Between 18–20 °C30.638.6
Between 20–22 °C41.038.6
Between 22–24 °C11.610.5
Over 24 °C2.85.3
Heating systems does not have thermostat11.35.3
Total100.0100.0
Table 16. Cross-tabulation results regarding recycling frequency, yearly maintenance, and proper adjustment of heating systems.
RecyclersNon-Recyclers
Always 62.152.6
Never5.87.0
Sometimes11.324.6
Do not have boiler20.815.8
Total100.0100.0
Table 17. Cross-tabulation results regarding recycling frequency and owning shading systems.
RecyclersNon-Recyclers
Yes61.852.6
No 30.936.8
Do not know7.310.5
Total100.0100.0
Table 18. Cross-tabulation results regarding recycling frequency and owning ceiling/floor fans.
RecyclersNon-Recyclers
Yes32.435.1
No 67.664.9
Do not know100.0100.0
Table 19. Cross-tabulation results regarding recycling frequency and owning solar water heaters.
RecyclersNon-Recyclers
Yes76.157.9
No23.942.1
Total100.0100.0
Table 20. Cross-tabulation results regarding recycling frequency and insulation installation.
RecyclersNon-Recyclers
Yes50.540.4
No41.047.4
Do not know8.612.3
Total100.0100.0
Table 21. Cross-tabulation results regarding recycling frequency and photovoltaic installation.
RecyclersNon-Recyclers
Yes8.310.5
No91.789.5
Total100.0100.0
Table 22. Cross-tabulation results regarding recycling frequency and satisfaction with exterior frames.
RecyclersNon-Recyclers
Not at all satisfied3.41.8
Slightly satisfied4.98.8
Moderately satisfied29.133.3
Very satisfied45.040.4
Extremely satisfied17.715.8
Total 100.0100.0
Table 23. Cross-tabulation results regarding recycling frequency and time of watering plants practices.
RecyclersNon-Recyclers
Morning12.25.3
Midday1.20
Afternoon25.424.6
Evening27.826.3
Whenever12.815.8
Do not have plants20.528.1
Total100.0100.0
Table 24. Cross-tabulation results regarding recycling frequency and stair use frequency.
RecyclersNon-Recyclers
Never15.624.6
1–2 times a day15.021.1
3–4 times a day13.514.0
Always37.629.8
There are no staircases in my home/work18.310.5
Total100.0100.0
Table 25. Results of the Friedman test for ranking recyclers’ and non-recyclers’ information sources.
RecyclersNon-Recyclers
Family and friends6.336.60
Local television networks5.575.81
National television networks6.315.93
Local radio networks4.634.66
National radio networks4.864.26
Local newspapers4.124.05
National newspapers4.764.83
Magazines4.424.81
Internet7.937.83
Seminars and conferences6.066.22
Ν = 327; χ2 = 638.292; DF = 9; p < 0.001Ν = 57; χ2 = 116.374; DF = 9; p < 0.001
Table 26. Results of the Friedman test for ranking respondents’ trust in actors regarding participation in environmental actions.
RecyclersNon-Recyclers
EU institutions 5.485.35
Government4.194.38
Local government4.564.37
Political parties2.772.82
NGOs4.604.35
Environmental groups6.356.48
Citizen groups5.615.89
Scientists7.247.37
Media4.193.98
N = 327; χ2 = 824.216; DF = 8; p < 0.001N = 57; χ2 = 163.924;DF = 8; p < 0.001
Table 27. Results of the Friedman test for ranking recyclers’ and non-recyclers’ environmental attitudes.
RecyclersNon-Recyclers
Willing to turn off the lights in unoccupied rooms and use energy-efficient light bulbs 9.118.29
Willing to recycle7.068.35
Willing to reuse old clothes or donate them 8.468.04
Willing to buy locally produced food 6.826.76
Willing to buy organic foodstuffs 5.885.10
Willing to reduce water consumption by turning off the tap while brushing teeth or shaving 8.188.09
Willing to set the thermostat at 18 °C4.834.90
Willing to limit meat and cured meat consumption 3.864.23
Willing to walk short distances 7.257.27
Willing to use the bicycle 4.995.27
Willing to use public transport4.554.78
Willing to buy products packaged in recyclable materials or eco-friendly manufactured products 7.006.91
N = 57; χ2 = 174.825; DF = 11 p < 0.001N = 327; χ2 = 990.326; DF = 11; p < 0.001
Disclaimer/Publisher’s Note: The statements, opinions and data contained in all publications are solely those of the individual author(s) and contributor(s) and not of MDPI and/or the editor(s). MDPI and/or the editor(s) disclaim responsibility for any injury to people or property resulting from any ideas, methods, instructions or products referred to in the content.

