1. Introduction
With global temperatures steadily rising, understanding the impacts of warming on regional climates has become crucial, particularly for countries like India, where climate sensitivity has significant socio-economic implications. This study assesses the spatial and temporal variations of summer days across India under different warming targets and emission scenarios (RCP4.5 and RCP8.5). While various heat stress indicators such as the Heatwave Duration Index (HWDI), maximum temperature percentiles (TX90p), or Wet Bulb Temperature (WBT) exist, this study utilizes the “Summer Days” (SU) index, defined as the number of days with daily maximum temperature (Tmax) exceeding 30 °C. This threshold is adopted from the India Meteorological Department (IMD), making it a locally relevant and policy-aligned indicator for monitoring moderate heat stress. It provides a clear, interpretable metric for assessing prolonged warm conditions that are critical for sectors like agriculture, public health, and energy planning. A Multi-Model Ensemble (MME) approach, using an ensemble of five best-performing CORDEX-SA experiments, was utilized to analyze projected summer days in India. Different non-parametric trend analysis techniques were employed to investigate spatial and temporal changes, and Reliability Ensemble Averaging (REA) was applied for uncertainty analysis to ensure robust projections.
Climate change has emerged as one of the most pressing issues of our time [
1], significantly impacting global and regional temperature patterns, precipitation regimes, and the occurrence of extreme weather events [
2,
3]. Over the past few decades, several studies have documented the wide-ranging consequences of climate change, emphasizing the importance of understanding its impacts at both the global and local scales [
4,
5,
6]. Specifically, regional temperature patterns and changes in extreme temperature events, such as heatwaves and cold spells, are crucial for assessing the risks associated with climate change, particularly for a densely populated and climate-sensitive country like India [
7].
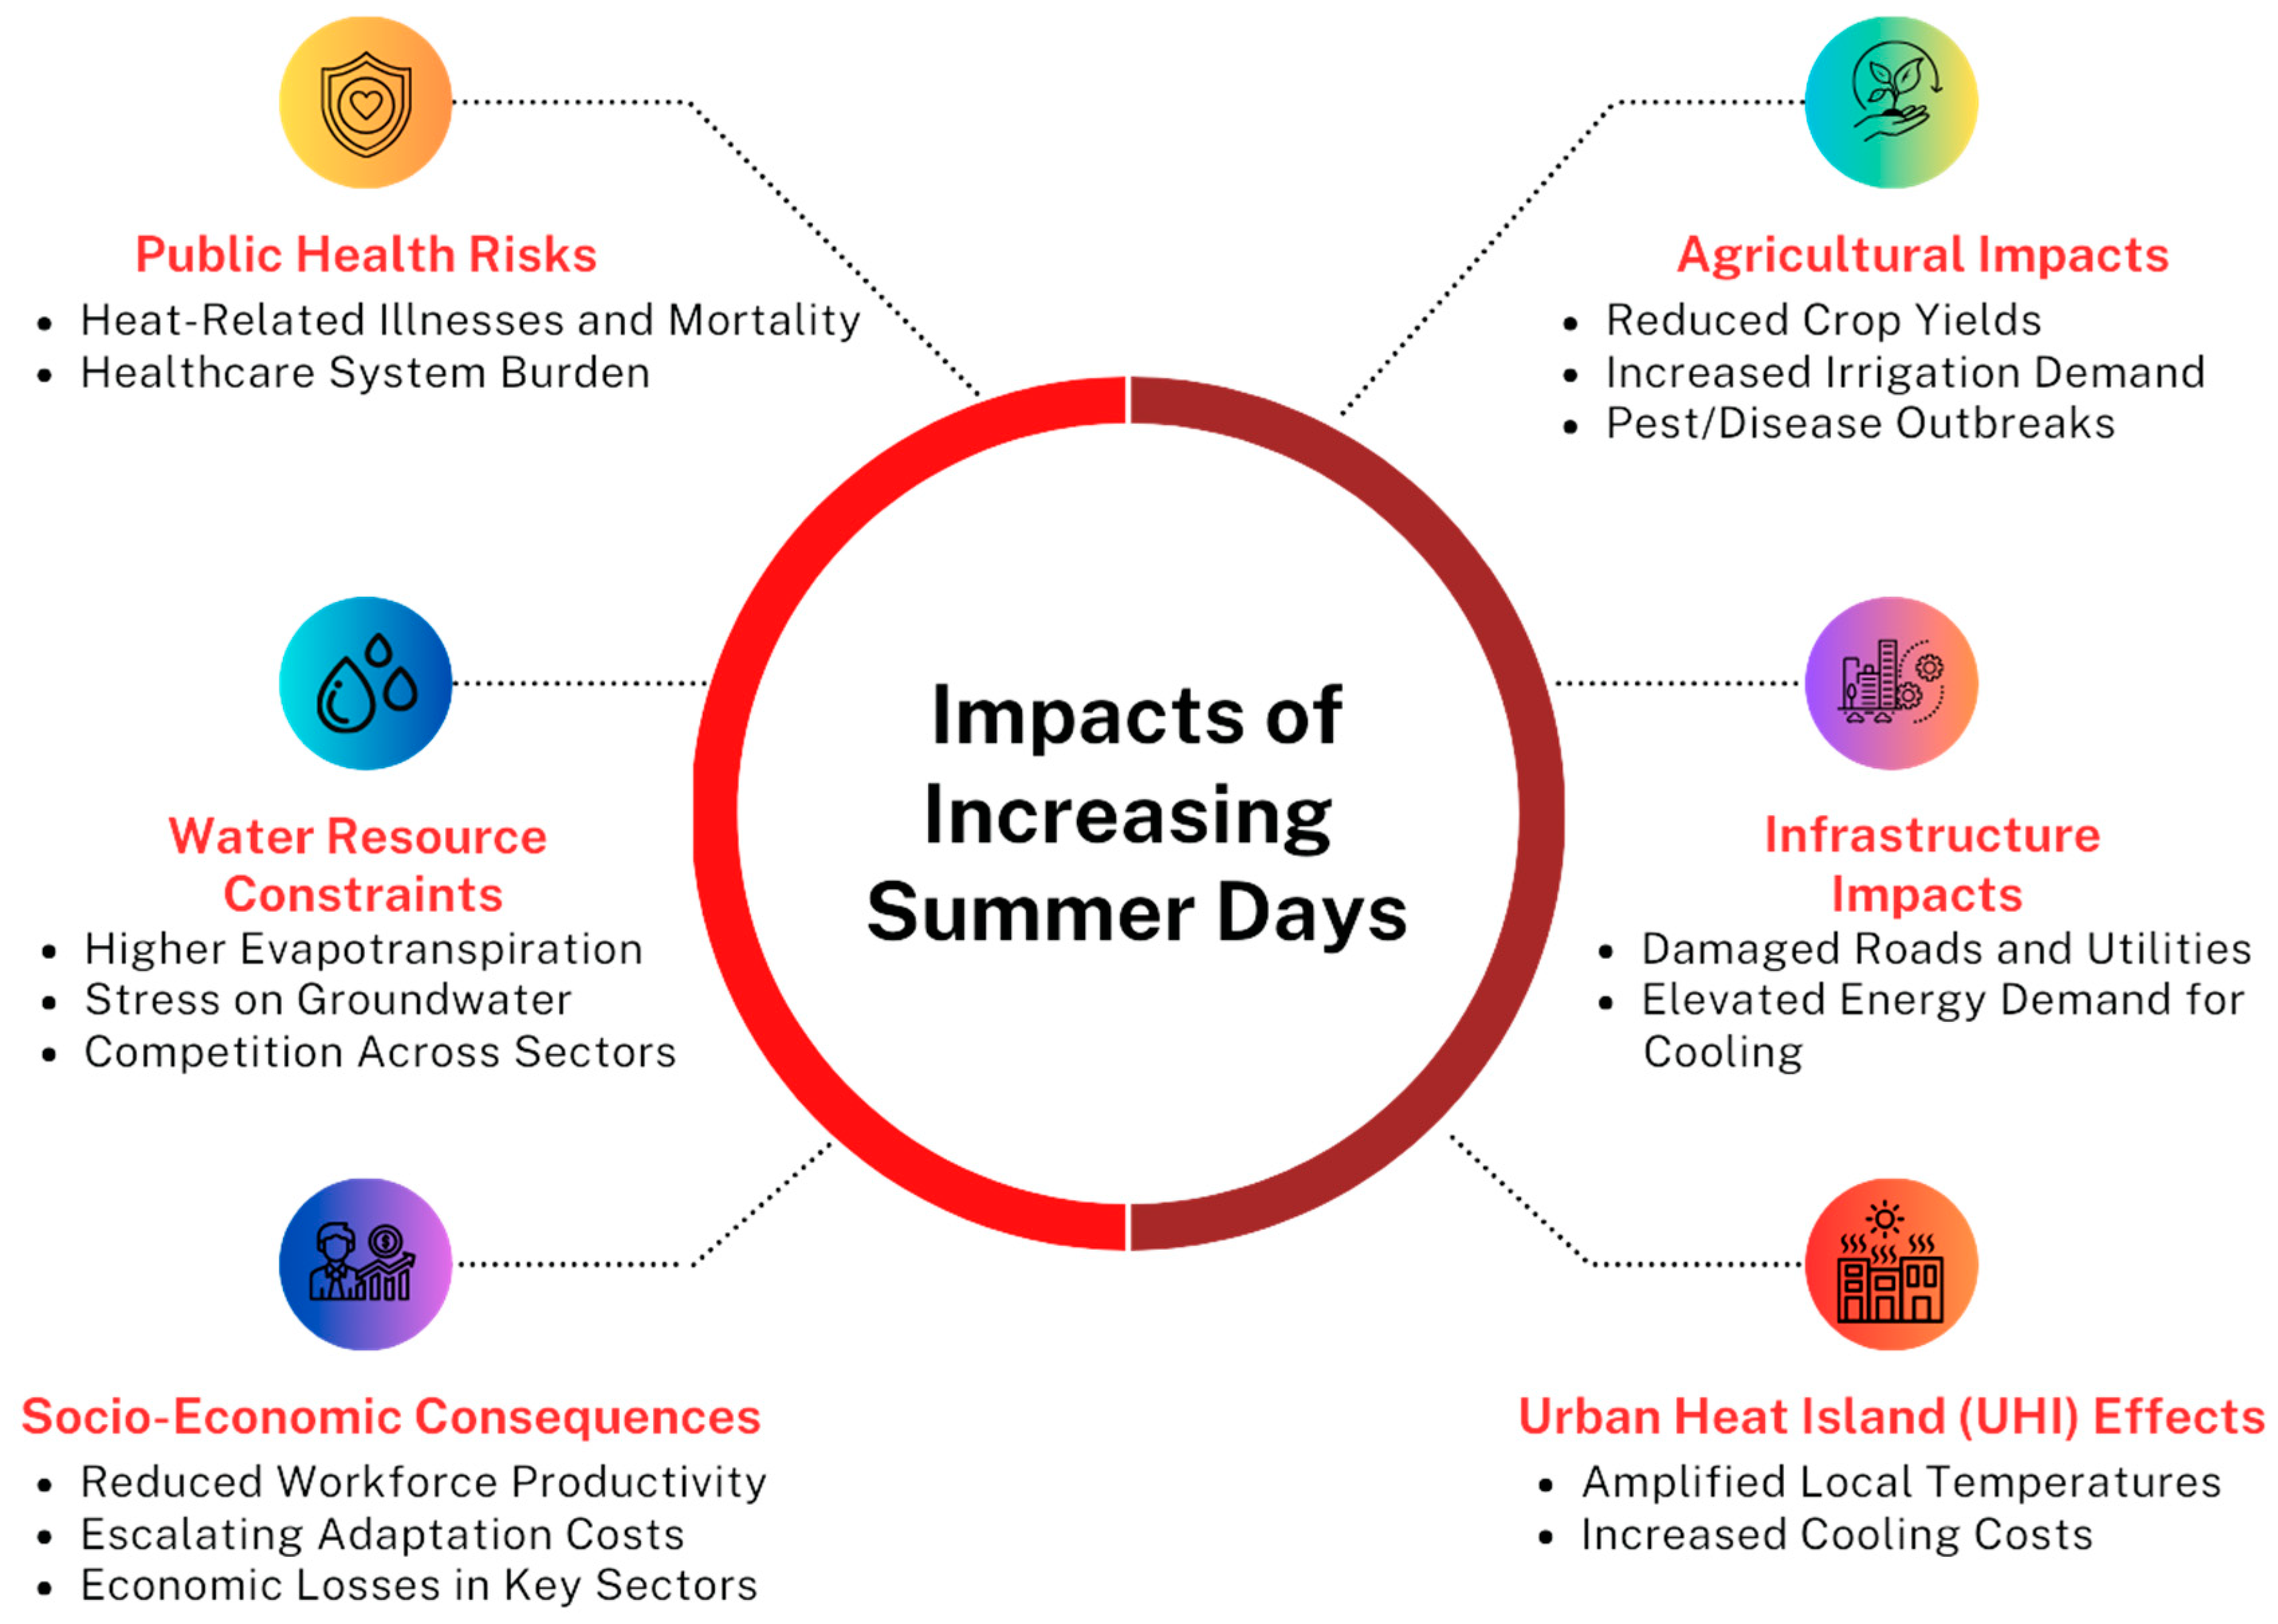
With global temperatures on the rise, the frequency and duration of summer days are expected to increase, amplifying vulnerabilities across India’s critical sectors.
Figure 1 shows the multidimensional impacts of rising summer days on public health, agriculture, infrastructure, water resources, and urban environments. These impacts include increased heat-related illnesses and mortality, decreased crop productivity, elevated irrigation demands, and intensification of the urban heat island (UHI) effect. The projected escalation in summer days poses a direct threat to climate-sensitive populations, ecosystems, and economic stability, necessitating urgent region-specific adaptation strategies.
In recent years, downscaling experiments such as the Coordinated Regional Climate Downscaling Experiment for South Asia (CORDEX-SA) have provided significant insights into regional climate change projections [
11]. The CORDEX-SA simulations have been instrumental in delivering high-resolution climate projections that can be used to assess the impacts of climate change at the regional level [
12]. Singh and Patwardhan (2012) observed an increasing trend in extreme weather events like floods and heatwaves across India, emphasizing the importance of robust data collection and research to address these challenges [
13]. Lastly, Paul and Maity (2023) analyzed climate extremes in Northeast India and Bangladesh, predicting substantial temperature increases and more frequent heavy precipitation days by the century’s end under high-emission scenarios, underscoring the necessity for regional planning to mitigate impacts on agriculture and water resources [
14]. Understanding the behaviour of summer days under different warming scenarios is crucial, as such information can guide adaptation strategies in agriculture, water resource management, and public health [
15,
16]. In their respective studies, Yaduvanshi et al. (2019) analyzed the impact of 1.5 °C and 2 °C global warming on regional temperature and rainfall across India, noting significant increases in rainfall, especially in northeastern and southern regions, and greater temperature rises in northern states [
17]. Maharana (2024) projected an increase in rainfall for Odisha, predicting more frequent and intense rainfall events that could extend the rainy season and heighten flood and drought risks [
18]. Li et al. (2022) focused on global maize production under similar warming scenarios, forecasting a significant yield reduction, especially under the 2 °C scenario, with associated economic impacts [
19]. Bai et al. (2023) explored how land use and meteorological changes under different climate scenarios could affect regional climates, such as in Zhengzhou, China, revealing that such changes could substantially alter temperature and precipitation patterns [
20]. Huang et al. (2017) investigated the impacts of global warming on different types of droughts in the U.S., forecasting an increase in agricultural and hydrological droughts with rising global temperatures [
21]. Chauhan et al. (2022) studied rainfall variability in Haryana from 1901 to 2020, noting significant spatio-temporal differences and trends suggesting climate-induced changes in rainfall patterns [
22]. T, AchutaRao, and Sagar (2023) projected an intensification and prolongation of heatwaves in India under 1.5 °C and 2.0 °C warming scenarios, highlighting the enhanced health risks during the humid monsoon season and the need for advanced adaptation strategies [
23]. Despite significant research on global warming impacts, a detailed understanding of the spatio-temporal variations of extreme temperature events like summer days across India’s diverse climatic zones remains limited. Existing studies often do not provide sufficiently localized data to effectively guide adaptation strategies for heat-related health risks and agricultural productivity. Additionally, there is a lack of integration between climatic impact assessments and socio-economic factors, which is crucial for addressing potential risks to agriculture, health, and infrastructure effectively. This gap impedes the formulation of comprehensive, region-specific climate resilience strategies essential for India’s climate-sensitive sectors.
This study aims to contribute to a more comprehensive understanding of future climate risks in India, aiding policymakers and stakeholders in their climate resilience efforts.
The primary objective of this study is to assess the spatio-temporal variations in summer days across India under different warming targets (1.5 °C, 2 °C, 3 °C, etc.) and emission scenarios (RCP4.5 and RCP8.5). This is highly significant, as it addresses the regional climate impacts that are essential for understanding the potential risks to agriculture, health, and infrastructure. Given India’s socio-economic reliance on climate-sensitive sectors, understanding how summer days might evolve under global warming helps in creating informed, adaptive strategies to protect vulnerable populations and ensure sustainability in critical sectors.
This study’s novelty lies in its focus on summer days as a key indicator of heat stress and its use of Reliability Ensemble Averaging (REA) to enhance projection accuracy. Unlike prior research, which often focuses on broader climate impacts, this work emphasizes the effects of prolonged moderately high temperatures, providing crucial insights into regional heat stress and socio-economic consequences. The REA approach reduces uncertainties more effectively than traditional ensemble methods by weighting models based on historical performance, resulting in more reliable climate projections.
The significance of this work lies in its contribution to region-specific adaptation strategies for mitigating the impacts of increased summer days. By providing detailed and reliable projections, this study helps inform policymakers and stakeholders about potential risks, enabling better planning for public health, agriculture, and socio-economic stability in India.
2. Materials and Methods
2.1. Indian Warming Targets (IWTs) and Climate Models
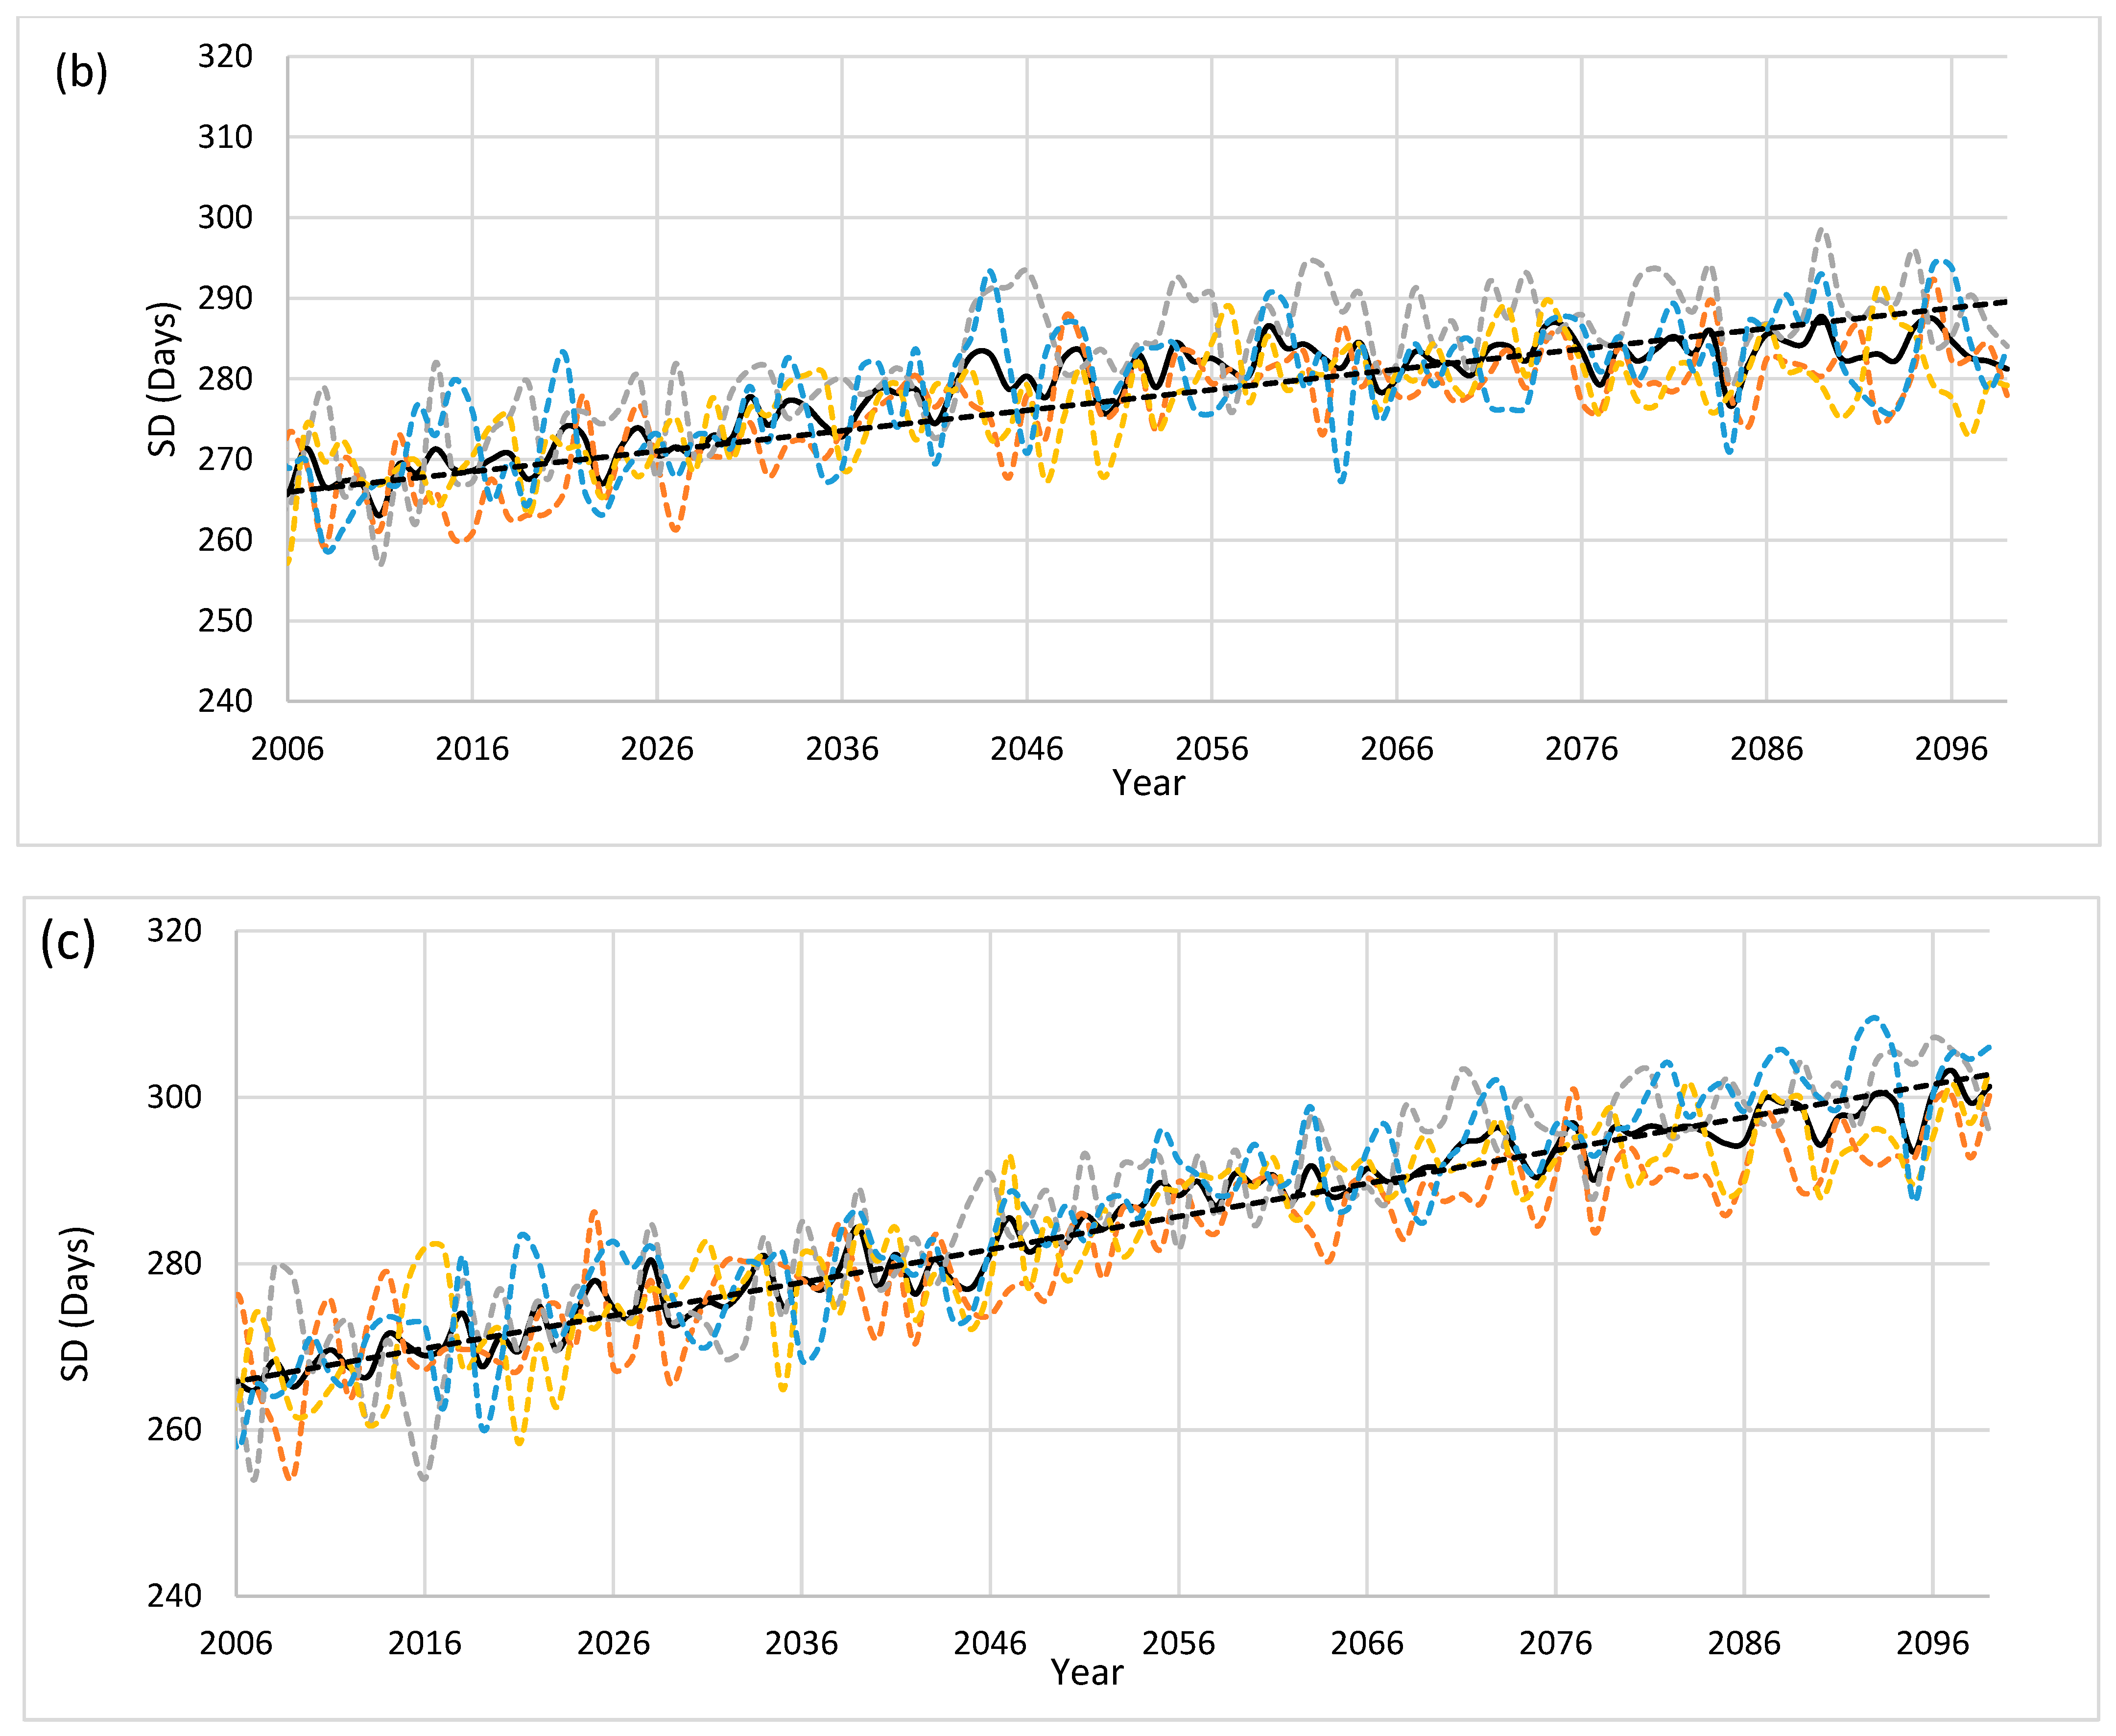
This study evaluates the impacts of temperature rise on summer days across India, utilizing multiple CORDEX-SA (Coordinated Regional Climate Downscaling Experiment for South Asia) experiments under two representative emission scenarios, RCP4.5 and RCP8.5. The RCP4.5 represents the current emission scenario, and RCP8.5 is an extreme/high emission scenario. These scenarios are most widely used in regional climate change studies. There is another scenario RCP2.6, but it is not included in this study because it is an extremely ambitious mitigation scenario that requires negative emissions. The current emissions trajectories make it increasingly implausible. So, only RCP4.5 AND RCP8.5 scenarios are used in this study. Climate models are crucial for predicting future climate scenarios and understanding complex climate interactions and variability. The CORDEX-SA experiments provide high-resolution (~50 km) regional climate projections, which are essential for assessing the impacts of climate change at a regional level. All experiments were originally available at a horizontal resolution of approximately 0.44° (~50 km). To ensure consistency in spatial analysis, we conducted spatial homogenization by interpolating all model outputs onto a common regular grid using Climate Data Operators (CDO). This step allowed for uniform spatial comparison across the Indian domain.
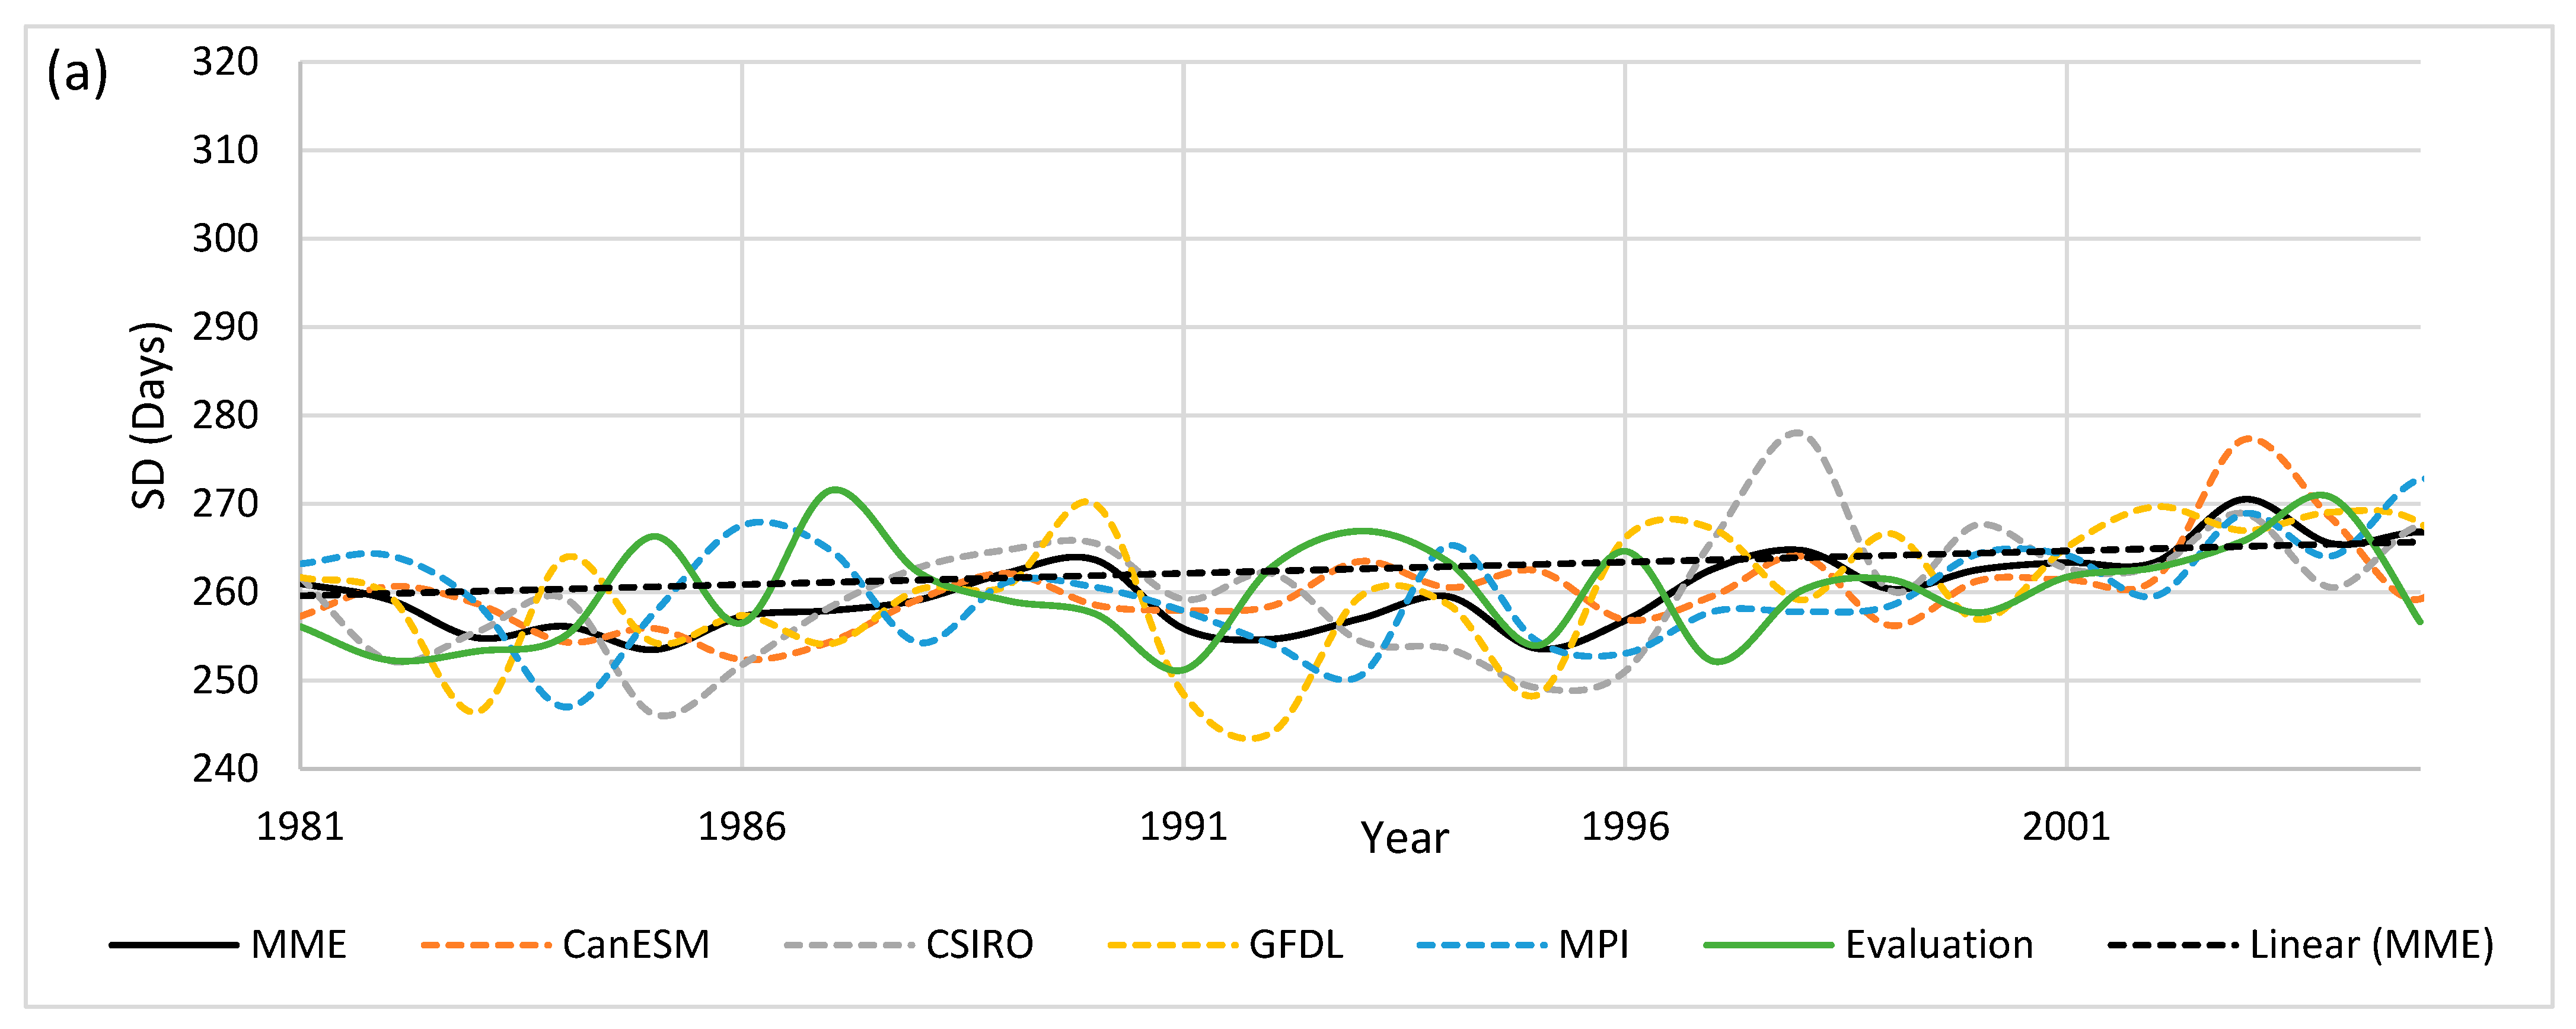
The selection of CORDEX-SA models was based on several criteria to ensure the robustness and reliability of the projections. The primary criteria included the ability of models to replicate historical climate patterns accurately, mainly focusing on maximum temperature data from 1981 to 2005. Model outputs were compared against observed data from the India Meteorological Department (IMD). Models demonstrating high correlation and minimal deviation from observed data were prioritized.
In addition, the spatial resolution and completeness of the models were also considered. Models with higher spatial resolution and comprehensive temporal coverage over the Indian subcontinent were prioritized to ensure an effective representation of climate variability across different regions. Another critical criterion was the physical consistency of the models, specifically, their ability to simulate known climatic processes across the diverse climatic zones of India, including the onset, withdrawal, and distribution of the monsoon, which significantly influences temperature extremes in India.
Table 1 presents the details of the CORDEX-SA experiments analyzed in this study. Each experiment consisted of a Regional Climate Model (RCM) driven by a corresponding Coupled Model Intercomparison Project Phase 5 (CMIP5) Global Climate Model (GCM).
The selected models underwent rigorous validation to assess their reliability in capturing climate variability at regional scales. This validation involved statistical cross-validation techniques, where historical data were divided into training and validation sets to test the predictive accuracy of each model. Key performance metrics included Pearson correlation coefficients, root mean square error (RMSE), and mean bias. The Pearson correlation coefficient was used to evaluate the linear relationship between model outputs and observed data, while RMSE assessed the average magnitude of errors, and mean bias represented the average difference between predicted and observed values. These metrics were essential for determining each model’s capability to capture both the mean state and variability of historical climate conditions.
Based on their superior performance in reproducing historical climate patterns—particularly, maximum temperature trends, seasonal consistency, and low statistical bias—five CORDEX-SA experiments were selected for Multi-Model Ensemble (MME) analysis. These top-performing models, along with their evaluation criteria, are summarized in
Table 2. To evaluate climate impacts under progressive warming, the concept of Indian Warming Targets (IWTs) was adopted, referring to global mean surface temperature increases of 1.5 °C, 2.0 °C, 2.5 °C, 3.0 °C, 3.5 °C, 4.0 °C, 4.5 °C, and 5.0 °C above pre-industrial levels. These warming thresholds were linked to model outputs through the calculation of Threshold Crossing Times (TCTs), which represent the period when the 21-year moving average of annual mean temperature exceeds a specific warming level relative to the baseline (1981–2005).
Once the TCT was determined for each IWT level, the corresponding 30-year climate window centered around the TCT was used to extract model data and analyze summer day projections. This method ensures that the climate indicators are evaluated relative to warming intensity, rather than fixed time periods, enabling a more policy-relevant, temperature-aligned analysis of climate risks. To link the IWTs with model outputs, we adopted a temperature-aligned analysis approach. For each CORDEX-SA experiment, the time series of annual mean surface air temperature was smoothed using a 21-year moving average. The year when this smoothed average first crossed a specific IWT level (e.g., 1.5 °C, 2 °C, etc.) relative to the baseline (1981–2005) was defined as the Threshold Crossing Time (TCT). A centered 30-year window around each TCT was then selected to extract model data for that particular warming level. This methodology ensures that climate indicators such as summer days are evaluated not by fixed time periods (e.g., mid-century), but by warming intensity, which offers a more policy-relevant, impact-aligned assessment framework.
2.2. Bias Correction and Model Performance Evaluation
Due to inherent biases in climate models, a delta bias correction approach was applied to align model outputs with observed historical data more closely, thus enhancing the reliability of future climate projections. The bias correction process began with bias detection, where model outputs from the historical period (1981–2005) were compared against observational data. The bias was calculated using the formula:
where
represents the predicted values,
represents the observed values, and
is the number of data points.
Once the bias was detected, the delta correction approach involved subtracting the calculated bias (delta) from the model’s projected values for future scenarios. This ensured that the corrected model output was aligned more closely with historical observations, providing more reliable projections.
To validate the effectiveness of the bias correction, corrected model outputs were compared against independent datasets not used in the bias detection process. This comparison was critical to confirm that the bias correction resulted in outputs that more accurately represented actual climatic conditions.
After bias correction, the Model Performance Index (MPI) was used to evaluate and rank the models based on their improved accuracy. MPI was calculated using multiple statistical metrics, such as Pearson correlation, RMSE, and bias.
Table 3 provides the formulas used to calculate these metrics, which were used to assess the performance of each model.
The MPI score for each model was computed, and the models were ranked accordingly. The top-performing models were then selected for the analysis of future climate projections. The MME was calculated after using the five best-performing CORDEX-SA experiments for Indian region. The MME ensemble was calculated as average of CORDEX-SA experiment data.
2.3. Analysis of Extreme Temperature Indices (ETIs)
A detailed spatial and temporal analysis of summer days (SU) was conducted using the best-performing, bias-corrected models under RCP4.5 and RCP8.5 scenarios. As per the Indian Meteorological Department (IMD) climate indices, a “summer day” is defined as a day when the daily maximum temperature exceeds 30 °C. This threshold was used to identify summer days across India.
Although the SU index considers only maximum temperature thresholds, it remains one of the most policy-relevant and widely understood metrics in climate risk assessments. It directly reflects human exposure to prolonged heat, and indirectly captures heat stress impacts across agriculture, urban infrastructure, and public health sectors. While alternative indices—such as apparent temperature or the heat index—may better represent the combined effects of temperature and humidity, reliable humidity projections at the regional scale remain limited under current CORDEX-SA outputs. Therefore, SU serves as a consistent, data-driven, and actionable proxy for assessing rising heat stress conditions in India.
The analysis focused on evaluating the variation in the frequency of summer days across India and their temporal evolution under different Indian Warming Targets (IWTs). Additionally, the Threshold Crossing Time (TCT) was analyzed to determine when specific warming thresholds were exceeded across the study area.
While it is acknowledged that the SU index alone does not fully capture the multidimensional nature of heat stress—particularly the role of relative humidity—this study prioritizes SU due to its standardized definition, strong policy relevance, and consistent availability across CORDEX-SA outputs. Humidity-based indices such as the Heat Index (HI) or Wet Bulb Temperature (WBT) require high-resolution humidity data, which is not currently available at the required temporal and spatial resolution. Future studies may build upon this work by incorporating such indices as more reliable regional datasets become available.
2.4. Reliability Ensemble Averaging (REA) for Uncertainty Analysis
To quantify and reduce uncertainty in model projections, the Reliability Ensemble Averaging (REA) method was applied. REA provides a mechanism for combining results from different models while assigning weights to each model based on its performance and convergence with observational data. The REA weight (
) for each model
is calculated using the formula:
where
epresents the model’s uncertainty. By applying the REA method, the uncertainties in ensemble projections were minimized, resulting in more robust and reliable climate forecasts for summer days across India under different IWTs.
This comprehensive methodology provides transparency in model selection, bias correction, and validation, ensuring that the resulting projections are both robust and reliable. By addressing the reviewers’ concerns, this detailed explanation demonstrates the strength of the model selection, validation, and bias correction processes used in this study.
4. Discussion
The findings of this study provide critical insights into the increasing frequency of summer days across India under different warming scenarios, highlighting significant spatial and temporal variations. Regions such as North-Central and North-East India are projected to see the largest increases, while coastal areas are expected to experience consistently high temperatures. This variation underscores the need for targeted adaptation measures, distinguishing this work from prior studies that often lacked detailed regional analysis. Additionally, different studies can show the different rate of warming due to utilization of different types of climate models at different resolution. So, the regional impact can be different than the mean warming of the country or globe. The regional warming rates are also different for different regions of country due to the combined effects of seasonal aerosol loading and intensive irrigation practices in such regions.
The projected increase in summer days varies significantly across regions, with some areas facing disproportionately higher risks. For example, parts of North-Central India, including eastern Uttar Pradesh and Bihar, are projected to experience an increase of over 50 summer days under a 4 °C warming scenario. These regions are not only densely populated, but also highly dependent on subsistence agriculture, increasing their vulnerability to heat-related crop failures and water stress.
In the Northeast, states like Assam and Meghalaya show a rising trend in summer days. When combined with high ambient humidity, even moderate temperature increases can elevate the risk of heat-related illnesses, especially among vulnerable populations. Meanwhile, urbanized regions of western India, including Delhi and Jaipur, are already impacted by the Urban Heat Island (UHI) effect, which is likely to intensify with the rise in Summer Days. This will exert added pressure on energy demand, cooling infrastructure, and public health systems.
These spatially differentiated patterns emphasize the urgency of implementing region-specific adaptation strategies that account for localized vulnerabilities and socio-economic dependencies.
These findings demonstrate that rising Summer Days are not just a linear function of time, but are strongly correlated with warming thresholds. By aligning the analysis with Indian Warming Targets (IWTs), this study provides an impact-oriented framework that is more intuitive and useful for policy planning. For example, the projected increase of 25–35 SU days under 2.5 °C warming in parts of North-Central India implies a near one-month extension of heat-related stress, which would substantially affect cropping cycles, increase water demand, and amplify public health burdens. Similarly, crossing the 4.5 °C threshold could mean over 80 additional SU days in the Northeast, stressing already fragile ecosystems and infrastructure. This temperature-aligned assessment helps align India’s Nationally Determined Contributions (NDCs) and climate adaptation plans with scientifically grounded heat risk trajectories.
4.1. Broader Implications and Connection to Previous Studies
The observed rise in summer days is consistent with earlier research that identified an upward trend in extreme temperature events across South Asia. Unlike prior studies that focused on extreme heat or general temperature increases, this study explicitly examines summer days, providing a nuanced understanding of heat stress and its socio-economic impacts. The use of non-parametric statistical methods, such as the Mann–Kendall and Sen’s Slope Estimator, revealed significant trends in summer days, especially under the RCP8.5 scenario, emphasizing the growing risks associated with unchecked emissions.
The use of Reliability Ensemble Averaging (REA) further differentiates this research by ensuring robust projections with minimized uncertainties, unlike traditional ensemble averaging. This advanced approach provides a more accurate representation of future conditions, offering a valuable tool for effective climate adaptation planning.
4.2. Region-Specific Impacts and Adaptation Strategies
The summer days are going to have verse impacts in India in each field. Summer in India brings extreme heatwaves, leading to severe health risks. Prolonged exposure to high temperatures causes dehydration, heat exhaustion, and heatstroke, which can be fatal, especially for the elderly and children [
24]. The Urban Heat Island (UHI) effect worsens conditions in cities, where concrete structures trap heat. The agricultural sector also suffers significantly during the Indian summer season. High temperatures and erratic rainfall reduce crop yields, particularly for wheat, pulses, and vegetables, leading to food inflation and farmer distress. Drought-like conditions force farmers to rely on expensive irrigation, increasing production costs. If the Summer Day will continue to increase, the livestock will also face heat stress and reduced milk production, which impacts rural incomes [
8]. Water shortages become critical during peak summer months. Rivers, lakes, and groundwater levels deplete, leading to severe droughts in states like Maharashtra, Rajasthan, and Tamil Nadu. Major cities, including Chennai, Bengaluru, and Delhi, experience acute water crises, with tankers becoming the primary water source in some areas [
9]. The rising Summer Days will lengthen the summer season so the demand for electricity soars as people rely heavily on-air conditioners, coolers, and fans, leading to frequent power cuts and load shedding. Overburdened power grids struggle to meet consumption needs, affecting households and industries. Extreme heat also damages infrastructure: roads melt, railway tracks expand, and buildings develop cracks due to thermal stress. Summer heat also triggers forest fires, especially in Himalayan regions and dry deciduous forests, destroying wildlife habitats. The Himalayan glaciers melt at an accelerated rate, threatening long-term water security for northern India. Additionally, rising temperatures affect marine life, causing coral bleaching and disrupting aquatic ecosystems. To cope with extreme heat, daily routines shift schools and offices adjust timings, and outdoor activities reduce. To combat these impacts, India is adopting measures like Heat Action Plans (HAPs) in cities, which include early warning systems, cooling shelters, and public awareness campaigns. Afforestation and urban greening help reduce the heat island effect. Government policies, such as subsidies for farmers and workers, aim to ease economic burdens [
10].
The regional disparities in the projected increase in summer days necessitate targeted adaptation strategies. Public health measures, including Heat Action Plans (HAPs), cooling centers, and early warning systems, are particularly crucial for North-Central and North-East India, which are projected to see the highest temperature increases. Similarly, promoting heat-resilient crops and efficient water management practices is essential to sustain agriculture in these regions.
In urban areas along the East and West coasts, urban heat mitigation strategies—such as increasing green spaces, implementing cool roofing, and enhancing reflective surfaces—are necessary to combat the urban heat island effect. Strengthening energy infrastructure, including promoting energy-efficient cooling systems, is also crucial to managing the increased demand for cooling in urban regions.
4.3. Uncertainty Analysis and Policy Implications
The use of REA in this study demonstrates the value of reducing uncertainties by weighting models based on their historical performance, resulting in more reliable climate projections. Policymakers can utilize these reliable projections to formulate targeted adaptation strategies that address the unique vulnerabilities of different regions in India. Tailored interventions are needed to protect agriculture, public health, and urban infrastructure from the growing risks associated with rising Summer Days.
This study underscores the need for proactive, region-specific measures to enhance climate resilience in India, while also challenging common misconceptions about resilience—especially those embedded in formal and nonformal education systems [
25,
26]. By linking scientific projections with actionable adaptation strategies, it contributes to more effective responses to global warming and potential economic restructuring [
27].
5. Conclusions
This study presents a comprehensive spatio-temporal assessment of Summer Days across India under varying Indian Warming Targets (IWTs), using multi-model ensembles from CORDEX-SA under RCP4.5 and RCP8.5 scenarios. The findings indicate that increasing global temperatures will significantly alter the frequency and spatial distribution of Summer Days, with notable regional variations. North-Central and North-East India are projected to experience the largest increases in summer days, while the East and West coastal regions are likely to sustain persistently high temperatures throughout the year.
The analysis, based on robust non-parametric statistical methods such as the Mann–Kendall test, Modified Mann–Kendall test, Sen’s Slope Estimator, and Pettitt–Mann–Whitney test, reveals a statistically significant rise in summer days across all scenarios, with accelerated trends under higher warming targets in the RCP8.5 scenario. The results underscore the heightened risks posed by regional warming, even as global climate policies target a 2 °C threshold. This study also employs the Reliability Ensemble Averaging (REA) technique to quantify uncertainty, highlighting the necessity of combining multiple model simulations for precise regional climate impact assessments.
The projected increase in the frequency of summer days necessitates targeted region-specific adaptation strategies to mitigate adverse impacts. For North-Central and North-East India, where the increase in summer days is most pronounced, public health interventions such as Heat Action Plans (HAPs), community cooling centers, and early warning systems are essential to minimize heat-related health risks, particularly for vulnerable populations.
In the agricultural sector, the adoption of heat-resilient crop varieties and improved water management practices is critical to maintaining productivity in regions facing intensified heat stress. Practices such as drip irrigation and rainwater harvesting should be prioritized to address increased evapotranspiration and ensure water availability during prolonged heat periods. Urban areas, particularly along the East and West coasts, must implement measures to combat the urban heat island effect [
28], including urban afforestation, the use of cool roofing materials, and reflective pavements to reduce localized temperature extremes [
29]. Enhancing green infrastructure and increasing urban canopy coverage can further improve thermal comfort in cities [
30]. Additionally, the rising demand for cooling will stress energy systems, necessitating investments in energy-efficient cooling technologies, renewable energy solutions [
31], and robust grid infrastructure to ensure reliability during peak demand periods [
32].
These region-specific recommendations provide actionable guidance for policymakers and stakeholders to address the multifaceted risks associated with rising temperatures [
33]. Proactive adaptation measures tailored to the unique vulnerabilities of different regions are essential to safeguard public health, sustain agricultural productivity, and enhance urban livability and energy resilience [
33]. The insights from this study underscore the importance of building regional and local climate resilience to mitigate the escalating challenges posed by global climate change, thereby supporting sustainable development goals.


 ,
, 
